New Journal of Student Research Abstracts 2007
184
-
Upload
alvalyn-creative -
Category
Documents
-
view
253 -
download
1
description
An annual journal of student science projects by middle and high school students. Designed by Alvalyn Lundgren. Published by California State University, Northridge. Edited by Dr. Steven Oppenheimer.
Transcript of New Journal of Student Research Abstracts 2007


New Journal of
Published by Van Nuys Airport and California State University, Northridge
Editor
Steven B. OppenheimerCalifornia State University, Northridge
Sponsor
Van Nuys Airport
2nd Place Winner: Aviation Education and Tour Programs
Airports Council International - North America (ACI-NA)
2007 Excellence in Marketing and Communications Contest
Volume XII
VNY_SciJrnl_interior 9/14/12 10:24 AM Page 1

Copyright ©2007 by Van Nuys Airport and California State University, Northridge.
All rights reserved.
Permission in writing must be obtained from Van Nuys Airport and California StateUniversity, Northridge, before any part of this work may be reproduced or transmit-ted in any form or by any means, electronic or mechanical, including photocopy-ing and recording, or by any informational storage or retrieval system.
Printed in the United States of America
Library of Congress: ISSN 1558-7932
Please visit Van Nuys Airport’s website at www.lawa.org/vny
Staff
Editor-In-ChiefSteven B. Oppenheimer, Ph.D., Director, Center forCancer and Developmental Biology and TrusteesOutstanding Professor, the CSU System, California StateUniversity, Northridge.
Primary Associate EditorHelen Chun, Ph.D., Assistant Professor, BiologyDepartment, California State University, Dominguez Hills.
Associate EditorsParthenia Hosch, Administrative Analyst, California StateUniversity, Northridge. Mindy Berman, Mindy F. Berman Communications.
SponsorVan Nuys Airport (VNY) – the world’s busiest generalaviation airport, owned and operated by Los AngelesWorld Airports – continues its sponsorship of the New Journal of Student Research Abstracts with this 2007 edition.
VNY ContributorsSelena Birk, Airport Manager; Stacy Geere, FormerPublic and Community Relations Director; DianaSanchez, Current Public and Community RelationsDirector; Jay Berkowitz, Photographer; Carrie De Maio,Tour Guide; Ashley Gomez, Student Assistant; EricMichaels, Student Assistant. Journal design: AlvalynLundgren, Alvalyn Creative. Additional journal develop-ment support: Mindy F. Berman Communications.
California State University, Northridge SupportJolene Koester, President; Harry Hellenbrand, Provost;Jerry Luedders, Vice Provost; Mack Johnson, AssociateVice President; Jerry Stinner, Dean, College of Scienceand Mathematics; Larry Allen, Chair, BiologyDepartment; Carmen Chandler, John Chandler, BrendaRoberts and Randal Thomson, Public Relations; JohnPepitone, College Development; Judy Nutter,Community Relations; Judy Knudson, UniversityDevelopment; Scott Perez, Research Support; HedyCarpenter, Symposium Support; Vicki Pedone andKavoos Blourtchi, College Support; William Krohmer,Linda Gharakhanian, Vickie Everhart and CherieHawthorne, Department Support.
Los Angeles Unified School District CollaborationDr. Todd Ullah, Director of Science; Dan McDonnell,Science Advisor; Don Kawano, Science Advisor; AngelaOkwo, Science Advisor.
Teacher Training SupportMaria Lopez Freeman, California Science Project; KarenHumphrey and Linda Barton White, Improving TeacherQuality Program; Gerry Simila, Gini Vandergon, NormHerr and Steven Oppenheimer, Training Leaders.
Recognition of Some of the Scientist MentorsLarry Allen, Ph.D.; Lisa Banner, Ph.D.; Larry Baresi, Ph.D.;Edward Carroll, Ph.D.; Randy Cohen, Ph.D.; John Colicelli,Ph.D.; Mary Corcoran, Ph.D.; Cathy Coyle-Thompson,Ph.D.; Steve Dudgeon, Ph.D.; Robert Espinoza, Ph.D.;Richard Flagan, Ph.D.; Janet Kübler, Ph.D.; Jennifer Matos,Ph.D.; Aida Metzenberg, Ph.D.; Stan Metzenberg, Ph.D.;Steven Oppenheimer, Ph.D.; Polly Schiffman, Ph.D.;Ryoichi Seki, Ph.D.; Gerry Simila, Ph.D.; Mary Lee Sparling,Ph.D.; Mike Summers, Ph.D.; Paul Tomasek, Ph.D.; VirginiaVandergon, Ph.D.; Paul Wilson, Ph.D.; Maria Elena Zavala,Ph.D.; Peter Weigand, Ph.D.; George Dunne, Ph.D.; KathieMarsaglia, Ph.D.; Vicki Pedone, Ph.D.; Greg Grether, Ph.D.;David Epel, Ph.D. (evaluation); Susie Hakansson, Ph.D.
Van Nuys Airport & California State University, Northridge
VNY_SciJrnl_interior 9/14/12 10:24 AM Page 2

An Annual Journal for Young Investigators and Their Teachers
About the Editor
Steven B. Oppenheimer received the Ph.D. degree fromJohns Hopkins University and is currently Professor of Biologyand Director of the Center for Cancer and DevelopmentalBiology at California State University, Northridge. He is authoror co-author, mostly with his Cal State students, of about 200publications, including 14 books and book editions; wasawarded over $7 million in research and science educationgrants serving as Principal Investigator; and served onNational Institutes of Health and National ScienceFoundation grant review panels. He serves on the editorialboard and is editor for the United States, Canada and SouthAmerica of the international journal ACTA Histochemica, pub-lished by Elsevier. He is recipient of 26 distinguished teach-ing awards, distinguished research awards, outstanding pro-fessor awards and other honors from local, statewide andnational organizations. In 1984, he was named statewideTrustees Outstanding Professor of the California StateUniversity system (the system’s highest honor), and in 1992he was elected Fellow of the American Association for theAdvancement of Science (AAAS). The AAAS defines a Fellowas “a member whose efforts on behalf of the advancementof science or its applications are scientifically or socially dis-tinguished.”
Editor’s e-mail address: [email protected].
About the Primary Associate Editor
Helen H. Chun received her Ph.D. and was a postdoctoralresearcher at the University of California, Los Angeles. Shecurrently is an Assistant Professor in the Biology Departmentat California State University, Dominguez Hills. She is aresearcher in the molecular biology of disease, specificallystudying ataxia-telangiectasia and systemic lupus erythe-matosus.
About the Sponsor
Owned and operated by Los Angeles World Airports, VanNuys Airport (VNY) ranks as the world’s busiest general avia-tion airport, averaging more than 400,000 takeoffs and land-ings annually. A facility dedicated to noncommercial air trav-el, VNY meets corporate, private and governmental aviationneeds – in the process providing vital aviation services,enhancing efficiency at the region’s commercial airports, cre-ating jobs, promoting business, and serving as a valued SanFernando Valley community resource.
As part of its community involvement, VNY supports a widearray of education programs, and offers tours, presentationsand other activities to help adults and youth alike learn aboutthe exciting world of aviation in the San Fernando Valley andbeyond. Website: www.lawa.org/vny.
New Journal of
Volume XII
From the Editor: Golden Opportunity for Underrepresented Science Students Interested in Careers in Biodmedical Research
To those underrepresented science students who select California State University, Northridge, for your college experience:We have a golden opportunity for you. If you are a U.S. citizen or permanent resident and if you are possibly interested in aPh.D. degree in biomedical science, you can apply for distinguished programs funded by the National Institutes of Health(Maria Elena Zavala, Director). These programs will open many doors for you and will pay you thousands of dollars to doresearch while a student at California State University, Northridge. For more information, contact Steven Oppenheimer [email protected].
3New Journal of Student Research Abstracts 2007
VNY_SciJrnl_interior 9/14/12 10:24 AM Page 3

About the Journal and Abstracts
The New Journal of Student Research Abstracts is published yearly in September by Van NuysAirport. Continued publication is always dependent on funding.
The journal is intended to serve as (1) a vehicle to honor young investigators and their teach-ers by showcasing their work, motivating them to continue their involvement in research science; (2) a sourcebook for both students and teachers who are looking for ideas for researchprojects, particularly in the areas of aviation and aerospace; and (3) a volume to disseminatestudent research discoveries.
Many abstracts included in the journal demonstrate good science, i.e. clear introductionsdescribing a hypothesis to be tested, appropriate methods and data analysis, results and conclusion statements, and — most important — sufficient numbers of appropriate control andexperimental samples and repetitions of experiments.
Although the journal editor deletes very poor abstracts from the publication, some abstractsherein are quite flawed. Some are idea abstracts, while some lack at least one component ofa good science experiment. Including some of these abstracts helps make this journal very useful for classes to learn what makes for a good experiment and for a good abstract vs. a not-so-good experiment and a not-so-good abstract.
Some of the abstracts are experimental plans instead of completed projects. This is especiallytrue in the case of long-term, sophisticated research programs that require extensive setup andplanning. The journal encourages abstracts on the planning and progress of such projects.
The journal editor continues to reserve the right not to publish those abstracts that are seriously flawed. The journal does not notify authors if their abstracts have been deleted.
Any opinions, findings and conclusions or recommendations are those of the individual authorsof the abstracts presented in the journal, and do not necessarily reflect the views of Van NuysAirport, California State University, Northridge, other contributing organizations and individuals,or the journal staff.
Submission of Abstracts
Any science teacher may submit student abstracts following the format used with theabstracts in this volume. After the title, followed by student author name(s) and teachername (teacher), school and school street address, city, state and ZIP Code, abstracts shouldbegin with the purpose of the study, followed by how it was done, and then the results andconclusions.
All abstracts should be typed in 11-point Arial font, error-free. Messy abstracts and those notfollowing proper format may be discarded. The journal is not responsible for any abstractsreceived or for publication errors. The journal does not acknowledge receipt of abstracts andnever guarantees that they will be published or that the journal will be published in anygiven year.
Only teachers may submit their students’ abstracts to the journal. Teachers should submiteach abstract in both hard copy and electronic format – via e-mail or on either a floppydisc or CD-ROM. (Note: If it is absolutely not possible to submit an abstract electronically,teachers should just submit it in hard copy format.)
Abstracts should be mailed along with a cover letter on school letterhead to Dr. StevenOppenheimer, Editor, New Journal of Student Research Abstracts, Center for Cancer andDevelopmental Biology, California State University, Northridge, 18111 Nordhoff St.,Northridge, CA 91330-8303. For those teachers using e-mail submittals, abstracts alsoshould be e-mailed to Dr. Oppenheimer at [email protected].
The deadline for receipt of abstracts for each annual volume is June 1, but an issue may beclosed at an earlier date. Publication is scheduled for each September. Submitted abstractsare not returned to authors, so students and teachers are advised to keep a copy of all submitted materials. The only confirmation that abstracts will be published is if they appearin print.
Van Nuys Airport (VNY), the sponsor of the journal, will distribute a complimentary copy ofthe journal to teachers whose students’ abstracts are published in that volume. VNY also willprovide copies of the journal to others upon request, while supplies last. To request a copy,contact VNY Public and Community Relations at (818) 909-3529.
Special Awards
Each year, Van Nuys Airport will providespecial recognition and awards – including a VIP tour of the airport – to the best published aviation- or aerospace-related abstract (as selected by the journal editor) in three categories:
elementary school (grades kindergarten through 5),
middle school (grades 6 through 8) and
high school (grades 9 through 12).
We look forward to seeing students’ outstanding research project submissions!
4 Van Nuys Airport & California State University, Northridge
VNY_SciJrnl_interior 9/14/12 10:24 AM Page 4
Volume XII Table of Contents
Letters From Los Angeles World Airports; California State University, Northridge; and Los Angeles Unified School District Officials 6
Testimonials: The Benefits of the Journal 9
Winners: Best Aviation/Aerospace Abstracts for 2007 11
Experience Aviation in Action at Van Nuys Airport 12
Explore the History of Van Nuys Airport: A Pioneering Legacy, A Soaring Future 13
Take Off Toward a Bright Future: Careers in Aviation 16
Aviation Research Project Ideas 22
How to Organize a Science Fair 24
How Do Airplanes Fly? 26
Vinny’s Hangout: Can You Solve the Puzzle? 28
Student Artwork 29
Abstracts 31
Student Abstract Index 176
Teacher and Mentor Index 178
Subject Index 180
New Journal of
5New Journal of Student Research Abstracts 2007
VNY_SciJrnl_interior 9/14/12 10:24 AM Page 5

6 Van Nuys Airport & California State University, Northridge
VNY_SciJrnl_interior 9/14/12 10:24 AM Page 6

7New Journal of Student Research Abstracts 2007
VNY_SciJrnl_interior 9/14/12 10:24 AM Page 7

8 Van Nuys Airport & California State University, Northridge
VNY_SciJrnl_interior 9/14/12 10:24 AM Page 8

9New Journal of Student Research Abstracts 2007
“The Magical World of Being a Real Scientist”
I would personally like to thank Van Nuys Airport and California State University, Northridge, for their tremendous support
of our community. Their kind efforts have supplied me with the most valuable tool of a teacher, a wonderful goal for my stu-
dents to achieve.
The New Journal of Student Research Abstracts has allowed my students to discover an enthusiasm for math and science.
It has swept them up into the magical world of being a real scientist and solving real-life problems. They delve into their
experiments using the scientific method and technologies available to them, hardly realizing the time and effort they have
been placing in their work. Their abilities to think logically and write drastically improve as they do their experiments and
write their abstracts. This gives them the feeling of accomplishment, thus improving the confidence they have in themselves.
It has been a pleasure to be part of this fine program and I encourage other teachers to join us in changing the lives of their
students by showing them the future in science.
Terri Miller, Science Teacher
Holmes International Middle School
Northridge, CA
“A Great Opportunity for the Students”
Several of my (former) students at Robert Fulton College Preparatory School have published their work in this journal.
Getting their science experiment published gives the students a boost. They can identify themselves with the great scientists
who are sending people to the moon or the scientists working on the cure for AIDS. I think it is a great opportunity for the
students. Please continue to support the minds of the scientists of tomorrow, by supporting the publication of this journal.
Nandita Pal
Arcadia High School
Arcadia, CA
Testimonials:
The Benefits of the Journal
“Recognition for Their Work”
The New Journal of Student Research Abstracts has become an important part of the seventh-grade experience for our
School for Advanced Studies students. It has provided recognition for their work, giving meaning to their classwork and the
science standards we are teaching them. The focus in our public schools has been so narrow for the last several years with
an emphasis on mathematics and language arts, and therefore it is great to see an activity that can help generate interest
in the sciences. I hope that our students will continue to have this opportunity offered to them and thank you for your efforts.
Felicia Drew, Assistant Principal
Holmes International Middle School
Northridge, CA
VNY_SciJrnl_interior 9/14/12 10:24 AM Page 9

10 Van Nuys Airport & California State University, Northridge
“Hooked on Science”
Please accept my most sincere thank you for the generous participation and sponsorship of the Middle School Student
Research Abstracts.
I just know it will make you smile when you learn that my daughter, Alexandra, entered seventh grade last September dread-
ing science. She could have been described as a “stereotypical” girl who believed that science was for boys and that science
was awful. But, after her research and publication related to her experiment, she became hooked on science!
Then, later in the year, she participated in the Holmes International Middle School Science Fair, and was awarded second
place. She went on to the LAUSD Middle School Science Fair, where she was awarded first place for her experiment related
to Turgor Pressure and Cell Membranes in Zoology!
Van Nuys Airport’s sponsorship, along with Ms. Terri Miller’s fabulous teaching, instilled a love for science in my daughter
and because of this I thank you and commend you for supporting young scientists!
Robin Tallas Mlynarik
CSUN College of Education
Northridge, CA
“A Positive Influence”
My students have a long history of publishing their research in the Journal of Student Research Abstracts. Many of these stu-
dents have gone on to major universities to continue their studies in science thanks to being able to publish their work in
the journal.
One of my students was able to work in [Dr. Oppenheimer’s CSUN] lab while going to high school and continued to pub-
lish her work in the journal. Also, she was able to co-author on the lab’s research and this work was published in major pro-
fessional journals. On the strength of this experience she was awarded a summer internship at JPL in Pasadena, after which
she went on to a major Ivy League university to study science.
Another one of my students travels to India every year with his father, who is a medical doctor. He is doing a bone density
comparison study of people who live in rural vs. urban areas. He just submitted an abstract on a follow-up study for this
year’s journal.
In some families that send their kids to Lawrence, it is like a family tradition for their kids to publish their research in the
journal and then go on to study science in high school and then college. I could go on and on about these students and the
tremendous opportunities publishing in the journal gives them. I cannot say enough about what a positive influence this
journal has had on my past, present and future students.
Greg Zem, Science Teacher
Ernest Lawrence Middle School Magnet
2003 Amgen for Science Teaching Excellence in California Award Winner
Testimonialscontinued
VNY_SciJrnl_interior 9/14/12 10:24 AM Page 10
11New Journal of Student Research Abstracts 2007
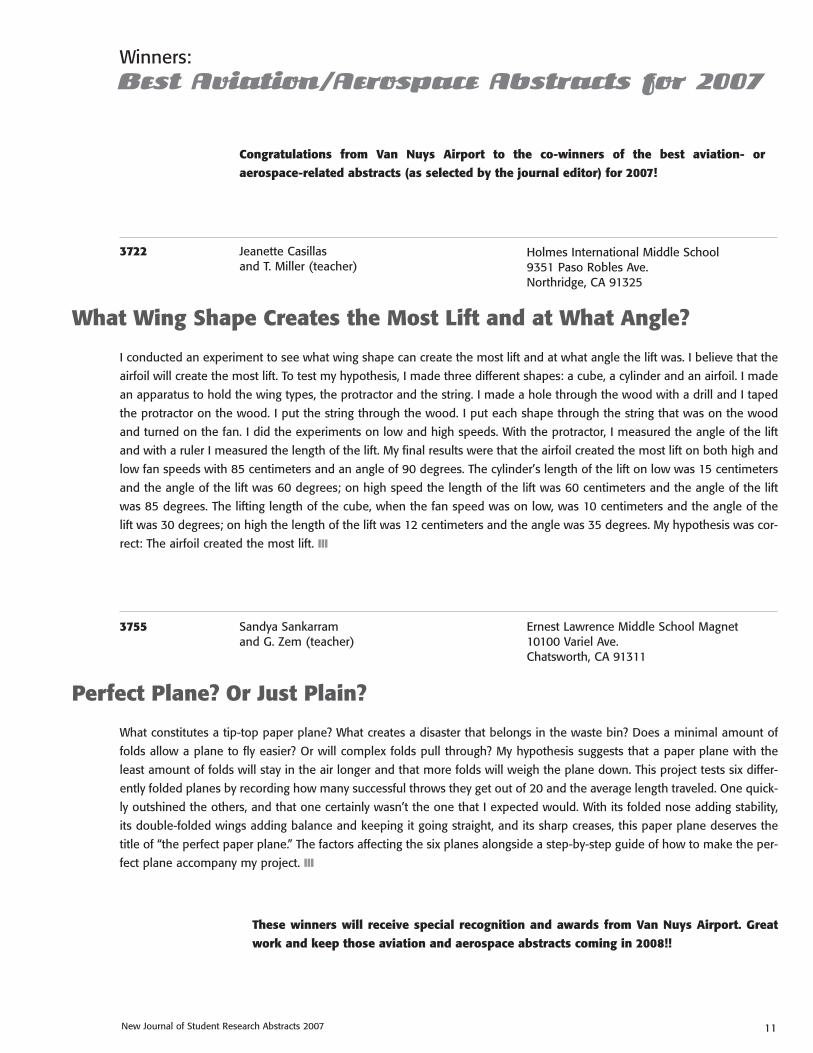
What Wing Shape Creates the Most Lift and at What Angle?
I conducted an experiment to see what wing shape can create the most lift and at what angle the lift was. I believe that the
airfoil will create the most lift. To test my hypothesis, I made three different shapes: a cube, a cylinder and an airfoil. I made
an apparatus to hold the wing types, the protractor and the string. I made a hole through the wood with a drill and I taped
the protractor on the wood. I put the string through the wood. I put each shape through the string that was on the wood
and turned on the fan. I did the experiments on low and high speeds. With the protractor, I measured the angle of the lift
and with a ruler I measured the length of the lift. My final results were that the airfoil created the most lift on both high and
low fan speeds with 85 centimeters and an angle of 90 degrees. The cylinder’s length of the lift on low was 15 centimeters
and the angle of the lift was 60 degrees; on high speed the length of the lift was 60 centimeters and the angle of the lift
was 85 degrees. The lifting length of the cube, when the fan speed was on low, was 10 centimeters and the angle of the
lift was 30 degrees; on high the length of the lift was 12 centimeters and the angle was 35 degrees. My hypothesis was cor-
rect: The airfoil created the most lift. ���
Perfect Plane? Or Just Plain?
What constitutes a tip-top paper plane? What creates a disaster that belongs in the waste bin? Does a minimal amount of
folds allow a plane to fly easier? Or will complex folds pull through? My hypothesis suggests that a paper plane with the
least amount of folds will stay in the air longer and that more folds will weigh the plane down. This project tests six differ-
ently folded planes by recording how many successful throws they get out of 20 and the average length traveled. One quick-
ly outshined the others, and that one certainly wasn’t the one that I expected would. With its folded nose adding stability,
its double-folded wings adding balance and keeping it going straight, and its sharp creases, this paper plane deserves the
title of “the perfect paper plane.” The factors affecting the six planes alongside a step-by-step guide of how to make the per-
fect plane accompany my project. ���
Jeanette Casillas and T. Miller (teacher)
3722
Sandya Sankarram and G. Zem (teacher)
3755 Ernest Lawrence Middle School Magnet10100 Variel Ave.Chatsworth, CA 91311
Holmes International Middle School9351 Paso Robles Ave.Northridge, CA 91325
Winners: Best Aviation/Aerospace Abstracts for 2007
Congratulations from Van Nuys Airport to the co-winners of the best aviation- or
aerospace-related abstracts (as selected by the journal editor) for 2007!
These winners will receive special recognition and awards from Van Nuys Airport. Great
work and keep those aviation and aerospace abstracts coming in 2008!!
VNY_SciJrnl_interior 9/14/12 10:24 AM Page 11

Experience Aviation in Action at Van Nuys Airport
With its average of more than 400,000 takeoffs and landingsannually, Van Nuys Airport (VNY) ranks as the world’s busiestgeneral aviation airport, meaning it handles all flights otherthan those for scheduled air carrier service or the military.
VNY also provides many opportunities for students, theirteachers and families to learn more about the exciting worldof aviation. Here’s a look at what we have to offer. Let usknow how we can assist you!
Public and Community Activities
Tours: Let your imagination soar with a close-up look at awide variety of aircraft and a glimpse into the many activitiesof aviation companies and operations at VNY. For theyoungest visitors (first grade and up), the award-winning tourprogram includes a visit with “Vinny,” Southern California’s
first kid-friendly, hands-oneducational airplane. Tours,offered free to school, civicand community groups,take place on weekdays andselect Saturdays at 9:30 a.m.and 11 a.m. (9:30 a.m. onlyduring the summermonths), with a minimumof 15 attendees per group.Reservations are required.
Public Observation Area: Watch aircraft take off and landfrom this area next to the airfield’s east side while you listento a live broadcast of air traffic controllers in the controltower. The observation area, located off of Woodley Avenueat the end of Waterman Drive, also features historical andinformational exhibits, picnic benches and a children’s activ-ity area. It is open daily from 8 a.m. to sunset.
Presentations: Let VNY come to you through our SpeakersBureau, which offers presentations to schools and communi-ty organizations about the airport’s rich history, aviationcareers and many other topics. VNY also offers slide presen-tations to school groups and participates in student careerfairs throughout the San Fernando Valley.
Educational Programs
ACE (Aviation Careers Education) Academy: This freeweeklong motivational program, offered each summer, pro-vides local middle and high school students with a basicunderstanding of the aviation industry, information on avail-able career and technical opportunities in aviation, and gen-eral knowledge of VNY and Los Angeles International Airport.Participants are selected based on desire to learn about avi-ation, with priority given to students in the neighboring areasof VNY.
After-School Reading Program: VNY Public andCommunity Relations employees tutor local elementary stu-dents in reading, with an emphasis on aviation history.Teachers and counselors closely monitor the students’progress.
VNY Young Achievers: Through this program, VNY recog-nizes and rewards exceptional area middle school studentswho excel in academics, athletics, the arts or communityservice. The program culminates with an awards luncheon atthe end of the school year. Parents, teachers and principalsare invited to celebrate their students’ success.
Los Angeles Unified School District Aircraft MechanicsSchool: Housed at VNY, this branch of the North ValleyOccupational Center-Aviation Center enables students toearn certification in general airframe and power plantmechanics. The program curriculum, approved and certifiedby the Federal Aviation Administration, consists of 47 subjectareas to prepare students for a wide array of jobs in the avi-ation-aerospace industry.
To find out more about VNY’s community and education pro-grams, visit www.lawa.org/vny or call (818) 909-3529. Wehope to see you soon! ���
Above: Young students explore Vinny, VNY’s colorful mascot andSouthern California’s first kid-friendly, hands-on educational airplane.
Right: Student participants in VNY’s ACE (Aviation Careers Education)program check out a vintage aircraft at the airport.
12 Van Nuys Airport & California State University, Northridge
VNY_SciJrnl_interior 9/14/12 10:24 AM Page 12
Explore the History of Van Nuys Airport:
A Pioneering Legacy, A Soaring Future
More than 100 years ago, on Dec. 17, 1903, Orville andWilbur Wright made history when their Wright Flyer becamethe first aircraft to achieve sustained, powered flight.
This feat launched the modern era of aviation, which took offin Southern California just a quarter-century later with theestablishment of the forerunners of both Los AngelesInternational Airport (LAX) and Van Nuys Airport (VNY). Thegrowth of both airports in years to come helped make theSouthern California region a major part of the aviation andaerospace industries in the 20th century.
LAX opened as Mines Field on Oct. 1, 1928, with the signingof a lease of 640 acres to use as an airport for the City of LosAngeles. Soon after – on Dec. 17, 1928, the 25th anniversaryof the Wright Brothers’ first flight – VNY was born asMetropolitan Airport through the establishment of a corpora-tion by a small group of citizens.
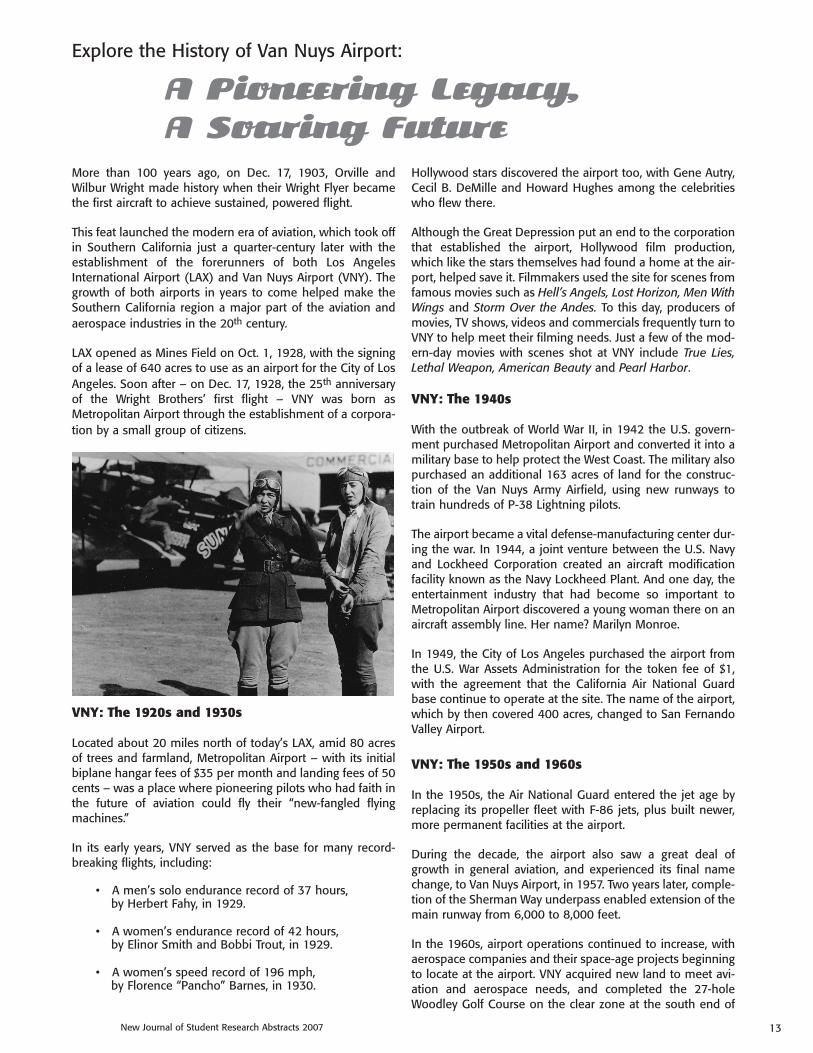
VNY: The 1920s and 1930s
Located about 20 miles north of today’s LAX, amid 80 acresof trees and farmland, Metropolitan Airport – with its initialbiplane hangar fees of $35 per month and landing fees of 50cents – was a place where pioneering pilots who had faith inthe future of aviation could fly their “new-fangled flyingmachines.”
In its early years, VNY served as the base for many record-breaking flights, including:
• A men’s solo endurance record of 37 hours, by Herbert Fahy, in 1929.
• A women’s endurance record of 42 hours, by Elinor Smith and Bobbi Trout, in 1929.
• A women’s speed record of 196 mph, by Florence “Pancho” Barnes, in 1930.
Hollywood stars discovered the airport too, with Gene Autry,Cecil B. DeMille and Howard Hughes among the celebritieswho flew there.
Although the Great Depression put an end to the corporationthat established the airport, Hollywood film production,which like the stars themselves had found a home at the air-port, helped save it. Filmmakers used the site for scenes fromfamous movies such as Hell’s Angels, Lost Horizon, Men WithWings and Storm Over the Andes. To this day, producers ofmovies, TV shows, videos and commercials frequently turn toVNY to help meet their filming needs. Just a few of the mod-ern-day movies with scenes shot at VNY include True Lies,Lethal Weapon, American Beauty and Pearl Harbor.
VNY: The 1940s
With the outbreak of World War II, in 1942 the U.S. govern-ment purchased Metropolitan Airport and converted it into amilitary base to help protect the West Coast. The military alsopurchased an additional 163 acres of land for the construc-tion of the Van Nuys Army Airfield, using new runways totrain hundreds of P-38 Lightning pilots.
The airport became a vital defense-manufacturing center dur-ing the war. In 1944, a joint venture between the U.S. Navyand Lockheed Corporation created an aircraft modificationfacility known as the Navy Lockheed Plant. And one day, theentertainment industry that had become so important toMetropolitan Airport discovered a young woman there on anaircraft assembly line. Her name? Marilyn Monroe.
In 1949, the City of Los Angeles purchased the airport fromthe U.S. War Assets Administration for the token fee of $1,with the agreement that the California Air National Guardbase continue to operate at the site. The name of the airport,which by then covered 400 acres, changed to San FernandoValley Airport.
VNY: The 1950s and 1960s
In the 1950s, the Air National Guard entered the jet age byreplacing its propeller fleet with F-86 jets, plus built newer,more permanent facilities at the airport.
During the decade, the airport also saw a great deal ofgrowth in general aviation, and experienced its final namechange, to Van Nuys Airport, in 1957. Two years later, comple-tion of the Sherman Way underpass enabled extension of themain runway from 6,000 to 8,000 feet.
In the 1960s, airport operations continued to increase, withaerospace companies and their space-age projects beginningto locate at the airport. VNY acquired new land to meet avi-ation and aerospace needs, and completed the 27-holeWoodley Golf Course on the clear zone at the south end of
13New Journal of Student Research Abstracts 2007
VNY_SciJrnl_interior 9/14/12 10:24 AM Page 13

the airport in 1968. Also in 1968, VNY constructed the con-trol tower it still uses today.
As the airport grew, in the mid-1960s VNY launched itsaward-winning guided tour program, opening the doors ofthe airport to the local community for a captivating journeythrough aviation past and present. VNY continues to offertours today, giving about 10,000 adults and children a close-up look at the airport each year.
VNY: The 1970s and 1980s
By 1971, VNY had become the busiest general aviation air-port in the nation. In 1975, the FlyAway Bus Terminal opened,providing nonstop bus service between the San FernandoValley and LAX, and helping alleviate freeway and LAX park-ing congestion.
These decades marked the launch of many new VNY com-munity and educational outreach programs to benefit localresidents, businesses and students. Several other activities inthe 1980s further showcased VNY’s commitment to workingclosely with the community. These included the implementa-tion of a Noise Abatement and Curfew Ordinance governingaircraft operations, and the formation of the VNY CitizensAdvisory Council to assist and promote closer, more directinteraction with community representatives on a variety ofairport-related issues.
In the 1980s, VNY played a role in the final chapters of anAmerican tradition, as the legendary Bob Hope embarkedfrom the airport on some of his last USO tours for Americantroops abroad. And in 1988, the airport opened an observa-tion area to allow the public to view airport operations first-hand.
VNY: The 1990s
The 1990s brought many more changes and developmentsto VNY, which continued to serve a vital role in Los Angeles.
The 146th Airlift Wing of the California Air National Guardrelocated from VNY to the Channel Islands in 1990. In 1994,the area formerly occupied by the Guard served as a criticaloperating site for the American Red Cross as it preparedthousands of meals to aid victims of the devastatingNorthridge earthquake.
In 1991, the City of Los Angeles took over the function, pre-viously handled by the Guard, of hosting VNY’s annualAviation Expo, continuing a long tradition of bringing world-class military and civilian aircraft displays and demonstrationsto the San Fernando Valley. In the years that followed, the air-port gained national recognition for superlative air showswith many “firsts” for the City of Los Angeles – including thefirst public appearances by the B-2 Stealth Bomber and theF-117A Stealth Fighter, and the first demonstrations by theadvanced AV-8B Harrier jet and the elite U.S. Army GoldenKnights Parachute Team.
Business activity at the airport continued to grow during thedecade and by 1999, an economic impact study indicatedthat the airport contributed about $1.2 billion annually to theSouthern California economy and supported more than10,000 jobs. Today those numbers have reached over $1.3billion annually and more than 12,300 jobs.
VNY: 2000 and Beyond
Los Angeles World Airports, which owns and operates LAX,VNY and two other regional airports, took a major step for-ward to further address noise concerns related to VNY whenit initiated a $15 million residential soundproofing programin 2000.
In 2006, Los Angeles’ mayor signed VNY’s Master Plan,designed to protect the environment, minimize adverseimpacts on neighbors and guide land use at the airport as aSouthern California general aviation center for the next 20years. The long-term planning document focuses on encour-aging orderly development of on-airport land use, with a keyelement providing for a designated propeller area. Beforebeing signed by the mayor, the plan – with input from theVNY Citizens Advisory Council – was approved by the Boardof Airport Commissioners, the Los Angeles City PlanningCommission and the Los Angeles City Council.
In other developments, the new millennium saw the start ofa $30 million bond project by the Los Angeles FireDepartment to better serve and protect local communities byconstructing permanent air operations and helicopter maintenance facilities on the former Air National Guard siteat VNY.
History of Van Nuys Airportcontinued
14 Van Nuys Airport & California State University, Northridge
VNY_SciJrnl_interior 9/14/12 10:24 AM Page 14

15New Journal of Student Research Abstracts 2007
At the FlyAway Bus Terminal, an improvement project com-pleted in early 2005 added additional parking, more conven-ient passenger drop-off, an enlarged and modernized termi-nal building, and new landscaping. In September 2006, LosAngeles World Airports launched the start of remote airlineand baggage check-in service for FlyAway passengers, a rev-olutionary new service to increase security and improve thecustomer experience at LAX.
In 2003, VNY celebrated the centennial of flight and the 75th
anniversary of aviation in Los Angeles with an exciting eventthat showcased an exact replica of the 1903 Wright Flyer andmuch more. In 2006, VNY’s Rockin’ AirFest event featured thefirst-ever City of Los Angeles flyover by the F-22 Raptor, theworld’s most advanced fighter jet.
Today, VNY – the world’s busiest general aviation airport –sits on 730 acres, with more than 800 aircraft and 100-plusbusinesses based at the airport. Some of the business services provided include aircraft maintenance, fueling, air-craft parking/tiedown, charter service, flight and groundschool instruction, aircraft manufacturing and avionics instal-lation. VNY also provides facilities for fire, police, air ambu-lance, search and rescue, and news media aircraft that servethe region.
In the years to come – through its ongoing leadership in gen-eral aviation, business and community service – VNY willcontinue to play a crucial role in the Southern Californiaeconomy, the regional approach to meeting passengerdemand, and the entire nation’s air transportation system. Tolearn more, visit www.lawa.org/vny. ���
History of Van Nuys Airportcontinued
VNY_SciJrnl_interior 9/14/12 10:24 AM Page 15

16 Van Nuys Airport & California State University, Northridge
Selena Birk, Manager, Van Nuys Airport
As the airport manager for VNY, the world’s busiest general aviation airport, Selena Birkoversees all activities related to airport operations, security and environmental issues;implements airport policies, rules and regulations; and serves as the main point of contactwith local residents, businesses and government officials.
After managing VNY for seven years, Birk says she still loves it because of the variety: “Myday is never the same and I enjoy working around people interested in aircraft, aviationand aerospace.”
As a child, Birk used to watch planes take off at El Monte Airport. Her dad worked for anairline and her step-brother flew cargo aircraft. Her brother-in-law still flies as a commer-cial airline pilot and serves as a colonel in the U.S. Air Force. So, she says, she has “avia-tion in her blood, as well as a long-time interest.” She built upon that interest with a his-tory of jobs in aviation, including 10 years at Los Angeles International Airport before mov-ing to VNY.
For those interested in the management side of aviation, she notes, “Technology is a keyto working in aviation today” and stresses the importance of knowledge in computer tech-nology, security, math and the sciences.
Birk also advises students to go to college and expose themselves to different aspects ofaviation – and to make smart choices, because to work in a high-level position like hers,you need a clean background!
Take Off Toward a Bright Future:
Careers in Aviation
What kinds of jobs do you think you can get inaviation? Maybe pilots or flight attendants? Alot of people work in these areas, but there aremany, many other exciting career opportuni-ties in aviation for all types of interests andbackgrounds.
Whether you’d like to work on an aircraft, in aworkshop, in an office or on an airfield, there’sa great job in aviation for you. Check out someof the people who work for or at Van NuysAirport (VNY). Just maybe you’ll pursue one ofthese careers in your future. Remember, onlythe sky’s the limit!
VNY_SciJrnl_interior 9/14/12 10:24 AM Page 16

Capt. LaPonda Fitchpatrick, Commanding Officer, Los Angeles Airport Police
Serving as the commanding officer over Airport Police Operations at VNY and LA/PalmdaleRegional Airport, Capt. LaPonda Fitchpatrick oversees the implementation of securitymeasures, policies and procedures to keep these airports safe and secure.
She previously worked at Los Angeles International Airport as the first commanding officerfor the Homeland Security Section within Los Angeles Airport Police. She says the need to“think on your feet” in aviation security is very rewarding, and believes education is a veryimportant part of security at airports. In fact, as a national instructor in aviation security,Fitchpatrick has provided security training to more than 1,000 law enforcement officers,Transportation Security Administration employees, pilots and others.
Fitchpatrick became fascinated with airplanes as a child, watching her mom travel out ofthe airport in Sacramento and hearing her dad, who worked in aerospace building aircraft,talk about planes. After moving to Los Angeles and finally seeing LAX, she says, “I washooked on airplanes. Having the ability to police this environment is just the ‘icing on thecake.’”
Her advice for today’s students: “Stay in school. It is the most important thing you can dofor yourself and aviation. There are so many opportunities for various certificates anddegrees in the aviation industry. Being in law enforcement, you must be at least 21 yearsof age. Don’t just sit around and wait for that date to come. Bring some value with you!We’ll add the rest.”
To help improve your future career opportunities, she adds, get a student internship orsummer job with Los Angeles World Airports or another aviation company or organization,because “hands-on real experience will only add value to your formal education.”
Fermin Gomez, Airport Superintendent of Operations, Van Nuys Airport
Fermin Gomez remembers going to airports as a youngster, when his father served in themilitary, and watching aircraft take off and land. He’s always loved being around aircraft,and today he holds a very important job in keeping them safe at VNY.
Gomez works as airport superintendent of operations, a job in which he ensures the safeand efficient operation of all airport users. This includes inspecting runways, taxiways andairport facilities, as well as enforcing airport rules and regulations. He’s worked for LosAngeles World Airports, which owns and operates VNY, for seven years, and also has apilot’s license.
For those interested in aviation, Gomez says, “Get a job doing anything at an airport andgo to school and earn a degree in aviation.” Many colleges and universities offer suchdegrees.
“There are many different jobs in aviation,” Gomez adds. “Try as many as possible and staywith the one you enjoy most.”
Careers in Aviationcontinued
17New Journal of Student Research Abstracts 2007
VNY_SciJrnl_interior 9/14/12 10:24 AM Page 17

Don Lewis, Air Traffic Controller, Federal Aviation Administration
Don Lewis works as an air traffic controller at VNY, where he manages the safe and order-ly flow of air traffic in the air and on the ground, and also gives pilots instructions for taxi-ing and takeoff.
Lewis, who’s been an air traffic controller for nine years, became interested in the job afterserving in the U.S. Army. He waited on a list for four years to get a position in this field.
The highlights of his job include the “high pressure and instant gratification” he gets fromdealing with pilots and “moving” aircraft. “I’m proud of what I do,” he says, adding that asan outlet he performs stand-up comedy.
Today, Lewis says, the pay for air traffic controllers is lower than it used to be, and the pro-fession doesn’t draw as many people as it did in the past. He advises students interestedin aviation to research programs at different colleges to pursue their passion.
Ken Miller, President, Van Nuys Flight Center, Inc.
Ken Miller still watches aircraft take off and land with awe, just like he did as a child. Hispassion for aviation and motivation to work in the field led him to his current position aspresident of Van Nuys Flight Center, Inc. In this role, which he’s held for three years, Milleroversees a fixed-based operator at VNY that handles aircraft sales, rentals, service and flighttraining.
“Aviation is a dream,” he says, adding that he began taking flying lessons in college after alifetime of fascination with planes.
Miller says it’s important not to take “no” for an answer. He remembers getting turneddown for jobs by two aviation companies in college, but continuing to try. He explains,“Persistent people get their foot in the door.”
He also advises students to apply themselves, remain motivated and get exposure in thefield: “If it interests you, go out and do it.”
Kathy Smither, Tour Guide, Van Nuys Airport
As a tour guide at VNY, Kathy Smither gives tours of the airfield, makes presentations tocommunity groups and represents the airport at career fairs, business expos and otherevents. In addition, she coordinates the annual weeklong Aviation Careers Education (ACE)Academy, which educates students about airport operations and the many career andtechnical opportunities in the aviation industry.
“I am privileged to work in a field that I love,” Smither says. “I have been a guide for 10years and still love talking to people about aviation.”
Smither became interested in aviation during college, when she met a pilot who laterbecame her husband. Now a pilot herself, she enjoys flying her plane whenever possible.
If you think you’d like to get into this field, Smither says to follow your passion and stayopen to opportunities. “Become involved in aviation groups and meet others who shareyour interest,” she adds. “There are many types of aviation careers, and networking canopen doors you didn’t know existed.”
Careers in Aviationcontinued
18 Van Nuys Airport & California State University, Northridge
VNY_SciJrnl_interior 9/14/12 10:24 AM Page 18
Careers in Aviationcontinued
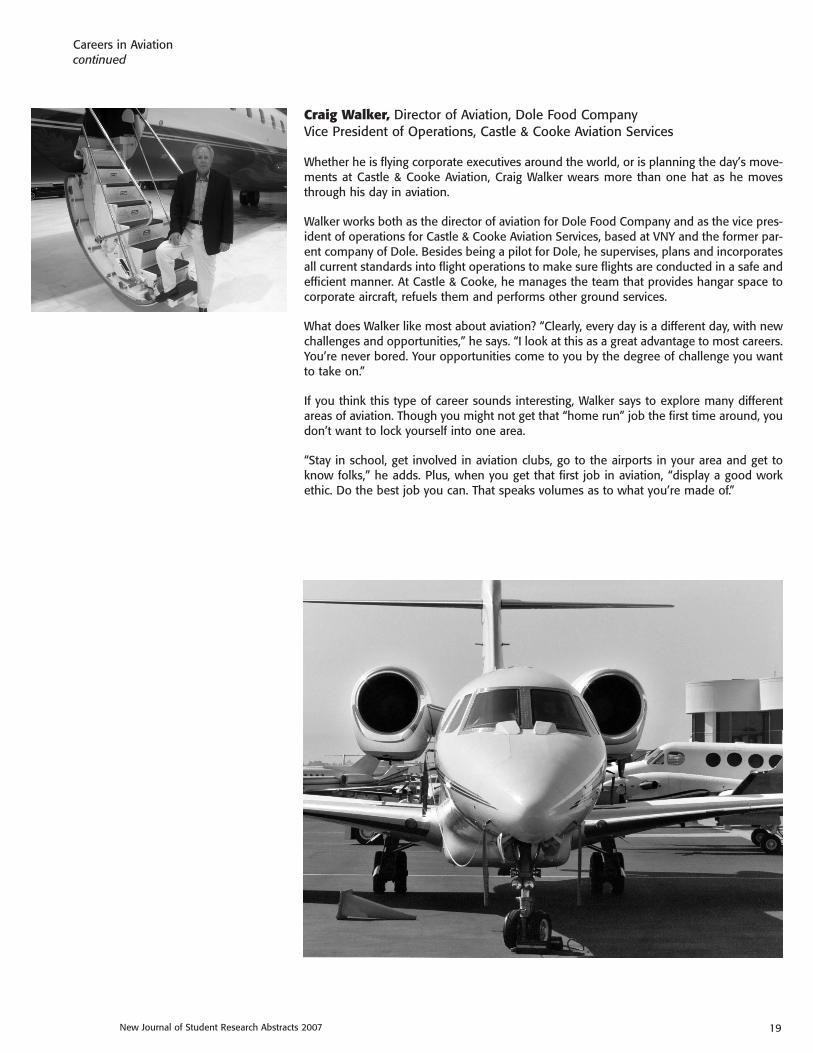
Craig Walker, Director of Aviation, Dole Food CompanyVice President of Operations, Castle & Cooke Aviation Services
Whether he is flying corporate executives around the world, or is planning the day’s move-ments at Castle & Cooke Aviation, Craig Walker wears more than one hat as he movesthrough his day in aviation.
Walker works both as the director of aviation for Dole Food Company and as the vice pres-ident of operations for Castle & Cooke Aviation Services, based at VNY and the former par-ent company of Dole. Besides being a pilot for Dole, he supervises, plans and incorporatesall current standards into flight operations to make sure flights are conducted in a safe andefficient manner. At Castle & Cooke, he manages the team that provides hangar space tocorporate aircraft, refuels them and performs other ground services.
What does Walker like most about aviation? “Clearly, every day is a different day, with newchallenges and opportunities,” he says. “I look at this as a great advantage to most careers.You’re never bored. Your opportunities come to you by the degree of challenge you wantto take on.”
If you think this type of career sounds interesting, Walker says to explore many differentareas of aviation. Though you might not get that “home run” job the first time around, youdon’t want to lock yourself into one area.
“Stay in school, get involved in aviation clubs, go to the airports in your area and get toknow folks,” he adds. Plus, when you get that first job in aviation, “display a good workethic. Do the best job you can. That speaks volumes as to what you’re made of.”
19New Journal of Student Research Abstracts 2007
VNY_SciJrnl_interior 9/14/12 10:24 AM Page 19

Careers in Aviationcontinued
Aviation Jobs and Salaries
Check out these impressive aviation jobs and their salaries, and look at how many jobopenings are expected in less than 10 years!*
• Aerospace Engineers: Perform a variety of engineering work in designing, constructing and testing aircraft, missiles and spacecraft. Conduct basic and applied research to evaluate adaptability of materials and equipment to aircraft design and manufacture. May recommend improvements in testing equipment and techniques.
• Average mean salary: $47.60 per hour
• Annual openings: 317
• Projected demand in Los Angeles County by 2014: 12,650
• Aircraft Mechanics and Service Mechanics: Diagnose, adjust, repair or overhaul aircraft engines and assemblies, such as hydraulic and pneumatic systems. This category includes helicopter and aircraft engine specialists andexcludes avionics technicians.
• Average mean salary: $28 per hour
• Annual openings: 317
• Projected demand in Los Angeles County by 2014: 12,650
• Avionics Technicians: Install, inspect, test, adjust or repair avionics equipment, such as radar, radio, navigation and missile control systems in aircraft or space vehicles.
• Average mean salary: $24 per hour
• Annual openings: 32
• Projected demand in Los Angeles County by 2014: 1,290
* Information source: State of California Employment Development Department Labor Market Information (LMI) from first quarter 2007 and Economic Alliance of the San Fernando Valley.
More Aviation Careers
There are a lot of other interesting jobs in aviation. Many of these require (in addition to ahigh school diploma) a bachelor’s degree in a specialized field, with a master’s or doctor-al degree preferred for others. Entry into many technical occupations involves two years oftechnical training after high school. Having computer skills helps for most job options.
Here are some of the many additional opportunities (in alphabetical order) that aviationprovides:
• Aircraft interior designers and crafters: Create comfortable, attractive aircraft interiors (designers) and design and manufacture cabinetry foraircraft (crafters).
• Architects and civil engineers: Design and supervise the construction ofairports, including layout, buildings and upgrades/improvements.
• Aviation mechanics: Keep all types of aircraft safe by performing service,repair and overhaul of various aircraft components.
20 Van Nuys Airport & California State University, Northridge
VNY_SciJrnl_interior 9/14/12 10:24 AM Page 20
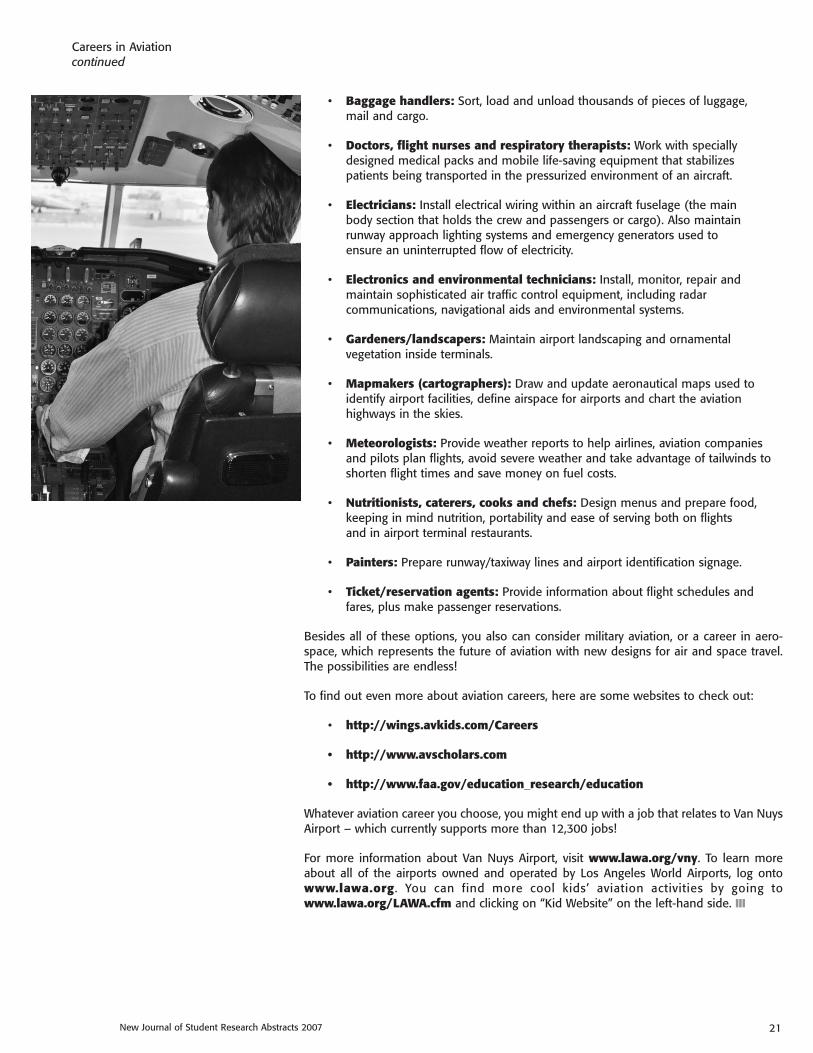
• Baggage handlers: Sort, load and unload thousands of pieces of luggage,mail and cargo.
• Doctors, flight nurses and respiratory therapists: Work with specially designed medical packs and mobile life-saving equipment that stabilizespatients being transported in the pressurized environment of an aircraft.
• Electricians: Install electrical wiring within an aircraft fuselage (the mainbody section that holds the crew and passengers or cargo). Also maintainrunway approach lighting systems and emergency generators used to ensure an uninterrupted flow of electricity.
• Electronics and environmental technicians: Install, monitor, repair andmaintain sophisticated air traffic control equipment, including radar communications, navigational aids and environmental systems.
• Gardeners/landscapers: Maintain airport landscaping and ornamental vegetation inside terminals.
• Mapmakers (cartographers): Draw and update aeronautical maps used toidentify airport facilities, define airspace for airports and chart the aviation highways in the skies.
• Meteorologists: Provide weather reports to help airlines, aviation companies and pilots plan flights, avoid severe weather and take advantage of tailwinds toshorten flight times and save money on fuel costs.
• Nutritionists, caterers, cooks and chefs: Design menus and prepare food,keeping in mind nutrition, portability and ease of serving both on flightsand in airport terminal restaurants.
• Painters: Prepare runway/taxiway lines and airport identification signage.
• Ticket/reservation agents: Provide information about flight schedules andfares, plus make passenger reservations.
Besides all of these options, you also can consider military aviation, or a career in aero-space, which represents the future of aviation with new designs for air and space travel.The possibilities are endless!
To find out even more about aviation careers, here are some websites to check out:
• http://wings.avkids.com/Careers
• http://www.avscholars.com
• http://www.faa.gov/education_research/education
Whatever aviation career you choose, you might end up with a job that relates to Van NuysAirport – which currently supports more than 12,300 jobs!
For more information about Van Nuys Airport, visit www.lawa.org/vny. To learn moreabout all of the airports owned and operated by Los Angeles World Airports, log ontowww.lawa.org. You can find more cool kids’ aviation activities by going towww.lawa.org/LAWA.cfm and clicking on “Kid Website” on the left-hand side. ���
Careers in Aviationcontinued
21New Journal of Student Research Abstracts 2007
VNY_SciJrnl_interior 9/14/12 10:24 AM Page 21

Aviation Research Project IdeasHere are a few ideas for future aviation and aerospace research projects, from www.juliantrubin.com/fairprojects/engineering/aviation.html:
Grades 4-6
• Determine how an airplane propeller’s angle of pitch affects thrust.• Find out which material is best for hot air balloons: nylon or polyester?• Research why different boomerangs fly different ways.• Explore the effect of different designs of plane fuselage, nose, tail and wings on aerodynamic drag. • Experiment to find out which plane from four designs flies the best.• Determine how gear combinations affect the revolutions of a helicopter’s rotor blade.• Find out the effect of differences in a rocket’s motor on the rocket’s performance.
Grades 7-9
• Determine the best nozzle angle for an airplane.• Test the importance of angle of attack to flight.• Determine how different wings and their surfaces affect their efficiency.• Research how much lift a rotating cylinder generates when compared to an airplane propeller and a
helicopter blade.• Determine if adding weight and moving it along the fuselage will change an airplane's flight distance
and stall height.• Figure out which aerodynamic fuselage and wing design creates the least amount of drag.• Determine the effect of the thrust of a rocket on the height a rocket can go.
Grades 10-12
• Analyze the effects of varying aspect ratios on a toy glider’s flight.• Determine at what angle the lift of a wing is maximized.• Test what effect the varying atmospheric temperatures have on circuit breakers used in modern flight.• Research how the camber of an airfoil affects the lift-to-drag ratio.• Find out at which launch angle a rocket would be propelled the farthest.• Research whether simplified methods of calculating the center of pressure are reliable indicators.• Develop a mathematical model to predict a rocket’s trajectory.
Check out more project ideas, cool aviation resources and fun facts in the following websites:
• Aeronautics Learning Laboratory for Science, Technology and Research: www.allstar.fiu.edu• Aviation for Kids Program on Business Aviation for Elementary School Students: www.avkids.com• Federal Aviation Administration, Aviation and Space Education Outreach Program Kid’s Corner:
www.faa.gov/education_research/education/student_resources/kids_corner/ • NASA Quest: http://quest.nasa.gov/ • San Fernando Valley 99s Aviation Explorers 747 Program: www.sfv99s.org/explorers.html • Young Eagles Program of the Experimental Aircraft Association: www.youngeagles.org
For more information about Van Nuys Airport, visit www.lawa.org/vny.
22 Van Nuys Airport & California State University, Northridge
VNY_SciJrnl_interior 9/14/12 10:24 AM Page 22

Here are some other aviation projects you can consider for your next assignment:
• What designs of paper airplanes make them fly best?• What thickness or weight of paper makes paper airplanes fly best?• Using purchased model airplanes (rubber band or electric or glider), what can
be done to the design to make them fly best? For example, add weight to different areas of the airplane.
• Design ways to analyze what makes for a better flight. For example, developquantitative criteria that can be used to evaluate flight.
• Using purchased toy helicopters, what can be done to them to improve theirability to fly?
Remember that good research includes many repeats of experiments, and, if applicable,many experimental and control samples.
Also, it’s best to conduct experiments with a hypothesis – meaning your assumption, ortentative explanation for what you expect to occur once you conduct your experiment. For example, you might say, “My hypothesis is that paper airplanes made with heavierpaper will fly best.” Then you test the hypothesis with your experiment and discuss theresults and possible conclusions. ���
From the Editor:
Awesome Aviation Projects and Tips
Aviation Project Ideascontinued
23New Journal of Student Research Abstracts 2007
VNY_SciJrnl_interior 9/14/12 10:24 AM Page 23
How to Organize a Science Fair
Benefits of Science Fairs
Science fairs help students practice knowledge that they havelearned, expand their knowledge about subjects that interestthem, solve problems and share their discoveries with others.Students also learn about the use and application of the sci-entific method through repeated experiments, evaluation/measurement of variables, theoretical and experimentalanalyses and finding ways to control them.
In addition, science fairs develop communication, writing,presentation and research skills and teach students how totake an open and creative approach to problem-solving. Theylearn that a successful project is based on a scientificapproach and requires management and public speakingskills, as well as poise and independent and clear thinkingabilities. Science fairs not only motivate students to learnmath and science, and apply the scientific method, but alsohelp them recognize and appreciate the importance of mathand science in solving problems in everyday life. The fairsalso provide an opportunity to acknowledge outstandingeffort and achievement by students and teachers, plus createawareness among parents, teachers and students of the critical importance of social competencies, literacy and talent.
Organization and Planning
There are several steps to organizing and planning a success-ful science fair:
1. Obtain consensus from school administration and teachers on a general plan: A team of teach-ers should be willing to support and contribute.
2. Select a date and place for the event: Considerthe date of the Los Angeles County Science Fair,availability of facilities and judges, and extent ofstudent participation.
3. Appoint committees to oversee various aspects of the science fair (logistics, publicity, setup, judging, advisory, mentoring, monitoring, takedown, etc.) and to decide the nature of the science fair and resources required. It should be decided, for instance, if all students should participate with their individual projectsor if group projects should be allowed, the acceptable format of project displays, if parental assistance should be sought, and even if neighborhood organizations and establishments should be asked to contribute.
4. Adopt a schedule based on the date of the fair, available space, degree of assistance from outside the school, number of students and teachers involved, number of projects expected and number of judges needed.
5. Establish milestones and convey them to the students.
6. Define project selection and judging criteria:A project should contain a title; a hypothesis or a question or statement; a complete list of materials/resources necessary to carry out the project; a well-defined design and procedure for experimentation; tables of data and a summary; plots and graphs showing the main results of experiments; explanationsof anomalies in the data, if any; and a clear conclusionthat corroborates the results. In addition, it is helpful toask the students to keep a log book in which they takenotes about each and every experience they have inimplementing their project. It is also desirable to takepictures of the setup, apparatus and even the experimentation.
7. Convey guidelines to the teachers: This will help them explain to the students the topic/title selection process; how to determine what cause and effect relations to search for; how to identify controls ordependent and independent variables; how to look for variability in the process they are studying through repeated experimentation and by the application of various inputs and the study of their corresponding outputs; and how to best organize and present their projects. The scientific method should be understood by every teacher involved, so that they in turn are able to explain it to the students and ask everyone to carry out their projects accordingly.
8. Hold the science fair: Make sure the judges work on schedule and the students cooperate.
9. Tear down and clean up the facility and acknowledge participants (parents, students, teachers, etc.).
A science fair should be a fact-finding process for students.They should be able to plan, organize and implement, in ascientific way, activities directed toward the goal of answer-ing a question they started with or proving/disproving thehypothesis they claimed to be true. All pertinent informationshould be made available to parents and clearly explained tothe teachers involved, who then should make sure to clearlyexplain it to the students.
By Hagop Panossian, Ph.D.Pratt & Whitney Rocketdyne6633 Canoga Ave., AC 56Canoga Park, CA 91303
24 Van Nuys Airport & California State University, Northridge
VNY_SciJrnl_interior 9/14/12 10:24 AM Page 24

The Scientific Method
Every experiment, no matter how well-planned and how pre-cisely carried out every step of the way, will still have errors.For this reason, scientists always repeat each experiment sev-eral times, under “identical” conditions, observe the variabili-ty from one trial to the next and take the average of all trialsas the acceptable value. If the variability of the measured datais significant, some statistics should be used indicating themean value, the standard deviation and the variance of themeasurement values.
Because of this, it is a good idea to teach students how toplan and execute experiments, including what to measure,what inputs to use and how many trials to perform per con-dition of the experiment. Having a well-planned and -execut-ed experiment renders a good foundation for a well-plannedand -executed science project.
Even a simple project, such as the very popular elementaryschool “volcano” project, can be made into a real scienceproject by designing experiments that evaluate things like theamount of chemicals vs. the height of the “eruption,” or thekinds of chemicals and “eruption,” etc. It is important to havean experiment in a science project; otherwise it will be ademonstration only.
The Science Fair
On the day of the science fair, all of the approved projects,with appropriate name tags and labels, should be placed ontables and arranged in accordance with agreed-upon settingsand groupings. An adequate number of judges should beavailable to view and evaluate all of the projects displayed, ina timely manner. The judges should be aware of the criteriafor judging, the schedule, the rubric and the amenities fortheir use.
Every student should be interviewed individually, and askedabout his or her experiences and understanding of the theo-ry and application of his or her project. Before the interviews,however, it is good practice to allow time for the judges toreview the project displays one by one, in the absence of thestudents, to form a first impression of what the students havedone, how much work has gone into each project, how neatand clear are the presented materials and how coherent andmeaningful is the conclusion, based on the data shown. Afive-minute survey of a project (without the students present)by a judge could provide an overall impression of the subjectmatter, the scientific value and the relevance of the data. Thejudges should work based on clear directions and a well-writ-ten set of criteria by which to judge the projects.
The most practical way to judge school science fairs is tojudge the projects of each individual grade level (or by cate-gory of project, rather than by grade level) by calling in sever-
al students at a time, interviewing them, sending them backto class and asking the next group to follow. After the inter-views are over and all students have been questioned, thejudges discuss the merits of the projects and try to select theones with the highest ranking, according to the criteria theyare following. It is sometimes deemed necessary to go backand re-evaluate projects, and even revisit and discuss someof the projects with students. This allows the judges to allagree on the final rankings and present the results to the sci-ence fair coordinator.
Normally first-, second- and third-place winners are selectedand an additional project is selected for honorable mention.It is even possible to select two or more projects that are ofequal merit, by the consent of all judges, as first-, second- orthird-place winners, or even for honorable mention.
Awarding Winners
One effective way to encourage student participation in sci-ence fairs is to organize a special awards presentation cere-mony and invite parents, relatives and peers to attend. Theawards are presented by the principal or the organizer/coordinator of the fair, and all of the contributors to the fair’ssuccess are duly acknowledged. Those projects/studentsselected to participate in the Los Angeles County Science Fairare also given recognition and their names announced. Thenthe public is encouraged to view the projects and talk to thestudents.
The final phase of the fair is the removal of all of the projects,tables and chairs and the cleanup of the display hall.Moreover, thank you notes should be sent to all individuals,organizations and companies that helped put on and imple-ment the science fair. Feedback should be sought from thejudges, parents, teachers and the principal to try to improvethe fair during the next season.
For more information on Pratt & Whitney Rocketdyne, visitwww.pw.utc.com (click on “Products” and then on the“Space” link under that) or contact Hagop Panossian [email protected] or (818) 586-9660. ���
How to Organize a Science Faircontinued
25New Journal of Student Research Abstracts 2007
Students from Terri Miller's class at Holmes InternationalMiddle School in Northridge, CA, display their recognition for presenting their work at the California State University,Northridge, Poster Symposium.
VNY_SciJrnl_interior 9/14/12 10:24 AM Page 25

26 Van Nuys Airport & California State University, Northridge
VNY_SciJrnl_interior 9/14/12 10:24 AM Page 26

27New Journal of Student Research Abstracts 2007
VNY_SciJrnl_interior 9/14/12 10:24 AM Page 27
28 Van Nuys Airport & California State University, Northridge
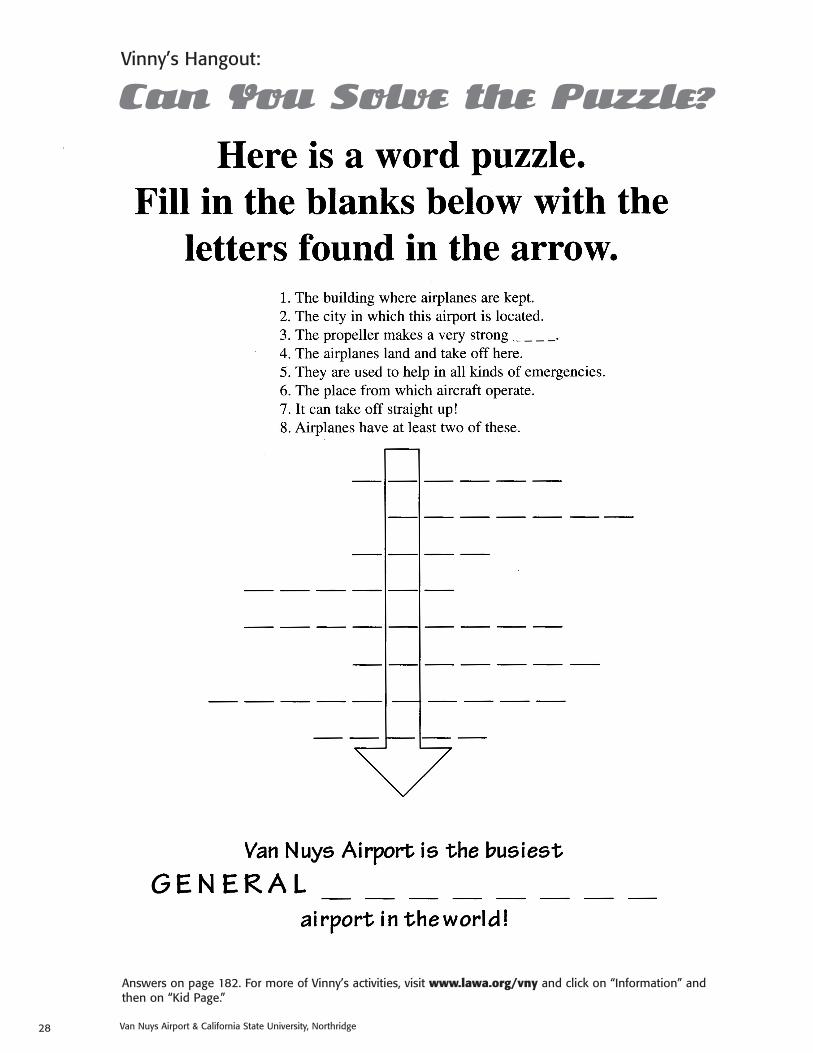
Vinny’s Hangout:
Can You Solve the Puzzle?
Answers on page 182. For more of Vinny’s activities, visit www.lawa.org/vny and click on “Information” andthen on “Kid Page.”
VNY_SciJrnl_interior 9/14/12 10:24 AM Page 28
29New Journal of Student Research Abstracts 2007
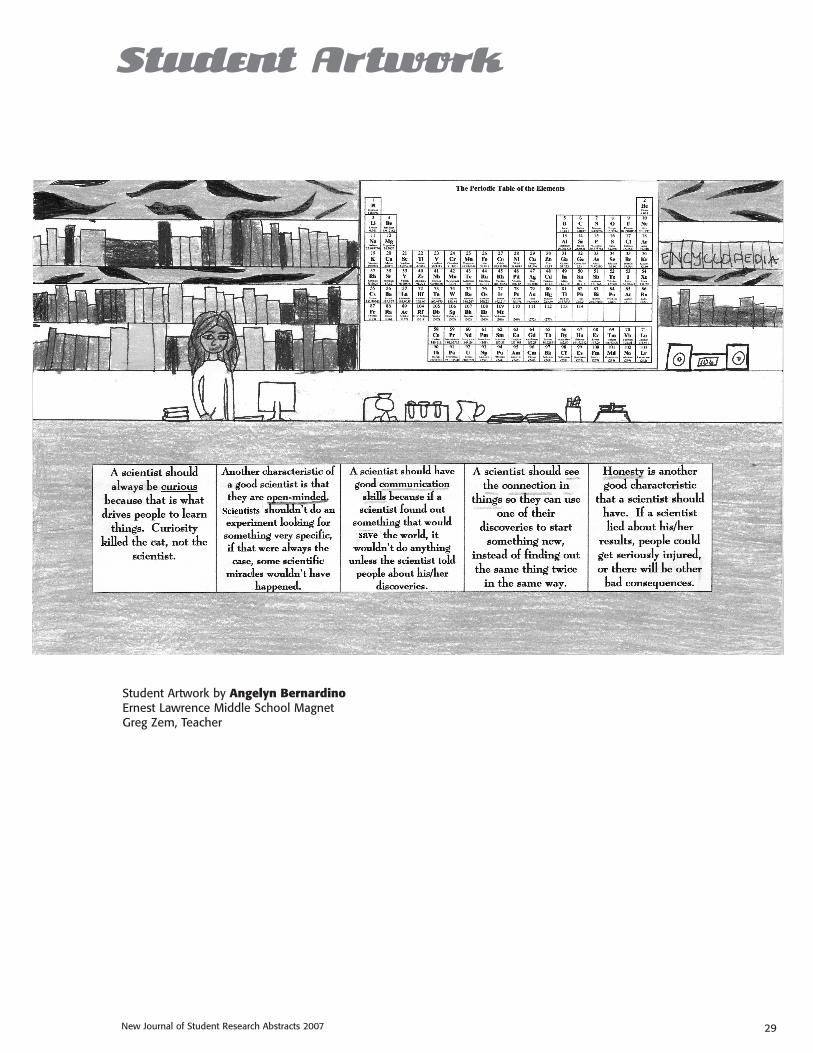
Student Artwork by Angelyn BernardinoErnest Lawrence Middle School MagnetGreg Zem, Teacher
Student Artwork
VNY_SciJrnl_interior 9/14/12 10:24 AM Page 29

30
VNY_SciJrnl_interior 9/14/12 10:24 AM Page 30

31New Journal of Student Research Abstracts 2007
Is the Five-Second Rule Safe?
The purpose of this experiment was to see whether or not the five-second rule with foods is safe. The five-second rule is a
popular North American rule stating that foods that have been dropped on the floor can still be eaten if picked up within
five seconds. According to the five-second rule, germs will not contaminate the food until five seconds have passed.
I believed that the five-second rule was not safe for people’s health and would produce germs and bacteria. To check my
hypothesis, I cut a whole apple in half, making two pieces of apples. Then I took one piece of the apple and dropped it on
the floor for five seconds. I rubbed the dropped apple piece on nutrient agar that was placed in a petri dish and labeled it
for the experiment. After that, I took the other piece of the apple and immediately rubbed it on the nutrient agar in a sep-
arate petri dish that was labeled for the control. Next, I took two pieces of dry crackers. I got one of the crackers and dropped
it on the floor for five seconds. Then I took the dropped cracker and rubbed it on the nutrient agar that was placed in a new
petri dish labeled experiment #2. Afterward, I took the other piece of cracker and right away rubbed it on the nutrient agar
in a different petri dish that was labeled control #2. Then I observed and measured the amount of bacteria on each food in
each petri dish for a week. Afterward I put all the results together. In the petri dish labeled “experiment” with the dropped
piece of apple, it seems on the seventh day (the last day I had taken data) it had grown in total 8.5 centimeters of bacteria.
Then in the petri dish labeled “control” with the regular piece of apple, it had grown 5.4 centimeters of bacteria in total. In
the other petri dish that was labeled “experiment #2” with the dropped piece of cracker, on last day, it had grown
7.1 centimeters of bacteria in total. Then in the petri dish that was labeled “control #2” with the regular piece of cracker,
it had grown 4.2 centimeters of bacteria in total. This proved that my hypothesis was correct that the five-second rule is not
safe for people’s health and it does produce a lot of bacteria and germs on foods. ���
Will Dried Pinto Beans Germinate in Green Tea?
The purpose of my project was to determine if pinto beans could germinate in green tea. I believed the pinto beans could
germinate in green tea. To test my hypothesis, I gathered 12 small plates and I placed 6 pieces of cotton in each of the plates.
I made some hot green tea according to the directions on the package and placed it in the refrigerator to cool down. After
it cooled down, I poured the green tea into 6 of the plates and poured water into the other 6. I then used a permanent
marker to label the plates with green tea in them, Experiment, and the plates with water in them, Control. Next, I put 5 dried
pinto beans in each of the small plates. I placed all the plates next to a window for sunlight. I observed the pinto beans for
10 days and recorded the number of pinto beans that germinated in the green tea and water for my data. My hypothesis
was correct. The pinto beans did germinate in the green tea. Twenty-four out of 30 pinto beans sprouted in the green tea,
and 28 out of 30 pinto beans sprouted in the water. The green tea didn’t really have much of an effect on the pinto beans
because they grew quite the same in the water. The green tea and water both were great environments for the dried pinto
beans. ���
Demiana Sidrak and T. Miller (teacher)
Holmes International Middle School 9351 Paso Robles Ave.Northridge, CA 91325
Rachel Aquino and T. Miller (teacher)
3562 Holmes International Middle School 9351 Paso Robles Ave.Northridge, CA 91325
3561
VNY_SciJrnl_interior 9/14/12 10:24 AM Page 31

32 Van Nuys Airport & California State University, Northridge
Do Teenagers Have a Better Memory Than Adults?
The purpose of this experiment was to determine whether teenagers have a better memory than adults. My hypothesis was
that teenagers would have a better memory than adults. I tested 40 people, 20 teenagers and 20 adults. I set out 10 items
on a table: a shoelace, nail polish, perfume, lip gloss, a pin, an eraser, a pencil box, a ruler, tape and a lead pencil. I gave
them 30 seconds to observe the objects. After the 30 seconds I gave them another 30 seconds to write the items they
remembered down on a paper. I wrote down their age and wrote the number of correct and incorrect items. I set the ages
in two different categories: adults and teenagers. I calculated the data from each. To my calculations the teenagers’ average
of correct items was 7.4. The adults’ average of correct items was 6.6. My hypothesis was correct. Teenagers have a better
memory than adults. ���
The Strongest Shaped Column
This experiment’s purpose was to discover which of the selected shapes of cardstock hollow columns is strongest. A machine
was used to slowly put pressure on each column. The yield strength of each column was measured by a scale. Each shape
was tested 5 times with similarly made columns. The average yield strength the circle-shaped column could withstand was
52.6 lbs. The average yield strength the triangle-shaped column could withstand was 24.8 lbs. The average yield strength
the square-shaped column could hold was 32.8 lbs. The pentagon-shaped column could withstand 36 lbs. In conclusion,
I observed that the circle-shaped column was the best of the 4 shapes chosen to withstand pressure. ���
Diana Cortez and T. Miller (teacher)
3563 Holmes International Middle School9351 Paso Robles Ave.Northridge, CA 91325
D.A. Aguilar and G. Zem (teacher)
3564 Ernest Lawrence Middle School Magnet10100 Variel Ave.Chatsworth, CA 91311
Growth of Rosa ssp in Substances Other Than Water
This study examined the question of growing Rosa ssp (rose[s]) in substances in high sugar, vitamin and mineral content.
Individually, roses were put in Gatorade, vitamin water and apple juice – 250 ml each – for two weeks in sunlight. Each
experiment was repeated three times. The roses grown in vitamin water survived and began to bloom in all three trials. The
roses grown in Gatorade survived but showed no signs of blooming. The apple juice roses did not grow, and died by the
3rd-6th day. The apple juice also produced mold. The results show that vitamin water was the best substance out of all three
to be used as a high-sugar alternative to water when growing roses. ���
Shannan McCauley and D. Shah (teacher)
3565 Portola Magnet Center18720 Linnet St.Tarzana, CA 91356
VNY_SciJrnl_interior 9/14/12 10:24 AM Page 32

33New Journal of Student Research Abstracts 2007
Does Electrocuting Soybean Seeds Defer or Postpone Their Germination Rate?
The objective of the experiment was to determine what the effects of electrocuting soybeans would be. I hypothesized that
the soybean seeds would stop growing. Soybeans are a species of legumes (plants with tiny rows of seeds inside) that are
native to Eastern Asia. The materials used were 12 plastic trays, one plastic syringe, two nine-volt batteries, cotton balls, six
blue and red electrical wires, and 20 soybean seeds (half the seeds for the experiment and half for the control). The 12
plastic trays were filled with cotton balls that were dampened using the plastic syringe, and then seeds were planted in the
cotton. Electrical wires were used to connect the nine-volt batteries to the seeds. The blue wires had a positive charge and
the red wires had a negative charge. I repeated a similar procedure with the control, except without the use of batteries.
I checked the control and the experiment for a period of 15 days. After three days of observation, the cotton became light
blue in color. I realized that the blue hue was copper sulfate. Copper sulfate is a poisonous blue crystalline with potential
for toxicity. When the experiment came to a finish, several seeds sprouted in the control; however, no sign of germination
was in the experiment. The experiment concluded that the copper sulfate was what killed the plants and stopped them from
germinating. This proved my hypothesis to be correct: Electrocuting soybean seeds not only defers their germination rate,
but it also stops them from growing completely. ���
The Effects of Salt and Sugar on a Propane Flame
This study tested whether or not salt and sugar can change the color of a propane flame, causing it to turn yellow. A propane
flame was used to test the color of the flame in this experiment, and the original blue color of the flame was the control.
Three wires were coated with granulated sugar, brown sugar and salt. Afterwards they were inserted into the fire using
protective gloves. After waiting a few seconds, the flame turned yellow for both the granulated sugar and the brown sugar,
but remained the same once the salt was inserted. In the end, the hypothesis, which stated that the flame would change
when the sugars were inserted and not with the salt, was true. ���
Omid Golmohammadi and D. Shah (teacher)
3566 Portola Magnet Center18720 Linnet St.Tarzana, CA 91356
Lizza Ranit and T. Miller (teacher)
3567 Holmes International Middle School9351 Paso Robles Ave.Northridge, CA 91325
Do Onychiuridae encarpatus, a Type of Collembola, Prefer Yeast or Fish Food?
The purpose of this experiment was to see which food Onychiuridae encarpatus preferred to eat so they could be kept in
captivity longer. I believed they would eat more of the fish food. I collected leaf litter and put it in a Tullgren Funnel. This
system was used to separate the collembola from the leaves. Then I made 2 collembola environments by mixing 9 parts
plaster of Paris, 1 part charcoal and water. I allowed it to dry for 1 week. I colored some of the yeast blue by using food
coloring. I placed 14 collembola in each container and scattered blue yeast and fish food into the environment. I counted
what food the collembola preferred by observing the color of their intestines. The collembola that ate the fish food had red
guts and the collembola that ate the yeast had blue guts. The collembola were transparent so I could see the color of the
intestines. The results showed almost equal amounts of fish food and yeast were eaten by the collembola. My hypothesis
was wrong. The collembola like both the fish food and the yeast. ���
Chenoa Gomes and T. Miller (teacher)
3568 Holmes International Middle School9351 Paso Robles Ave.Northridge, CA 91325
VNY_SciJrnl_interior 9/14/12 10:24 AM Page 33

34 Van Nuys Airport & California State University, Northridge
Do Cold Temperatures Affect Lepidocyrtus northridge?
The purpose of this experiment was to see if the cold (64 F or lower) temperatures would affect Lepidocyrtus northridge,
an eyeless species of collembola. I hypothesized that collembola were harmed by living in a lower temperature. Collembola
are small arthropods that live in leaf litter and soil. To test my hypothesis, I made 4 homes in 4 petri dishes for the
collembola. In each dish, I placed 9 parts plaster of Paris, 1 part charcoal and water. Their homes were allowed to dry com-
pletely. I labeled 2 petri dishes cold and 2 petri dishes warm. Then I put 10 collembola in each dish. The 2 dishes marked
warm were placed in a room on a bookshelf in the house. The 2 petri dishes marked cold were placed on a windowsill next
to an open window. I used a hand lens to observe and count the collembola. I fed and watered them daily. The experiment
lasted for 14 days. In the warm temperature 45% of the adults and 35% of the babies died. In the cold 60% of the adults
died and 35% of the babies died. My hypothesis was correct: More collembola survived in a warmer environment. ���
How the Loss of One Sense Can Affect the Others
I conducted a project to get a better understanding of how senses (particularly scent and taste) interact with each other.
I tested 25 individuals to make my understanding better than what I knew. They first had to eat five food samples while
having their noses plugged and their eyes blinded, and guessing what each item was, and the same thing was repeated with
the same food items except with just their eyes covered. This allowed me to see the difference of their taste buds with noses
plugged vs. without. It turned out that when they had their noses covered it was more difficult to guess the food items than
without. Not one individual guessed everything correctly, although some were very close. This project helped me clarify how
scent and taste interact with each other and even now, not being able to smell well with this cold I’m currently going
through, I notice it a lot better than I did before I accomplished this project. ���
Pedro Campo and T. Miller (teacher)
3569 Holmes International Middle School9351 Paso Robles Ave.Northridge, CA 91325
Donna Kim and G. Zem (teacher)
3570 Ernest Lawrence Middle School Magnet10100 Variel Ave.Chatsworth, CA 91311
Do Lemons or Sugar Affect the Sweet Taste of Soda?
This experiment states a general change in perception of the “sweet” taste in soda. The variables are sugar cubes and
lemons, and the constants are the soda balanced out by saltines and water. The questions approached in the experiment
are (1) how does sugar affect the taste of soda, (2) how does lemon affect the taste of soda, and (3) can there be
imbalances in how your taste buds react to the same thing (soda) combined with different things (variables)? The results of
the experiment are favorable, showing that there can be taste imbalances. ���
Alexandra Fitzmorris and D. Shah (teacher)
3571 Portola Magnet Center18720 Linnet St.Tarzana, CA 91356
VNY_SciJrnl_interior 9/14/12 10:24 AM Page 34

35New Journal of Student Research Abstracts 2007
Effects of Bean Size on the Growth of Bean Plants
This experiment tests if the size of a bean seed will affect at all the growth of the later developed plant. Two groups of 10
pots, each group containing 5 large seeds and 5 small, were planted on January 9, 2006. Each pot was filled with the same
amount of soil and watered with the same amount of water on a daily basis. The sprouting times of all the seeds were
recorded and the plant heights were measured every few weeks. Pictures were taken periodically to provide a visual record
of the growth of the plants. In the end of the experiment all of the plants grown from small seeds were smaller than the
ones grown from large seeds. These results suggest that the larger the seed, the larger the plant we develop and grow. ���
What Is the Best Nontoxic Alternative to Typical Toxic Cleaners?
This experiment examined the effectiveness of nontoxic alternatives. Baking soda diluted with water, lemon juice diluted
with water, milk, salt and distilled white vinegar solution, salt and water solution, and distilled white vinegar diluted with
water were tested. Water was tested for a control. Their cleaning effectiveness was tested on coffee, ink, lubricant and mud
stains on carpet and grout. Their cleaning effectiveness was rated on a scale of one to five, one being the least effective and
five being the most effective. A sample of each type of stain on each surface was a control. Milk was the best cleaner.
The milk protein casein resembles the surfactant micelle, giving it cleaning properties. Lemon juice was the second-best
cleaner. Its high acidity gives it cleaning ability. ���
Danielle Feuer and D. Shah (teacher)
3572 Portola Magnet Center18720 Linnet St.Tarzana, CA 91356
Brandon Berg and D. Shah (teacher)
3573 Portola Magnet Center18720 Linnet St.Tarzana, CA 91356
Effects of Carbon Dioxide on the Temperature of Running Water
This study examined the question of whether increased amounts of carbon dioxide (CO2) affected the temperature of
running water. A water pump was placed into a basin of water and the temperature was measured after 5, 10 and 15
minutes without pumping, with pumping, and with pumping and constant CO2 addition. The CO2’s temperature was also
measured at the same intervals. The tests were done in the following order: H2O (no pump), CO2, H2O (with pump),
CO2H2O, and H2O (with pump; checking results). The temperature rose steadily from the beginning of the tests to the
end. This suggests that CO2 has no effect on the temperature of running water. Instead, the friction inside the tube caused
the warmth. ���
Aviv Gilad and D. Shah (teacher)
3574 Portola Magnet Center18720 Linnet St.Tarzana, CA 91356
VNY_SciJrnl_interior 9/14/12 10:24 AM Page 35

36 Van Nuys Airport & California State University, Northridge
Effects of Boiling, Freezing, Puréeing and Adding Sugar on anOrange’s Balance of Vitamin C
This study examined the effects of boiling, freezing, puréeing and adding sugar on an orange to see if the amount of Vitamin
C would be lowered. After the control and variable oranges were treated, 9 cm of the control and variable oranges in height
were squeezed into 5 test tubes labeled 1 through 5. Then drops of indophenol_blue were added to each of the test tubes
and the number of drops was recorded. Each experiment was repeated 3 times. The control group displayed that the amount
of Vitamin C in normal oranges would take 74 drops of indophenol_blue in average to make the juice clear or pale yellow.
For other variables to be pale yellow, the boiled oranges took 64 drops, frozen oranges 74, puréed oranges 69, and sugar-
added oranges 71 drops in average. Only a slight difference between the number of drops shows that Vitamin C hasn’t been
destroyed in any of the variables. ���
Earthquakes, Faults and Plate Tectonics
Purpose: For my science fair project on earthquakes, faults and plate tectonics. I’ve always been fascinated with earthquakes
and what causes them. Many people think of earthquakes as violent shakings of the ground but they don’t know how they
happen.
Hypothesis: I am making an “Earthquake Machine.” I think that with more weight, more pressure will be added to the spring
because of the greater weight that has to be pulled. I think it will be harder to pull and will add more resistance.
Procedure:
Step 1: Get a block of wood with sandpaper on bottom.
Step 2: Place a weight (rock) on top of block.
Step 3: Reel in string that is connected to spring and block.
Step 4: Observe what happens as you continue to reel the string.
Results: After testing my “Earthquake Machine,” my hypothesis was right. I discovered that since the weight’s greater, stress
builds up. After having the stress build up, the spring relieves the stress by suddenly pulling the block of wood forward.
In the real world, this snap would be an earthquake. When a constant rate of stress is added to the block (along with more
time), the force of the energy being released is a lot greater.
Conclusion: The results helped to conclude that the longer faults are fighting to get past each other as more stress is built
up. With a constant rate of stress (and more time added), the strength of the earthquake will be much greater. ���
Jimin Hong and D. Shah (teacher)
3575 Portola Magnet Center18720 Linnet St.Tarzana, CA 91356
Stephanie Aguirre and G. Zem (teacher)
3576 Ernest Lawrence Middle School Magnet10100 Variel Ave. Chatsworth, CA 91311
VNY_SciJrnl_interior 9/14/12 10:24 AM Page 36
37New Journal of Student Research Abstracts 2007
How Do the Differences in Gauges of a Magnet Wire Affect the Electromagnetic Field?
To demonstrate that the lower gauge wire (thicker wire) makes a better electromagnet than a higher gauge wire (thinner
wire) with the same number of turns, the experiment is performed using a nail wound with three magnet wires consisting
of three different gauges. Paper clips are used to measure the strength of each electromagnet. Nine trials are performed,
with each trial recording the maximum number of paper clips picked up by each electromagnet. The results agree with the
hypothesis that the electromagnet wound with a lower gauge wire is a stronger magnet. ���
Rusting of Copper in Salt and Distilled Water
This study was to examine if pennies (copper) rust faster in saltwater or distilled water. There were 1/8 liters of distilled
water and 1/8 liters of saltwater in a cup with a penny in each. Distilled water has no minerals or any other substances in
it. Saltwater contains electrically charged particles, which are called ions. The electrically charged particles make the salt-
water conduct electricity easier. Saltwater contains the elements sodium (Na) and chloride (Cl), which are numbers 11 and
17, respectively. Copper on the other hand is element number 29. The purpose is to observe if saltwater or distilled water
has any effect on copper. The saltwater would make the penny rust faster because the saltwater contains ions that are
electrically charged. Salt in the water would have some effect on the copper because it would react in some sort of way. ���
Josephine Ung and D. Shah (teacher)
3577 Portola Magnet Center18720 Linnet St.Tarzana, CA 91356
Matthew Kim and D. Shah (teacher)
3578 Portola Magnet Center18720 Linnet St.Tarzana, CA 91356
Effect of Cold Storage on Pinto Bean Germination
This study examined the possible involvement of cold storage in the germination of pinto beans. Pinto beans were stored
in a refrigerator for one to three days and then planted. Cold storage reduced the rate of germination for the one-day, two-
day and three-day storage to 60%, 50% and 40%, respectively, while control values were at 80%. The results suggested that
cold storage reduces the rate of germination. ���
Alan Yang and D. Shah (teacher)
3579 Portola Magnet Center18720 Linnet St.Tarzana, CA 91356
Under What Conditions Do Bacteria Grow Best?
This study examined the ideal moisture and temperature for bacteria growth. Bacteria were grown in petri dishes in moist,
dry and normal conditions for 48 hours, and under warm (~32˚ C), cold (~4˚ C) and room temperatures for 48 hours.
Each of the two different experiments was repeated three times. The results for the moisture test were unclear, but the
outcome of the temperature test indicated that at about 32˚ C, bacteria grew much better than when grown at room tem-
perature. An environment with a temperature of ~4˚ C reduced the growth rate of the bacteria dramatically in comparison
to bacteria grown under room temperature. The results indicated that bacteria grew best under a warm temperature, but it
did not reveal the ideal moisture for bacteria. ���
Ben-han Sung and D. Shah (teacher)
3580 Portola Magnet Center18720 Linnet St.Tarzana, CA 91356
VNY_SciJrnl_interior 9/14/12 10:24 AM Page 37

38 Van Nuys Airport & California State University, Northridge
Which Company Gum Has the Longer Flavor?
This science fair project examined the question of which company gum had the longer flavor. After long tedious hours of
chewing four different gums ten times, Orbit came out with the longest time with the flavor, and then came Winterfresh,
Extra and Juicy Fruit. It seems that the best-tasting gum always ends up being the one with the shortest flavor time. I learned
many things from this science project that I thought were right but were wrong. Because Orbit had the most sugar alcohol,
Orbit had the longest flavor. ���
Who Follows Directions Better? Is It Male and Female Adults or Male and Female Children?
The purpose of this experiment was to see if male or female adults or children followed directions better. I began my
experiment with making a survey/questionnaire that included twelve everyday questions (i.e. what is your age?). At the top
was a set of directions such as, "Do not write number seven in ink." I wanted to see what sex or what age groups would
follow more directions. I then had my friends and family fill out the survey. Having all my friends and family was not enough
people, so I had my parents take some surveys to work. Fortunately, my father is a teacher so I got plenty of children to fill
out my survey. When I discovered I needed more adults I went to the mall and began to survey random strangers to
discover rudeness from most people and if I was lucky kindness from a few. Once I had a total of over two hundred surveys
I chose one hundred and four. I then separated them into sections by age and who followed the directions. My results were
as follows: Out of men and women adults, men followed directions better; and out of male and female children, females
followed directions better. Curious to find out who followed directions better out of the two higher categories, I compared
the female child and adult male. Female children showed to be better at following directions by a very close number.
I wasn’t very surprised by the results. Being a female child I can understand how we would be able to follow
more directions. ���
Alex Lee and G. Zem (teacher)
3581 Ernest Lawrence Middle School Magnet10100 Variel Ave. Chatsworth, CA 91311
Talara Araujo and G. Zem (teacher)
3582 Ernest Lawrence Middle School Magnet10100 Variel Ave.Chatsworth, CA 91311
Effect of Video Games on the Heart Rate
This experiment was a study of how video games could possibly affect the human heart rate. Players played for 5 minutes
and were trialed 3 times after a few minutes of rest (at least 5 minutes). The players also differed in moods, ages and skill
in video games. The game system that was used was the Nintendo DS (Super Mario World 3). When results were totaled
up, it showed a significant difference from each heart rate (resting, during), and also different from each player. To me this
concluded that the level of excitement, and lack of interest in the game itself, affect the increase and decrease of heart rates.
It also showed the difference between age and gender. ���
Rafael Betita Jr. and D. Shah (teacher)
3583 Portola Magnet Center18720 Linnet St.Tarzana, CA 91356
VNY_SciJrnl_interior 9/14/12 10:24 AM Page 38

39New Journal of Student Research Abstracts 2007
Effect of TV Watching on Math Scores
The objective of this experiment was to determine whether or not watching television while studying for a math test affects
the test score. To do this experiment, a group of kids was taught a math lesson, and while studying for 20 minutes and doing
practice problems, half studied in a quiet atmosphere while the other half watched television. This was repeated three times
with three different lessons and three corresponding tests. The same people watched television for all three lessons. The
results showed that people who did not watch television had the better test scores, suggesting that studying for a math test
requires full attention, and the brain is not capable of seeing and remembering two things at once. ���
Do Video Games Affect Your Heart Rate?
Here I give my thoughts about possible effects of video games on the heart rate. Experiments should be performed to learn
if my hypotheses are correct.
Throughout the process of playing video games, you could be happy, mad, sad or have different facial expressions, because
you could or couldn’t beat the game or for other reasons. When you are excited or mad your heartbeat beats faster because
you want to beat this person or you are just straight frustrated because you can’t beat this person, which causes your heart
rate to go faster. But, if it’s boring and you’ve been playing this specific game over and over again, then that’s a different
story. Different ages of a person will make the person have different heartbeats because you could be old and not energetic,
but young people like teenagers are usually energetic and mostly into the game. ���
Sue Won and D. Shah (teacher)
3584 Portola Magnet Center18720 Linnet St.Tarzana, CA 91356
Rebecca Rusheen and D. Shah (teacher)
3586 Portola Magnet Center18720 Linnet St.Tarzana, CA 91356
Most Popular Type of Hot ChocolateThis experiment examined the overall preference of middle school and high school students when given four different kinds
of hot chocolate. Twenty students were given four different types of hot chocolate: generic with milk, generic with water,
name brand with milk, and name brand with water. More students preferred name brand hot chocolate mix made with milk
above any other option: 60% of students preferred name brand with milk; 25% of students preferred name brand with
water; 15% of students preferred generic with milk; and 5% of students preferred generic hot chocolate mix made with
water. ���
Janna Lowensohn and D. Shah (teacher)
3585 Portola Magnet Center18720 Linnet St.Tarzana, CA 91356
How Does a Person’s Body Temperature Vary During the Day?This experiment was done to see if a person’s body temperature varies during the day and by doing certain activities. I meas-
ured my body temperature every hour for three days straight! Then I wrote down what I did the previous hour that might
have affected the temperature change. Last, I compared the temperatures that I took for three days and made conclusions
on what different activities caused an increase or decrease in my body temperature. The results I saw were that when I
moved around a lot, my body temperature was lower than the average (98.6° F). I also noticed that when I woke up my
body temperature was really cold but when I was about to go to sleep, it was pretty warm. I learned a lot of new things
from this experiment that I didn’t know about before. ���
Judy Lim and G. Zem (teacher)
3587 Ernest Lawrence Middle School Magnet10100 Variel Ave.Chatsworth, CA 91311
VNY_SciJrnl_interior 9/14/12 10:24 AM Page 39

40 Van Nuys Airport & California State University, Northridge
Water Sources and Their Reliability
This study was taken to examine the reliability of water sources and bottled water. Ten ml water samples were taken from
Arrowhead, Yosemite, tap, distilled (control), a lake and a river and were observed. After observation by eye and microscope
the samples were put in a sheep’s blood agar and sat in an incubator and were growing for 5 days each. The results were
then averaged and put in a chart and then they were studied. The results in order of cleanest to dirtiest were as follows:
distilled, Arrowhead, Yosemite, tap, lake and river. The hypothesis was off, but the results showed what to drink and what
not to drink. The conclusion was that people are better off drinking distilled, but Arrowhead, Yosemite and tap are okay
to drink. ���
Effects of Vitamins on Cut Carnations
This experiment tested whether vitamins inserted into a cut carnation’s water supply would affect the length of time before
the carnation died. The carnations were placed in cups with Vitamin C, B-6, B-12 or no vitamins. After a month of
observation, the Vitamin C carnation lasted 14 to 15 days, the B-12 carnation lasted about 30 days, the B-6 carnation
lasted about 28 days, and the control lasted for 29 days. The results suggest that Vitamin C negatively interacts with
carnations more than the other vitamins tested. ���
Trevor Frese and D. Shah (teacher)
3588 Portola Magnet Center18720 Linnet St.Tarzana, CA 91356
Joshua Srikureja and D. Shah (teacher)
3590 Portola Magnet Center18720 Linnet St.Tarzana, CA 91356
Melting Points of Chocolates Containing Different Amounts of Cocoa Content
This study tested whether the amount of cocoa in chocolate affects the rate at which it melts. Four different types of
chocolate were tested. Each different type of chocolate was broken up into pieces from a 28.35 gram piece of chocolate and
was melted in water at 85 C. The melting rate was timed and recorded for each chocolate. The test was repeated three times
for each of the four types of chocolate with different cocoa contents. The results suggested that the type of chocolates with
lower cocoa content melted faster than the ones with higher cocoa content. ���
Courtney Kessler and D. Shah (teacher)
3589 Portola Magnet Center18720 Linnet St.Tarzana, CA 91356
The Effect of Tobacco on FernsThis study examined the question of if a plant (ferns) would survive under the influence of tobacco. The tobacco was soaked
in 100 ml of boiling water for 24 hours, and after that the experimental plants were watered with this tobacco-soaked water.
The suspected conclusion was that the plants would die in 14 days, 2 weeks. The plants were watered daily for 2 weeks and
shockingly the plants remained alive, including half of the original leaves either brown or missing. ���
Nancy Yu and D. Shah (teacher)
3591 Portola Magnet Center18720 Linnet St.Tarzana, CA 91356
VNY_SciJrnl_interior 9/14/12 10:24 AM Page 40

41New Journal of Student Research Abstracts 2007
Effects of Rock Music on Plants
This experiment tested the question of “Does rock music help plants grow?” India Mustard plants were grown in mini green-
houses for three weeks. They were exposed to blue, AGRO-LITE, 60-watt, 120-volt plant lights for eleven hours a day and
were put in separate rooms to prevent incorrect results due to mixing of control factors. The experimental batch was exposed
to rock music through a pair of RadioShack personal headphones connected to a stereo put on the radio station FM 106.7
KROQ. The test subjects’ progress was recorded and put into charts. Both control and experimental groups were charted
according to row. The experimental group’s charts specified the plants that were closest to the headphones with asterisks.
The experiment was conducted three times. The results suggest that although rock music did make plants grow faster, the
pattern in which the plants grew was erratic and only a couple plants grew above average. The control group’s growth rate
and pattern were much more uniform and had very few inconsistencies. ���
Effects of Onions and Garlic on People Vulnerable to Sickness
This experiment inspected the idea of onions and garlic helping people 11-13 years of age to not get sick during winter and
early spring. The volunteers used in the experiment were males and females about the same age. Half of the volunteers
were given onion to eat for one week. The other half of equally vulnerable volunteers was given garlic to eat for one week.
Each onion and garlic experiment was repeated together five times. The result was that the volunteers who generally got
sick every week of winter were not getting sick at all and showed almost no symptoms of sickness. ���
Mojdeh Tarighat and D. Shah (teacher)
3592 Portola Middle School18720 Linnet St.Tarzana, CA 91356
Reid Taguchi and G. Zem (teacher)
3595 Ernest Lawrence Middle School Magnet10100 Variel Ave.Chatsworth, CA 91311
Effectiveness of Plane-to-Propeller Ratios
This experiment tested if there was a connection between propeller size/plane size ratio and the distance that the plane
could fly. Two planes were constructed, one larger and one smaller, of equal materials and ratios. One set of propellers was
made so that both planes would use the same propellers and eliminate what impact error would make in the experiment.
From data collected, the hypothesis was that the smaller plane would fly farther because of a higher power/weight ratio.
Each plane was tested four times. The larger plane flew for an average of 651.5 cm. The smaller plane flew for an average
of 534.5 cm. Results show that the hypothesis is wrong and that a more stabilized plane is favorable. ���
Hongyi Xing and D. Shah (teacher)
3594 Portola Middle School18720 Linnet St.Tarzana, CA 91356
Soda or Tea?
For my experiment, I decided to test whether different types of liquid affect the outcome of a plant’s growth when watered
by tea and soda. I planted three pots: one for water, one for tea and one for soda. I grew them for about two weeks,
observing and recording the data. I repeated this procedure two more times for a total of three trials. In the end, tea had
grown the best, followed by water and then soda. This proved that the dissolved tea leaves in the tea help fertilize the soil,
thus helping the plant grow faster and better than water. ���
Virginia Chan and G. Zem (teacher)
3593 Ernest Lawrence Middle School Magnet10100 Variel Ave.Chatsworth, CA 91311
VNY_SciJrnl_interior 9/14/12 10:24 AM Page 41

42 Van Nuys Airport & California State University, Northridge
Corrosive Effects of Drinks on Teeth
My purpose in this experiment was to find out which liquids wore down teeth faster, or at all. My hypothesis was that the
sodas would have the most effect on the teeth. I said orange juice would also have a big effect on its tooth. I thought water
would not have any effect on its tooth. I thought the tooth in milk would get whiter and harder. I thought the tooth in mouth-
wash would turn a shade of red. The way I did research was find some other experiments like this online, and look at what
they did, and come up with my own hypothesis. I also checked the teeth on set days. The results I got did prove most of my
hypothesis right. I also learned that a liquid won’t always stain the tooth that is soaked in it. Another important fact that
I learned is that Diet Coke can be worse for your teeth than regular Coke. My results mean that drinks with more sugar are
better for your teeth than drinks with more acid. This was also one of the important facts that I learned. This shows that
while not all acids burn through your skin, they can heavily damage your teeth. My results give me a good reason to try more
drinks next time, including Gatorade, flavored water, lemonade and apple juice. ���
Relationship Between Sunspot Number and the Earth’s Magnetic Field
This study examined the possible correlation between sunspot number and the deflection component of the Earth’s
geomagnetic field. Sunspot measurements were taken with a Sunspotter® daily, and magnetometer measurements were
taken with a simple bar magnet magnetometer at 10 p.m. nightly for two months. After comparison of the final data,
it was found that the higher the sunspot number, the stronger the perturbation in the Earth’s magnetic field, and vice versa.
This suggests that there is a positive association between sunspot number and the deflection component of the geo-
magnetic field. ���
Travis Webster and G. Zem (teacher)
3596 Ernest Lawrence Middle School Magnet10100 Variel Ave.Chatsworth, CA 91311
Irene Hsu and D. Shah (teacher)
3597 Portola Magnet Center18720 Linnet St.Tarzana, CA 91356
Do Albino Mice Prefer Different Kinds of Food Than Regular Mice?
This question is examining the differences in the senses between albino mice and regular mice and further examining the
sense of taste. To begin, one of the albino mice is placed inside a feeding cage with lettuce, a raisin, a carrot and pear. The
feeding results are recorded and the process goes on through 3 more mice. After that’s over, the same thing happens in the
afternoon and evening. The process has to wait a week before being performed again and then a week after that for a 3rd
experiment day. The ending result was that the albino mice preferred the lettuce and the regular mice preferred the raisin.
In other words, they preferred different foods. ���
Warren Getlin and D. Shah (teacher)
3598 Portola Magnet Center18720 Linnet St.Tarzana, CA 91356
VNY_SciJrnl_interior 9/14/12 10:24 AM Page 42
43New Journal of Student Research Abstracts 2007
Dissolution of Gummy Bears
The purpose of this experiment was to find how different liquids affect the dissolution of something. I took gummy bears
and cups and the gummy bears were placed into the cups with the designated labels. Then I recorded what happened for
9 days. I did this experiment 3 times for accuracy. As a result my hypothesis that vinegar would take fewer days to dissolve
the gummy bears faster was true. In conclusion, I learned more about the digestive system. ���
Will Different Sized Gears Change Extension Strength?
The complex mechanism is the simple machinery knot synthesis. Simple machinery includes pitch, wedge, gear, wheel axle
and pulley that are used in everyday objects such as the bicycle, cars, clocks, etc. In this experiment, a simple device
contains one motor, one wheel axle connecting to an object with a string, two batteries (AA 1.2V 800 mAh rechargeable),
and a trapezoid wood stage. The device works like an elevator, pulling objects up by means of a motor with different sized
gears. While the device pulls the object up, it will be timed and the time will be used as the result for the experiment
conclusion. The variable in this experiment is using different sizes of gears connecting the motor to the wheel axle in order
to pull the object, and the control setup is the same sizes of gears rotating each other in order to pull the object up. The
hypothesis of this experiment is if a larger gear is used to rotate a smaller gear, an object will be pulled up faster than if a
smaller gear is used to rotate a larger gear. This experiment proves that if a larger gear is used to rotate a smaller gear, the
extension is stronger, resulting in a faster speed than when a smaller gear is used to rotate a larger gear. This result proves
that the hypothesis in this experiment is correct. A possible explanation for this result is that a smaller gear will turn many
times for every one turn of a larger gear. Therefore, if a larger gear is used to rotate a smaller gear, the smaller gear will turn
many times so it will be faster than if a smaller gear is used to rotate a larger gear. ���
Johnny Wang and D. Shah (teacher)
3599 Portola Magnet Center18720 Linnet St.Tarzana, CA 91356
David Kim and G. Zem (teacher)
3600 Ernest Lawrence Middle School Magnet10100 Variel Ave.Chatsworth, CA 91311
How Do Different Substances Affect Plant Growth?
This study looked at plant growth and the different substances that can affect plant growth in a positive or negative way.
Five ivy plants were watered every two to three days, and each was watered with a different substance, either milk, water,
Gatorade, orange juice or Max Cola. They were then observed to see any changes. The ivy plants watered with the Max Cola
and water had a positive reaction, the plants watered with orange juice and Gatorade had an average reaction, and the plant
watered with milk had a negative reaction. The results suggest that the substances with artificial or added sugars increased
plant growth, because the artificial sugar acted as a stimulant to increase plant growth. Likewise, the substances with
natural sugars decreased plant growth, because the natural sugars made the liquid thicker, and it was not as easily absorbed
into the soil of the plants. ���
M. Rader and G. Zem (teacher)
3601 Ernest Lawrence Middle School Magnet10100 Variel Ave.Chatsworth, CA 91311
VNY_SciJrnl_interior 9/14/12 10:24 AM Page 43

44 Van Nuys Airport & California State University, Northridge
Lung Wars: Will Boys or Girls Hold Their Breath Longer?
This study examined the question of which gender, boy or girl, could hold its breath longer. Six subjects were tested (3 boys,
3 girls) to hold their breath and be timed. Each subject repeated this 4 times. Girls held their breath longer 2 out of 4 times,
or 50% of the time. Boys held it longer 1 out of 4 times, or 25% of the time. There was a tie between the two genders for
the best time 1 out of 4 times, or 25% of the time. The results suggest that both genders are about the same when it comes
to holding their breath. ���
Flight Ops: Paper Airplanes
This experiment compared the difference in distance that a paper airplane flies depending on the type of airplane. I chose
this topic because I am very interested in flight. I made a total of three different plane types varying from each other in wing
length and design. Each plane was thrown at the same speed and then I recorded the distances. I found that plane “A” flew
the farthest, followed by plane “C” and then plane “B.” This showed that the skinniest and most aerodynamic plane, “A,” will
fly farther than a glider and a mix of glider and speeder. ���
Edgard Ruiz and D. Shah (teacher)
3602 Portola Magnet Center18720 Linnet St.Tarzana, CA 91356
Craig Melancon and G. Zem (teacher)
3604 Ernest Lawrence Middle School Magnet10100 Variel Ave.Chatsworth, CA 91311
How Sleeping Affects GPA
I wanted to determine whether sleeping affects the GPA. To do this, I passed out surveys to every student in the eighth-grade
magnet. This was done so all the students were graded equally. If I had surveyed other students, they would have had
harder or easier teachers. After organizing my data, I made a graph showing the correlation between GPA and sleep.
I created a scatter plot and its respective regression line, which showed there is hardly any correlation between sleeping and
GPA. However, there are also many variables that might have affected the data, such as the different amounts of sleep
needed for each person and students not responding to the survey. ���
K. Huang and G. Zem (teacher)
3603 Ernest Lawrence Middle School Magnet10100 Variel Ave.Chatsworth, CA 91311
Biodiesel: A Sustainable Fuel Alternative
My research project was about the brand new energy alternative, which is biodiesel. Biodiesel is a fast-growing alternative
fuel, which can in part replace our dependence on fossil fuels. With small amounts of common chemicals, which
I demonstrated in my project, used cooking oil can be transformed into a viable and economical fuel source. This new uplift
in fuel technology will greatly help America’s economy, but moreover will be one contributor to saving the ozone and
slowing global warming. ���
Joe Davidson and G. Zem (teacher)
3605 Ernest Lawrence Middle School Magnet10100 Variel Ave.Chatsworth, CA 91311
VNY_SciJrnl_interior 9/14/12 10:24 AM Page 44

45New Journal of Student Research Abstracts 2007
Entropy and the Second Law of Thermodynamics
The purpose of this study was to construct a Rubber-Band Heat Engine to demonstrate that rubber contracts when heated
based on entropy and the Second Law of Thermodynamics. There were three parts that were created to make the Rubber-
Band Heat Engine: the wheel, the axle and the wheel mount. When built, half of the wheel was exposed to the heat of a
lamp. When heated for 3-5 minutes, the wheel rotated slowly until the other half of the wheel was exposed to the heat. This
kept on repeating every 3-5 minutes. In conclusion, the side of the rubber band wheel that was exposed to the light
contracted while it absorbed the heat from the lamp. This caused the rubber band to pull one edge of the wheel closer to
the axle, which then was not heavier than the other side and the wheel had somewhat rotated. These results proved that
rubber contracts on heating. ���
Grass Growth Inside and Out
This experiment showed which grass grows best for what that person needs. I had plants inside and out: one outside with
dirt, two outside with just soil, one outside with growth chemicals, one inside with growth chemicals, and one inside with
just soil. Everyday I watered them at 4 p.m. On Sundays I gave the chemicals to the two I gave the chemicals to on the first
day. The ones outside were a darker shade of green. They didn’t grow as much or as fast but were healthier. They all turned
out to be around the same height at the end. Inside the temperature was controlled so it affected the growth. The plants
grew faster and bigger but not as healthy. ���
Robert Harris and G. Zem (teacher)
3606 Ernest Lawrence Middle School Magnet10100 Variel Ave.Chatsworth, CA 91311
F.P. Hernandez and G. Zem (teacher)
3608 Ernest Lawrence Middle School Magnet10100 Variel Ave.Chatsworth, CA 91311
Comparison in Growth Between Pig and Lamb
This experiment compared the difference in growth between a pig and a lamb. I got the idea for this experiment last year
at the LA County Fair. I measured the growth by weight over a set period of time. Thanks to Canoga Park F.F.A. I had plenty
of pigs and lambs to monitor. As a result of my experiment I concluded that pigs grow faster than lambs at a compared rate
of pigs 3 lbs. per day/lambs 1-1.5 lbs. per day. ���
Danny McEldowney and G. Zem (teacher)
3607 Ernest Lawrence Middle School Magnet10100 Variel Ave.Chatsworth, CA 91311
VNY_SciJrnl_interior 9/14/12 10:24 AM Page 45

46 Van Nuys Airport & California State University, Northridge
Inelastic Car Collision and Analysis
This project is to demonstrate how dangerous driving can be. There are many controlling parameters in a car crash like tire
friction, weight, speed and safety features of the car. A specific example of a pick-up crashing into the side of a stationary
sedan is used to demonstrate what happens in a typical car collision. This shows that cars driving even on the city street
could also kill people. It is dangerous to drive too fast on the freeway, especially when the driver loses control. Most car acci-
dents are deadly. People should always take extreme caution in driving. Always buckle the seatbelts. The analysis used typ-
ical car specifications to illustrate under what speed and road conditions the drivers would die based on published actual
car collision sequences. ���
Effects of Soda on Plant Growth
The purpose of this project was to figure out how different types of soda affect plant growth. My hypothesis was that the
plants that were exposed to the most amounts of sugar and caffeine wouldn’t grow as well as the plants that had more
natural properties such as water. My experiment was to plant four plants in individual containers and every other day give
each one its own liquid. I decided to expose the plants to water, Coke, Sprite and orange soda. The first thing I needed to
do was plant four seeds in four individual cups, and label each cup with the liquid I would give it. Through the course of
36 days I fed the plants and wrote down the data. In the end of my experiment I found out that Sprite had the best growth
results and Coke, like I predicted, had the least amount of plant growth. My experiment shows and demonstrates that
plants given Sprite and water will have better plant growth results, and that plants receiving Coke and orange soda will
do poorly. ���
Joshua Ip and G. Zem (teacher)
3609 Ernest Lawrence Middle School Magnet10100 Variel Ave.Chatsworth, CA 91311
Hargeet Singh and G. Zem (teacher)
3610 Ernest Lawrence Middle School Magnet10100 Variel Ave.Chatsworth, CA 91311
Testing the Level of Electrical Conductivity in Various Water Samples and Why It Is Important
This study tested the question of whether different types of water from all around the United States tested different amounts
of electrical conductivity or Total Dissolved Solids (TDS). Packages with supplies were sent to multiple family members and
friends around the U.S. Then the packages were returned with 2 samples – sample 1 was tap and sample 2 was another
source of water (rain, snow, creek, pond or lake). Then each sample was tested with a homemade conductivity meter. Each
sample was then tested with a multi-tester to verify results. Each sample was tested three times. The results mean that water
in itself does not conduct electricity, and that water from various sources has various levels of TDS. ���
O.S. Donnelly and G. Zem (teacher)
3611 Ernest Lawrence Middle School Magnet10100 Variel Ave.Chatsworth, CA 91311
VNY_SciJrnl_interior 9/14/12 10:24 AM Page 46
47New Journal of Student Research Abstracts 2007
Which Type of Fabric Retains Water the Most?
I chose this project because I thought that this science project would help me explain a lot of the things that I don’t
know, like it would help explain why some of my clothes take such a long time to dry when they get wet. I think that my
experiment will come to a conclusion that denim will take the longest to dry since denim is so thick. I will be doing an
experiment where I let all of the different types of materials soak in a bucket of water, and then I will hang them on a clothes-
line to dry and then I will record the time it takes each of the materials to dry. The experiment I did actually proved my
hypothesis wrong. I had hypothesized that denim would take the longest, but actually fleece had taken the longest to dry,
not denim. The most important fact that I learned from this project was that I should never get fleece wet because other-
wise I will be in big trouble because it will take forever to dry. My results mean that most types of material take awhile to
dry, and that I would suggest wearing a swimming suit when you decide to get wet. ���
The Relative Levels of Vitamin C in Certain Foods
During the 65 years since its discovery, Vitamin C has earned the name “wonder worker” for the countless miracles it
performs on the human body. This antioxidant has proven to fight numerous diseases, from everyday minor illnesses like
the common cold to dreadful diseases like cancer. The importance of Vitamin C in our diet provided the foundation of my
scientific pursuit in determining the goods with the highest and lowest relative amounts of Vitamin C. The foods I tested
were Sprite, 2% reduced fat milk, a tangerine and a lemon. I hypothesized that citrus fruits contain the highest relative
levels of Vitamin C since citrus fruits cure scurvy, a Vitamin C deficiency. For my experiment, I observed the color of the
solutions created from combining one teaspoon of an indicator solution made from iodine and cornstarch with 10 drops of
a test food in each test tube. I conducted six trials, obtaining uniform results. The order each test tube was placed,
starting from the darkest colored solution to the lightest colored solution, was: Sprite, milk, tangerine and lemon. The change
of color in each tube resulted from an acid/base reaction that occurred between the ascorbic acid in each test food and the
indicator solution. The lighter the color of the solution resulting from this reaction, the more Vitamin C contributed by the
test food. Sprite had the lowest relative Vitamin C content and the lemon juice had the highest relative Vitamin C content.
Hence, my hypothesis was proven correct. Citrus fruits do contain the highest relative levels of Vitamin C. The success of this
experiment has inspired me to conduct further experiments with this extraordinary nutrient. ���
Camille Pinpin and G. Zem (teacher)
3612 Ernest Lawrence Middle School Magnet10100 Variel Ave.Chatsworth, CA 91311
Lyndsie Iwata and G. Zem (teacher)
3613 Ernest Lawrence Middle School Magnet10100 Variel Ave.Chatsworth, CA 91311
Effects of Classical Music on Sleep and Dreams
This experiment was made to answer the question “Does classical music affect sleep and dreams?” Three people
(experimental) were given classical CDs and Walkmans, while three (control) were given nothing. For seven nights, the
experimental group listened to classical music before going to sleep, while the others listened to nothing. Every morning,
they all answered a questionnaire that analyzed their sleep and dreams. I hypothesized that the experimental group would
have overall better sleeps because the sound from the music they listened to would travel to their auditory cortexes and be
stored as a memory, therefore calming their sleep. The experimental group had an average semi-still and family peaceful
sleep score, as did the control. The experimental had an average good dream, while the control had an average unknown.
The music traveled into the auditory cortexes of the experimental group’s brains as their last memory, causing them to have
good consistent dreams. The control had random last memories, causing them to have average forgotten dreams. ���
M. Horrocks and G. Zem (teacher)
3614 Ernest Lawrence Middle School Magnet10100 Variel Ave.Chatsworth, CA 91311
VNY_SciJrnl_interior 9/14/12 10:24 AM Page 47

48 Van Nuys Airport & California State University, Northridge
Does Using Wood Stoves Induce or Contribute to RespiratoryDisease Illnesses?
This study examined if using wood stoves would induce or contribute to respiratory diseases. A survey was used to conduct
the project. Questions were gathered for the survey. Surveys were handed out randomly to people of all ages. The surveys
were collected. The results of the data collected were evaluated. Seventeen females and eleven males were surveyed. One
person was newborn-2 years old, one person was 3-5 years old, three people were 6-12 years old, one person was 13-18
years old, four people were 19-29 years old and eighteen people were 30 years old and older. Twelve used gas heat, ten
used heat pumps and six had wood stoves or fireplaces. Five respiratory infections, sixteen sinus infections and eleven
cold/flu symptoms were experienced with gas heat. Five respiratory infections, six sinus infections and ten cold/flu
symptoms were experienced with heat pumps. One respiratory infection, fourteen sinus infections, and six cold/flu
symptoms were experienced with wood stoves or fireplaces. Eighteen experienced the infections during other times of the
year while not using heat. Ten have not experienced the infections during other times of the year while not using heat.
The results of this project contradict the hypothesis. The leading cause of respiratory illnesses is gas heating. ���
Organic vs. Inorganic Fertilizer
This study investigated whether inorganic or organic fertilizer produces faster-growing results when growing plants. Five pots
each contained soil, two bean seeds and organic fertilizer, while another five pots each contained soil, two bean seeds and
inorganic fertilizer. For four weeks, all plants were under the same conditions as I watered and observed the amount the
plants grew. In the end, the inorganic fertilizer never had the chance to grow, as the organic fertilizer had two plants grow
to the maximum height of 5 cm and 6.3 cm. In conclusion, the results have shown that the organic fertilizer produces faster-
growing plants with the exception that it really depends on what kind of plant is being grown. ���
Mashal Mirza and G. Zem (teacher)
3615 Ernest Lawrence Middle School Magnet10100 Variel Ave.Chatsworth, CA 91311
N. Tell and G. Zem (teacher)
3616 Ernest Lawrence Middle School Magnet10100 Variel Ave.Chatsworth, CA 91311
Bugs and Light
This experiment examined four different colored lightbulbs to see if they attracted any form of insects. The four colors of
lightbulbs were ceramic red, ceramic blue, ceramic green and ceramic white. All four lightbulbs were placed in lamps,
surrounded by stick paper. All four lightbulbs were placed outside in a wide open area in the night with around 5˚ C to
11˚ C temperatures. The lamps were then left outside for about two hours. After two hours had passed, the lightbulbs were
taken back inside and the bugs caught were counted. This experiment was repeated four times. The results show that red
light did not attract any bugs, green attracted some, while blue and white attracted many bugs. ���
Samuel Lin and D. Shah (teacher)
3617 Portola Magnet Center18720 Linnet St.Tarzana, CA 91356
VNY_SciJrnl_interior 9/14/12 10:24 AM Page 48

49New Journal of Student Research Abstracts 2007
Effect Water Has on the Speed of a Baseball
This experiment tested the effect water has on the speed of a baseball. Baseballs, which are somewhere between 22.8-23.5
centimeters across, and weigh between 5-51/4 ounces, are affected by raindrops (during baseball games and practice) that
are about 0.5-5 millimeters in diameter and fall at around 9 meters a second. A ball was dropped 32 times, 16 times wet
and 16 times dry. The time it took for the ball to reach from 9 feet in the air to the ground was recorded. The averages were
compared, and the results concluded that dry baseballs travel faster than wet baseballs. ���
What Is Easier to Recognize: Words or Colors?
This experiment was to determine if it was easier to recognize words over colors or colors over words. To test this
experiment a paper was made that had words of colors with the text in a different color than the word was in (“blue” was
colored red and “red” was colored blue). Ten seventh-grade students (five boys and five girls) were tested to see how many
words on the paper could be read and how many colors they could recognize. Each student had one minute and each
student was tested three times, each time starting from a different place. The boys’ average of both words read and colors
recognized was better than the girls’ average of words and colors. Words were also much easier to recognize for every
person who was tested. This seems to be because when the light is reflected from the paper to your eye, and then to your
brain, your brain ignores the color altogether and just concentrates on the word, and your frontal lobe in the brain (which
recognizes languages) just remembers or reads out the word. ���
Noah Cho and D. Shah (teacher)
3618 Portola Magnet Center18720 Linnet St.Tarzana, CA 91356
Ryan Fish and D. Shah (teacher)
3620 Portola Magnet Center18720 Linnet St.Tarzana, CA 91356
How Does Temperature Affect the Bouncing Height of Balls?
This experiment tested the way temperature affected the bouncing height of a soccer ball and a rubber ball. Both balls were
left outside at hot or cold temperatures for one hour. After, they were bounced from a height of about 2 meters (6 feet).
Each ball was bounced five times, and the heights were recorded and averaged. The temperatures ranged from 16 C to 37
C. Colder temperatures lowered the bouncing height, and the hot did the opposite. ���
Ryan Yoo and D. Shah (teacher)
3619 Portola Magnet Center18720 Linnet St.Tarzana, CA 91356
VNY_SciJrnl_interior 9/14/12 10:24 AM Page 49
50 Van Nuys Airport & California State University, Northridge
Does an Electromagnetic Field Affect the Death Rate of Mealworms?
The purpose of this experiment was to determine if an electromagnetic field affects the death rate of mealworms.
My hypothesis was that there would be more deaths in the experiment than in the control. First I counted 100 mealworms
and put 20 in each plastic container. Second, I wrapped wire and made the electromagnetic post and put it over the
experiment. Third, I connected the post to the 9-volt transformer to make the field. I then observed and recorded data for
the next four weeks. My data was that in the control 4% of the mealworms died and in the experiment 75% of the
mealworms died. My hypothesis was correct: There are more deaths in mealworms when they are placed in an
electromagnetic field. ���
Christopher Perez and T. Miller (teacher)
3623 Holmes International Middle School9351 Paso Robles Ave.Northridge, CA 91325
Can I Make a Chemical Indicator?
Can I make a chemical indicator? I hypothesized that I could make phenolphthalein using ex-lax tablets and rubbing
alcohol. Phenolphthalein is a chemical indicator that can distinguish between an acid and a base. When phenolphthalein is
added there is no change in color for an acid and it turns pink for a base. First, I poured 60 ml of rubbing alcohol into a jar.
Next, I crushed one ex-lax tablet until it was a powder and put it in the jar of alcohol. Then, I poured the upper part of the
clear fluid into another jar. For the experiment I injected 25 drops of vinegar and 25 drops of ammonia into separate empty
jars. Then to each jar I added about 4-5 drops of phenolphthalein. I did these steps with vinegar and ammonia three
times, then I recorded every chemical reaction (color changes) that occurred in the experiment. I placed 25 drops of
ammonia into a jar and dropped 4 drops of phenolphthalein. The experiment did support my hypothesis. The vinegar with
phenolphthalein did not change color, and the ammonia when added with phenolphthalein turned pink. My hypothesis was
proved correct. ���
Ha-rang Shim and T. Miller (teacher)
3621 Holmes International Middle School9351 Paso Robles Ave.Northridge, CA 91325
Which Light Source Is the Most Effective for the Growth of Pansies?
This project tested which light source, incandescent or fluorescent, made pansies grow faster. The materials used in this
experiment were an electric timer, 2 clamps, 1 60-watt incandescent bulb, 1 60-watt (equivalent output) fluorescent
lightbulb, extension cord, separator panel, measuring cup and water. The extension cord connected the power to the timer.
The timer was connected to the clamps of each of the light sources. The panel kept each light source from affecting the plant
on the other side. The pansies were watered and measured every two to three days. In this experiment the incandescent
light was most effective in the growth of the pansies. The pansies under the fluorescent light did not grow as tall.
The pansies under the incandescent light averaged up to 27.7 cm. The pansies under the fluorescent light averaged around
9.8 cm. ���
Cameron Brenner and D. Shah (teacher)
3622 Portola Magnet Center18720 Linnet St.Tarzana, CA 91356
VNY_SciJrnl_interior 9/14/12 10:24 AM Page 50

51New Journal of Student Research Abstracts 2007
Comparison of Two Similar Computer Graphics Cards FromCompeting Companies
This study compared two high-end graphics cards from competing companies to find out which company made the better
graphics card. The cards tested were the ATI Radeon X1800 XL and the NVIDIA GeForce 7800GT. These two cards are very
similar and cost about the same. The ATI Radeon X1800 XL card has a core clock speed of 500 MHz. The NVIDIA GeForce
7800GT card has a clock speed of 450 MHz. The video game “Doom” was used to test each card. Speed and appearance of
graphics display were observed. The frames per second (FPA) were recorded in intervals of 10 seconds for a total of two
minutes. Three different screen resolutions were tested, and the same game level was played for each resolution. Each video
card was tested this way. Even though the core clock speed was higher for the ATI card, the NVIDIA card performed a lot
better because it had a higher memory clock speed. Also, the graphics of the NVIDIA card looked better than the ATI card.
The NVIDIA card had much better shading and depth perception. It also made textures look more three-dimensional than
with the ATI card. Even though both of these cards are in the same price range, the NVIDIA GeForce 7800GT is the better
and superior value. ���
Effects of Baked Cookies Using Margarine or Butter
This study explored the possible involvement of butter or margarine in the baking of cookies. Two kinds of chocolate chip
cookies were baked: one with butter and one with margarine. The cookies made with butter appeared to spread out more,
while the cookies made with margarine stayed fluffy. The cookies were baked for 9-11 minutes in a 375 F oven. The reason
the butter cookies spread out is that butter is denser than margarine, therefore heavier, and more likely to be closer to the
ground (gravity). Margarine is light and fluffy and the cookies were too. The results show that cookies are affected if you
substitute margarine for butter. ���
Rosie Wirtz and D. Shah (teacher)
3624 Portola Magnet Center18720 Linnet St.Tarzana, CA 91356
L.V. Truong and G. Zem (teacher)
3626 Ernest Lawrence Middle School Magnet10100 Variel Ave.Chatsworth, CA 91311
Rate of Barley Seed Growth When Soaked
This study examined if soaking barley seeds would affect the rate at which the barley grew. Seeds were soaked for 24, 48
and 72 hours and planted in potting soil. Each experiment category (amount of time) had 3 sets of seeds (each containing
100 seeds). Group B (48 hours) grew the tallest (10.5 mm) within the amount of time given (9 days), with Group A
(24 hours, 9 mm) following, and Group C (72 hours, 6.5 mm) next, while the control was at 7 mm (9 hours). Soaking had
a respectable effect on the growth of the barley, while soaking too long will kill most of the seeds. The results show that
soaking barley seeds from 24-48 hours in the best way to grow barley. ���
Joanne Tang and D. Shah (teacher)
3625 Portola Magnet Center18720 Linnet St.Tarzana, CA 91356
VNY_SciJrnl_interior 9/14/12 10:24 AM Page 51

52 Van Nuys Airport & California State University, Northridge
Which Liquid?
This study showed how different types of liquid would affect a plant. In each experiment three cups were filled up two
inches high with soil and had two seeds deposited into them. Every other day each plant was watered with milk, water
or soda. Each experiment was repeated two more times. In all three experiments, Coke was shown to be the least
successful over the four-week period. Milk was the second-best liquid and water showed to be the most successful out of
the three liquids. ���
Sunkissed: An Unhealthy GlowDue to the erosion of the ozone layer and the current popular trend of “tanning,” melanoma/skin cancer is becoming a more
serious health problem. Awareness of the causes of skin cancer is critical to reducing the incidence of this preventable
cancer. Ultraviolet rays are a proven cause of skin cancer. This experiment illustrates that the sun emits ultraviolet rays that
are harmful to human beings. ���
Jessica K. Chong and G. Zem (teacher)
3627 Ernest Lawrence Middle School Magnet10100 Variel Ave.Chatsworth, CA 91311
Stevie Shandler and G. Zem (teacher)3629
Ernest Lawrence Middle School Magnet10100 Variel Ave.Chatsworth, CA 91311
Which Juice Contained the Most Vitamin C?
My hypothesis for my science fair project was that orange juice would have the most Vitamin C out of all the juices. For my
science fair project I used drops of iodine and a starch solution to detect how much Vitamin C was in one ounce of
different types of juices. The juices I tested in this experiment were orange juice, apple juice, white grape juice and
pineapple juice. Each juice was kept at the same temperature and opened at the same time to ensure that no Vitamin C
was lost. First I mixed a solution of two teaspoons of cornstarch and five teaspoons of water. Then I put 10 drops of this
solution into each ounce of juice. After I did that, I took an eyedropper with iodine in it and added drops of iodine drop by
drop. I kept track of the number of drops until my juice turned into a blue-black color. The blue-black color was an
indicator that the vitamin was reacting with the starch solution. When this occurred all of the Vitamin C was gone. After the
juice I tested turned to a blue-black color, I recorded the number of drops. I then moved on to the next juice. My results
were as follows: apple juice – 26 drops of iodine, orange juice – 100 drops of iodine, white grape juice – 20 drops of iodine,
and pineapple juice – 18 drops of iodine. Orange juice had the most Vitamin C. ���
C. Mark Baroth and G. Zem (teacher)
3628 Ernest Lawrence Middle School Magnet10100 Variel Ave.Chatsworth, CA 91311
Effects of Colors of Lights and Ice Cubes on the Melting Speed of Ice
These experiments were designed to test the effect of differently colored lights and differently colored ice cubes on the melt-
ing speed of the ice cubes. Ice cubes colored red, blue and green were put under red, blue, green and white lights, and the
melting speed of each ice cube was recorded. Each experiment was repeated four times. The red ice cube melted in 71.49
minutes under blue light, 70.33 minutes under green light, and 60.61 minutes and 65.65 minutes under red and white light,
respectively. The blue ice cube melted in 67.09 minutes under blue light, 71.49 minutes under green light, and 60.06 min-
utes and 63.86 minutes under red and white light, respectively. The green ice cube melted in 72.55 minutes under blue light,
70.42 minutes under green light, and 65.16 minutes and 66.79 minutes under red and white light, respectively. The results
suggest that the experiments weren’t controlled enough to obtain accurate results. ���
Jonathan Zev and D. Shah (teacher)
3630 Portola Magnet Center18720 Linnet St.Tarzana, CA 91356
VNY_SciJrnl_interior 9/14/12 10:24 AM Page 52

53New Journal of Student Research Abstracts 2007
Effects on Chicken Bone Tested With Both Water and Soda
This study was tested on the question of how soda can affect the chicken drumstick bones. Scientists discovered that the
chicken drumstick bone has a similar type of hydroxyapatite as dentine of teeth. Therefore, this experiment relates to how
soda can damage our teeth. I prepared two chicken bones, one with water and the other one with a soda. Then I kept the
bones inside the liquid and left it for five days. This test was repeated three times. The results from these three tests were
all the same. I kept records and took pictures during the times of observation. The chicken bone that resided with the con-
tainer filled with soda started to show changes in color and smell. The bone that was originally white turned all black.
However, the chicken bones that resided with the water stayed the same. The color, shape and the smell stayed all the same
as the original bone that I first started off with. As a result, the soda had a huge effect on the chicken bone, which tells me
that drinking sodas can lead to having cavities. Furthermore, yes it can damage our teeth due to the changes that appeared
on the chicken drumstick bone. ���
Effects of the Strength of Eggs
This experiment tested the question of how strong eggs are and how they can withstand great force when applied to them.
This experiment tested the durability of eggs. There were four volunteers and four eggs were given to each of them. They
were each told to crack an egg at a time at a different angle/side. There were four ways the eggs were allowed to be bro-
ken for this experiment. The results were recorded as we each observed how long and how the eggs cracked. The observa-
tions have been recorded and examined over and over. A man at the age of 40 instantly cracked the eggs because he was
strong enough. A woman at the age of 38 gave each egg two tries until they cracked. A male teen at the age of 12 and I, a
teen at the age of 14, took at least five tries for a few eggs to crack and could not break one egg at a certain angle. According
to my data, it was clearly shown that the breaking of eggs depended on the age or strength of each person. ���
Karen Ro and G. Zem (teacher)
3631 Ernest Lawrence Middle School Magnet10100 Variel Ave.Chatsworth, CA 91311
Tina Hyun S. Park and G. Zem (teacher)
3633 Ernest Lawrence Middle School Magnet10100 Variel Ave.Chatsworth, CA 91311
What Causes Water to Boil at a Higher Temperature?
This study showed that adding a nonvolatile solute, in this case sugar, to a solvent, in this case water, increases the boiling
point of the aforementioned solvent. Two cups of water were added to a pot and boiled with increasing increments of sugar.
The experiment was repeated seven times. The results showed that, on average, increasing amounts of sugar caused the
water to boil at a higher temperature. ���
S. Hoonand G. Zem (teacher)
3632 Ernest Lawrence Middle School Magnet10100 Variel Ave.Chatsworth, CA 91311
VNY_SciJrnl_interior 9/14/12 10:24 AM Page 53

54 Van Nuys Airport & California State University, Northridge
Does Turgor Pressure in Live Cell Membranes React the Same inControlled vs. Variable Liquids?
The purpose of this experiment was to determine if a cell membrane would react the same or differently to each liquid
variable it was exposed to. I hypothesized that each egg would react differently depending on the contents of the liquid and
any that was created. To begin my experiment I soaked six eggs in vinegar for 24 hours. After the 24 hours, I carefully took
out the eggs. One egg was placed as directed into distilled water, which was my control variable. The other eggs were placed
into five different variables (Red Bull, Coke, white grape juice, rubbing alcohol and hydrogen peroxide). The eggs remained
in their liquids for seven days, during which time I observed changes in color, shape and appearance. By the last day of
observation each egg had a different reaction to the liquid variable it was placed in. The cell membrane of the egg soaking
in the hydrogen peroxide became fully exposed. The egg in the white grape juice grew fungus around the entire shell. The
Coke-soaked egg was discolored and had many cracks. The egg in the Red Bull began to grow fungus on the seventh day.
The eggs in the rubbing alcohol and distilled water (the control variable) had no visible changes to the appearance of their
membranes. Since four of the six eggs reacted to the liquid in which they were placed, I concluded that turgor pressure in
a live cell membrane is dependent upon the contents of various liquids. ���
Different Freezing Times of Water, Saltwater, Pepsi and Milk
This experiment tested the amount of time it took for various liquids to freeze. These liquids were water, saltwater, Pepsi
and milk. Thirty ml of each liquid was poured into four individual small metal containers. They were placed into the freezer
and at different times were tested for how much they froze. They were checked at four different times for each experiment,
and the experiment was repeated three times. Water froze first, milk second, Pepsi third and saltwater after a few days. This
happened in all three experiments. ���
Alexandra Tallas and T. Miller (teacher)
3634 Holmes International Middle School9351 Paso Robles Ave.Northridge, CA 91325
Aaron Samsanovich and D. Shah (teacher)
3635 Portola Magnet Center18720 Linnet St.Tarzana, CA 91356
The Difference Between Fat-Free and Normal Foods
This experiment examined how people could or could not taste the difference between normal and fat-free foods. Three
groups of fifteen people ranging in ages were tested. They were given four different pairs of normal and non-fat foods:
potato chips, chocolate pudding, ranch dressing and chocolate ice cream. The results were that most people could not
tell the difference between the chips but the ice cream was an obvious one. The results of pudding and dressing were
varied but mostly correct assumptions were made. In conclusion, people can tell the difference between most normal and
fat-free foods. ���
Allison Skager and D. Shah (teacher)
3636 Portola Magnet Center18720 Linnet St.Tarzana, CA 91356
VNY_SciJrnl_interior 9/14/12 10:24 AM Page 54

55New Journal of Student Research Abstracts 2007
Effects of Seed Size on Seedling Growth of Swiss Chard Seeds
This experiment tested whether or not the size of the Swiss Chard seed would affect how well or fast it grew. Three variable
sizes of the seed were used: three millimeters, five millimeters and six millimeters. Each size had three seeds, and all were
given equal soil, water and sunlight. After twenty days of growth, the final conclusion was reached. The size of the seeds
had no effect on the growth of the seedlings. Not all seedlings sprouted, and out of the ones that did, growth was different
for each seed without any correlation to the seed size. The results prove that the size has no effect on the growth of the
seedlings. ���
Effects of Sugar on Plant Growth
This experiment examined the question, “How will sugar affect plants?” Plants were planted in 120 grams of soil (60 grams
of regular garden soil, 60 grams of topsoil) and watered once every three days with 59 milliliters of liquid. Every day
progress was recorded. This experiment was done three times. The plant watered with water (0 grams of sugar) grew
7.6 centimeters and bloomed. The plant watered with orange juice (22 grams of sugar) grew 7 centimeters and bloomed.
The plant watered with grape juice (40 grams of sugar) grew 7.1 centimeters and bloomed. The plant watered with soda
(24 grams of sugar) grew 6.4 centimeters but did not bloom. The plant watered with milk (15 grams of sugar) grew
7.4 centimeters and bloomed. The plant watered with apple juice (28 grams of sugar) grew 6.6 centimeters and bloomed.
These results suggest that it does not matter how much sugar there is in the liquid you use to water a plant. ���
Kelsey Bartlett and D. Shah (teacher)
3637 Portola Magnet Center18720 Linnet St.Tarzana, CA 91356
Ryan Pak and D. Shah (teacher)
3639 Portola Magnet Center18720 Linnet St.Tarzana, CA 91356
Effects of ZANTREX-3 on the Heart Rate of Zebra Fish
ZANTREX-3 is an over-the-counter weight loss pill. This study examines the possibility of an altered heart rate of zebra fish
embryo induced by ZANTREX-3. Fish embryos were exposed to ZANTREX-3 at the ages of 6 hours, 24 hours and 48 hours,
with different solution concentrations. Solution concentrations were obtained by serial dilution and fish were exposed for
24 hours, 2 hours, 30 minutes, 10 minutes and 2 minutes. Ten-12 fish were put in the solution, and 5 from each surviving
group had their heartbeat tested. For the higher concentrations and prolonged exposure, the heart rates decreased
dramatically. During 24-hour exposure, the fish were either dead or their heart rates became too irregular to measure. For
both the 2-hour and 30-minute exposures, heart rates decreased as the concentration increased. For the 2-minute and
10-minute exposures, the fish’s heart rate was measured before exposure, 2 minutes after and 10 minutes after exposure.
For the lower concentration, the heart rate would increase slightly before falling again at 10 minutes of exposure. For the
higher concentration, the heart rate slowed down immediately. The results suggest that high concentrations of ZANTREX-3
will cause a slowdown of heart rate, while a lower concentration initially leads to rapid heartbeat before it eventually falls
down again. ���
Jenny Lin and D. Shah (teacher)
3638 Portola Magnet Center18720 Linnet St.Tarzana, CA 91356
VNY_SciJrnl_interior 9/14/12 10:24 AM Page 55

56 Van Nuys Airport & California State University, Northridge
The Effects of Agents on an Apple’s Browning
The objective of this project is to find out what agents (water, milk, lemon juice and lime juice) are most effective on an
apple’s browning rate. A few apple slices for each agent were soaked in the agent and the agents were found to have slowed
the apple’s browning rate. Lemon juice and lime juice were found to have greatly reduced the rate of browning because
of large amounts of Vitamin C, a great antioxidant. Oxidation was almost completely prevented. However, milk and
water barely did anything. This proves that lemon juice and lime juice are much better at slowing the browning rate than
milk and water. ���
Can Pseudosinella violenta, a Blind Species of Collembola, Smell?
The purpose of this experiment is to see if Pseudosinella violenta, a blind species of collembola, can smell. My hypothesis
is that I believe they can smell to help them find food. In the first experiment I placed 10 collembola on a piece of light blue
paper and placed a heavy line of permanent marker in front of the collembola. I recorded the amount of times the
collembola moved away from the marker. In the second experiment I placed another 10 collembola on a piece of light blue
paper and placed a heavy line of permanent marker in front of the collembola. I recorded the amount of times the
collembola traveled toward the marker line. Then I repeated the same procedure for both experiments two more times. The
collembola that moved away from the black line were 56% and the collembola that moved toward the black line were 20%.
In the third experiment, I placed 10 collembola on the light blue paper and made a line using nail polish. I again recorded
the amount of collembola that moved away from the nail polish. In the fourth experiment, I placed 10 collembola on a piece
of light blue paper and recorded the amount of collembola that went toward the nail polish. Then I repeated the procedure
for both experiments twice. Eighty percent of the collembola went away from the nail polish and 20% went toward the nail
polish. In the fifth experiment I placed 10 collembola on a piece of light blue paper. I placed yeast on the paper to see if the
collembola would move toward the food they are fed in the lab. I recorded the number of times they moved toward the
yeast. Then I repeated the procedure for both experiments twice. Twenty-five percent of the time they moved away from the
yeast and they moved toward the yeast much more frequently. I believe my results support my hypothesis that Pseudosinella
violenta can smell. ���
Matthew Alongi and D. Shah (teacher)
3640 Portola Magnet Center18720 Linnet St.Tarzana, CA 91356
Sergio Zepeda and T. Miller (teacher)
3642 Holmes International Middle School9351 Paso Robles Ave.Northridge, CA 91325
Effects of Sugar on Cut Flowers
This study examined the question of, “Does Sugar Prolong the Life of Cut Flowers?” Two cut flowers were put into jars with
or without one teaspoon of processed sugar and water. Each was observed to see which one of the two was dying first. Each
experiment was repeated three times. Sugar was able to prolong the life of the cut flowers. The results suggest that sugar
can prolong the life of cut flowers more than just adding water. ���
Davina Wong and D. Shah (teacher)
3641 Portola Magnet Center18720 Linnet St.Tarzana, CA 91356
VNY_SciJrnl_interior 9/14/12 10:24 AM Page 56

57New Journal of Student Research Abstracts 2007
Effects of Cell Phone Radiation on the Growth Rate of Yeast
This research observed the growth rate of yeast cells that were exposed to cell phone radiation. Yeast cells were chosen over
other cells because they are the simplest eukaryotic cells, yet the yeast cells grow and divide in the same way as human
cells. Yeast cells were grown in apple juice at 30 C. Apple juice was chosen for the experiment because yeast cells grew the
best in apple juice among several medias that were tested. The yeast cells were then exposed to cell phone radiation for 4
to 8 hours. The yeast cells were counted at 0, 4, 8, 12 and 24 hours. The experiment was repeated 3 times and showed sim-
ilar results. The average growth rate in 24 hours of the yeast cells that were exposed to the cell phone for 4 hours was 1.8
times slower than the control and the growth of yeast cells that were exposed to the cell phone for 8 hours was 2.4 times
slower than the control. The results of the 3 experiments also showed that the yeast cells would momentarily stop growth
when cell phone radiation was exposed and start to recover the growth after the radiation exposure was stopped. This study
showed that cell phone radiation can cause the growth rate of yeast cells to be stunted. The results suggested that cell phone
radiation could be dangerous. ���
Effects of Caffeine on Sunflowers
This experiment studied if there were any effects caused by caffeine to the growth of plants as opposed to the usage of reg-
ular water. Caffeine is researched to have had an accelerated effect on cells’ growth. Sunflower seeds were exposed to two
different levels of caffeine: a soda brand, Coca Cola, which has 34 mg. of caffeine, and Folgers coffee, which has
65-100 mg. The control bin would be given water. For 14 days, each liquid was poured over its respective bin. Data such as
observations, height and the number of leaves were recorded every other day. After 14 days, the Coca Cola plants had
barely begun to sprout, theoretically due to the excess levels of glucose. The coffee plants were the first to germinate, but
the growth was stunted in the latter days of the experiment with a concluding height of approximately 7 inches and an
average of 3-4 leaves. The most successful plant to grow was the control bin, as heights were reached to a level of
approximately 12 inches and ranging from 4-8 leaves. The results suggest that the effects of caffeine are deficient regarding
the development of plants and are moreover negative to the growth of humans as well. ���
Charity Lombard and G. Zem (teacher)
3643 Ernest Lawrence Middle School Magnet10100 Variel Ave.Chatsworth, CA 91311
Sam Xu and D. Shah (teacher)
3644 Portola Magnet Center18720 Linnet St.Tarzana, CA 91356
Does the Design of a Paper Airplane Affect How Far It Will Fly?
The purpose of this experiment is to find out what type of paper airplane will fly the farthest. I believe the F-15 Fighter
airplane with the longer wings and paper clip will be able to fly the farthest. I learned from my research that lift and thrust
are important factors in the flight of airplanes. To do this experiment I made 5 different paper airplanes from a piece of
standard paper. The F-4 Phantom had a wing length of 7”, the F-20 Hawk had a wing length of 8”, the F-44 Bat had a wing
length of 8”, the F-15 Eagle had a wing length of 11” and the F-15 Fighter had a wing length of 12”. I added a paper clip to
the nose of the F-15 Fighter, the F-15 Eagle and F-44 Bat. I placed a measuring tape on the grass and threw each airplane
3 times. I collected the data and averaged it. My hypothesis was correct: The F-15 Fighter traveled the farthest distance with
16’ and 9”. ���
Kevin Baca and T. Miller (teacher)
3645 Holmes International Middle School9351 Paso Robles Ave.Northridge, CA 91325
VNY_SciJrnl_interior 9/14/12 10:24 AM Page 57

58 Van Nuys Airport & California State University, Northridge
Effects of Parent Characteristics on Offspring
This study tested whether certain traits show up in offspring without any blending of parent characteristics. The pea plants
chosen were Lipstick sweet peas (Lathyrus odoratus with red petals) and Royal Wedding sweet peas (Lathyrus odoratus
with white petals). The pea plants were cross-pollinated and this experiment was repeated two times. Timely observations
were recorded. In the first generation from cross-pollination with Lipstick sweet peas (red petals) and Royal Wedding sweet
peas (white petals), all of the offspring had red petals and none had white petals. But in the second generation there were
three offspring with red petals and one with white petals, which proves Mendel’s 3:1 ratio. The results suggest that certain
traits show up in offspring without any blending of parent characteristics. ���
The Effect of Brand Name Colas on Kids and AdultsThis study examined if different kids and adults could taste the difference between three different kinds of brand name colas.
Twenty random subjects, male and female, were chosen. They were each given 200 ml of each of the colas in foam cups.
They were then blindfolded so they couldn’t see, and they drank through a straw. After all the testing and recording, the
results were in. All three tests proved the hypothesis true. In all three tests, the same number of people guessed wrong and
right. Results show, though, that they can taste the difference in Diet Coke. With this in mind, the hypothesis was partially
proved. ���
A.K. Mannshahia and G. Zem (teacher)
3646 Ernest Lawrence Middle School Magnet10100 Variel Ave.Chatsworth, CA 91311
Niran Grimberg and D. Shah (teacher)
3648 Portola Magnet Center18720 Linnet St.Tarzana, CA 91356
How to Make a Good Mixture for a Good Bubble
This study is to see what mixture makes a good bubble. The definition of a good bubble in this case is to see what bubble
mixture makes a bubble last longer. Four different soaps were used. The four different soaps were hand soap, dish soap,
shampoo and clothing soap. Each soap was mixed with different amounts of water. The different mixtures were tested three
times each. Each experiment showed differences. The bad bubble mixtures wouldn’t form a bubble or would pop before it
could be formed either due to the thickness of the soap or the mixture being too diluted. The results from the experiments
were that shampoo mixed with water makes a good bubble mixture. ���
Lourdes Ragas and G. Zem (teacher)
3647 Ernest Lawrence Middle School Magnet10100 Variel Ave.Chatsworth, CA 91311
The Effect of Classical Music on Soybean PlantsThis study examined the question of the possible involvement of classical music in increasing the growth of a soybean plant
of Glycine max both in quality and quantity. Six soybean plants were exposed to classical music for one hour every day for
one month. The growth of the plants by centimeter was recorded along with how many plants had grown in each group.
The experiment was repeated two times. Classical music increased the size of the plants by 2-7 centimeters but reduced the
quantity of plants by two plants, while the control group had more plants but grew less in size. The results suggest that
Glycine max can be affected by the calm serene sound waves of classical music. ���
Christian Sabalburo and D. Shah (teacher)
3649 Portola Magnet Center18720 Linnet St.Tarzana, CA 91356
VNY_SciJrnl_interior 9/14/12 10:24 AM Page 58

59New Journal of Student Research Abstracts 2007
Can Eighth-Graders Tell the Difference Between Regular and Low-Fat Foods?
My science experiment tested to see if eighth-graders could taste a difference between regular and low-fat food. I purchased
Sunshine Cheez-Its, Nabisco Chocolate Chip Cookies, Pringles Original Chips and Nabisco Honey Maid Graham Crackers in
regular and low-fat varieties. I also bought a control substance, Corn Chex Cereal. I hypothesized that the subjects would
not be able to taste a difference between the two food groups. I thought that food companies would work harder to dis-
guise the taste of low-fat foods to keep up with regular food competitors. When I ran the experiment I tested twenty peo-
ple. One subject did not complete the questionnaire so I was left with nineteen forms. I analyzed the data by
calculating percentages and graphing the results. My hypothesis was wrong because the majority of eighth-graders could tell
the difference between regular and low-fat foods. I learned that the human mind is very good in tasting a difference
in similar foods. Overall the majority of subjects could tell the difference. An average of 52% were correct and 48%
were wrong. ���
What Liquid Will Make Plants the Healthiest?
This experiment was done to find the different effects that different liquids would have on plant growth and development.
It started with five plants of the same species and of equal size. Each of them was fed one-quarter cup of a different liquid.
Plant one was given water. Plant two was given non-caffeinated soda (7UP). Plant three was given caffeinated soda (Coca
Cola). Plant four was given store-bought juice (Hawaiian Punch). Plant five was given freshly squeezed lemon juice from the
tree across the street. All plants were fed every other day (when fed every day the soil was too moist). The experiment was
continued for 46 days starting on February 13. On March 31, the plant fed caffeinated soda and the plant fed store-bought
juice were the tallest. The plant given water was smaller than the tallest plants; however, it was stronger and less apt to have
its stems break. The plant fed caffeinated soda was the worst off of all the plants. It was droopy and not at all healthy or
strong. The plant given freshly squeezed juice surprisingly didn’t do very well either. About 20 days into the experiment a
fuzzy mold-like substance covered the surface of the soil, and afterward the plant’s health went downward. It too was limp
and unhealthy although not as much as the plant fed caffeinated soda. Based on these results the best substance to mois-
ten plant soil is water. Although it doesn’t make the plants grow as tall, it keeps their stems thick and healthy. The second
best source of nourishment is store-bought juice. This way the plant can sidestep making all the nutrients, starches and sug-
ars it normally would need because they are already in the juice, without the worry of disease transmission. The plant fed
non-caffeinated soda came in third, and the plant fed caffeinated soda was in the worst shape of all the plants. ���
Olivia Dill and G. Zem (teacher)
3650 Ernest Lawrence Middle School Magnet10100 Variel Ave.Chatsworth, CA 91331
Megan McEvoy and G. Zem (teacher)
3651 Ernest Lawrence Middle School Magnet10100 Variel Ave.Chatsworth, CA 91311
VNY_SciJrnl_interior 9/14/12 10:24 AM Page 59

60 Van Nuys Airport & California State University, Northridge
Can a Braitenberg Vehicle React to Sound?
This study compared the behavior of a Braitenberg vehicle equipped with light sensors to a vehicle equipped with sound
sensors. A Braitenberg vehicle is a light-sensing robot used in synthetic psychology (the study of robots that mimic behav-
iors, founded by Valentino Braitenberg in 1984). These vehicles can follow and run from vibrations the robot’s sensors sense,
so sound and light sensors should work similarly in this case. The project employed two computer programs to control the
vehicles. One program utilized custom written instructions in the standard Lego Mindstorms programming environment. The
project also operated with a program written in an alternative Mindstorms programming language called NQC downloaded
from the Internet. Each run functioned using the same two programs, only the types of sensors changed. Sensor-wise, the
robot had similar reactions to both programs. In each situation, the robot reacted to the stimulus type the specific sensor
was designed to detect. When using light sensors, the robot responded to light sources and when using sound sensors, the
robot reacted to sound. Strong stimuli either attracted or repelled the robot depending on the program. This proves that the
Braitenberg vehicle’s behavior is similar when using either light or sound sensors. ���
The Effect of Color on a Chicken’s Appetite
This study examined the question of the possible effect of color on a chicken’s appetite. Five different food colorings were
applied to chicken food to change its color. The chickens were offered all the colored food for five minutes. The amount of
food pellets of each color eaten was recorded. This experiment was repeated four times, using different chickens in each
test. The results showed that the chickens were affected by color, and ate more of the red food than the yellow, green, blue
or brown food. ���
Benjamin Giglione and D. Shah (teacher)
3652 Portola Magnet Center18720 Linnet St.Tarzana, CA 91356
Veronica Rico and D. Shah (teacher)
3653 Portola Magnet Center18720 Linnet St.Tarzana, CA 91356
Effects of Caffeine on Sixth-Graders
This study examined the question of possible effects of caffeine on sixth-grade females in the pre-algebra math level, all
achieving an A. Twelve test subjects were chosen and put into two groups, with six subjects each: Caffeine and Caffeine-
Free. The Caffeine-Free group took a 240 ml dose of Sprite, while the Caffeine group took a 240 ml dose of Red Bull ener-
gy drink. Then, each test subject took a logic test, each identical to the rest. After 10 minutes, the results were collected and
recorded. The results indicated that the caffeine subjects scored higher than the caffeine-free subjects. The Red Bull, which
contains 82 mg of caffeine, increased the average score by 22.2%. ���
Vesta Partovi and D. Shah (teacher)
3654 Portola Magnet Center18720 Linnet St.Tarzana, CA 91356
VNY_SciJrnl_interior 9/14/12 10:24 AM Page 60

61New Journal of Student Research Abstracts 2007
Measurement of Ion Acoustic Waves in a Cold Plasma
An ion acoustic is a compression wave in a gas mixture of ions and neutral atoms. It includes both density fluctuations
and electric field fluctuations. Students measured the speed of the ion acoustic wave using a Langmuir probe. There are
various techniques. An oscilloscope memorizes the shape of the wave for a certain position of the probe. The probe is
moved to a new position and the oscilloscope can measure the phase difference of the wave in units of time. Thus, for a
certain difference in position there is certain time difference in the wave, using v = d/t the velocity of the wave can be
determined. ���
How Do Heat and Surface Roughness Affect the Bounce Height of a Basketball?
This experiment proved that to give a basketball a good height when bouncing it, temperature and the surface really mat-
ter. The basketball was heated up in a sink of hot water of 30 C for 10 minutes and the bounce height was measured. Then
the carpet was used and the ball was bounced on that surface. Later the results were recorded. This experiment was repeat-
ed at room temperature of 25 C and then with a frozen ball at 0 C. Each experiment was repeated three times. The heat
allowed the molecules on the surface of the ball to move faster and dent faster, and made the ball 91 degrees while the
control was at 75 degrees. The cooled one was held at 32 degrees while bouncing. The results suggested that temperature
and the surface roughness are things that affect a basketball’s bounce height. ���
Brandon Nguyen and D. Shah (teacher)
3655 Portola Magnet Center18720 Linnet St.Tarzana, CA 91356
D. Lee (Palos Verdes Peninsula High School), R. Zarinshesnas (University High School, Los Angeles), T. Kim (Palisades High School, Los Angeles), E. Warfel (Palisades High School, Los Angeles), D. Furlong (New Roads School, Los Angeles), W. Gekelman (UCLA PhysicsDepartment), J. Wise (New Roads School, Los Angeles), P. Pibyl (UCLA Physics Department),R. Baker (University High School, Los Angeles), J. Ransom (University High School, Los Angeles), W. Layton (UCLA Physics Department), R. Ransom(UCLA Mathematics), J. Skrzypek (Cal Tech Physics),P. Niknejdi (Cal Poly Pomona Physics) and R. Baker (teacher, University High School)
3656 University High School11800 Texas Ave.Los Angeles, CA 90025
VNY_SciJrnl_interior 9/14/12 10:24 AM Page 61

62 Van Nuys Airport & California State University, Northridge
Effects of UV Exposure on Brassica rapa
An increase in global warming in the planet may result in an increase in UV exposure. UV radiation is known to damage DNA
and can affect the growth and development of plants and organisms. To test this hypothesis I exposed Brassica rapa to UV
light at different stages of development. My results indicate that germinating seeds were most sensitive to shortwave UV
exposure than other stages of development. These plants were taller than controls and had curled cotyledon leaves,
sickle-shaped true leaves, wrinkled flower petals and some oversized true leaves as well. I did not observe growth
retardation under these experimental conditions. These results show that UV exposure may cause abnormalities in Brassica
rapa plants. ���
Using a Minirespirometer to Measure the Respiration Rate in Mealworms
Changes in environmental temperatures may affect the respiration rate in insects. I was interested to find out whether tem-
perature changes would alter the respiration rate in mealworms. In this experiment, I made a minirespirometer using a vacu-
tainer tube containing a capillary tube filled with 0.1% phenol red. The exhaled carbon dioxide would change to carbonic
acid, which causes the phenol red to turn yellow. The mealworms were weighed and put inside the vacutainer tube and
kept at 4 C, 22 C and 30 C. The respiration rate was expressed as color change (mm)/body weight (g). My results show that
increasing the temperature caused increases in the rate of respiration in mealworm. ���
April Enriquez and N. Pal (teacher)
3657 Robert Fulton College Preparatory School7477 Kester Ave.Van Nuys, CA 91405
Cristina Itzep and N. Pal (teacher)
3658 Robert Fulton College Preparatory School7477 Kester Ave.Van Nuys, CA 91405
Using Yeast as a Tool to Measure UV Protection
UV exposure has damaging effects and may also cause skin cancer. I was interested in what materials may protect us from
the damaging effects of UV radiation. In this study, I used UV-sensitive yeast as a tool to measure the effectiveness of differ-
ent fabrics’ sunscreens for protection against UV exposure. I used a wild strain of yeast along with a UV-sensitive strain and
exposed both strains to shortwave and long-wave UV light for different lengths of time. I observed that shortwave exposure
for 1 second resulted in total death of the UV-sensitive strain. Long-wave UV exposure for 30 seconds had no effect on the
growth of these organisms. Sunscreens (both 15 SPF and 30 SPF), flannel (cotton) and cotton polyester fabrics protected
the UV-sensitive yeast from the damaging effects of shortwave exposure for 10 seconds. ���
Adriana Mendoza and N. Pal (teacher)
3659 Robert Fulton College Preparatory School7477 Kester Ave.Van Nuys, CA 91405
VNY_SciJrnl_interior 9/14/12 10:24 AM Page 62

63New Journal of Student Research Abstracts 2007
Properties and Growth of Yeast in Water
The experiment was performed to determine the most suitable environment for the growth of Baker’s yeast. Four different
conditions were tested. These conditions were: (1) cold water and yeast; (2) warm water and yeast; (3) cold water, yeast
and sugar; and (4) warm water, yeast and sugar. Each condition was observed and measured at three timed intervals. The
intervals were 10 minutes, 25 minutes and 40 minutes. The result of my experiment was that significant growth occurred in
only one environment, which was warm water and sugar. ���
Effects of Preservatives on Bread Mold Growth
This experiment observed mold growth of wheat bread, white bread and rye bread, and applied knowledge of each bread’s
preservative content to the results. Each type of bread was kept in a room-temperature environment, and three slices of each
type of bread were involved in the experiment. After three weeks, wheat bread had the most mold. This was because the
wheat bread has enough preservatives to keep it from growing stale, but not enough to discourage mold growth. ���
Kendall Nelson and D. Shah (teacher)
3660 Portola Magnet Center18720 Linnet St.Tarzana, CA 91356
T. Bernard and G. Zem (teacher)
3661 Ernest Lawrence Middle School Magnet10100 Variel Ave.Chatsworth, CA 91311
Lagenorhynchus obliquidens Population Offshore Santa Barbaraand Ventura Counties
Pacific White-Sided dolphins are sighted in certain parts of the Pacific Ocean, which is easily implied by their name. Transacts
and residency scans are used to count dolphins offshore from Santa Barbara to Ventura County. In the residency scan
method, researchers get in groups of two and observe as dolphins swim by. Range finder binoculars are used for locating
the dolphins and identifying the species. In a study from December 14, 2004, to December 14, 2005, the vessel Ranger 85
was used in documenting the dolphin sightings. If the dolphin population is increasing in Ventura County and decreasing in
Santa Barbara, then the dolphins are migrating from one area to another as a result of changes in their environment.
Research done in Santa Barbara from 1996 to 2000 stated that the number of dolphins sighted has decreased to 40
from about 120. However, in Ventura County the number of dolphins sighted has increased from 10 to about 110. One
possibility is that the dolphins have moved down the coastlines due to living conditions, such as water temperature and
food supply. Besides the migration of the dolphins, another possibility for this population change in these two areas might
be the various methods that scientists use to sight dolphins. It is evident that altering ways of sightings is able to affect the
results. The different numbers might have been obtained as a result of the differences in the time periods of sightings in
each study. More observations are required to fully document the dolphins’ habitat range and movement patterns. It is
evident from preliminary studies that there is a regional pod of Lagenorhynchus obliquidens that moves between the
offshore waters of Ventura and Santa Barbara counties. ���
Gayane Vardoyan, Serly Moosakhanian and D. Evans-Bye (teacher)
3662 Clark Magnet High School 4747 New York Ave.La Crescenta, CA 91214
VNY_SciJrnl_interior 9/14/12 10:24 AM Page 63

64 Van Nuys Airport & California State University, Northridge
The Mozart Effect
The Mozart Effect is a theory about how Mozart’s music affects the brain, in this case specifically math. The way that this lab
will test the effect of Mozart’s music on the human brain will be by testing five people on the math test twice, once before
listening to Mozart’s music, and the second time after listening to Mozart’s music. After testing the five people, the results
ended up supporting the fact that Mozart’s music positively affects the brain mathematically. Between the first and second
tests, four out of five people got a higher grade after listening to the music, while one person had exactly the same grade
for the first and second time. In the end this proves that Mozart’s music is good for math. ���
Effects of Salts on Crystal Formation in a Supersaturated Solution
This experiment is a study of how salt (Sodium Thiosulfate, Borax, Alum, Rochelle Salt, Copper Sulfate, Potassium
Permanganate, Ferrous Sulfate and Cobalt Chloride) can form into crystals consisting of various colors and shapes. Thirty ml
of Alum was added to 60 ml of hot tap water and then stirred until the solution dissolved. After the solution dissolved, it
was poured into a saucer and then set aside. This process was repeated with each of the salts. The results were small
crystals after 6-14 days. These would serve as seeds for the growth of the crystals. The same process was repeated except
with 60 ml of each salt. The solutions Rochelle Salt, Sodium Thiosulfate, Cobalt Chloride, Ferrous Sulfate Heptahydrate and
Copper Sulfate Pentahydrate were poured through a purification filter. The seed crystal was tied on a string and hung
submersed in the solution after it was allowed to cool. The salts Alum, Potassium Permanganate and Borax weren’t poured
through the filters because these served as controls. Results showed that there were impurities in unfiltered solutions
and thus an unknown variable was present that had stopped the solution from forming crystals. Results conclude that you
can add a salt to water to form a supersaturated solution and grow crystals with different colors or shapes through
evaporation. ���
Brian Oh and D. Shah (teacher)
3663 Portola Magnet Center18720 Linnet St.Tarzana, CA 91356
Michael Wyckoff and D. Shah (teacher)
3665 Portola Magnet Center18720 Linnet St.Tarzana, CA 91356
How Does Water Temperature Affect the Respiration Rate of Goldfish?
This experiment questioned how the respiration rate of medium-sized goldfish Carassius auratus was affected by the
temperature of water. In the experiment we raised the water temperature 5° C every time and observed all six fish. This
experiment was done four times to every fish. We had to be sure the same fish was not tested over and over. I had to use
something to divide the goldfish that were finished with observation from the goldfish that I was working on. It was very
important to look carefully because the fish moved around too much for you to see. The results of this ended up as I thought
they would. As the water temperature increased, the goldfish’s respiration rate increased rapidly. The higher the tempera-
ture gets in water, the higher the breathing rate of the goldfish. ���
Sherin Thomas and G. Zem (teacher)
3664 Ernest Lawrence Middle School Magnet10100 Variel Ave.Chatsworth, CA 91311
VNY_SciJrnl_interior 9/14/12 10:24 AM Page 64
65New Journal of Student Research Abstracts 2007
Physics and the Baseball
The purpose of my project was to answer all the unsolved questions people have about baseball pitching. People are often
curious why pitchers throw curveballs, knuckleballs, changeups, screwballs and other kinds of pitches and this project
answers all those questions.
My experiment will prove that any certain baseball pitch doesn’t move because it is an optical illusion, as has been conjec-
tured, but it moves because of the laws of physics. The research used for this project came from books about the game of
baseball, the Internet’s fact websites, and my own knowledge of the game. I have played for 9 years. The experiments I used
were with my pitching coach who coaches minor league players learning how to throw curveballs, knuckleballs and any pitch
you could think of, and observing the movement of the ball using a waffle ball, which is a plastic baseball with holes in it,
which allows the effects of physics to be seen more clearly. The experiments proved that my hypothesis was correct. The
laws of physics directly impact the movement and speed of a baseball.
The most important facts I learned from the project were how air drag, gravity and the Magnus force all have an impact on
pitching. The results showed me that my whole project was a success. ���
The Effects of pH and Temperature on Catalase
Catalase is an enzyme that is found in peroxisomes, which are intracellular organelles. In liver, catalase catalyzes a number
of oxidation reactions such as oxidation of alcohols and of fatty acids, and in plants the enzyme is found in leaves and ger-
minating seeds catalyzing two distinct reactions. In peroxisomes catalase also mediates the breakdown of hydrogen perox-
ide into water and oxygen.
In this experiment, catalase was obtained from chicken liver, potatoes and apples. The chicken enzyme was used to charac-
terize the enzyme because of its higher activity, while the apple enzyme was used to establish a correlation between rotting
of apple and catalase activity. When treated with lemon juice, the rotting of the apple was significantly slowed down, paral-
leling the results of enzyme assays in the presence of lemon juice, which reduced catalase activity to negligible levels, thus
confirming the likelihood of its involvement in apple rotting and in fruits and vegetables in general. As far as kinetics of cata-
lase are concerned, the reaction catalyzed by the liver enzyme was decidedly exothermic. The Vmax (maximum velocity (V)
or activity) calculated at three different temperatures (7 C, 22 C, 35 C) exhibited about a tenfold increase in activity at each
successive temperature, as was expected. ���
Khatcher Margossian and D. Shah (teacher)
3666 Portola Magnet Center18720 Linnet St.Tarzana, CA 91356
Daniel Dungan and G. Zem (teacher)
3667 Ernest Lawrence Middle School Magnet10100 Variel Ave.Chatsworth, CA 91311
VNY_SciJrnl_interior 9/14/12 10:24 AM Page 65

66 Van Nuys Airport & California State University, Northridge
Effects of Enzymes (Meat Tenderizer) on Protein (Gelatin)
The question for this science experiment is what the effects of enzymes on protein are. The hypothesis was if meat
tenderizer was added to the protein (gelatin), the gelatin would not gel when chilled. What you do first is get an 85-gram
packet of gelatin and prepare it. Then you divide the prepared gelatin into three cups – one labeled “Gelatin” and one
labeled “Meat Tenderizer” (leave one of the cups unlabeled). Put two labeled cups in the refrigerator and leave them
overnight. Take out the cups and empty them into a cereal bowl while observing the fluidity of the gelatin. The cup labeled
with “Meat Tenderizer” should be liquid and the cup labeled “Gelatin” should be gelled. You could use the unlabeled cup
as a control and compare it to the other gelatins. The reason the “Meat Tenderizer” cup didn’t gel was because there is an
enzyme in the meat tenderizer, papain, that keeps the protein in the gelatin from bonding. ���
Population of Homarus americanus: The American Lobster
If the rate at which lobsters are being fished does not lessen, then their population will decrease. American lobsters,
otherwise known as Homarus americanus, were studied to find out if this statement is true.
A data chart was looked at that was provided by the National Oceanic and Atmospheric Administration (NOAA), which
showed the amount of American lobsters that had been caught from 1950 to 2004 in Maine. By looking at this chart, one
could see that the number of American lobsters being seized in 1950 was 18,352,600 pounds and by 2004 it had gone up
to 71,574,344 pounds. After subtracting these two numbers, it was shown that there was a surprising 53,221,744-pound
increase. The amount of lobster being caught in 1950 had more than tripled by the year 2004. After the experiment had
been performed, it was confirmed that the lobster population has been fished more and more throughout the years.
There are two reasons that could be possible explanations of why the number of lobsters being seized had gone up tremen-
dously. One possibility is that the lobster population grew promptly and there were enough lobsters to be caught. Another
is that humans desired more lobsters and obtained them. It is clear to one that the humans desired more lobsters and seized
them for their pleasure. If the rate at which lobsters are being caught continues, the lobster population will decrease like
other commercial fish studied. It has been noticeable that other populations of commercial fish had decreased if the rate at
which they were being hunted increased.
H. americanus are the largest population of lobsters being caught and they are the most expensive. They are enjoyed all
around the world and are known as one of the most luxurious meals. The number of lobsters that are being seized now
should decrease and their population should be better taken care of if humans want to keep on enjoying this magnificent
repast. ���
Maria Cho and D. Shah (teacher)
3668 Portola Magnet Center18720 Linnet St.Tarzana, CA 91356
Tatevik Melkumyan and D. Evans-Bye (teacher)
3669 Clark Magnet High School4747 New York Ave.La Crescenta, CA 91214
VNY_SciJrnl_interior 9/14/12 10:24 AM Page 66

67New Journal of Student Research Abstracts 2007
Effects of “Energy Drinks” on Petunias
In today’s society most people simply do as they are instructed to. They read the manuals before setting up a computer, they
skim over the instructions before putting a table together, and they follow the instructions on how to grow their plants. What
if there was a better, quicker and more efficient way to nurture plants that is not in the manual? I conducted an experiment
where I tested four different ways to nurture a petunia plant: by feeing it Red Bull, Gatorade, water and sunlight. The plant
that was fed only with water was the control. Based on the fact that energy drinks such as Red Bull and Gatorade are full
of sugar and carbohydrates, I predicted that the petunias which are being fed with these energy drinks will die and the ones
that simply feed off sunlight will die too because they will not receive enough nutrients, which will cause the plants to die
of dehydration. There were three assigned plants for every test; one plant was fed with 0.5 oz of liquid, the other with 1 oz
of liquid and the other with 1.5 oz of liquid. The main equipment used was a ruler (cm) to measure the height of the plants
as they progressed and a measuring cup (oz) to measure the amount of liquid being poured into every plant. Before the
experiment, the petunias all measured 5.5 cm, but after the values varied from 4 cm to 9.8 cm. The petunias that were fed
with 1 oz of Red Bull measured 5.5 cm before the experiment and 5.3 cm after the experiment. All the petunias were in the
sun and all the plants were receiving the same amount of sunlight. In conclusion, water was the best of all the liquids.
It grew one flower and that had two small flower buds after six days. This experiment needed more drinks and different
types of flowers and plants to test if this only happened to the particular petunia plant or could have happened with
any plant. ���
The Effects of Cardiovascular Exercise
My project goes into the depths of exercise and shows the difference between cardiovascular exercise and non-cardio-
vascular exercise. My project shows the difference in and compares the heart rate after doing two types of exercises.
My hypothesis is that a person’s heartbeats per minute (HBPM) will be greater after doing a set amount of jumping jacks
(a type of cardiovascular exercise) as opposed to when they do push-ups (non-cardiovascular type). To measure this
information I used a stethoscope and stopwatch. I took 10 people and measured their heart rates at three different stages
— in a rested mode, after doing 30 jumping jacks and after doing 10 push-ups.
Their heart rates in a rested mode ranged between 67-82 HBPM. Their rates after the jumping jacks varied from 100-140
HBPM, and the rates after the push-ups were from 80-95 HBPM. The difference between the exercises is shown and is very
conspicuous. We see that the heart rates after the jumping jacks are much higher than those of the push-ups. Additionally,
I created two graphs, each comparing a separate exercise to the person in a rested mode. The graphs also show that the
HBPM rate is higher after doing jumping jacks.
In conclusion, this information shows us that people can do different exercises for different things: to get a cardiovascular
workout and to work the upper body. On the other hand, if people wanted to get a different type of workout and exercise,
they could try doing push-ups, which work a completely different area of the body, as shown in this experiment. ���
Michael Ahdoot and S. Cooperman (teacher)
3670 Milken Community High Schoolof Stephen S. Wise Temple15800 Zeldins’ WayLos Angeles, CA 90049
Josephine Amin and S. Cooperman (teacher)
3671 Milken Community High Schoolof Stephen S. Wise Temple15800 Zeldins’ WayLos Angeles, CA 90049
VNY_SciJrnl_interior 9/14/12 10:24 AM Page 67

68 Van Nuys Airport & California State University, Northridge
The Effects of Aspirin-Like Products on Longevity of Cut Flowers
I have always wondered whether or not the addition of aspirin to cut flowers would increase the flowers’ lifespan. In my
project I am testing the effects of generic aspirin, Advil and Extra Strength Tylenol on red cut carnations and their petals. My
hypothesis was that the addition of Extra Strength Tylenol to the cut carnation would allow the carnation’s petals to stay on
longer and not wilt as quickly. I set up three experimental groups by crushing two pills of each medication and placing each,
along with one flower, into a designated disposable cup with one cup of bottled water. I set up one control group using
plain bottled water. In each cup I put one carnation and I observed how many petals wilted and how many dropped for 24
days and checked them in intervals of three days. If I noticed more than half of the petals of a flower were wilted, I checked
that specific flower every day until it was dead.
The equipment I used included the pills, carnations and the disposable cups. In order to crush the pills I used a mortar
and pestle. My controls were the type of water used and the carnations selected, meaning size, shape and color were the
same. The carnation was dead if more than 3/4 of its petals were wilted, its leaves and petals became crunchy, its water
became murky, its petals became darker red, its stem and leaves became brown and started to droop, and if strong odors
were present.
In the end, plain bottled water kept the carnations alive the longest. Carnations with medication additives had wilted petals
ranging from 30 to 33 and dropped petals ranging from five to 15, while carnations in bottled water were alive for 19 days,
had 30 wilted petals, and had five dropped petals. While aspirin kept the carnations alive the shortest number of days, it
had the fewest dropped and wilted petals, but it had the worst effect overall on the plant and stem. The plain bottled water
with no additives ended up being the most beneficial to the carnation in length of life and appearance. ���
What Floats Your Boat?
This project explains how boats float, and what scientific factors allow such an amazing natural wonder. Buoyancy is an
upward force on an object immersed in fluid, which enables the object to float. Density is a measure of how much matter
takes up a certain amount of volume. Saltwater is denser than fresh water because for a certain volume, there is more mass
in the saltwater than there is in the normal water. Since saltwater is denser than fresh water, and makes an object float more
easily and rise higher above the surface, an object in more salt-concentrated water should be able to also carry more weight.
In my experiment, I used measuring cups, plastic bowls, tin containers and quarters (representing the mass each bowl could
potentially carry). I conducted this experiment by placing three identical bowls in three tins full of water. Each tin had a dif-
ferent salt concentration, and the bowl in the tin with the highest salt concentration was expected to rise
higher than the rest of the bowls. Because of this, that same bowl was presumed to be able to carry the most mass
without sinking. This method was repeated for all three bowls, and the same experiment was conducted for my hypothesis.
My data values ranged from 0-. 25 cups of salt, .375-.1625 cups of displaced water, and 198.74-277.19 grams of maximum
mass capability in each bowl. I hypothesized that if I were to have a fourth bowl, in a tin with .375 cups of salt, it would be
able to carry up to a mass of 316.415 g. My conclusions were that the higher the salt concentration of the water, the
higher the boat would float, and the higher the boat would float, the more mass it would be able to carry. The controls in
this experiment were the amount of water in each tin (four cups) and the equipment used for each bowl. ���
Jonathan Dahan and S. Cooperman (teacher)
3672 Milken Community High Schoolof Stephen S. Wise Temple15800 Zeldins’ WayLos Angeles, CA 90049
Chantal Firouz and S. Cooperman (teacher)
3673 Milken Community High Schoolof Stephen S. Wise Temple15800 Zeldins’ WayLos Angeles, CA 90049
VNY_SciJrnl_interior 9/14/12 10:24 AM Page 68

69New Journal of Student Research Abstracts 2007
Treadmill and Elliptical Machine Comparison for Heart Rates
This project compares heart rates of eight people before and after exercising on the treadmill and elliptical machine. When
a person exercises on these two machines, is there a difference in how long it takes the heart rate to return to normal based
on age, gender and which machine one uses? Hypothesis: There will be a difference in heart rates because of the different
factors that I explored. The equipment used in the experiment included a treadmill, elliptical machine and stopwatch. The
controls in the experiment were the length of time exercised, settings on the machines, characteristics of the subjects test-
ed, and the method of collecting the data. Everyone who participated in the experiment exercised on the treadmill at the
levels of incline 1 and resistance 3.5 for 15 minutes and on the elliptical at the levels of incline 1 and resistance 5 for 15
minutes. The subjects were two each of teenage boys, teenage girls, male adults and female adults. The heart rates were
measured before the person exercised on each machine, right after exercise, 5 minutes after exercise and every minute
thereafter until the heart rate got back to normal. Informative sources that were used included the Cleveland Clinic Heart
Book, by the Cleveland Clinic, and The Whartons’ Cardio-Fitness Book, by Jim and Phil Wharton. The amount of time it took
for the heart rates to get back to normal varied from 5 minutes to 13 minutes. Based on the data, it can be concluded that
teenagers’ heart rates return to normal faster than adults’ heart rates. Also, my data revealed that females’ heart rates
recover back to normal faster than males’ heart rates. Also, based on the results of my sampling, it was shown that by
exercising on the treadmill, the heart rate returns to normal faster (by 4 minutes) than when exercising on the elliptical
machine. The results of the experiment supported my hypothesis that different variables, such as the ones I tested, can affect
a person’s heart rate and how it changes when exercising. ���
The Effects of Solutes and Temperature on Surface Tension of Water
Why is it that people can put water into a glass, and it will stay intact above a cup line without overflowing? The reason this
happens is due to surface tension. Surface tension is caused by the cohesive forces between liquid molecules. This force is
caused by the positive and negative charges of the water molecules that attract each other. On the surface of water, the
water molecules are held tight together, causing a thin film. I decided to do an experiment to find out what affects surface
tension of water. My hypothesis was exploring two parameters, temperature and solutes. For temperature, I speculated that
heat would reduce the surface tension and therefore fewer drops would be needed to overflow the cup. For added solutes
(salt and sugar), I thought that they would increase surface tension because they make water more viscous. To start the
experiment, I filled a cup with different types of water – hot water, room temperature water, cold water, hot water with
one teaspoon of sugar, hot water with one teaspoon of salt, and hot water with two teaspoons of salt. I filled the cup
completely to the cup line and then I took a 1-ml medicine dropper and measured how many drops of the water I was using
could fit above the cup line. I came to a few conclusions. First, I was correct that the heat did decrease surface tension
because only 3 ml of hot water, as compared to 4.5 ml of cold water, fit above the cup line. Second, I found out that salt
and sugar actually decrease surface tension, making the cup with hot water and two teaspoons of salt have the least
surface tension. These solutes decreased the surface tension of water by the same amount, since both needed 2.6 ml to
overflow the cup. I concluded that both temperature and solutes reduce the attraction force between water molecules and
therefore reduce surface tension. ���
Daniella Fischel and S. Cooperman (teacher)
3674 Milken Community High Schoolof Stephen S. Wise Temple15800 Zeldins’ WayLos Angeles, CA 90049
Alyse Friedman and S. Cooperman (teacher)
3675 Milken Community High Schoolof Stephen S. Wise Temple15800 Zeldins’ WayLos Angeles, CA 90049
VNY_SciJrnl_interior 9/14/12 10:24 AM Page 69

70 Van Nuys Airport & California State University, Northridge
Effects of Salt on the Boiling Point of Water
My project is the effect of salt on the boiling point of water. My hypothesis is that the addition of salt will affect the boiling
of the water. I think the boiling point will be raised, meaning it will have an effect on the water. My method was I boiled
300 ml of regular tap water to find the boiling point, then I added 15 ml of salt to the pot and reboiled the pot. I then repeat-
ed this process 5 separate times, each time adding 15 ml of salt. This process was repeated 3 times, and then I recorded
the information. The result of this project is that the more salt people add, the higher the boiling point becomes. In conclu-
sion, salt allows water to boil at a higher temperature because it stops the evaporation of the water. The salt is absorbed by
water and then it forms a solution the salt is soluble to. The equipment that I have been using is salt, water, glass pot, oven
and a cooking thermometer. ���
Effects of Fertilizer on Marigold Growth
The project I have been working on has been observing how fertilizer affects the marigold flower’s growth. My hypothesis
was that marigolds would grow faster, healthier and taller under the effects of fertilizer. The method I used to analyze the
fertilizer’s effects was to plant two marigold seeds in one pot with only soil, and another two marigold seeds in a different
pot with soil and fertilizer. My results were that only one seed in the pot with the plain soil grew, although that one marigold
grew taller than both the marigolds in the fertilizer and soil mixture. I concluded that although the marigolds planted in
fertilizer did not grow as tall, they had a better production rate than in regular soil.
The equipment that I used during this project was a ruler to measure the height of the marigold stems, an atmospheric
thermometer to measure the temperature around the marigolds, different measuring cups to measure the amounts of water
and soil/fertilizer, and pots to hold the soil and fertilizer. The control that I had was the two marigold seeds planted in the
regular soil rather than in the fertilizer to see the effects of fertilizer. In terms of the temperature, I compared my
temperatures to the basic 70˚ F that was the best determined temperature for a seed to germinate given by
http://www.jlhudsonseeds.net/Germination.htm. The one seed that germinated in the pot with no fertilizer grew to a final
height of 1.8 cm. In the second pot that contained fertilizer, the final heights ranged from 0.9 cm to 1.3 cm. These marigolds
grew in an average temperature of about 74˚ F, the lowest temperature being 67˚ F and the highest temperature being 78˚
F. In order to find a more accurate depiction of how fertilizer affects marigold growth, I would have still planted them in a
season with a Fahrenheit temperature in the 70s, although I would have done this experiment multiple times. ���
Joshua Friedman and S. Cooperman (teacher)
3676 Milken Community High Schoolof Stephen S. Wise Temple15800 Zeldins’ WayLos Angeles, CA 90049
Nicole Grinstein and S. Cooperman (teacher)
3677 Milken Community High Schoolof Stephen S. Wise Temple15800 Zeldins’ WayLos Angeles, CA 90049
VNY_SciJrnl_interior 9/14/12 10:24 AM Page 70

71New Journal of Student Research Abstracts 2007
Comparison of Duracell and Energizer Battery Lifetimes Using CD Players
Household alkaline batteries generally work in the same fashion; however, the sources of the minerals and amounts of specific elements tend to differ. Because of this simple variation of batteries I pondered which battery between a Duracelland Energizer battery was longer-lasting and why. I presumed that the Duracell battery would last longer because of the commercials that Duracell presents.
With two AA batteries of each company and two Sony CD players, I conducted an informative experiment. By watching whichCD player turned off sooner, I was able to discover which battery was longer-lasting. The Energizer battery lasted 7 hourslonger and 1.398 times longer than the Duracell battery because of a variation in the supply of manganese dioxide.
Due to the difference of expiration dates and other human errors, the experiment was not done perfectly. However, theexperiment did uncover my research question of which battery was longer-lasting. ���
Pain Reliever Coatings and Dissolution
There are many different types of pain relievers and many have different types of coatings. I wanted to find out if the different kinds of coatings and dyes affected the efficiency of the pills and how long it would take for the pills to break downand the medication to be released. I hypothesized that the type of coating on a pill would affect the efficiency, and that thethicker and more colored/sugar-filled the coating, the longer it would take for it to dissolve and the longer it would take untilthe medication started working.
For my project, I used five different kinds of pills, all with different types of coating. I used water with a controlled temperature. I timed how long it took for the pills to reach certain “check points” in my experiment. I timed each type of pilltwice in order to get an average time. I used each brand’s website to get the basic information, as well as an idea of whatto expect by the advertisements (which, I found, were incorrect). I was measuring time, and the range of values for my finalanswers went from about 29 seconds to 44 minutes. I also measured two other points to check how the pill was progressing. I got all my measurements in 98° F filtered water.
My hypothesis was correct; however, I can think of a few ways that my experiment could be more accurate. One way is todo the experiment a couple more times for each pill in order to get a more accurate value. Another is to get an average ofthe pH of stomach acid and of my saliva. I would then use a substance other than water with a pH closer to the value I got.That way I could get more accurate values of what it would be like in a human body. Last, I would vary the temperatures inorder to see if that is a determining factor. ���
Tal Kempler and S. Cooperman (teacher)
Milken Community High Schoolof Stephen S. Wise Temple15800 Zeldins’ WayLos Angeles, CA 90049
David Kolodny and S. Cooperman (teacher)
3679 Milken Community High Schoolof Stephen S. Wise Temple15800 Zeldins’ WayLos Angeles, CA 90049
3678
VNY_SciJrnl_interior 9/14/12 10:24 AM Page 71

72 Van Nuys Airport & California State University, Northridge
Fading of Dycromine vs. Indigo Dyes Due to Solar Exposure
If one cotton T-shirt was dyed with natural indigo, and another T-shirt with dycromine dye, which would fade the least aftera time span of four days? My hypothesis was that the indigo would fade less due to its additives during the actual dyeingprocess. I went about finding the answer to my question by dyeing two T-shirts in my kitchen, one with dycromine, the otherwith indigo, and taking pictures of each shirt for the following four days. I then calculated the hue, saturation and value ofthe color of both shirts by using a computer program called WhatColor, which indicates the intensity of the colors it detects.By the fourth day, the indigo faded the least and my hypothesis proved correct.
I used a variety of equipment including a timer, thermometer, ounces of dycromine, indigo, Dharma’s Dyehouse ColorRemover, Sodium Chloride, Sodium Carbonate, gallons of water, the computer and four cotton T-shirts. I controlled theexperiment by taking the pictures of each shirt at 5:00 p.m. everyday for the four days, in order to assure that each was having the same amount of time to fade. Another control was exposure to the sun. Each shirt was completely concealedfrom sunlight, and each dried indoors. Also, the camera I used to take the photos was set to an exact f-stop and shutterspeed, and each photo was situated to the same “portrait” setting to assure the same lighting. The Internet and encyclopedia were very accommodating and useful as means of gathering information. The information I found helped megather my data. The data, for example, includes an overall 5-unit decline in the hue of indigo, a .13-unit decline in saturation and a .10-unit decline in value. For the dycromine, there was a 7-unit decline in hue, a .6 decline in saturationand a .6 decline in value over the four-day test.
I concluded that the dycromine dye faded faster than the indigo dye in relation to hue, saturation and value. I believe thisis so because the Sodium Carbonate in the indigo enabled the dye to stay more fixed to the cotton, whereas the SodiumChloride in the dycromine was not a strong enough agent. ���
Comparison of Jumping Distances With and Without Nike “Shox”
This project is about a type of Nike shoe called the “Shox,” which has springs on the back of the shoe to make someonejump higher. The hypothesis was that the Shox would work in helping to make someone be able to jump higher. To testthis, three jumps were taken for running starts of 0 m, 10 m and 15 m. The results were that the Shox work on stationaryjumps like 0 m jumps, but do not help on running jumps depending on how far the running jump is.
The equipment used was the two pairs of shoes (one with Shox, one without Shox), a measuring stick to measure the heightof the jump to measure the distances of 0 m, 10 m and 15 m, and pieces of tape on the ground to mark the distances. The controls were that the testing of each shoe be done in the same day, with an hour in between. This will give the bodytime to rest after the first testing, so neither shoe has an advantage. The website sources used were the main Nike website page (http://www.nike.com/main.html), the Nike website page showing the basketball shoes they sell(http://www.nike.com/nikebasketball/usa/index.jhtml?ref=global_home#product_room) and http://health.howstuffworks.com/muscle.htm, which gave information on jumping. The encyclopedia sources used were World Book EncyclopediaL 12, 2002 Ed and World Book Student Discovery Encyclopedia I, J, K, L 12, both of which gave information on the musclesof the leg and how they work. The books used were The American Medical Association Family Medical Guide, Revised andUpdated and Gray’s Anatomy, Classic Collector’s Edition. Both of those book sources also gave information on the leg as well.
The data collected for shoes with Shox was 0 m: 58 cm, 58 cm and 58 cm; 10 m: 62 cm, 62 cm and 62 cm; and 15 m: 62 cm, 62 cm and 63 cm. The data collected for shoes without Shox was 0 m: 52 cm, 52 cm and 52 cm; 10 m: 60 cm, 61 cm and 61 cm; and 15 m: 60 cm, 61 cm and 62 cm. The data ranges from 52 cm to around 63 cm. ���
Alixandra Kriegsman and S. Cooperman (teacher)
3680 Milken Community High Schoolof Stephen S. Wise Temple15800 Zeldins’ WayLos Angeles, CA 90049
Sam Lieberman and S. Cooperman (teacher)
3681 Milken Community High Schoolof Stephen S. Wise Temple15800 Zeldins’ WayLos Angeles, CA 90049
VNY_SciJrnl_interior 9/14/12 10:24 AM Page 72

73New Journal of Student Research Abstracts 2007
Centripetal Force on “Revolution” at Six Flags Magic Mountain
I wanted to prove the theory of centripetal force. My hypothesis was that a quarter would stay in a cup while I was going
through the loop of the “Revolution” roller coaster at Six Flags Magic Mountain located in Valencia, CA, due to centripetal
force. Revolution’s loop is the first loop in the world on a roller coaster that worked by using the clothoid shape. To prove
my hypothesis, I used the Magic Mountain Home Web Page, and used a lot of information about Revolution. I also used
other websites and books to understand centripetal force and the way loops are constructed. My hypothesis was proved
from the following: At the top of Revolution’s loop, the coaster is going about 45 mph. I calculated an estimate for the radius
of Revolution’s loop just by looking at it, and it is roughly 10 "arm lengths" (maybe about 10 meters?). A speed of 45 mph
is roughly 20 m/s. So the centripetal acceleration at the top is about v^2/r = 400 m^2/s^2/10 m = 40 m/s^2 (the Six Flags
Magic Mountain website says 4.9 m/s^2, so I wasn’t too far off). To verify my mathematics, I had to put my
experiment to the ultimate test. First, I tested centripetal force by filling a bucket with water and spinning it around. I spun
a little too slowly at first, and water started spilling out of the bucket. As I started going faster, the water stayed in, and it
proved the theory of centripetal force. What I learned from doing this is that the velocity of the roller coaster matters to make
the coin stay in the cup. Still, I went on the Revolution roller coaster, and tried my experiment. I put a 1989 quarter in a
plastic cup, held it straight up to the sky, and I didn’t move the cup until the ride was over. Fortunately, the quarter
stayed inside the cup throughout the entire ride. The main conclusion that I was able to reach by investigating the centripetal
force on the roller coaster was that even though the roller coaster actually does get slower at the top of the loop (due to
less kinetic energy), centripetal force will keep quarters (people) in the cup (coaster) while going around the loop
of Revolution. ���
Absorption of Oil Spills
Oil spills have been a problem since the beginning of oil transport and will be a problem as long as oil is used and
transported by sea. I created a simulation of an oil spill to test my hypothesis, “Mechanical ways of cleaning up the oil will
be more efficient than the chemical ways and the saltwater will not affect the way that the chemicals clean up the oil.” To
test this, I made an oil spill environment by putting a controlled amount of water and oil into a plastic container. I then used
different chemicals to attempt to clean up the spill over a one-minute duration. I repeated this experiment under the same
conditions and then repeated the experiment in a saltwater environment. In both cases, the chemicals didn’t absorb any oil
but they did displace some oil. In the fresh water, between 0 and 7.54 cm of oil was displaced. In the saltwater, between
-4.1 and 16.81 cm of oil was displaced. My hypothesis was only partially correct. The oil was actually affected by the
chemicals and in some cases it would be better to use chemicals than materials to clean up a spill. I found that the
hydrogen peroxide helped thin out and disperse the oil in the container. This could help scientists who may be trying to see
through a layer of oil in the ocean. The alcohol was able to displace the oil greatly. The oil was instantly repelled by the
alcohol. Alcohol could be used to keep the oil away from certain areas. I did find, however, that the materials were able to
clean up the oil. The materials cleaned up 2.04 to 5.62 grams of oil in a one-minute period of time. The cotton pad,
however, was the most absorbent of the three materials. I also found that bleach definitely should not be used in an oil spill
because it makes the problem worse by spreading the oil out further. I was most wrong in my hypothesis, where I guessed
that the results would not vary in the saltwater. ���
Michael Lipp and S. Cooperman (teacher)
3682 Milken Community High Schoolof Stephen S. Wise Temple15800 Zeldins’ WayLos Angeles, CA 90049
Azad Naim and S. Cooperman (teacher)
3683 Milken Community High Schoolof Stephen S. Wise Temple15800 Zeldins’ WayLos Angeles, CA 90049
VNY_SciJrnl_interior 9/14/12 10:24 AM Page 73

74 Van Nuys Airport & California State University, Northridge
Spin Out vs. Gravity at Six Flags Magic Mountain
The ride Spin Out at Six Flags Magic Mountain counteracts gravity through friction and centripetal force. As the ride spins
and gathers speed, riders are “plastered” to the wall as the floor falls away. In this project the researcher and another
subject wore different kinds of clothing while riding Spin Out three times to determine whether a variety of types of cloth-
ing (friction) will alter the effect of the ride. The Null Hypothesis of this project is that the type of clothing worn will not affect
participants sticking to the wall. The Research Hypothesis of this project is that the various types of clothing, each
generating a different friction, will affect the participants’ ability to move their arms, legs and torsos while sticking to the wall.
Once in the chamber of Spin Out, the researcher timed the speed of one full revolution, 2 s, and measured the diameter of
the chamber, 4.27 m. To get the velocity the formula v = d (circumference)/t was used. Velocity of the ride is 13.4 m/2 s =
6.7 m/s. The control of this project is friction, which is controlled by the clothing the participants wore. The formula µ (mv2/r)
= mg determines whether the participant will slip off the wall of the ride. To obtain the data for µ, the coefficient of friction,
clothing was weighed while it was being dragged against the same surface of Spin Out’s wall, and then that was divided
by its gravitational weight. Next, the researcher averaged the outfit worn on Spin Out to get one outfit µ per ride.
Two participants went on the ride three different times wearing clothing with different friction values. Each time, the
participants attempted similar arm, leg and torso movements and the results of each ride were recorded. When silky
clothing was worn they were able to move their body more, and vice versa for jeans and clothing with rough friction.
The conclusion proved both the hypotheses correct: Each participant will stick to the wall, but each participant will have a
dissimilar experience while riding Spin Out because of the different clothing being worn. ���
Adolescent Obesity and Exercise
This project on exercise and obesity connections investigated how obesity and exercise, measured in steps, are related.
Various sources detail how there is a shocking rise in adolescent obesity, and that obesity has a direct correlation with
physical activity levels. The purpose of this project was to find if overweight adolescents exercise less, in steps, than
“normal” adolescents. The hypothesis stated that overweight adolescents would exercise less than normal teens, which may
be a contributing factor to their obesity. Three male and three female high school age adolescents participated in this study
for seven consecutive days. Three of the subjects were classified at “overweight” by means of a BMI above 25, while three
were classified as “normal” by means of a BMI below 25. The subjects would go about their normal routines for that seven-
day period, recording their steps walked each day, measured with a pedometer, and also recording a brief description of
exercise that day and an “exercise grade” based on their opinion of how much physical exertion they performed that day.
They would also record in that diary their mass in pounds, and height in feet and inches, of which a body mass index would
then be calculated. The controls that I kept on this experiment to minimize error consisted of the following: All subjects were
high school age and of similar socioeconomic background, and they all attended school at the time, having a fairly similar
schedule. The data values ranged from 4,317 average steps a day for one subject to 9,786 for another. Average number of
steps walked for the “overweight” group was 7,005 steps a day, while the “normal” group covered 6,463 steps a day. This
amounts to the “overweight” group walking 542 more steps than the “normal” group, not proving the hypothesis. From this
small-scale experiment, one learns that “overweight” adolescents don’t necessarily exercise less than their “normal”
counterparts. This was not expected at all, and may be due to a number of errors. A large majority of the data could and
probably was measured incorrectly. Moreover, there were not enough subjects to balance out potential error. If the experi-
ment is performed more accurately in the future, the hypothesis will probably be proven correct. ���
Zachary Reid and S. Cooperman (teacher)
3684 Milken Community High Schoolof Stephen S. Wise Temple15800 Zeldins’ WayLos Angeles, CA 90049
Jeffrey Rollman and S. Cooperman (teacher)
3685 Milken Community High Schoolof Stephen S. Wise Temple15800 Zeldins’ WayLos Angeles, CA 90049
VNY_SciJrnl_interior 9/14/12 10:24 AM Page 74

75New Journal of Student Research Abstracts 2007
The Effects of Dyeing on Hair vs. Natural Color
My question is if natural hair color is better for the hair rather than color with more chemicals in it. My hypothesis is that
chemical dyes make hair lose weight, rather than natural dyes which keep or even improve weight. It is said that henna and
other natural dyes condition and improve the hair. Also, once someone continuously colors hair greater amounts of sulfur
are removed from the hair. Loss of sulfur causes hair to harden and lose weight. This is why, for the majority of hair
coloring, the developer is maintained at 30% volume or less. My methods were to color the hair, measure the weight in
grams, take pictures and see the difference in the elasticity and weight. The results were that all the hair gained weight, but
the hair with natural dyes gained more weight and had better elasticity. So in conclusion, my whole hypothesis was not
necessarily correct; however, I was on the right track. My hypothesis could have been better proved if I would have dyed the
hair more times and seen the difference of people who even do more to their hair like straightening or curling it.
I used various things to make my experiment successful, such as hair color, bleach, hair samples, foil, brushes, heater, scale
and a camera. The controls for my project were the pieces of hair before I changed the colors. I used a few books to give
me a generalized idea about hair coloring, but I mostly used websites, such as http://science.howstuffworks.com/
hair-coloring2.htm. The masses for the hair before the color was put on it ranged from 1.5-2.5 g. After the color was
absorbed in the hair, the weight was more and ranged from 3.5-5 g. Even though my hypothesis proved to be incorrect
because I thought the hair would weigh less, the more chemicals the product had in it the less it weighed compared to the
more natural. Even with the bleaches, the more volume the less it weighed. These values were attained from measuring the
hair before any color was put on it. Then, I put foil on all the samples, and even put the samples with bleach on them under
the heater. This process took about 20 minutes. This somehow proves that more natural dyes are better for someone’s hair
and even improve the elasticity because of the curliness of the hair after people pull on it. The more it curls the less healthy
it is. When someone colors their hair with chemicals for a long time, the hair runs out of elasticity and the hair curls more
when pulled.
My conclusion is that I needed more samples of hair to really get a clear answer to my question. I should have gotten
opinions from people who have colored their hair and saw what their conditions were depending on the other things they
have done to their hair as well. My conclusions show that natural color does improve the condition of the hair both in the
weight and the elasticity because the hair weighed more after it was colored with natural dye. My other conclusions are that
hair loses weight after it is dyed for many years, so I should have dyed the hair over and over again. My last conclusion is
that maybe hair color is not as bad as I thought. My next step would be to retry the project with more samples to try to
verify my hypothesis or prove it false once and for all. ���
Nicole Shoohed and S. Cooperman (Teacher)
3686 Milken Community High Schoolof Stephen S. Wise Temple15800 Zeldins’ WayLos Angeles, CA 90049
VNY_SciJrnl_interior 9/14/12 10:24 AM Page 75

76 Van Nuys Airport & California State University, Northridge
Water Resistance and Swimwear
Past research has indicated that water resistance-lowering swimwear can increase swimming velocity, but most, if not all, of
this research has focused on the performance of elite swimmers, generally evaluating high-tech full-body suits. I wanted to
conduct an experiment to know if the scale of improvement is measurable in the real-life performance of an amateur
swimmer using more modest equipment. My hypothesis was that a swim cap reduces water resistance enough to
noticeably increase the velocity in a streamline.
I used a Speedo “Solid Silicone” swim cap, a bathing suit, pool, tape measure, water thermometer, Microsoft Excel,
stopwatch and ropes. I then measured the change in velocity due to the use of a cap, water temperature and fatigue.
To measure each factor I streamlined 24 times on each of 4 different days, in sets of 6. Once the 96 streamlines were
recorded, I eliminated the fastest and slowest streamline of each set from the data. I arranged the remaining data in
Microsoft Excel, and analyzed it according to cap or no cap, water temperature and set number (to analyze fatigue). I used
various websites, two science books and two journals of scientists who conducted experiments related to mine.
The velocity increase wearing a cap was 21%. The average velocity with a cap was 0.95 m/s and the average without a cap
was 0.79 m/s, not including the eliminated 32 streamlines. Although there was a pattern of velocity increase with increased
water temperature, the temperature did not appear to influence the velocity increase provided by the cap. Throughout the
average day there was no overall pattern of velocity change, but the velocity increase provided by the cap showed a pattern
of decrease. Set 1 took an average of 0.85 m/s and had a 25% increase with the cap, while set 4 had an average of
0.86 m/s and had a 16% increase with the cap. The average distance achieved with a cap was 5.46 m and without it
was 5.21 m. The results show that the use of a swim cap has a measurable impact on the performance of an amateur
swimmer. ���
Comparing First-Drop Velocities of Goliath vs. Colossus at Six Flags Magic Mountain
In this project I will be discovering whether the velocity of Goliath’s or Colossus’ first drop is greater. I have gone to the Magic
Mountain theme park many times and while riding Colossus I have felt that the velocity on the ride’s first drop is greater
than the drop on Goliath. However, Goliath is supposed to have the largest drop in the park. So I decided to figure out which
velocity is bigger. My hypothesis is that Goliath’s is bigger because it looks like it has larger slope and has less friction because
it is a steel coaster and Colossus is a wooden coaster.
I have been using a few select types of equipment to aid me in my project. I used the method we used to measure the clock
tower, a stopwatch and trig functions to help me get to my final answer. My controls are based on figuring out whether my
methods are accurate and can get me a reasonable answer when applying the methods to different situations. For
example, trig functions worked when I applied them to triangles where I knew the answer, so that proved to me that they
would work on an even larger scale. The sources that gave me definitive answers are the Six Flags Information Desk and
Stephen Cooperman. Most of my methods to reaching my final answer were derived from all my notes and learning I had
done that year in class. My values varied from the height of the coasters in meters (Goliath: 75.9 m… Colossus: 33.8 m) to
the time it took to ride the first drops, in seconds (Goliath: 6.76 s… Colossus: 4.06 s).
My conclusion to my essay proved my thesis to be right. Goliath's drop had a larger velocity than Colossus’. ���
Abby Zwick and S. Cooperman (teacher)
3687 Milken Community High Schoolof Stephen S. Wise Temple15800 Zeldins’ WayLos Angeles, CA 90049
Pejman Aftalion and S. Cooperman (teacher)
3688 Milken Community High Schoolof Stephen S. Wise Temple15800 Zeldins’ WayLos Angeles, CA 90049
VNY_SciJrnl_interior 9/14/12 10:24 AM Page 76

77New Journal of Student Research Abstracts 2007
Chocolate AddictionIn my project I tested the nature of chocolate addiction on eight random teenagers and adults. I had four of these subjects
continuously eat chocolate every day for one month, while the other half of the subjects ate chocolate three times a day for
one month. I predicted that all the subjects would feel the need to eat chocolate; however, the second group would have
stronger cravings. My hypothesis was proven to be correct as I had each individual describe what kinds and severity of
cravings he or she felt. The only control I had over the experiment was the amount of chocolate each subject had consumed.
I urged them to vary between what type of chocolate they wished to eat, for in the real world, most people addicted to
chocolate eat several different kinds of it. On average it appeared that the individual weights of the subjects did affect their
cravings, as a positive correlation was seen between the weights and the severity of the addiction for both groups. However,
the independent variables of past history, age and gender were untested in this experiment so it is unknown how large of
a factor they played as part of the addiction. The only materials in use were the chocolates the subjects ate (unsupplied),
and paper and pencil that were used for journals so I could analyze how they felt during the process. The addiction scale
I used ran from one to ten (ten being the highest) and my results varied from four to nine among the scale. The average of
both groups was seven. The numerical value of seven stood for the level of feeling the need to have chocolate at least once
every day subsequent to the experiment. I used five websites and a book for past history. Along with the eight people I test-
ed, those were my only sources. ���
How Temperature and Surface Affect Rebound Heights of BallsCan the same ball bounce at two completely different heights? Can the same ball bounce at a consistent height? I know that
a ball can change its rebound if the surface, temperature outside and the temperature of the ball are altered. However, the
question is by how much will the heights differ? When I bounced six balls different in sizes and in materials from one meter
on concrete and grass unfrozen and frozen in the night and day, I thought the biggest change in one ball would be about
20 centimeters. When I bounced the balls on concrete, their heights ranged from 30 cm to 80 cm. Although on grass, the
heights were about fixed at 20 cm besides the basketball. This is a 10- to 60-cm decrease rather than a mere 20-cm
decrease! I also believed that no ball would bounce the same height on concrete and grass. However, the basketball, the
highest-bouncing ball on average during my experiment, bounced at a constant of about 50 centimeters on all conditions,
even on the grass. I also thought that due to the conservation of energy, cold balls would bounce lower than hot ones
because they convert their kinetic energy to thermal energy rather than potential energy like the hot balls. This turned out
to be true overall. Moreover, the freezing states affected the balls more directly than the temperature outside. Therefore, the
balls bounced lower when frozen in the day than unfrozen in the night.
To calculate the rebound heights, I used a leveler, a 3-D 122-cm ruler that stood upright, which made it much easier to
bounce the balls. However, on the grass it did not stand, so I placed the leveler on top of a dictionary and took into account
the extra height when I was gathering data. My control is the unfrozen ‘live’ tennis ball bounced in the day on concrete. The
bounce height is about 63.2 cm, which is about four times as high as its grass bounce under the same conditions. The
sources I used for this project were the science textbook, websites that gave much background information, an encyclope-
dia and a reference database. All of these sources were very helpful to me in completing my project. ���
Kyle Beiser and S. Cooperman (teacher)
3689 Milken Community High Schoolof Stephen S. Wise Temple15800 Zeldins’ WayLos Angeles, CA 90049
Cory Caplan and S. Cooperman (teacher)
3690 Milken Community High Schoolof Stephen S. Wise Temple15800 Zeldins’ WayLos Angeles, CA 90049
VNY_SciJrnl_interior 9/14/12 10:24 AM Page 77

78 Van Nuys Airport & California State University, Northridge
How Long It Takes Alcohol to Freeze in Relation to Its Percentage Alcohol
The purpose of this experiment was to discover whether drinks with higher alcohol contents take longer to freeze. Based onprevious knowledge and some research I have done, I assumed that as the percentage of alcohol goes up, so would thetime it took to freeze. Ethyl alcohol, the alcohol in the beverages we drink, typically freezes at –114˚ C, whereas water’s freez-ing point is 0˚ C. The weaker the intermolecular forces in a liquid, the lower the freezing point, meaning that the forcesbetween molecules in alcohol must be weak.
I used 50 milliliters of room-temperature alcohol with four different alcohol contents: 17%, 35%, 40% and 50.5%. Then, I added 50 milliliters of room-temperature water so the liquid would be able to freeze in a household freezer. The experiment was conducted three times with the same amounts of the same brands of alcohol in the same freezer. Usinga long skewer to determine when the liquid had frozen, I timed how long it took to freeze each time.
My values for the 17% alcohol were around 178 minutes until it froze. For 35%, the average was 253 minutes, 40% was272 minutes, and lastly, for 50.5%, the average was 402 minutes. By conducting my experiment and researching the topicfrom World Book Encyclopedia and websites such as “How Stuff Works” and Purdue University’s, I have concluded that asthe alcohol content in a liquid rises, so does the time it takes to freeze. Using Microsoft Excel, I was able to find a formulathat suits my graph well: y=115.08e0.0234x, where x is the percentage alcohol and y is minutes it takes to freeze. ���
How Open Fruits and Vegetables Respond ByDiscoloration/Changing Color to Atmospheric Contents
Open fruits/vegetables respond by discoloration/changing color to atmospheric contents. Over various periods of time, different fruits/vegetables react to atmospheric content in a range of discoloration. The method being used to perform theexperiment is observing open, freshly cut fruits/vegetables over an 11-hour time period under controlled settings, whilerecording the data required to successfully draw conclusions. I have noticed the discoloration of fruits and vegetables in market displays. Presenting open fruits/vegetables is a marketing strategy to attract more customers. Sometimes, when theyshow signs of discoloration, it works as a negative factor in the marketing goal. Through this experiment, it will be discovered precisely how long it takes for certain open fruits/vegetables to change color and to what degree. The discoloration of the samples is recorded every hour. The measuring scale to record the change in color of the fruits/vegeta-bles is a computer program, WhatColor, as well as a personal discoloration scale. Individual containers are used to keep thesample fruits and vegetables in. A 2.0-megapixel digital camera with flash is utilized to take hourly photos of the samples.This experiment is conducted in a highly controlled environment. The room is without natural sunlight. The distance andangle from which the pictures are taken is also constant. The temperature is set at a constant and the humidity is controlled.The experiment begins by cutting the fresh and unwashed fruits and vegetables. After the first fruit or vegetable is cut, it isplaced in its container and moved to its area where the experiment will take place. Pictures are taken of the samples’ original state of coloration and the time is recorded (pictures of each fruit/vegetable are taken within a 1-minute span). Thisexact procedure of taking pictures and recording the time is repeated hourly. Throughout this 11-hour time period, thechanges in color are translated into a range of numbers from 0-10, 10 being the maximum darkness for each specific sample and 0 being its original color. Based on the experiment conducted, the main conclusion drawn is that many openfruits/vegetables do not significantly change color as they are exposed to atmospheric contents. However, some samplesthat did change color were extremely affected. Additionally, there were some fruits/vegetables that were expected to considerably change color during the experiment, but that did not respond as expected. Though the experiment involvedsomewhat unexpected results, it was an informative study that I will attempt to continue investigating. ���
Emma Cramer and S. Cooperman (teacher)
3691 Milken Community High Schoolof Stephen S. Wise Temple15800 Zeldins’ WayLos Angeles, CA 90049
Mike Dardashti and S. Cooperman (teacher)
3692 Milken Community High Schoolof Stephen S. Wise Temple15800 Zeldins’ WayLos Angeles, CA 90049
VNY_SciJrnl_interior 9/14/12 10:24 AM Page 78

79New Journal of Student Research Abstracts 2007
Effect of Sugar Concentration on Microwave Heating Rates of Substances
This project examined the effect of sugar concentration on the rate in which a substance is heated in the microwave oven.
The microwave works by sending waves to excite the individual molecules, particularly sugar and water. Since a sugar
molecule has more atoms than a water molecule, the hypothesis was that sugar molecules can absorb more microwaves
and, therefore, the higher the sugar concentration in a substance, the higher the temperature the substance will reach after
being heated in the microwave for a given amount of time. Solutions with a volume of 200 ml were prepared. The solutions
consisted of different concentrations of sugary substances such as honey, corn syrup and Log Cabin syrup. For example, there
was a solution that consisted of 100 ml of water and 100 ml of honey. Solutions had concentrations of sugar varying from
0 g/ml to 1.07 g/ml and carbs from 0 g/m to 1.13 g/ml. The temperatures of the solutions were measured with a
thermometer before and after they were heated in the microwave for 60 seconds on the highest power level. In the second
trial of the experiment, solutions were heated for 90 seconds on the same power level. The temperatures ranged from
156º F–208º F in the first trial, and from 198º F–225º F in the second trial. The substances that had more sugar and carbs in
them were at a higher temperature in both trials of the experiment. The trend of the data was linear and showed that the
higher the concentration of sugar and carbs in the substance, the faster it heated within a given amount of time. The hypoth-
esis was proven correct. ���
How Mass Affects Frictional Force
Does mass affect frictional force? My guess was that it does in a major way. I believed that if there was too high of a mass
an object would not stay suspended on the wall of a circular chamber while spinning. I then proceeded to put this
hypothesis to the test. I put many items with high and low masses within a circular moving chamber to see whether they
would stick to the wall or just fall down. The results were that mass does not affect this process at all. The entire thing is
based on the radius and velocity of the chamber.
In my project I used measuring tape, a stopwatch, a water balloon, an air-filled balloon and a marble ball. I then put the
balls in the chamber and monitored the outcome. The main thing that led me to my conclusion that mass doesn’t matter is
the equation u=rg/v2. The fact that this equation does not include mass at all is proof enough that mass is an unnecessary
part of this project. Using the stopwatch I was able to find the velocity of the chambers and all the information I needed to
reach my conclusions. I then searched the Internet, finding many sources on how friction works, and what all the science
behind my project was. This is what led me to learn the truth about my project and why. ���
Allen Dokhanian and S. Cooperman (teacher)
3693 Milken Community High Schoolof Stephen S. Wise Temple15800 Zeldins’ WayLos Angeles, CA 90049
Keren Freedy and S. Cooperman (teacher)
3694 Milken Community High Schoolof Stephen S. Wise Temple15800 Zeldins’ WayLos Angeles, CA 90049
VNY_SciJrnl_interior 9/14/12 10:24 AM Page 79

80 Van Nuys Airport & California State University, Northridge
The Endurance of the Calf Muscle
In everyday life, the calf muscle is taken for granted and its factors are not considered. Two unique hypotheses in relation
to the calf muscle are: one, the larger the circumference of the calf muscle, the more weight it can hold, and two, a male’s
calf muscle will have more endurance than that of a female. In order to conduct the experiment to answer these
hypotheses, the circumference of the person was measured with measuring tape and he or she performed three sets of 10
repetitions each on the leg press machine repeatedly at an exponential weight. After gathering and analyzing the data, the
first hypothesis was proven while the second was disproved.
The data ranged from circumferences measuring 12 inches to 15 inches, with the weight ranging from 72 pounds to 120
pounds. A person with a circumference of 12 inches could endure 72 pounds, while 13 inches could endure 82 pounds,
14.25 inches could endure 108 pounds, and 15 inches could endure 120 pounds. This clearly shows that the calf with the
largest circumference can endure the most weight. In regard to the second hypothesis, the two males could endure 108 and
120 pounds, respectively, while the two females could endure 72 and 82 pounds, respectively. If one were to conduct this
experiment again, however, with the male and the female obtaining an identical calf circumference, the conclusion might
be entirely different.
The controls of the experiment were the equipment and the amount of reps and sets. The independent variables were the
circumferences of the calf and the amount of weight each calf could endure. In terms of background information prior to
the experiment, two websites, an encyclopedia article and a course in weight training were used as sources. ���
Dissolution of Advil in Different Liquids
My project is on the dissolution of Advil in different liquids. My hypothesis for this experiment was that the hot water would
dissolve the Advil the quickest. My procedure was having 6 different liquids, and then dropping an Advil in each liquid. After
dropping the Advil in, I stirred the liquid slowly and measured the times of dissolution. My results proved my hypothesis to
be correct. The hot water dissolved the Advil the fastest, while the Gatorade took the longest to dissolve. The experiment
proved that the pH level takes effect in the dissolution process. The more acidic a liquid, the longer it will take to dissolve
the Advil. Water, which has a neutral pH level, took the shortest to dissolve the Advil. The liquids that I tested were tap water,
hot water, Gatorade, Coke, milk and orange juice. The equipment I used was 6 Advil tablets, 6 glasses, a mixing stick and a
stopwatch. My independent variable is the Advil tablets, while the dissolution time is the dependent variable. The hot water
took under 2 minutes to dissolve, while the acidic Gatorade took over 16 minutes. My conclusion is that for the quickest
results from Advil tablets, people should take the medicine with a liquid with a high pH. Drinks with acidic pH levels,
like Coke, Gatorade and orange juice, take longer for the Advil to dissolve, and could hinder the purpose of Advil. The most
acidic liquid was Gatorade, with a 2.95 pH level, while the most basic was water, which had a 7 pH level. I analyzed my data
by measuring how much time it took for each liquid to dissolve the Advil. I then put that information in a graph and
compared it. ���
Joey Freeman and S. Cooperman (teacher)
3695 Milken Community High Schoolof Stephen S. Wise Temple15800 Zeldins’ WayLos Angeles, CA 90049
Dean Gordon and S. Cooperman (teacher)
3696 Milken Community High Schoolof Stephen S. Wise Temple15800 Zeldins’ WayLos Angeles, CA 90049
VNY_SciJrnl_interior 9/14/12 10:24 AM Page 80

81New Journal of Student Research Abstracts 2007
Testing Archimedes’ Principle and How It Helps in the Buoyancy of a Ship
Archimedes’ Principle states, “An object in a fluid experiences an upward force equal to the weight of the fluid displaced by
the object.” I sought to test this principle and have a better understanding of how a boat floats by conducting my own exper-
iment. I chose 3 samples to work with: 2 pieces of wood (one painted, one not painted) and a simple kitchen cup. The 2
pieces of wood both had densities less than that of the water, while the cup had a higher density. According to the princi-
ple, if I placed each sample into the water, the mass of each sample would be equal to the mass of the water it displaced.
I measured the samples’ masses using a Salter Nutri-Weigh and recorded 30 g, 39 g and 184 g. I then placed them each
into a Zyliss beaker and marked each one at water level so that I could later calculate the percentage of mass underwater
for each sample (notice how the cup floats even though its original density is more than 1 g/ml). Meanwhile, I recorded the
volume of the water they each displaced (30 ml, 45 ml, 195 ml). I then carefully calculated the masses of each displaced
value and got 26 g (off by 4), 43 g (off by 4) and 174 g (off by 10). Although the outcome was not precisely what it should
have been, I believe Archimedes’ theorem was proven. Next, I analyzed the data and related it to ship design. From my exper-
iment, it was shown that wood is a very floatable substance; the percentage of mass underwater for the non-painted wood
was only 43.3%. Next, it was important to understand how the cup was floating. When a broken piece of the cup was placed
into the water, it sunk to the bottom. However, when it was a full cup, it was floating with 58.2% of its mass underwater.
The water level was barely over halfway its height, which indicated that most of its mass was on the bottom of the cup.
When combining the two ideas of a floatable substance (wood or air), and an ingenious design (structure of a cup), it is
much easier to understand how boats float, and why they are designed the way they are. ���
Dissolving Salt Into Water
This project is set up to answer how much table salt (NaCl) can dissolve in different amounts of water with different water
temperatures. The hypothesis for this experiment is that each amount of water will have a certain limit where it cannot dis-
solve any more table salt. When there are smaller amounts of water, less salt will be able to dissolve. More salt will dissolve
in higher water temperatures. The equipment list is as follows: boiling kettle, measuring spoons (tbsp and tsp), measuring
cup (cups), table salt (NaCl), water (H2O), thermometer (C) and containers. In the 27 total experiments, there were 3 dif-
ferent water temperatures used: 40 C, 60 C and 80 C. The thermometer was used to check the accuracy of the water tem-
peratures. In each different water temperature, 3 amounts of salt and water were used (3 amounts of salt, 3 amounts of
water). They were 1/2 cup water with 1 tbsp, 1 cup water with 2 tbsp, and 2 cups water with 3 tbsp. Of these combinations,
the control was a mix of 2 tbsp of NaCl into 1 cup of 60 C water. The measuring cup was used to measure water amounts
and the measuring spoons were used to measure salt. In each separate experiment, the amount of undissolved salt was
measured to calculate the amount of dissolved salt by subtracting the undissolved amount from the original amount. The
background information sources for this project include websites, an online encyclopedia database and an encyclopedia
book. The amounts of dissolved salt in the experiments ranged from approximately 0.833 tbsp to 3 tbsp. In the end, the
hypothesis was partially correct. It stated that each water amount would have a certain point where it would not dissolve
any more salt in the same temperature, but this did not occur in the experiments. When there was more salt added to the
same amount of water in the same temperature, more salt dissolved. The hypothesis also had true statements. It declared
that when there are smaller amounts of water, less salt would dissolve. This statement proved to be true, and it’s due to the
fact that with less water, there is less area to dissolve. Another true statement the hypothesis made was that the higher the
water temperature, the more salt that will dissolve into the water. When the temperature of the water rose, it was easier for
salt to dissolve. ���
Sam Handelman and S. Cooperman (teacher)
3697 Milken Community High Schoolof Stephen S. Wise Temple15800 Zeldins’ WayLos Angeles, CA 90049
Alex Heikali and S. Cooperman (teacher)
3698 Milken Community High Schoolof Stephen S. Wise Temple15800 Zeldins’ WayLos Angeles, CA 90049
VNY_SciJrnl_interior 9/14/12 10:24 AM Page 81

82 Van Nuys Airport & California State University, Northridge
How Height Affects Performance of Long-Distance Runners
My experiment’s goal was to see how height affects the performance of long-distance runners in the one-mile event. By
testing 15 runners all at the same time, in the same event (the mile), which was the control, I was able to see if being either
tall or short is better if people are running the mile. I took their heights using a measuring tape, and also took their weights
using a scale. I also calculated their BMI (body mass index) using the formula kg/meters^2. By finding out people’s BMIs
I could see more in-depth if height in fact does affect their performance. If given more time I would have had all 15 runners
be of the same BMI, but unfortunately there were not enough people to work with so I had to settle for varied BMIs. Many
conclusions were drawn from this experiment. The first was that most of the runners who were average height were in the
average performance range as well. Four out of five of the top runners were taller than the average height (the top five
runners’ average height being 176.28 cm and the other 10 slower runners’ height being 172.47).
There are still tall people who did not necessarily perform that well. By knowing this it is safe to say that height definitely
plays an important role in the success of runners in the one-mile event, although solely based on height they cannot achieve
anything. Most likely the leg length is what affects the times most because they can cover more ground in each stride. It is
helpful to be tall because each stride is greater and therefore people cover more ground. It is also most certainly true that
the BMI of the runners plays a role in the outcome of their performance. I used a number of resources to research this
project. I used two websites and the books Officiating Track & Field and Cross Country and Track and Field. I also used the
encyclopedias International Track and Field Coaching Encyclopedia and Encyclopedia of Track & Field. ���
Noah Ickowitz and S. Cooperman (teacher)
3699 Milken Community High Schoolof Stephen S. Wise Temple15800 Zeldins’ WayLos Angeles, CA 90049
VNY_SciJrnl_interior 9/14/12 10:24 AM Page 82

83New Journal of Student Research Abstracts 2007
Baseball Dynamics During Hitting
When hitting a baseball, the bat makes contact with the ball at a certain degree, which mainly according to the degree of
contact decides the distance that the ball will travel. How are the degree of contact and the distance that the ball travels
directly in relation to each other? Stemming from this question, one can try to prove that a ball hit at a certain degree will
travel the same and opposite distance when hit an equal distance from 90, 180, 270 and 360 degrees.
In order to discover the relationship between the degree of impact between the baseball and the bat and prove the
hypothesis, the velocity of the ball pitched, the transfer of energy and momentum from the bat to the ball, the final
velocity after impact, the velocity in both the X and Y directions, and the distance in the X-direction that the ball travels would
need to be found. Through research and experiments, the data proved both the relationship between the degree of impact
and the distance that the ball travels and the hypothesis. First, the final velocity needed to be found of a baseball pitched at
59.18 m/s (95 miles/hr) and hit by the bat going 56.07 m/s (90 miles/hr). The final velocity of the ball hit came out to be
59.19 m/s. Using degrees (skipping every 20, but including 90 and 270 degrees) up to 360 degrees, the final velocity of the
baseball was plugged into the Y-direction distance formula in order to find the time that the hit baseball was in flight through
the quadratic formula. Once “time” was found, it was plugged into the X-direction distance formula, along with the
X-direction velocity in order to find the distance that the ball traveled. Lastly, a graph of data could be formatted to find an
equation for a ball in flight at 59.19 m/s. As a conclusion, a ball hit at 90 degrees and 270 degrees (180 degrees more, a
straight line) went 0 meters and a ball hit at 180 and 360 degrees traveled a distance of –1.5 meters and 1.5 meters. These
degrees seemed to act as a root for every other degree around them. It was evident that if a ball was hit at the same and
opposite distance from one of these root degrees, then the ball traveled the same and opposite distance from the related
degrees. For example, a baseball hit at 60 degrees traveled a distance of 0.868 meters, while a baseball hit at 120 degrees
traveled a distance of –0.868 meters. Both 60 degrees and 120 degrees are 30 degrees from 90 degrees, one of the roots.
In order to conduct this experiment, a TI-83 calculator, class notes, outside resources on the conservation of momentum and
energy, paper, a pen, and a scale to weigh a regulation baseball and wooden bat were used. The calculations and
experiments made were all under conditions, assuming that the weather that the baseball was hit in was moderate, and
there was no wind. Also, the drag, friction, barometer, humidity and extra conserved acceleration caused by the
compacting of the baseball at impact were not accounted for in the calculations and experiments. In this experiment, the
independent variable was the degree of impact between the bat and the ball and the dependant variable was the distance
that the ball travels. ���
Russell Levine and S. Cooperman (teacher)
3700 Milken Community High Schoolof Stephen S. Wise Temple15800 Zeldins’ WayLos Angeles, CA 90049
VNY_SciJrnl_interior 9/14/12 10:24 AM Page 83

84 Van Nuys Airport & California State University, Northridge
Effects of Acid Rain on Plant Growth
The project observed how acid rain affected plants and measured acidic water evaporation. This project measured physical
changes in the plants (height and discoloration), the amount of acid water they received each day in feedings and in the
adjacent cups, and if the cups with higher acidity would evaporate at the same rate as cups with a lower acidity. The cups
and the plants were each put into a plastic bag with some holes; this way I was able to measure if the more acidic water
dissipated at the same rate as the neutral water.
I used a ruler to measure the plants in inches, and used a 300-ml measuring cup to measure the water, 22 ml for the big
plant and 15 ml for the small plant. Every plant received 2.5 ml of acid, which was diluted in water to become less acidic.
The cups also had the same amount as the plants. Two pH measurers were used: one was pH-sensitive paper and one was
a pH-sensitive machine.
The dependent variable in this experiment is how the plants are affected after being given acidic water. The independent
variable is the level of acidity in the water. The buffering capacity is the ability to resist changes in pH. The acid will not kill
the plants, but instead it will weaken their leaves and limit the received nutrients. The controls for this experiment are the
soil, type of plant, sunlight and amount of water. The soil is the same for all the plants. They are also each outside in a two-
foot area, meaning they are getting about the same amount of sunlight. In addition, the amount of water each plant received
was measured to be the same amount. The water was bottled in order to have a starting control on initial water clarity.
The data analyzed shows how the plants receiving higher levels of acidity grew slower and started to “brown” quicker.
The plants receiving higher acid levels measured less evaporation in the adjacent cups than the plants receiving less acid.
Several scientific errors were discovered during the course of the experiment. The holes in the plastic bags were not count-
ed for consistency. The air temperature was not measured each day to attempt a correlation between air temperature and
evaporation in the cups. The air temperature and amount of air in the plastic bags was not measured. Finally, although
measurements of the plants were taken each day, a useful method of representing the changes in measurements and
correlating them to the other data points was not found.
As my experiment shows, the more neutral water dissipated faster than the regular water. The plants which received more
acidic water became browner, signifying that they were starting to die. Websites were used as the main source of informa-
tion. They provided the information that was used on acid rain and acid. ���
Tal Link and S. Cooperman (teacher)
3701 Milken Community High Schoolof Stephen S. Wise Temple15800 Zeldins’ WayLos Angeles, CA 90049
VNY_SciJrnl_interior 9/14/12 10:24 AM Page 84

85New Journal of Student Research Abstracts 2007
Effect of Table Salt on the Boiling Point of WaterDoes NaCl have an effect on the boiling point of H2O, and if so, what? This is the question I chose to answer with my
experiment. Before setting out to do my experiment I predicted that salt should raise the boiling point of water. First the
boiling point of water was examined, then 1 tsp of salt was added to the same amount of water to keep the consistency,
then 2 tsp, followed by 3, 4 and 12 tsp of salt (1 tsp of salt = 10.67 g/tsp). As a result I found that the more salt added to
the same amount of water increased, the more elevated the boiling point of the water became. The first control of the
project was the use of distilled water. Regular tap water may have access chemicals, such as chlorine, which are used for
sanitary purposes. However, these chemicals would add impurities to the project, changing the outcomes by adding
unaccounted for variables. Distilled water is sanitized in a different way; heat is used to sanitize the water instead, making
it the purest H2O available. The second control of the project was pressure. Pressure has the ability to change the boiling
point of water. Therefore, the project was done on a single afternoon where the pressure was consistent. The equipment I
used to measure the temperature of the boiling water was a digital thermometer. At first a cooking thermometer was used;
however, it provided inaccurate results. With the addition of salt, the boiling point of the water raised at first by .4˚ C with
10.67 g/tsp of NaCl, then by .9˚ C with 21.34 g/tsp of NaCl, then by 1.3˚ C with 32.01 g/tsp, then by 1.7˚ C with 42.68 g/tsp,
and finally by 3.4˚ C with 128.4 g/tsp. ���
Temperature Effects on the Longevity of Light Sticks
I observed the effects of different temperatures on the longevity of light sticks. My hypothesis was that temperatures below
74˚ F slow down the chemical reaction that causes light sticks to glow, extending their lifespan, and that temperatures above
74˚ F shorten their longevity. I used four light sticks, a refrigerator set to 34˚ F, a freezer at 0˚ F, an isolated area at room
temperature (74˚ F), 1.5 cups of boiling water, a transparent glass, a coffeemaker to boil water, a measuring cup, a baking
thermometer, a camera and stickers in three different colors to distinguish between the four light sticks. I activated all four
light sticks and placed them in the four different starting temperature settings: the refrigerator, the freezer, room
temperature and boiling water. Three hours later, the boiling water reached 74˚ F. I removed the light stick from the water
and the light stick from the freezer, and left them with the light stick at room temperature. The heated, frozen and room
temperature light sticks were kept at 7˚ F. Because light sticks are created for temperatures between 60˚ F and 80˚ F, room
temperature served as a control in my experiment. The formerly heated light stick and the light stick at room temperature
diminished the soonest. The frozen light stick had to reach room temperature before it could fade. They lasted 25.5-68 hours,
depending on the temperature they were placed in. Because the light stick in the refrigerator was at a constant cold
temperature, the chemical reactions in the light stick slowed down. It lasted the longest, 68 hours, whereas the
temporarily heated light stick diminished after only 25.5.
I researched how light sticks work in scientific encyclopedias and websites; I also researched sources of light and
chemiluminescence in my school Physical Science book and on www.Howstuffworks.com. My observations and data led me
to understand that if a light stick is heated (over 80˚ F), the energy speeds up the reaction, resulting in a more brightly
glowing light stick. The acceleration reaction of the compounds shortens the lifespan of a light stick as the energy depletes
faster. If the temperature is lower than 60˚ F, the light emitted will be less bright and will last longer. As temperature declines,
glowing intensity decreases and duration of light productivity increases. ���
Natalie Milstein and S. Cooperman (teacher)
3702 Milken Community High Schoolof Stephen S. Wise Temple15800 Zeldins’ WayLos Angeles, CA 90049
Michelle Peleg and S. Cooperman (teacher)
3703 Milken Community High Schoolof Stephen S. Wise Temple15800 Zeldins’ WayLos Angeles, CA 90049
VNY_SciJrnl_interior 9/14/12 10:24 AM Page 85

86 Van Nuys Airport & California State University, Northridge
Goalkeeping Aerodynamics
The project studies the physical aspects of the dive of a goalkeeper using aerodynamics. To complete this project, three
examples were used. These examples include different forces of the soccer ball coming from different locations. Due to this,
the goalkeeper’s velocity changes. The project mathematically and physically proves the method and dive. When diving to
the left, the jump is off of the left foot with the right knee going into the air making contact with the ball with the right fist.
When diving to the right, the jump is off of the right foot with the left knee going into the air making contact with the ball
with the left fist. Using the times and distances of movement, height of jumps and velocity of the ball, the dive is established.
Various equipment was used for this project to establish a goalkeeper’s dive. A video camera with a timer was used to cap-
ture the methods and motions of a goalkeeper and accurately record times. A soccer field and goal were used for the film-
ing. Soccer balls were used for the goalkeeper to deflect. One of the controls in this project is the force that the ball travels.
This control will change the goalkeeper’s response time and the velocity of the goalkeeper’s jump. The acceleration of the
ball can be controlled to change the response time. The vertical height (2.29 meters) of the “perfect shot” is always constant
and thus also a control.
For Dive 1, the height of the jump was .74 m; for Dives 2 and 3, it was .36 m. The horizontal distance of each jump for Dive
1 was .55 m; for Dives 2 and 3, it was 1.19 m. The distance of the run for Dive 1 was 5 m; for Dives 2 and 3, it was 5.97 m.
The goalkeeper’s velocity in the air for Dive 1 was 18.4 m/s; for Dives 2 and 3, it was 20.7 m/s. The velocity of the ball in
the air for Dive 1 was 7.92 m/s; for Dives 2 and 3, it was 6.49m/s. All measurements were the averages of two trials per
dive. ���
24-Hour Sleep Deprivation: Effects of Sleep Loss on Eyesight
A main problem in the lives of many people today is lack of sleep. But could lack of sleep actually be harmful to our health?
I predicted that lack of sleep could be harmful to our health as well as our vision. Through my experiment I was able to con-
clude that lack of sleep can affect eyesight and its accuracy. My experiment was accurate because I was sure to include all
measures that would affect eyesight, including what I ate, what activities I chose to do and how much water I drank. After
getting a full 12-hour sleep I took the “eye test” for the first time by trying to read my accuracy-testing sheet that I made
myself. This is a sheet similar to the ones the doctor uses in a checkup. After that I checked my eyesight every 6 hours to
see the decrease of vision. I got information from various websites that talk about a disease called glaucoma that is caused
by internal eye pressure. Internal eye pressure can be caused by stress, which is caused by not sleeping and being over-
whelmed with work. I wanted to see how fast this could kick in so therefore I chose to do this research project. I wanted to
see how many rows of the testing sheet I would be able to read as time progressed. My values varied from being able to
read until the 7th row and then only being able to read until the 4th row. For example, after being awake for 18 hours I
could only read until the 5th row. When I got to the 24th hour, besides hardly being able to keep my eyes open, I was only
able to read up to the 4th row accurately. My conclusion is that as eyes grow more tired throughout the day, the harder it
is for them to see small objects, such as small letters that are 15 ft. away. ���
Alisa Sheldon and S. Cooperman (teacher)
3704 Milken Community High Schoolof Stephen S. Wise Temple15800 Zeldins’ WayLos Angeles, CA 90049
Alyce Tawil and S. Cooperman (teacher)
3705 Milken Community High Schoolof Stephen S. Wise Temple15800 Zeldins’ WayLos Angeles, CA 90049
VNY_SciJrnl_interior 9/14/12 10:24 AM Page 86

87New Journal of Student Research Abstracts 2007
How Tylenol and Aspirin Dissolve in Carbonated Water
This project will observe the difference of how long it takes Tylenol and Aspirin to dissolve in eight fluid ounces of
carbonated water. My hypothesis is that Aspirin will dissolve more quickly than Tylenol due to their chemical difference.
I conducted the same experiment on both Tylenol and Aspirin. I used a ruler, a measuring cup, a stopwatch and my keen
eyes as my equipment for the experiments. My controls included eight fluid ounces of carbonated water for each
experiment, performing them in the same room, and using one tablet of each medicine. First, I measured the tablets’ diam-
eters in millimeters by using a ruler. Next, I placed the tablets into eight fluid ounces of carbonated water. After every minute,
I took out the tablets and measured their diameters’ new length. I continued by recording my data. This procedure occurred
until the tablet dissolved in the water. Once I conducted these experiments, the results showed that Tylenol did take longer
to dissolve than Aspirin. It took Tylenol four minutes, whereas it took Aspirin only one minute to dissolve. Tylenol started out
with a diameter of 15 millimeters. After one minute, it was 14.5 millimeters. After two minutes, it was 14 millimeters. At this
point, it was a stable pattern. However, after three minutes, it had dropped to two millimeters and then dissolved complete-
ly after the fourth minute. Aspirin only took one minute to dissolve, so I performed another experiment by measuring its
diameter after 20 seconds. It started off as 11 millimeters. After 20 seconds, it was 10 millimeters. After 40 seconds, it was
one millimeter and then dissolved shortly after that. My hypothesis was proven correct by the experiments I performed.
Some sources I used were medical websites that provided profuse information for each medicine, a medical encyclopedia,
and a medical and scientific dictionary. In conclusion, I believe my experiments were successful and fascinating. With more
time, I would have explored other methods of dissolving these two medicines and possibly tested them on humans to see
which is more effective. ���
Factors That Affect Blood Pressure
I have been researching various factors that influence blood pressure rates. Blood pressure is the pressure exerted by the
blood against the walls of the blood vessels. An average healthy adult has a blood pressure of 120 mm Hg systolic and 80
mm Hg diastolic. Systolic pressure is the highest pressure in the arteries during the cycle in which the heart pumps blood
through the body. Diastolic pressure is the lowest pressure in the arteries during this phase. My hypothesis is that the fac-
tors that most significantly influence a person’s blood pressure include weight, age, gender and physical activity. In order to
conduct this experiment, I measured the blood pressures of four groups of people: people of different weights, ages, gen-
ders and levels of physical activity. I discovered that a person’s blood pressure increases with his or her weight and age. My
graph shows that physical activity does not influence a person’s blood pressure. However, research shows that physical activ-
ity is essential to maintaining a normal blood pressure and preventing a high blood pressure, known as hypertension.
Gender does not influence the blood pressure rates. Therefore, my hypothesis turned out partially correct because weight,
age and physical activity influence blood pressure, while the effects of gender are not so clear.
An auto inflatable blood pressure cuff was placed on the person’s arm, it automatically tightened up, and the rates appeared
on the screen. The controls include sitting down, on the left arm and in the morning. The sources used were The World Book;
a book on the Management of Essential Hypertension; Wikipedia Online Encyclopedia; National Heart, Lung, and Blood
Institute; American Heart Association; and MedicineNet. Some things I did not consider when conducting my experiment
were what people consumed earlier in the day that would influence their blood pressure, such as salt or coffee. If I had more
time, my next step would be to make the physical activity data more accurate by including other factors such as age and
weight in the graph, and repeat the experiments to ensure their accuracy. ���
Ashley Torkan and S. Cooperman (teacher)
3706 Milken Community High Schoolof Stephen S. Wise Temple15800 Zeldins’ WayLos Angeles, CA 90049
Natalie Turner and S. Cooperman (teacher)
3707 Milken Community High Schoolof Stephen S. Wise Temple15800 Zeldins’ WayLos Angeles, CA 90049
VNY_SciJrnl_interior 9/14/12 10:24 AM Page 87

88 Van Nuys Airport & California State University, Northridge
Humidity Effects on Guitar Sound
My question is if humidity in the air affects the production of sound from a guitar. My hypothesis is that humidity would
impede a guitar’s ability to make sound. Humidity is water in the form of gas, and its molecules are very active, creating
motion in the air. Since the sound waves would take longer to travel through the air, I assumed that the note itself would
sound lower to a human ear and a recording device, due to the disturbances in the air from water vapor. There are other
components that contribute to a guitar being on tune, such as pitch and the interaction between vibrating elements; how-
ever, my experiment focused on the environmental effects on sound. My methods were to use a digital tuner to make sure
the guitar was correctly tuned in an open, non-humid environment, and then use the tuner to check if it stayed on tune with
humidity in the air. I took the tuner and guitar into a shower, allowed the hot water to run for thirty minutes while the door
and windows were sealed, and then tested it again. The results were split half-half. The first three notes went down in a
humid environment, and the next three went up. In conclusion, my whole hypothesis was not necessarily correct; however,
I was on the right track. Humidity does indeed affect the production of sound, just not in a particular manner. My
hypothesis could have been better proved if I would have measured the humidity in the shower with some sort of tool, and
if I would have measured in different levels of humidity and with a variety of instruments.
I used various things to make my experiment successful, such as a guitar, a digital tuner, a shower, a towel and a camera.
The control for the project was that I set the guitar to the pre-prescribed tuning before it entered a humid environment.
I used books and websites to glean background information about guitars and humidity, such as
http://www.bsharp.org/physics/stuff/guitar.html and The Physics and Psychophysics of Music: An Introduction. The pitches
for all the strings were zero originally, except for D and G, which were very hard to tune to the perfect pitch. When I tested
the strings in the humid environment, E was -30, A was -40, D was -30, G was +20, B was +10 and the high E was +10. A
negative number means that the pitch is too low or flat. A positive number means it is too high or sharp. Although not all
the notes turned out to be flat in humidity, they did show a significant change. I had physically altered the tuning of the
guitar, but due to the disturbances in the air, the pitch changed from its original level.
My hypothesis that humidity would slow down the frequency of a guitar string, affecting the pitch and causing the note to
sound lower, was incorrect. In some cases, the note was lower; however, it was also higher in certain instances. My
conclusion is that humidity does, in fact, affect the production of sound, just not in any particular manner. My conclusions
show that sound can go both ways, either lower or higher, but cannot be unaltered by the humidity in the air. ���
Rachel Weiss and S. Cooperman (teacher)
Milken Community High Schoolof Stephen S. Wise Temple15800 Zeldins’ WayLos Angeles, CA 90049
3708
VNY_SciJrnl_interior 9/14/12 10:24 AM Page 88

89New Journal of Student Research Abstracts 2007
Generating Solar Power at Home
This experiment considered whether we can increase use of solar power by installing solar panels in houses. Usually solar
power is generated from sunlight, but if we could reuse some of the power used for indoor lighting, we would further
benefit the environment. However, I have hypothesized that although sunlight is practical to use to power a house, indoor
incandescent and fluorescent lights are not.
I measured how much voltage is generated by a solar panel under different conditions. The panel I used contains 36 solar
cells, 19.05 x 25.4 centimeters. The panel’s output was measured with a voltmeter under scattered clouds, bright sunlight,
fluorescent light and incandescent light (40 watts) while the panel was angled at 0°, 30°, 50°, 70° and 80°. As a control I
measured how many volts the panel generates with no light.
At 0° the cloudy sunlight made 17.78 volts, the bright sunlight made 19.48 volts, the fluorescent light made 1.88 volts and
the incandescent light made 9.62 volts. As the angle increased the voltage decreased for each source. At each angle, the
sunlight generated more electricity than the indoor sources. In the dark, the panel produced 0 volts.
In conclusion, sunlight is practical for generating electricity for homes, but indoor light is not. The incandescent light
generates a maximum of 1.44 watts. People would need about 28 panels to power only one 40-watt bulb. As a result, put-
ting panels inside would not generate enough power to make them practical. ���
Baking Powder vs. Baking Soda
Is there a true difference between baking powder and baking soda in an ordinary chocolate chip cookie recipe? Coming into
this project, I thought that the baking powder would make the cookies rise more than the cookies with baking soda because
baking powder not only has baking soda in it, but other substances that contribute to leavening which baking soda does not
have. In proving this, I made four batches of cookies: one with just baking powder, one with just baking soda, one with both
and one with neither. Results show that baking powder gives the cookies more height, and thus more volume. They also
had more mass. Yet in terms of density, the batch with both soda and powder had most. I conclude from these results that
since in volume and mass, the batches with both and neither were surprisingly close, maybe having both or neither
doesn’t make a true difference. I also conclude that the cookies with just baking soda are denser because of their short
stature and lack of volume.
The ingredients I used in making the cookies include flour, granulated and brown sugars, salt, vanilla extract, baking soda
and powder, eggs and butter. Other equipment I used in performing this experiment is an ice cream scoop, baking sheets,
measuring cups and spoons, oven, parchment paper, scales and rulers. My control is the original cookie recipe containing
just baking soda. This is what I manipulated to perform my experiment. Books and websites have been my main sources in
finding information all discussing the chemical and physical differences between baking soda and powder.
In terms of the averages between batches for volume my data ranges from 51.338 cm3 for the batch with baking soda to
57.650 cm3 for the batch with baking powder. For the averages between batches for mass my data ranges from 29.295 g
for the batch with baking powder to 27.095 g for the batch with baking soda, and for the averages between batches for
density my data ranges from 0.5438 g/cm3 for the batch with both soda and powder to 0.5128 g/cm3 for the batch with
baking powder. ���
Jillian Weyman and S. Cooperman (teacher)
3709 Milken Community High Schoolof Stephen S. Wise Temple15800 Zeldins’ WayLos Angeles, CA 90049
Robert Kanter and S. Cooperman (teacher)
3710 Milken Community High Schoolof Stephen S. Wise Temple15800 Zeldins’ WayLos Angeles, CA 90049
VNY_SciJrnl_interior 9/14/12 10:24 AM Page 89

90 Van Nuys Airport & California State University, Northridge
Duplicating the Cavendish Experiment
In my experiment I wanted to cancel out the gravity of the Earth using a torsion balance in order to see the attraction
between two smaller massed objects and two larger massed objects. I created a torsion balance like Cavendish that helped
the gravitational attraction between the objects become more evident. Torsion balance has often been used to measure
either the gravitational constant (G) or test the equivalence principle, which states that everything experiences the same
gravitational force arbitrary to its composition. By doing this experiment I was able to prove that the forces on the objects
are due to the gravitational attraction. I did this experiment twice. The first time I created a torsion balance of my own using
wood, two 4-lb. lead fishing weights, two 30-lb. pier blocks, a pulley and some strings. For a balance arm I used a piece of
1/2-inch plywood measuring 24 in. x 3.75 in. It is important to note that the density of the support of the balance arm was
much less than that of the test masses so it did not influence the gravitational attraction, for a water brake (a fin attached
to the bottom of the balance arm and lowered into a container of water) helped prevent the balance arm from rotating too
randomly. For this I used a plastic CD cover and a Tupperware bowl. For the larger masses I used two 30-lb. pier blocks
(made of concrete, a high-density material). I predicted the gravitational attraction from Newton’s law to be F = 9*10-9 N.
In the first setup I used fishing line (as the support fiber), which was too heavy a gauge, resulting in too much torsional
strength (resistance to being twisted). This prevented the balance arm from rotating freely. In addition, the test masses first
used (1.82-kg lead weights) placed too much weight on the support fiber. This also contributed to unnecessary torsional
resistance, further inhibiting the balance arm from swinging freely. The second time I performed the experiment I used a
lighter (.45 kg = 1 lb.) test mass on each end of the balance arm, which not only lessened the torsional resistance of the
support fiber, but also allowed for use of a lighter gauge fishing line, permitting greater freedom of motion for the balance
arm. The gravitational attraction could then be recalculated using the new test mass weight: F = 1.8*10-8 N.
Using a protractor I measured the distance the weights were attracted every 5 minutes. The maximum time was 90 minutes.
Through this experiment I learned that as the masses come closer to each other the moveable masses accelerate. Through
this experiment I have demonstrated the universal nature of gravitation. Using a torsion balance I effectively canceled the
Earth’s gravity, thus allowing the smaller gravitational force that exists between my test masses to become evident. ���
Using the Standard Microbial Lava Lamp® (MLL) Protocol toCompare CO2 Production of Simple vs. Complex Sugars
We used the 10% sugar solution in the Standard Microbial Lava Lamp® (MLL) protocol, developed by King and Tomasek, to
test CO2 production of some simple sugars (monosaccharides) against some complex sugars (disaccharides).
Our simple hypothesis was that disaccharides would produce twice as much CO2 as monosaccharides during the yeast
respiration within the MLLs. It was a naïve hypothesis in that it ignored possible complex enzymatic activity within the yeast,
Saccharomyces cerevisiae, during sugar digestion. This activity might reduce CO2 output. The simple sugars we tested were
monosaccharides: glucose monohydrate, D-fructose and D-galactose anhydrate. The complex sugars we tested were
disaccharides: sucrose, maltose and lactose. We found that, on average, the complex sugars (disaccharides) produced 1.5
times the CO2 bubbles in the MLLs than the simple sugars (monosaccharides). Quantitatively, this did not confirm our naïve
hypothesis of two times CO2 output of disaccharides over monosaccharides. However, it did show a significant qualitative
difference in respiration rates between the two sugar types. Further research is required on the enzymatic processes within
MLL’s glass/alginate/yeast beads during cellular respiration. This research is needed in order to more precisely predict
quantitative CO2 outcomes. We anticipate that the Microbial Lava Lamp could be a useful tool in testing these new
hypotheses. ���
Raquel Cedar and S. Cooperman (teacher)
3711 Milken Community High Schoolof Stephen S. Wise Temple15800 Zeldins’ WayLos Angeles, CA 90049
S. Bozuki, H. Delafraz, K. Garden, M. Golab, S. Kohandarvish, A. Paullada and D. Gaughen (teacher)
3712 Taft High School5461 Winnetka Ave.Woodland Hills, CA 91364
VNY_SciJrnl_interior 9/14/12 10:24 AM Page 90

91New Journal of Student Research Abstracts 2007
The Ridiculously Sensitive Charge Detector
Our hypothesis was that the charge detector would detect static electricity up to five feet away, provided that there were no
obstacles so enough static electricity could produce. Our procedure started with placing the electroscope in a specific area.
We combed our hair so we could produce static electricity. Then from different distances away from the electroscope, we
tried to see if the electroscope could detect static electricity produced by the comb. We started from six inches away, and
then we went to one foot, two feet, three feet, four feet, five feet and lastly six feet away from the electroscope. We tallied
the results of our experiment. We analyzed the results to see if they matched our hypothesis. The results showed the model
electroscope was able to detect static electricity six inches, one foot, two, three, four and five feet away, but was not able to
detect static electricity from six feet away. These results agree with our hypothesis. In conclusion we learned how to create
electroscopes, or charge detectors. We learned how they could detect static electricity. Their ability to detect static electrici-
ty depends on different circumstances, like distance, humidity, etc. ���
The Design of a Bridge
My purpose of doing this project was to find out how bridges can be so simple, yet strong and balanced. I hypothesized that
the cable-stayed bridge would be the most stabilized of all three. It appeared to have the most support from the cables.
I also hypothesized that the arch bridge would be the second most stabilized because it had the support from the arch under
the bridge. I predicted that the beam bridge would be the weakest because it had only a few supports from columns or
blocks. The miniature bridge I built shows how the blocks (poles), arches under the bridge, and dowel cables can support
a roadway. The blocks help support both ends of the bridge to stand, but there is nothing in the middle to help it when it
comes to loads. Therefore, there is the arch under the bridge that helps support the middle of the roadway so that it will
not snap easily and is able to carry heavier loads. But when there is a cable, the bridge does not need the arch or central
columns because the supporting cables pull the compressing loads, which helps stiffen the bridge.
After testing all three, my conclusion is that the cable-stayed bridge is the strongest. The cable-stayed bridge is the strongest
because the bars or strings pull as the loads compress, and this makes the bridge and roadway balanced and
stabilized equally. The arch bridge only stood still as the loads compressed, and that may balance, but it won’t last as long
as the cable-stayed bridge because the forces are not equal and so the arch can snap easily. The beam bridge won’t stand
a chance because the poles only supported each end of the bridge with nothing in the middle to help, so the middle part
can snap easier than the arch bridge. ���
Vivian Quan and C. Hall (teacher)
3713 De La Salle School16535 Chatsworth St.Granada Hills, CA 91344
Regin Jay Mallari, Justin Pastor and C. Hall (teacher)
3714 De La Salle School16535 Chatsworth St.Granada Hills, CA 91344
VNY_SciJrnl_interior 9/14/12 10:24 AM Page 91

92 Van Nuys Airport & California State University, Northridge
Will the Granular Fertilizer Shake ‘n Feed by Miracle-Gro Harm theSpecies of Collembola, Lepidocyrtus northridge?
We conducted an experiment to see if Lepidocyrtus northridge will be affected by the granular fertilizer, Shake ‘n Feed. We
believe this granular fertilizer will not harm the collembola. To test our hypothesis, we built homes for the collembola by
putting one part charcoal and nine parts plaster of Paris in 18 petri dishes. We added water, stirred and allowed them to dry.
Since collembola prefer a moist environment, we added drops of water to the environments. Next, on each side of half the
petri dishes, we added three grains of fertilizer. The other nine petri dishes without the fertilizer were used as the control
for the experiment. Yeast was placed in each petri dish for the collembola to eat. Ten to 20 collembola were placed in each
of their new environments. We used stereomicroscopes and hand lenses to count the number of live collembola every
school day for three weeks. Our final data resulted in 86% of the collembola alive in the environment and 84% alive in the
control. Our hypothesis was right: The Miracle-Gro Shake ‘n Feed did not harm the collembola. ���
Does the Granular Fertilizer Colorburst Harm the Species ofCollembola, Lepidocyrtus northridge?
The purpose of this experiment was to determine if the species of collembola, Lepidocyrtus northridge, is harmed by the
granular fertilizer Colorburst. We hypothesized that this fertilizer would not harm the collembola. Collembola are tiny
arthropods that are usually found in leaf litter and soil environments. To make habitats for our collembola to live in, we
placed nine parts plaster of Paris and one part charcoal into 16 petri dishes. We added water to the mixture, stirred and
allowed it to dry. Yeast was added to the petri dishes for the collembola to eat and drops of water were added to keep the
environment moist. To half of the petri dishes we added six grains of the Colorburst fertilizer. The other half of the petri
dishes served as our control. We observed the collembola each school day with stereomicroscopes and hand lenses to
determine any changes in population size of the collembola for three weeks. The results of the experiment showed a
decrease in the population in the control to 82% and a decrease in the experiment to 70%. Our hypothesis was incorrect:
The Colorburst fertilizer did harm a species of collembola. ���
Adrian Almazan, Jonathan Avitia, Jamie Bak, Trevor Baker, Nicolas Boutros, Sarah Bugayong,Amanda Butch, Giselle Calderon, DianaDominguez, Kristian Eang, Francisco Guzman Jr.,Alma Huerta, Tamar Iglesias, Luis Jimenez, JenniferQue Le, Calley Macdonald, Ana Marroquin, OndricoMartin, Edward Melgar, Michael Ngo, Jeremy Ortiz,Cesar Palomino, Jorge Partida, Luis Perales, KyleQuiambao, Karen Turcios, Cindy Velasquez, RaulVera Jr., Carl Viray, Alexander Williams, AmandaZepeda, Jonathan Zohar and T. Miller (teacher)
3715 Holmes International Middle School9351 Paso Robles Ave.Northridge, CA 91325
Karin Aghoian, Justine Arisue, Gabino Avila,Michael Bishay, Raphael Capitulo, Jeanette Casillas,Josalyn Castillo, Alexa Cicchetti, Claire Cooper,Felisha Dodge, Stella Fernandez, Daniella Macneil,Beatriz Navarro, Jonathan Nguyen, Mindy Nguyen,Ricardo Orellana, Jose Ortiz, Edwin Peraza,Matthew Robinson, Kristina Roxas, Jorge Salazar,Linda Samano, Michael Snyder, Delvin Supannarat,Katelyn Vogler, Jake Waitley, Jimmy Wu, Lawrence Yong, Gabriela Yoque and T. Miller (teacher)
3716 Holmes International Middle school9351 Paso Robles Ave.Northridge, CA 91325
VNY_SciJrnl_interior 9/14/12 10:24 AM Page 92

93New Journal of Student Research Abstracts 2007
Which Material Holds Its Color Best in Bleach?
The purpose of my experiment was to see which material would hold its color best when bleached. I hypothesized that nylon
would hold its color best when bleached. The first thing I did was record the type of material and color of each cloth. I then
cut each piece of cloth to measure about 2 square centimeters. I labeled six different cups with the names of the material:
wool, nylon, linen, cotton, acetate and polyester. I put each piece of cloth in the designated cups. I poured 1/4 cup of bleach
into each cup and waited for two days, each day recording any color changes. I observed that both the wool and nylon lost
their color and turned a yellowish-white. The linen and cotton lost their color and disintegrated. The acetate disintegrated
almost immediately, while the polyester didn’t even change color at all. My hypothesis was incorrect; the polyester was the
only material that didn’t lose its color in bleach. ���
Do Seventh-Grade Boys or Girls Have a Better Short-Term Memory?
I conducted an experiment to see if seventh-grade boys or seventh-grade girls have a better short-term memory. I believe
that the girls will have a better short-term memory than the boys. To test my hypothesis, I tested 20 seventh-grade boys
and 20 seventh-grade girls, making 40 students in total. I gave the seventh-graders 15 pictures to look at for 15 seconds.
Then I asked them what they remembered and recorded their answers. The boys’ percentage for remembering the pictures
was 52.33%, while the girls’ percentage was 59%. My hypothesis was correct: The girls did have a better memory than
the boys. ���
Karin Aghoian and T. Miller (teacher)
3717 Holmes International Middle School9351 Paso Robles Ave. Northridge, CA 91325
Michael Bishayand T. Miller (teacher)
3718 Holmes International Middle school9351 Paso Robles Ave.Northridge CA 91325
Can I Use Iodine to Determine Whether a Triglyceride is Saturated or Unsaturated?
The purpose of my project was to use iodine to determine whether a triglyceride is saturated or unsaturated. My hypothe-
sis was that if a triglyceride is unsaturated then it will appear reddish when mixed with iodine. A triglyceride is an organic
compound that is made of one molecule of alcohol glycerol and three of fatty acids. Glycerol is organic alcohol and fatty
acids are organic acids. To begin this project I bought five test tubes. I filled each half full with safflower oil. Then I added to
each test tube two drops of tincture iodine. After putting two drops of iodine in each of the test tubes, I then mixed each of
them with a popsicle stick. I observed each of the test tubes’ colors and recorded data. I stood each of the test tubes in a
pot and heated them. After five minutes I put on the heat mitten, took the clamps and removed the test tubes. I observed
the color of the safflower oil in each of the test tubes. I placed them back in the pot and repeated the step until there were
further changes in the color of the test tubes. The results of the experiment showed that before heating the test tubes, tubes
1 through 4 turned pale reddish-brown after adding iodine, and the control test tube with no added iodine was pale yel-
low. After heating for five minutes, test tubes 1 through 4 were pale yellow-orange and the control remained a pale yellow
color. After heating for 10 minutes, test tubes 1 through 4 were pale yellow and even the control was still pale yellow. Finally,
after heating for 15 minutes, test tubes 1 through 4 were still pale yellow and even the control was still pale yellow. The
results indicated that heating the unsaturated fat caused the double bonds to break and bind to iodine atoms, and convert-
ed unsaturated to saturated, thus turning the red iodine color to colorless saturated fat molecules. Therefore, my hypothe-
sis was correct because if a triglyceride is unsaturated then it will appear reddish when mixed with iodine. ���
Nicolas Boutros and T. Miller (teacher)
3719 Holmes International Middle school9351 Paso Robles Ave.Northridge CA 91325
VNY_SciJrnl_interior 9/14/12 10:24 AM Page 93

94 Van Nuys Airport & California State University, Northridge
The purpose of this experiment was to determine if the species of earthworms (Lumbricus terrestris) prefers to live in leaf
litter or soil. I hypothesized that the soil would be most preferred over the leaf litter. To make a habitat for my earthworms
to live in I cleaned a gallon-size glass jar and alternated six layers of soil and leaf litter inside it, making sure that each layer
was distinct, and a half-inch thick. At the bottom of the jar I put a layer of sand and gravel for drainage. I then put lettuce
and a small piece of tomato on top of the jar for the earthworms to eat. I added nine earthworms to my jar and covered
the jar with black construction paper because the earthworms like the dark. I then tightly stretched cheesecloth over the top
of the jar to secure it. Every day for two weeks I checked the jar and counted how many earthworms were in each layer. The
results of the experiment showed that 90% of the earthworms preferred the leaf litter instead of the soil. My hypothesis was
incorrect; the most preferred habitat for the earthworms was the leaf litter. ���
Will Enzymes Found in a Detergent Affect Protein?
I conducted an experiment to see if enzymes found in laundry detergent will affect protein. I believed that they would affect
the protein. To test my hypothesis, I filled up twelve jars with distilled water and labeled four jars “With,” four jars “Without”
and four jars “Control.” Then, I added fifteen milliliters of laundry detergent with enzymes in the jars labeled “With” and
stirred. Next, I added fifteen milliliters of laundry detergent without enzymes to the four jars labeled “Without” and stirred.
Before I placed eggs in the jars, I observed the surface of each egg first with a hand lens and then placed each egg in each
jar for seven days. For the next seven days, I took out each egg and observed the effects of enzymes by observing the change
in the surface of each egg. The results were: The eggs in the jars with enzymes had rough, edgy surfaces, while the eggs in
the other two jars without enzymes were unaffected. My hypothesis was correct; the enzymes found in the detergent affect-
ed protein. ���
Does a Species of Earthworms Prefer to Live in Leaf Litter or Soil?
Amanda Butch and T. Miller (teacher)
3720 Holmes International Middle School9351 Paso Robles Ave.Northridge, CA 91325
Raphael Capitulo and T. Miller (teacher)
3721 Holmes International Middle School9351 Paso Robles Ave.Northridge, CA 91325
What Wing Shape Creates the Most Lift and at What Angle?
I conducted an experiment to see what wing shape can create the most lift and at what angle the lift
was. I believe that the airfoil will create the most lift. To test my hypothesis, I made three different
shapes: a cube, a cylinder and an airfoil. I made an apparatus to hold the wing types, the protractor
and the string. I made a hole through the wood with a drill and I taped the protractor on the wood.
I put the string through the wood. I put each shape through the string that was on the wood and
turned on the fan. I did the experiments on low and high speeds. With the protractor, I measured the
angle of the lift and with a ruler I measured the length of the lift. My final results were that the airfoil
created the most lift on both high and low fan speeds with 85 centimeters and an angle of 90
degrees. The cylinder’s length of the lift on low was 15 centimeters and the angle of the lift was 60
degrees; on high speed the length of the lift was 60 centimeters and the angle of the lift was 85
degrees. The lifting length of the cube, when the fan speed was on low, was 10 centimeters and the
angle of the lift was 30 degrees; on high the length of the lift was 12 centimeters and the angle was
35 degrees. My hypothesis was correct: The airfoil created the most lift. ���
Jeanette Casillas and T. Miller (teacher)
3722 Holmes International Middle School9351 Paso Robles Ave.Northridge, CA 91325
Co-Winner: Best Aviationor AerospaceAbstract for 2007
VNY_SciJrnl_interior 9/14/12 10:24 AM Page 94

95New Journal of Student Research Abstracts 2007
What Effect Do Magnets Have on the Growth of Seedlings?
I conducted an experiment to see if radish seedlings would be affected when magnets were placed in different locations in
the pots. I believed that the radish roots would grow away from the magnets the closer the magnets were to the seeds.
To test my hypothesis I labeled three pots A, B and C. I placed a magnet at the bottom of pot A, a magnet on the top of pot
B, and no magnets in pot C. The pots with the magnets were used as the experiment. The pot with no magnets was the
control. I placed six seeds in each of the three pots. Each morning I turned on a grow light at 7 a.m. and turned the light off
at 8 p.m. Each night after I turned off the grow light, I watered each of the pots with 100 ml of water. I did this for 16 days.
In pot A, the roots grew toward the magnet in the bottom center of the pot. In pot B, the roots grew toward the magnet in
the center of the pot. In pot C, the roots grew downward in the pot. As a result, my hypothesis was incorrect. I found out
that the roots of the radishes grew toward the magnet. ���
Will the Collembola Like Red Star Yeast Better Than Hodgson Mill Yeast?
The purpose of this experiment was to find out if the collembola liked the Red Star Yeast or the Hodgson Mill Yeast best. I
hypothesized that the collembola would like the Red Star Yeast. Collembola are microscopic insects that live in soil. To make
environments for my collembola to live in, I took two petri dishes and placed plaster of Paris in each of them. Then, I added
water to make their environment cool and moist. After that, I took thirty collembola and put fifteen of them in each petri
dish. Next, I put five pieces of the Hodgson Mill Yeast on one side of each petri dish and the Red Star Yeast on the other
side of both petri dishes. I observed my collembola every other day with a hand lens and wrote down data. I checked to see
what yeast the collembola ate more of. The results of my experiment showed that the collembola ate more of the Hodgson
Mill Yeast than the Red Star Yeast. My hypothesis was incorrect. The collembola ate more of the Hodgson Mill Yeast. ���
Alexa Cicchetti and T. Miller (teacher)
3723 Holmes International Middle School9351 Paso Robles Ave.Northridge, CA 91325
Claire Cooper and T. Miller (teacher)
3724 Holmes International Middle School9351 Paso Robles Ave.Northridge, CA 91325
Detergents and Pond Life
I conducted an experiment to see if high-phosphate laundry detergent affects pond plants Elodea and Duckweed, and pond
animals Daphnia and Zebra Snails. I believe that the detergent in water harms the Elodea, Duckweed, Daphnia and Zebra
Snails. To test my hypothesis, I made homes for the pond life. In the first jar, I put 5 drops, in the second jar I put 10 drops,
in the third jar I put 20 drops, in the fourth jar I put 40 drops, and in the fifth jar I put 80 drops of detergent water. I didn’t
put any detergent water in the control. In each jar, I put one Elodea, a few Daphnia, two Duckweed and two Zebra Snails. I
observed the jars every day for 18 days. My final data resulted in 100% of life in the control, 30% of life in jar one, 9% of
life in jar two, 0% of life in jar three, 0% of life in jar four, and 0% of life in jar five. To arrive at my percents, I added the
total of life up and converted it into a percent. I believe the three jars ended up resulting in no life because of the phos-
phate, so the more phosphate, the less life. I came to find that my hypothesis was correct. The detergent in water does harm
Elodea, Duckweed, Daphnia and Zebra Snails. ���
Felisha Dodge and T. Miller (teacher)
3725 Holmes International Middle School9351 Paso Robles Ave.Northridge, CA 91325
VNY_SciJrnl_interior 9/14/12 10:24 AM Page 95

96 Van Nuys Airport & California State University, Northridge
What Colors Are Insects Attracted to the Most?
The purpose of my experiment is to see what color insects are attracted to the most. I hypothesized that if more insects are
attracted to the color pink, then more insects will land on the color pink. Insects are six-legged arthropods. In order to test
my hypothesis, I cut cardboard pieces into six 12 x 12 squares and painted them green, purple, pink, yellow, orange and
black. Then, I placed each of my squares on the front lawn. I observed the squares for four days, two hours in the morning
and two hours in the evening, and recorded all the insects that landed on the squares. After my observations, I added all
my data together to determine my results: 12 insects landed on the color green, seven insects landed on the color purple,
six insects landed on the color pink and three insects landed on the color yellow. There were 28 insects all together. In con-
clusion, my hypothesis was incorrect because more insects were attracted to green than pink. ���
Let’s See About Vitamin C
The purpose of this experiment was to see which fruit had the most Vitamin C. Was it an orange, lemon, mango, grapefruit
or a pineapple? If oranges have the most Vitamin C they should appear lighter in the indicator iodine. In order to see if my
hypothesis was right, I put 1 tablespoon of cornstarch in a bowl and slowly stirred in drops of water until it was a paste
consistency. I then added 11/4 cups of water to the paste and placed it in a pot and let it boil for 5 minutes. In a separate
container, I added 10 drops of the starch solution to 1/3 cup of water (using an eyedropper). I added iodine drops into the
1/3 cup of solution until it was a dark purple color. I put a teaspoon of the above mixture into separate medicine cups (one
for each fruit tested). I then used a clean eyedropper and put 10 drops of juice from each fruit (rinsing the eyedropper
between fruits) and added it to the mixture. After I treated each sample, I observed the multiple reactions and organized
each cup from lightest to darkest. I repeated this experiment twice. I discovered my hypothesis was correct. Oranges have
the most Vitamin C out of the 5 fruits tested. ���
Marlee Hansen and T. Miller (teacher)
3726 Holmes International Middle School9351 Paso Robles Ave.Northridge, CA 91325
Lindsey Jimenez and T. Miller (teacher)
3727 Holmes International Middle School9351 Paso Robles Ave.Northridge, CA 91325
Does the Change of Temperature Affect the Germination Rate of Lima Beans?
The purpose of this experiment was to determine if the change of temperature would lower the germination rate of lima
beans. I hypothesized that the change of temperature will lower the germination rate of the lima bean seeds. Lima beans
come in two different kinds, bush and pole. These beans usually grow in warm soil temperature at about 65 degrees
Fahrenheit. To test this experiment, I first placed 40 seeds in a warm bowl of water to soak overnight so they would germi-
nate faster. I then got eight clear plastic cups and filled them with damp paper towels. Then, I made a cover for the cups by
getting eight black construction papers. I folded and stapled the top and side, and then I repeated this for all eight papers.
I did this to protect the plant from any side effects like the light from my kitchen. Then, I put five seeds in each cup. I put
four cups in the refrigerator (40 degrees Fahrenheit) with the cover on; the other four I used as my control that I put out-
side (73 degrees Fahrenheit). I observed and measured the growth of each seed with a centimeter ruler and I recorded the
data for three-four weeks. I found that the seeds in the refrigerator did not germinate but the ones in the normal tempera-
ture grew. My hypothesis is correct. The change of temperature did lower the germination rate of the lima bean seeds. ���
Jennifer Que Leand T. Miller (teacher)
3728 Holmes International Middle School9351 Paso Robles Ave.Northridge, CA 91325
VNY_SciJrnl_interior 9/14/12 10:24 AM Page 96

97New Journal of Student Research Abstracts 2007
Are More Seventh-Grade Boys Colorblind Than Seventh-Grade Girls?
The purpose of this experiment was to see if more seventh-grade boys are colorblind than seventh-grade girls. If my
hypothesis is correct, then more seventh-grade boys will be colorblind than seventh-grade girls. I went to the Internet and
found colorblind grids. I took a metric ruler and measured 75 centimeters. I used the three colorblind grids, and tested 50
seventh-grade boys and 50 seventh-grade girls for colorblindness. When I totaled my data I determined 10% of the girls
were colorblind and 15% of the boys were colorblind. My hypothesis was correct: More seventh-grade boys than seventh-
grade grade girls were colorblind. ���
Does Water Drainage Affect Plant Growth?
The purpose of my experiment was to see if the amount of water drainage a plant has affects its growth. I hypothesized that
the more water drainage a plant has, the taller it will grow. To test my hypothesis I got 120 cups and divided them into three
groups. I labeled each group Slow, Medium, Fast. In Slow, I made two drainage holes, in Medium, I put four drainage holes
and in Fast, I made six drainage holes. I filled each cup with 1/2 cup of soil and put two seeds on top of the soil. Then I put
another 1/2 cup of soil on top of the soil and seeds. After that, I watered each cup with 1/2 cup of water every day for three
weeks. Each week I measured the height of each plant and recorded it. After three weeks the group labeled Fast grew the
tallest, while the group labeled Slow hardly grew any plants at all. My hypothesis was correct: The plants in the group labeled
Fast grew the tallest. ���
Edward Melgar and T. Miller (teacher)
3729 Holmes International Middle School9351 Paso Robles Ave.Northridge, CA 91325
Jonathan Nguyen and T. Miller (teacher)
3730 Holmes International Middle school9351 Paso Robles Ave.Northridge, CA 91325
Which Materials – Air Soil, Stones or Water – Heat to the HighestTemperature When Exposed to the Sun?
The purpose of this experiment was to determine which material heats up faster – air soil, stones or water – when exposed
to the sun. I hypothesized that the stones would heat up to the highest temperature. Solar energy can be converted
directly or indirectly into other forms of energy, such as heat and electricity. To make this experiment I did the following:
I painted four 500-ml water bottles black. Secondly, I inserted soil from my backyard into one water bottle, in another
I inserted medium-sized stones, in the next one I put water, and I left the last one with air. After inserting the materials,
I placed four long thermometers, one in each bottle. Then I recorded the data right after sunset. I did this for seven days.
The results were that the stones heated 34 degrees Celsius. The soil heated 33 degrees Celsius. The water heated 31 degrees
Celsius and the air heated 29 degrees Celsius. My hypothesis was correct: The stones did heat the most out of all the other
materials. ���
Linda Samano and T. Miller (teacher)
3731 Holmes International Middle school9351 Paso Robles Ave.Northridge, CA 91325
VNY_SciJrnl_interior 9/14/12 10:24 AM Page 97

98 Van Nuys Airport & California State University, Northridge
Is It Possible to Drop a Protected Egg Five Times From the Height of Three Meters and Have It Not Crack at Least Three Out of Five Times?
I conducted an experiment to see if it was possible to drop a protected egg five times from the height of three meters and
have it not break at least three out of five times. I believed that if I protected the egg well enough, it would not break at
least three out of five times. To test my hypothesis, I created a device to protect the egg. I created a trampoline by gluing
together four popsicle sticks in a square formation, and strung it with ten to twenty rubber bands in a checkered pattern.
I then placed the trampoline inside a Chinese take-out box. I blew up ten balloons, tied them all together, and placed the
cluster firmly on the bottom of the take-out box using Scotch tape. After placing a raw egg inside my device, I measured the
height I was going to drop my device at, which was three meters. I climbed up a brick wall in my backyard to reach the
designated height of three meters and dropped my device five times, each time replacing the egg inside the take-out box. I
recorded my results. My final data turned out to have two out of five drops successfully protect the egg and three out of five
drops not protect the egg well enough. My hypothesis was incorrect. I did not protect my egg well enough; therefore, the
egg cracked at least three out of five times. ���
Do Snap Peas Grow Taller if Planted in Dirt or Dirt ContainingCommon Earthworms?
The purpose of my experiment is to see if including earthworms in the soil with snap pea plants would help the plants
to grow taller in height. I believed that the earthworms would benefit the snap peas. To test my hypothesis, I filled two
planting trays, each with a mixture of two and a half cups of dirt to one cup of planter mix. I dug eight two-centimeter holes
in each and placed snap peas seed in each hole. Then I covered the holes with dirt already in the trays. I marked one tray
control and the other experimental. I then placed two common earthworms in the tray marked experimental. Next I watered
both trays with nine-tenths of a liter of water. In order to keep the moisture in until the plants germinated, I placed clear lids
on the containers that were removed after germination. I watered them every other day with nine-tenths of a liter of water
to keep them moist. Every day for one week I recorded the growth of every plant in both of the containers. My final
data resulted in an average height of two and four-tenths centimeters for the control plants and an average of four and
one-tenth centimeters in the experimental. My hypothesis was correct. The earthworms did benefit the snap pea plants to
grow taller. ���
Katelyn Vogler and T. Miller (teacher)
3732 Holmes International Middle School9351 Paso Robles Ave.Northridge, CA 91325
Lawrence Yong and T. Miller (teacher)
3733 Holmes International Middle School9351 Paso Robles Ave.Northridge, CA 91325
VNY_SciJrnl_interior 9/14/12 10:24 AM Page 98

99New Journal of Student Research Abstracts 2007
Can Two Species of Collembola, Onychiuridae encarpatus andLepidocyrtus northridge, Live Together in the Same Environment Successfully?
The purpose of this experiment was to determine if the two species of collembola, Lepidocyrtus northridge and
Onychiuridae encarpatus, are able to live in the same environment successfully. I hypothesized that if the collembola are
supplied enough food, the two species would live apart from each other, not minding each other, but may have future
conflicts. To create a moist environment for the collembola to live, I placed one part charcoal to nine parts plaster of Paris
in four containers. I added water, stirred the mixture and allowed the mixture to dry. I added drops of water to the
container to make a moist environment and added a few grains of yeast for the collembola to eat. I placed 20 Lepidocyrtus
northridge and 20 Onychiuridae encarpatus into one container and did the same with the other container. I created a
control with the other two containers. I added 40 Lepidocyrtus northridge into one and 40 Onychiuridae encarpatus into
another. I observed the collembola for approximately four months with stereomicroscopes to determine if the two species
can live together. The results of the experiment showed that the number of Onychiuridae encarpatus increased by 9.45%.
Yet the number of Lepidocyrtus northridge stayed about the same, increasing barely by 1.4%. However, in the control, the
number of Lepidocyrtus northridge increased by 5.25% and the Onychiuridae encarpatus increased by 4%. In conclusion,
the two species lived peacefully, although the reproduction rate decreased for Lepidocyrtus northridge but increased for
Onychiuridae encarpatus. Alone, each species can live just great, but it’s not good for Lepidocyrtus northridge to live with
Onychiuridae encarpatus because their reproduction rate decreases. ���
Copper Analysis of Los Angeles Harbor Sediment
The purpose of the study in the Los Angeles Harbor was twofold: to document contaminates that may be harmful to public
safety divers so they may be better able to protect themselves from exposure, and to analyze bioaccumulation of CAM-17
metals in the harbor marine life. The hypothesis “If the marine sediments in the Los Angeles Harbor are analyzed for
copper, then the levels present will be shown to be over acceptable limits,” was tested and supported by the study.
Sediment collections took place in the LA Harbor region on the RV Yellowfin between December 7, 2006, and January 17,
2007, using a Van Veen grab. The sediment samples were sent to EMAX Laboratories for analysis, following the chain of
custody procedures. After the results came in, ArcGIS was used to join the sample points to the database table of the results.
The spatial analysis extension used interpolation by ordinary kriging to get a prediction map of contaminates. DOQQs
(digital orthophoto quarter-quadrangles) of the LA Harbor area were mosaiced and clipped to the coastline shape file.
The contaminate levels were classified by the National Oceanic and Atmospheric Administration (NOAA) SQuiRT table
threshold levels.
Prediction levels of copper in the LA Harbor were mostly over the acceptable limits in the east and west coasts of the
harbor (the Fish Harbor and the mouth of the LA River). The levels of copper in most of the meat tissues were on
acceptable levels, except for some commercial fish, which had high levels in the organ tissue, and the infauna. The public
safety divers can be exposed to toxic levels of copper due to its high levels in the mouth of the LA River and the Fish
Harbor areas. Eating seafood caught in this area is not recommended due to the unacceptable levels of heavy metals in
the tissues. ���
Gabriela Yoque and T. Miller (teacher)
3734 Holmes International Middle school9351 Paso Robles Ave.Northridge, CA 91325
Panos Shahbazian, Ararat Ter-Ghukasyan and D. Evans-Bye (teacher)
3735 Clark Magnet High School4747 New York Ave.La Crescenta, CA 91214
VNY_SciJrnl_interior 9/14/12 10:24 AM Page 99

100 Van Nuys Airport & California State University, Northridge
Physics of Baseball Pitches
The purpose of this experiment was to find out what factors made certain pitches move in baseball. You can go out and get
instruments that measure speed and spin or research on the Internet, as well as experiment by yourself. The Magnus force,
the drag force and the force of gravity were all responsible for most of the ball movement. The Magnus force determines
the ball’s movement, dependent on the pitch. The drag force results to a baseball’s stitches catching the air to slow it down
or make it break. Gravity makes the ball move down and is the only force at a steady rate of about 9.8 m/s^2. Along with
these forces, your grip and how fast your arm goes influence the movement of the baseball. ���
How Much Water Can Beans Absorb?
This experiment was to explain how much water beans absorb. The beans were submerged in water for 13 hours and were
weighed each hour. The beans were submerged in tap water in a cup. There were seven types of beans: pinto beans, pink
beans, small white beans, black beans, large lima beans, red kidney beans and black eye beans, which isn’t really a bean
but more like a pea. Every type of bean was put in a cup and submerged for 13 hours. Every hour the beans were weighed
and data was recorded. Some of the beans weighed four times their original weight after being submerged. The experiment
ended at 13 hours because after eight hours of soaking the beans didn’t absorb any more water for five straight hours. The
results show that some of the beans absorbed six times their weight and almost all of the beans absorbed more than three
times their original weight. Beans absorb a lot of water and they grow in size and weight when submerged in water for
hours. Some of the beans got so big that they broke their outer shell. The results showed that large lima beans absorbed
more water than the rest because of their size. The large lima bean was larger than most of the other beans. ���
James Cedric Tolentino and G. Zem (teacher)
3736 Ernest Lawrence Middle School Magnet10100 Variel Ave.Chatsworth, CA 91311
Richard W. Strobel and G. Zem (teacher)
3737 Ernest Lawrence Middle School Magnet10100 Variel Ave.Chatsworth, CA 91311
Mixing Acidic and Non-Acidic Fruit With JELL-O
This experiment was testing to see the effect fruit had when mixed with JELL-O. The reason I tested this was because
different fruits have different acidic levels, and I wanted to see if that would make a difference when it was time for the
JELL-O to congeal. To test this experiment, I used three acidic fruits, pineapple, orange and lemon, and three non-acidic fruits,
banana, apple and strawberry, and then placed each fruit in a separate container of JELL-O. The next day, I checked to see
if the JELL-O congealed and if the fruit had an effect on the JELL-O, and it turned out it did. The results were that all the
fruits, acidic and non-acidic, congealed in the JELL-O except for the container with the pineapple. I later found out after my
experiment that this was because an enzyme in the pineapple called bromelain caused it to break down the proteins in the
gelatin, not allowing the JELL-O to congeal and having it stay liquid. ���
Sarah Druyan and G. Zem (teacher)
3738 Ernest Lawrence Middle School Magnet10100 Variel Ave.Chatsworth, CA 91311
VNY_SciJrnl_interior 9/14/12 10:24 AM Page 100

101New Journal of Student Research Abstracts 2007
Instant Flies
The purpose of doing this experiment was to discover if flies could be spontaneously generated from decaying material. First,
the flies would lay their eggs in the decaying material, then their eggs would hatch into maggots, and then eventually mature
into adult flies.
My hypothesis is, “If I place a peeled banana in an open jar, situated in my kitchen, undisturbed for two weeks, then
maggots will appear in the jar and mature into flies.” But, in the course of the 14 days of my project there was only one day
when the weather was hot and humid enough for the flies to come out. The other days the temperatures were cool accord-
ing to the data I have recorded.
The procedure for this experiment is as follows: Step 1. Peel a banana and place it in the open jar on the kitchen’s counter-
top. Step 2. Leave the jar undisturbed for two weeks. While the experiment has begun you should still take pictures of the
jar every three or four days or so. This would show how much it has changed in a certain number of days. But be sure to
keep the number of days between each photo constant to possibly find a pattern with a certain interval of days.
The results of the 14-day experiment proved my hypothesis wrong. There were no maggots whatsoever, and therefore, no
flies. All that happened to the banana was that it turned a dark brown color and began to shrivel up. In conclusion, I have
learned that flies come out more often in hot and humid weather. I also found interesting that the rotting banana did not
produce mold. After sitting for two weeks all that happened was it shriveled up a little bit and turned a dark brown color.
Some things I would like to know are why the flies do not come out in cool weather and why the decay did not produce
any type of mold or mildew. ���
Plants’ Response to Music
My experiment was based on an interesting gardening theory where it stated that plants grown listening to music have faster
growth and produce more fruits. This has been tested by many gardeners and has been proven right, so I decided to try it
on my own. I bought four green houseplants and numbered them one to four. All of them were of similar size, because they
were pretty young. My original intentions were to buy identical houseplants and water both of them with the same amount
of pure water. But I would take one of the plants into the house and let it listen to some music for a short time every day.
But I noticed that there could be many factors and reasons why a plant grows healthily or not. For example, if the plant that
didn’t listen to any music grew smaller than the one that listened to music, I would conclude without doubt that it was
because it didn’t listen to any music. But there could be other reasons why it didn’t grow as much as the other, if it didn’t,
like if it was born to be small in the first place or didn’t get enough sunlight. So I bought four and decided to have two of
the plants listen to music and the others not. I watered them every other day, but I had two of them listen to about three
songs of the same genre every day. They had more leaves, they were greener and they were taller. So I concluded that the
theory of well-being of plants depending on music was true. ���
Anissa Nguyen and G. Zem (teacher)
3739 Ernest Lawrence Middle School Magnet10100 Variel Ave.Chatsworth, CA 91311
Jane Miri Ha and G. Zem (teacher)
3740 Ernest Lawrence Middle School Magnet10100 Variel Ave.Chatsworth, CA 91311
VNY_SciJrnl_interior 9/14/12 10:24 AM Page 101
102 Van Nuys Airport & California State University, Northridge
Can You Taste the Difference Between Diet and Regular Foods?
This experiment tested whether a group of young adults was able to taste the difference between diet and regular food.
Recent studies have shown that obesity numbers in both young adults and adults have increased drastically. The testers were
each given samples of foods. There was a sample ‘A’ and sample ‘B’; from these samples the testers would try to pick which
one was the dietary substance. After going through a total of 16 items and having the testers write down their answers, the
true key was announced to them and to their astonishment, so were the answers that they got wrong. The results of this
project were that people believed that it would be much easier to find the dietary substances than it actually was. The testers
believed that the artificial sweeteners in the diet substances gave away some of the answers, but clearly not all of them, as
not one single tester got 100% on the experiment. ���
Effects of Disasters on Plants
This study examined how weather affects plant life. The three conditions consisted of drought, flood and an oil spill. No con-
trol plant was used. The drought plant was given no water, two cups of water were used for the flood plant, and a small
amount of water and a large portion of oil for the oil spill plant. What I saw happen was that the drought plant began to
quickly wilt while the flood and oil plants stayed upright. Approximately 10 days into my experiment, I saw that the oil plant’s
leaves began to lose their normal color and fade. The flood plant’s leaves began to grow darker over time. So, over the course
of around 22 days, all the plants had died – first drought, then oil, then flood. The condition of each worsened as time went
on, with the above effects becoming even more noticeable. The results showed me that the most dangerous effect on the
plants is a drought, because it worsens all aspects, draining nutrients from the plant as well. ���
Annie Gaudioz-Young and G. Zem (teacher)
3741 Ernest Lawrence Middle School Magnet10100 Variel Ave.Chatsworth, CA 91311
Paul Hanson and G. Zem (teacher)
3742 Ernest Lawrence Middle School Magnet10100 Variel Ave.Chatsworth, CA 91311
How Much Helium Would It Take...?
The purpose of this experiment is to find out how many balloons filled with helium it takes to lift different objects. The
hypothesis for this experiment is that if 80 quarters equal the weight of a pound, it can be determined how many balloons
it takes to lift a pound. And with this information, and simple math, it is very easy to find how many balloons it takes to lift
any amount of weight. The first thing to do in this experiment is blow up as many balloons as needed to lift a baggie filled
with 80 quarters. To be precise, blow up balloons that are 34 centimeters tall and 28 centimeters wide. The amount of bal-
loons to lift 40 quarters is 28 balloons. Forty quarters are a half pound, so multiply the number of balloons by two and it
takes 56 balloons to lift a single pound. The results of this experiment showed how many balloons it takes to lift a pound,
not including the weight of the strings. The result was that it takes 56 balloons to lift 80 quarters, which equal a pound. ���
Gabi Alves and G. Zem (teacher)
3743 Ernest Lawrence Middle School Magnet10100 Variel Ave.Chatsworth, CA 91311
VNY_SciJrnl_interior 9/14/12 10:24 AM Page 102

103New Journal of Student Research Abstracts 2007
Changes in Egg Color Due to Soda
This study is to find out how harmful it is to drink Coke on a daily basis. I used eggs instead of teeth, and I boiled two eggs.
I put them in glasses with the same amount of Coke for three days. I found out that the cold Coke slowly changed the color
of the egg, while the warm Coke quickly changed the color of the egg, but the cold Coke penetrated the shell. The warm
Coke didn’t do that. I think that the cold Coke, even though it takes longer to change the color of the egg, penetrates into
the egg farther than the warm Coke. The warm Coke changes the egg color quick, but doesn’t penetrate into the shell. ���
How Does the Shape of an Object Affect the Frontal WaterResistance With Respect to Its Buoyant Force?
Various Styrofoam shapes were measured for length, width, height, diameter, radius and mass. These measurements were
used to calculate the volume and surface area of each shape. A sphere, cone, large cylinder, small cylinder and rectangular
prism were the shapes used. The volume of each shape was then used to calculate the buoyant force acting on each object,
using Archimedes’ Principle of water displacement. Using a density of 1 gram/mL for the water displaced, the buoyant force
was calculated by multiplying the mass in kilograms of the object by 9.8 m/sec2, the acceleration due to gravity. The buoy-
ant force is expressed in newtons. Each shape was made to have the same weight by inserting nails into Styrofoam, thus
preventing any interference in the shape of the object. Each shape was taken to the bottom of a 10-foot-deep swimming
pool and the time to reach the surface was recorded by my partner. Ten trials were taken for each shape and times were
averaged.
The results show that, after correcting for the buoyant forces, the cylinders (shapes with the greatest surface area present-
ed in the direction of motion) were the slowest to reach the surface. The sphere being the fastest to reach the surface indi-
cated that shape and design will determine the flow of water molecules over the surface of the object. A more streamlined
shape like a cone would probably move faster but my cone was rotating all over the place and not staying straight. There
definitely does seem to be a connection between shape, frontal surface area and the speed an object can move through
the water. ���
Sean Padgett and G. Zem (teacher)
3744 Ernest Lawrence Middle School Magnet10100 Variel Ave.Chatsworth, CA 91311
Mandy Chan and G. Zem (teacher)
3745 Ernest Lawrence Middle School Magnet10100 Variel Ave.Chatsworth, CA 91311
Soda and Mentos
This experiment was to see the effects of Mentos mints in soda. Many people always did this experiment with diet soda, but
I wanted to see the effect using other types of soda. I used three different types of soda. I used root beer, lime-lemon and
orange. Each soda had a slightly different ingredient which gave each soda a slightly different effect. The root beer, which
didn’t have any type of acid, immediately overflowed. The lime-lemon soda, which had one type of acid, shot up in the air
about three feet. Lastly, the orange soda, which had two types of acids, shot up only two feet. These results proved that my
hypothesis was correct. ���
Yanira R. Moncada and G. Zem (teacher)
3746 Ernest Lawrence Middle School Magnet10100 Variel Ave.Chatsworth, CA 91311
VNY_SciJrnl_interior 9/14/12 10:24 AM Page 103

104 Van Nuys Airport & California State University, Northridge
In Which Liquid Substances Does Chalk Dissolve the Fastest and Why?
This experiment answered the question of which liquid substances does chalk dissolve the fastest in. Each chalk was placed
in a container filled with different types of liquid, including vegetable oil, vinegar and water. Each day the results were record-
ed. The experiment was repeated three times. In the beginning, the chalk in the vinegar had the greatest results. But, dur-
ing the experiment, water and vinegar started to evaporate. The chalk didn’t seem like it was dissolving at all. As a result, all
the liquids evaporate at a specific temperature and the vinegar is most likely to dissolve the chalk the fastest. ���
Effects of Different Types of Music on Heart Rate
In this experiment I studied the effect of different types of music on the heart rate. I played different types of music to three
boys and three girls, all at the age of 13. I used five different types of music to test them: classical, R&B, rap, pop and hard
rock. The results show that there was no significant difference in the genders as well as the different types of music. There
was a slight difference, but not enough to matter. ���
Jackie Park and G. Zem (teacher)
3747 Ernest Lawrence Middle School Magnet10100 Variel Ave.Chatsworth, CA 91311
Samantha Corn and G. Zem (teacher)
3748 Ernest Lawrence Middle School Magnet10100 Variel Ave.Chatsworth, CA 91311
Spectrum Through Water
This experiment was to find out how white light is reflected under water. A mirror, a water container, water, white light (flash-
light) and a pen are required. (A camera is optional for pictures.) The container is to be filled with water. The mirror is now
to be submerged, but only about 30 degrees, and if it slips, put the pen under it so it doesn’t move. Turn off any surround-
ing lights. Turn on the flashlight and shine it on the part that is under the water and see where it reflects on the wall/ceil-
ing. The experiment has shown a rainbow, but very little. Most of the reflected light is white, but the rainbow is on the edge.
In the indicated research, it seemed as if the rainbow would be larger, but the mirror size and the mirror angles could have
affected it. Even though this project only had some signs of the hypothesized result, it is moderately close enough to con-
sider it to be successful. ���
Wynnona Loredo and G. Zem (teacher)
3749 Ernest Lawrence Middle School Magnet10100 Variel Ave.Chatsworth, CA 91311
How Fatigue Affects the Body and the Mind: Breakdancing
The science experiment helped prove that fatigue, or tiredness, really does affect your body and your mind when you’re
dancing. When you’re moving around a lot you need to catch your breath every now and then and it gets harder to concen-
trate. In this experiment, two boys (breakdancers) were used to help prove my science experiment correct. Before they
danced, I had both boys recite a tongue twister at top speed. They both did okay, but then I had them dance. After having
them dance for a few minutes I gave them a break. During the break, I quizzed them in math and each time we stopped,
their answers got worse and worse. This proves that when you’re tired, it gets harder to concentrate compared to when
you’re calm and relaxed. ���
Jessica Nguyen and G. Zem (teacher)
3750 Ernest Lawrence Middle School Magnet10100 Variel Ave.Chatsworth, CA 91311
VNY_SciJrnl_interior 9/14/12 10:24 AM Page 104

105New Journal of Student Research Abstracts 2007
Penny Cleaning! The Effects of Pennies When Left in Juice
This experiment studied the effects of juice on a penny, and how well the juice can clean them. The pennies were left in
cups full of juice, with each penny in a different juice. I decided to use apple, orange, pear, strawberry and pineapple juice.
Each penny was left in its juice for exactly 24 hours. When they were taken out, they were all wiped roughly and equally.
The juice that cleaned the best was pear juice, cleaning the penny and almost making it look like new. ���
Does Using Different Material Affect How a Helicopter Flies?
This study was to see if using different kinds of paper (examples construction paper, newspaper or college-ruled paper)
affects how a paper helicopter flies, meaning how long could it stay in the air. The science project was done by using the
measurements from my poster to make a paper helicopter with three different kinds of papers – a newspaper, construction
paper and college-ruled paper (lined paper). Then the helicopters were each tested together to see which would fly
the longest. My hypothesis was not correct to the results I got from each of the races. I believed that the construction paper
would win but it was really the college-ruled paper that won. In this lab it was very fun and I learned that college-ruled
paper rules. ���
Linda Leeand G. Zem (teacher)
3751 Ernest Lawrence Middle School Magnet10100 Variel Ave.Chatsworth, CA 91311
Michael Rodriguez and G. Zem (teacher)
3752 Ernest Lawrence Middle School Magnet10100 Variel Ave.Chatsworth, CA 91311
What Are the Factors That Affect the Speed of a Pendulum?
My experiment was on, “What are the factors that affect the speed of the pendulum?” During this experiment I had noticed
that the three variables that affected the speed of the pendulum were amplitude, length and weight. Amplitude affected the
speed since I had dropped the string at a height of 30 cm high, then I had dropped it from 45 cm high. I had noticed when
I dropped the string at 45 cm it took longer to do 10 swings, because it had more momentum than if I had dropped it from
30 cm high. The length affected the pendulum’s speed because the 15-cm string has a smaller arc than the 30-cm string. If
the string has a smaller arc it has a smaller ways to go. The weight affected the speed because the larger paper clip had
more momentum than the smaller paper clip, which meant the momentum would take the string farther than the smaller
paper clip. So overall I had a great time researching about pendulums and doing all the tests. ���
Bobby Gill and G. Zem (teacher)
3753 Ernest Lawrence Middle School Magnet10100 Variel Ave.Chatsworth, CA 91311
Do Plants Grow Faster With Water or Juice?
My experiment examined the question of whether or not plants grow faster with water or juice. Twenty radish seeds were
planted in cups of soil and were watered with either tap water or Tree Top apple juice for 25 days. All plants were given
sunlight and artificial light during the night. Only seven of the plants that were given tap water germinated. None of the
plants that were given juice germinated. The results suggest that plants cannot germinate with juice, but can germinate
with water. ���
Grace Chen and G. Zem (teacher)
3754 Ernest Lawrence Middle School Magnet10100 Variel Ave.Chatsworth, CA 91311
VNY_SciJrnl_interior 9/14/12 10:24 AM Page 105

106 Van Nuys Airport & California State University, Northridge
Perfect Plane? Or Just Plain?
What constitutes a tip-top paper plane? What creates a disaster that belongs in the waste bin? Does
a minimal amount of folds allow a plane to fly easier? Or will complex folds pull through? My hypoth-
esis suggests that a paper plane with the least amount of folds will stay in the air longer and that more
folds will weigh the plane down. This project tests six differently folded planes by recording how many
successful throws they get out of 20 and the average length traveled. One quickly outshined the oth-
ers, and that one certainly wasn’t the one that I expected would. With its folded nose adding stabili-
ty, its double-folded wings adding balance and keeping it going straight, and its sharp creases, this
paper plane deserves the title of “the perfect paper plane.” The factors affecting the six planes along-
side a step-by-step guide of how to make the perfect plane accompany my project. ���
Growing Radishes
This project was basically to find which fertilizer or soil, etc., works best to help grow radishes. I did this over a 30-day peri-
od of time. I chose the conditions that would best suit these radishes. The sunlight that was given was almost equal each
day and temperatures didn’t range too far, resulting in almost equally perfect conditions every day. This project included
many items that I used, but mainly I tended to the plants every day, watering all 15 for a period of 30 days, even if the plant
showed no signs of growth. I watered them each three teaspoons a day, which is roughly equal to 11/2 ounces. I would
measure the leaves’ height and width every five days, just to get an idea of how much they grew over that period of time.
I hypothesized that groups three and four would grow the best, which one of them did. I wondered if I could find a way to
grow radishes quicker and healthier. I’d be able to help the growth of radishes on farms and countries that need it. I won-
dered if I was able to learn patience and how to perfect my plants.
In the end, dirt produced some small radishes, while potting soil grew amazing ones. I now know how to find the perfect
condition for all plants, by testing it first and finding the good and the bad of it. Basically this project taught me more than
just how to raise radishes, and I hope that I can try something like this again. Groups three and five grew the best, contrary
to my hypothesis. Overall, I think it did teach me a lot, not just about radishes, but that each different type of vegetable or
plant needs different conditions to survive in. If you correctly observe what conditions produce the best radishes, you can
apply this tactic to other projects and experiments, and expect perfect outcomes. I find that if you follow instructions and
keep detailed accurate accounts of what happens and what you do, then in the end you’ll produce amazing results. My
radishes grew because I correctly measured how much soil, water and sunlight was able to affect them. The only changing
factor in each one was the type of soil, and that was the whole point of my project. ���
Sandya Sankarram and G. Zem (teacher)
3755 Ernest Lawrence Middle School Magnet10100 Variel Ave.Chatsworth, CA 91311
Christy Tran and G. Zem (teacher)
3756 Ernest Lawrence Middle School Magnet10100 Variel Ave.Chatsworth, CA 91311
Co-Winner: Best Aviationor AerospaceAbstract for 2007
Fertilizer Group 1
ManureGroup 2
Potting SoilGroup 3
Garden SoilGroup 4
DirtGroup 5
Cup C Cup C Cup C Cup C Cup C
Cup B Cup B Cup B Cup B Cup B
Cup A Cup A Cup A Cup A Cup A
VNY_SciJrnl_interior 9/14/12 10:24 AM Page 106

107New Journal of Student Research Abstracts 2007
Color-Changing Carnations
This study examined where the color showed up when carnations sat in different colors of water. Six carnations were placed
in four colors of water, two carnations split into two colors, and the progress of the color movement was recorded. This
experiment was repeated three times. The color showed up in the petals and the stem. The blue and green showed up dark-
est in the carnations. The results suggest that when a plant is watered the water goes through the stem to the petals. ���
What Are the Effects of Soda on House Plants?
This science project really explored the health effects of soda. Though the experiment was run on plants, I was able to relate
that back to human health. The results were very unique actually. After watering the plants for about a month, the Diet Coke
plant was the only one that died. It turns out that artificial sugars are worse on the plants and on your body than the regu-
lar sugars. The Coke plant and the water plant were able to be replanted and added to my mom’s collection. The Coke plant,
however, did show some signs of damage, such as a weakening stem and discolored leaves. The end conclusion? All soda
is bad, but diet sodas are an even unhealthier choice. ���
Lauren Eyrich and G. Zem (teacher)
3757 Ernest Lawrence Middle School Magnet10100 Variel Ave.Chatsworth, CA 91311
Elizabeth Vidar and D. Shah (teacher)
3758 Portola Magnet Center18720 Linnet St.Tarzana, CA 91356
How Does Pollution Affect Plants?
This study examined the effects of pollution on plants on a daily basis in schools. In this experiment I had two plants.
One was polluted with pollutants that can be found frequently at school. I polluted it by adding juice, candy bars and other
snacks we leave behind at school. The second plant was maintained extremely clean. I kept the plants in these conditions
for five weeks, taking careful measurements and observations. My results in this experiment were that the polluted plant
was affected greatly in growth and health by the pollutants I added. The other plant thrived and continued to grow once the
experiment was complete. ���
Tal Topf and G. Zem (teacher)
3759 Ernest Lawrence Middle School Magnet10100 Variel Ave.Chatsworth, CA 91311
Different Types of Milk to Help a Plant Grow Better
This experiment was able to determine if different types of milk would help a plant to grow better. The four plants that were
used for this science project were Marigold Dwarf plants. Each plant was assigned to have a different type of milk to let it
drink. The different types of milk were vanilla soymilk, milk and chocolate soymilk. The control for one of the four plants was
the water. At about 5 p.m. each day, I gave each of the plants their special liquid for about two weeks. At the end of the
project, it happened to be that the plant with the milk was in the best shape compared to the other three plants. The plant
with the milk was better since the plant took in the nutrients. The control was dead because of the intense heat, while the
vanilla soymilk and chocolate soymilk plants died since the substances were too dense to sink through the soil. In the end,
milk had better results. ���
Justin Kwok and G. Zem (teacher)
3760 Ernest Lawrence Middle School Magnet10100 Variel Ave.Chatsworth, CA 91311
VNY_SciJrnl_interior 9/14/12 10:24 AM Page 107

108 Van Nuys Airport & California State University, Northridge
Is Plant Growth Affected By Color?
The objective of this study was to examine whether samples of the bean plant, exposed to the same amount of sunlight
and in the same conditions, would grow at the same rate if they were covered with different colors of cellophane.
The hypothesis of this study was that the plants covered in green or clear cellophane would grow fastest because the
darker colors would block more of the sun. The planting procedure was to take 4 bean seeds, plant each in the same amount
of soil at the same depth and water with 2 teaspoons of water every other day for 26 days. Each plant was covered with a
different color of cellophane: clear, green, red and blue and placed on a windowsill where they got full sunlight. The plant
growth was recorded on each watering day. After 26 days the plant covered with clear wrap grew the fastest, reaching 14
mm compared to plant covered in blue wrap, which grew to 8 mm. The red wrap one grew to 9 mm and the green wrap
one reached 8.5 mm. The plants covered with colored cellophane showed significantly less growth. Therefore, my hypoth-
esis was partially correct. The plant grown covered by clear cellophane grew the tallest. Hence, the results show that plant
growth is affected by colored light. ���
Contact With Plants
What happens when you spend only a few minutes a day talking, singing or even whispering softly to your plants? Well,
although it may sound funny, and seem a little ridiculous, it really works! When talking, singing or whispering to plants you
release your own carbon dioxide, and since you are up close to them and constantly breathing, they get an extra dose of
carbon dioxide. I discovered this while experimenting with other plants, and was surprised at the amount the plants
receiving the carbon dioxide grew. Not only were they bigger, they grew faster and were healthier. To start off this project,
I got 10 plant pots and some radish seeds, as well as some potting soil, and a few more materials. After the plants were
planted and labeled, I began my experiment. I talked to one once a day, one twice a day, sang to one once a day, sang to
one twice a day, whispered to one once a day, whispered to one twice a day, played music for one once a day, played music
for one twice a day, ignored one totally and had a control. In the end it showed that the plants that got the extra dose of
carbon dioxide, meaning they got treatment twice a day, grew a lot faster. So keep that in mind next time you want to grow
plants. ���
Samantha Garcia and G. Zem (teacher)
3761 Ernest Lawrence Middle School Magnet10100 Variel Ave.Chatsworth, CA 91311
Sogol Ashrafian and G. Zem (teacher)
3762 Ernest Lawrence Middle School Magnet10100 Variel Ave.Chatsworth, CA 91311
Effects of Candy on a Plant Used as Fertilizer
This experiment showed if candy was possible to use as fertilizer. There were four different plants. Each had a different type
of candy mixed in with the soil, except for one, which was the control. The candies were Skittles, M&M’s and Peanut M&M’s.
Each plant was watered every day around 5 p.m. with 2/3 cups of water. Measuring and recording differences took place
every other day. This went over a period of two weeks. By the end of the project, only the control plant survived. All candy
plants had lost their green coloring due to absorbing the candy’s coloring. The Skittles plant was able to grow for awhile and
produce large flowers. The Peanut M&M’s plant grew very fast for a short period of time. This happened because the plant
was able to absorb the nutrients of the peanuts. The M&M’s plant grew the slowest and was the weakest among the three
candies. In the end only the control survived. Skittles was able to grow large flowers. Peanut M&M’s was able to grow fast
for a short period of time, and M&M’s did nothing except slowly kill the plant. ���
Ian Kwok and G. Zem (teacher)
3763 Ernest Lawrence Middle School Magnet10100 Variel Ave.Chatsworth, CA 91311
VNY_SciJrnl_interior 9/14/12 10:24 AM Page 108

109New Journal of Student Research Abstracts 2007
Effects of Liquids on Plant Growth
This study examines the possibility of liquid diversity in the watering of plants and the effects of different liquids on plant
growth. Multiple string bean seeds were planted into six pots, each labeled with the liquid they were watered with. The liq-
uids used in this experiment were water, Sprite and mineral water, with water as a control. To ensure the accuracy of my
results, the standards were set so that two plants each would be watered with one liquid using the same soil. The experi-
ment was designed to be as fair as possible, in that all the plants were watered at the same time every few days. The results
came out considerably different from the original hypothesis. The plants watered with Sprite grew mold, resulting in the
plants not sprouting. The other categories both grew a plant with one sprout and one with two sprouts. The control group,
or the plants grown with water, had an average height of 12.7 cm. The other surviving group grown with mineral water had
an average height of 9.53 cm. Thinking back, the plants grown with Sprite might have survived if the first signs of mold grow-
ing on the plant were removed. ���
Scents of Smell
The purpose of this experiment is to determine if, after smelling different essential oil aromas, one will experience the “feel-
ing” that is advertised on the bottle. Will people like or dislike an essential oil aroma based on a good or bad memory? Will
people like or dislike an essential oil aroma because the strength of the essential oil is too strong? The results of this exper-
iment show each volunteer experienced a different effect than what was advertised on the bottle. A few aromas (sweet
orange and lavender) were favored strictly because they brought back a “good memory.” No one liked the jasmine or sage,
as he/she felt the aroma was too strong. ���
Matthew Muñoz and G. Zem (teacher)
3764 Ernest Lawrence Middle School Magnet10100 Variel Ave.Chatsworth, CA 91311
Miles Young and G. Zem (teacher)
3765 Ernest Lawrence Middle School Magnet10100 Variel Ave.Chatsworth, CA 91311
Effects of Increasing Temperature on the Solubility of Two Solids
The project examined the question of increasing temperature in a) salt and b) sugar when they are placed in water. One
hundred (100) ml of water was placed in the beaker, then salt was added (5 g) at each temperature. The same was done
with sugar. Each experiment was done two times. The results showed that the solubility of sugar did increase with temper-
ature, but the solubility of salt stayed the same at all temperatures. Salt doesn’t decrease or increase with increasing tem-
perature. ���
Sana Mirza and G. Zem (teacher)
3766 Ernest Lawrence Middle School Magnet10100 Variel Ave.Chatsworth, CA 91311
VNY_SciJrnl_interior 9/14/12 10:24 AM Page 109

110 Van Nuys Airport & California State University, Northridge
Colored vs. Black and White Memory
My science fair project is on whether it is easier to remember color or black and white. I came up with 4 pages for my exper-
iment. The first had 14 colored pictures on it. The second had 14 black and white pictures. The third had 15 colored words,
and the fourth had 15 black and white words. For my experiment, I gave someone 30 seconds to look over and memorize
the pictures or words. Then right away, I would switch it with a piece of scratch paper and give them 30 seconds to write
down whatever they remembered. Then I would give them the next paper with words or pictures on it and repeat the
process. After I did my experiment, I found that my hypothesis was half right and half wrong. The results were that the col-
ored pictures were easier to remember than black and white pictures, which was the wrong part of my experiment. For the
colored and black and white words part, my hypothesis was right that people would be able to remember colored words
better than black and white words. This experiment taught me that memory can differ between people but averages to about
the same. ���
Sink or Float
This study showed that there are more factors that play into whether an object with a density greater than that of water will
sink or float in water. I got a bowl and filled it twice, once with cold water and once with room temperature water. I put var-
ious objects in the bowls, including a steel saltshaker cap which I taped up later too. I calculated their densities with a scale
and a water displacement test to find the volume. I predicted whether they would sink or float before I found their densi-
ties and confirmed or proved wrong my predictions afterward. I proved my hypothesis and showed that due to the law of
buoyancy, the taped-up steep cap floated even though it had a greater density than water. ���
Akshay Kohli and G. Zem (teacher)
3767 Ernest Lawrence Middle School Magnet10100 Variel Ave.Chatsworth, CA 91311
Gregory Zicker and G. Zem (teacher)
3768 Ernest Lawrence Middle School Magnet10100 Variel Ave.Chatsworth, CA 91311
Does Chewing Gum Improve Memory?
This study examined the effect of chewing gum on short-term memory. Twenty participants were read a list of twenty short
and random words at the rate of about one word-per-second. Then they were asked to write the words that they heard in
the same sequence they heard them, to the best of their memory. Then, each participant received one stick of gum to chew
for about a minute. Then, while still chewing, the participants were read a second list of twenty different words in a random
order. Once again, each person was asked to write down the twenty words that they heard and in the order that they heard
them, to the best of their ability. In the end, my results were that 65% of all participants had better results on the test where
they had chewed gum. ���
Natalie Landau and G. Zem (teacher)
3769 Ernest Lawrence Middle School Magnet10100 Variel Ave.Chatsworth, CA 91311
VNY_SciJrnl_interior 9/14/12 10:24 AM Page 110

111New Journal of Student Research Abstracts 2007
Effects of Sink Water, Mineral Water, Carbonated Water and Purified Water on the Growth of Bean Plants
How will sink water, mineral water, carbonated water and purified water affect the growth of bean plants? My hypothesis is
that bean seeds will grow best in mineral water and second best in purified water. Both mineral water and purified water
have fewer contaminants that can hurt the growth of seeds and perhaps this absence can make the plants grow better.
I also suspect that the carbonated water will have a detrimental effect on the growth of the bean plant, being that it’s very
gassy, although it is possible that the presence of carbon will hasten the growth because carbon is what plants breathe.
This study was conducted in order to find out how different water types affect the growth of bean seeds. First off I bought
a pack of bean seeds and planted two seeds in four terra-cotta pots. One group of seeds was to be watered by mineral
water, one by carbonated water, one by sink water and one by purified water in order to see how that certain type of water
would affect the growth of the seeds and how it would compare to the rest. They were watered and observed for a
three-month period of time. Since the beginning I had hypothesized that the mineral water would help the seeds grow best
and that carbonated water would have the worst effect on the plants. My hypothesis turned out to be correct when the min-
eral plant ended up having the highest height of 10.5 inches. The sink water had a total height of 6.5 inches and both
purified water and carbonated water had a total growth of 0 inches. ���
Is There a Difference in the Bone Density of Women in Rural Areasvs. Women in Urban Areas in India?: One Year Follow-Up Study
In December of 2005 the above study was conducted. Two hundred (200) subjects in total were studied. They were
equally divided among rural and urban groups. At the end of each study individual subjects were counseled regarding diet,
exercise and calcium intake. Each subject was given a month’s supply of 1,200 mg of calcium and vitamins and was told to
take calcium and Vitamin D every single day. They were also asked to include 30 minutes of exercise in their daily routine.
They all agreed to comply and return in one year for a follow-up study.
In December of 2006 a follow-up study was scheduled. Announcements regarding the follow-up study were done by the
same community clinic four weeks in advance. All the subjects were asked to bring their previous evaluation study
document of the bone density test given to them during the first study in December 2005. All the returning subjects were
asked if they were taking calcium and Vitamin D regularly, and if they were exercising regularly as advised.
Only 55 out of the initial 100 subjects (55%) from urban areas returned for the follow-up study, while only 38 out of the
initial 100 subjects (38%) from rural areas returned for the follow-up study. In the urban group, out of the 55 women
participants only 20 were compliant (36.36%); they were exercising daily and taking calcium supplements regularly. In the
rural group, 15 out of the 38 participants were compliant (39.47%). In total, 35 subjects were compliant out of the 93
(37.63%) subjects who returned to participate in the follow-up experiment. Those 35 women who exercised and took
calcium supplements were able to maintain or had a small change in their bone mass density. The other 58 subjects
(62.37%) who were non-compliant showed a great decrease in their bone mass density.
With these results, we can conclude that exercising and taking calcium supplements are essential to fighting osteoporosis
and a decline in bone mass density. ���
Raahil Kajani, Raheem Kajani and G. Zem (teacher)
3770 Cleveland High School8140 Vanalden Ave.Reseda, CA 91335
Gabriela Leon and G. Zem (teacher)
3771 Ernest Lawrence Middle School Magnet10100 Variel Ave.Chatsworth, CA 91311
VNY_SciJrnl_interior 9/14/12 10:24 AM Page 111

112 Van Nuys Airport & California State University, Northridge
How Does Music Affect Heart Rate?
This study explored the effects of music on heart rate. Participants had their heart rate tested while listening to music. Four
different genres of music were used (rock, country, classical and blues). Classical music generally showed the lowest heart
rates and rock music generally showed the highest heart rates. The average resting heart rate was 72 bpm, the average rock
heart rate was 71 bpm, the average classical heart rate was 69 bpm, the average country heart rate was 70 bpm and the
average blues heart rate was 70.5 bpm. The data shows that music does affect heart rate, but only by a few beats per minute
(at most). ���
Effects of Different Carpet Cleaners on Different Stains
For my science project I did experiments to find out what the best carpet cleaner is to use. I researched this topic for a num-
ber of reasons. First of all, I did it to find what carpet cleaner works best on carpets. If you know this information you can
reduce the amount of chemicals in your house that you breathe in. If you have spilled something on your carpet and it has
made a stain, you will need to use a carpet cleaner to get that stain out. But what if you don’t have a carpet cleaner or the
carpet cleaner that you have doesn’t work very well? You will have to try new carpet cleaners to find the best one to get the
stain out. This process will cause a lot of chemicals, which you don’t want, to be released into your house. Another reason
that you would want to know what carpet cleaner works the best is that you want to make sure that you are not just cov-
ering up the stain in your carpet. You want to make sure that you are fully getting rid of the stain. That is why you want to
know what carpet cleaner works the best on stains in carpet.
In this project I used three types of carpet clearers. I used Tuff Stuff, Spot Shot and Resolve. I also used three substances to
make stains in my carpet. I used jelly, mud and lipstick. I sprayed each of the carpet cleaners on each of the stains. I then
scrubbed each of the stains. I did this a few times until the stains started coming out. Some of the stains came out and some
didn’t. The jelly stain came out the most, and then the mud stain and the lipstick stain came out the least. Even though the
jelly stain came out the most, some of it came back to the carpet, especially when I used the Resolve carpet cleaner. ���
Lynn Halfen and G. Zem (teacher)
3772 Ernest Lawrence Middle School Magnet10100 Variel Ave.Chatsworth, CA 91311
Kelly Encinas and G. Zem (teacher)
3773 Ernest Lawrence Middle School Magnet10100 Variel Ave.Chatsworth, CA 91311
Movement of Molecules
My project was if molecules move faster in hot water, cold water, room temperature, and with or without salt. I added salt
to three out of the six glasses. Then, I dropped two drops of food color into each cup and observed. I found that the food
coloring spread the fastest through the hot water without salt. The glass that took the food coloring longest to blend in with
the water was the cold water with salt. In my research I found that in hot water the molecules vibrate faster, and in cold
water the molecules start to come together, which makes them slower. The salt was just making the water cooler. This
project taught me the effect on molecules in different temperatures. ���
Chris Whitmer and G. Zem (teacher)
3774 Ernest Lawrence Middle School Magnet10100 Variel Ave.Chatsworth, CA 91311
VNY_SciJrnl_interior 9/14/12 10:24 AM Page 112

113New Journal of Student Research Abstracts 2007
Effect of pH Level on Plant GrowthThis experiment examined the effect that pH level has on plants. White Hyacinth plants were used to test this experiment,
and the experiment was tested three times. Three groups were made: groups A, B and C, and each group contained five
White Hyacinth plants. The different types of liquids used were water, soda, baking soda water, bleach and vinegar. Each
plant in group A was either given the number 1, 2, 3, 4 or 5. Water, with the pH level of 7, was number 1, while soda, with
pH level 2.5, was number 2. Number 3 was vinegar, with pH level 2.9, and number 4 was baking soda water, with pH level
9. Bleach, with pH level 12.5, was number 5. The plants were all given water on the first day to start them off, all on the
same level. On the second day, though, the plants were given the liquid that each was assigned, and the water plant was
used as the control plant. Pictures were taken three times out of the 11-day period to see the difference in growth of the
plants, and they were given the liquid assigned to them about once every three days. The pH of the liquids was found by
using indicators. Measurements of the leaves and overall plant height and width were taken in centimeters. The results from
the data collected showed that water, with pH level 7, was the best to give to the plants. The bleach and vinegar plants failed
to grow and died the fastest, while the soda and baking soda plants did not fail to grow, but did start dying out in the end.
The experiment was done two more times, where groups B and C were created. Plants in groups B and C were already
grown and bloomed White Hyacinth plants, but the results were similar to those of group A. ���
Grass Stains: How to Make It Less GreenThe purpose of my project was to discover the best way to get rid of grass stains. I chose to do this because it’s a problem
that I deal with a lot. First, I looked for instructions on how to remove grass stains on the Internet, and I chose the three that
I thought would work the best. The three choices were the enzyme detergent method, the alcohol method and the
hydrogen peroxide method. I tried each method three times, and I chose the fabric on which the method worked best. The
method that worked best was the enzyme detergent method. Second place went to the alcohol method. The least effective
was the hydrogen peroxide method. From doing this experiment, I now have a solution to my grass stain problems. ���
Angelyn Marie Bernardino and G. Zem (teacher)
3775 Ernest Lawrence Middle School Magnet10100 Variel Ave.Chatsworth, CA 91311
Stella Oh and G. Zem (teacher)
3776 Ernest Lawrence Middle School Magnet10100 Variel Ave.Chatsworth, CA 91311
How Energy Drinks Affect Sleep
This study considered the investigation of how energy drinks act on sleep. A least two subjects were required to examine
the effects of consuming one can of Monster (usually preferred energy drink) before sleeping. The main idea was to observe
how long it took for the subject to fall asleep. Each experiment was repeated three times to verify the times. Subjects 1 and
2 were to drink water on the first three days, and then to drink Monster on days 4-6. Take note that their environment was
calm and relaxing, so nothing could’ve disturbed their sleep. It was vital for me to accurately time the subjects right when
they went to bed to when they fell asleep. Using a timer or stopwatch, I was able to compare the differences between the
consumption of water and energy drinks. To make sure the subjects were asleep, I observed signs of snoring. Subject 1, how-
ever, wasn’t able to snore, so I whispered quietly or poked gently at him to see if he was asleep. If he was to be awakened
and had not fallen asleep yet, then I took into precaution that we had to start over again to not contaminate the data. Water
subject 1 had an average time of 1 hour and 15 minutes out of the three days. With Monster on days 4-6, he went to sleep
much quicker at a rate of only 45 minutes. The difference was falling asleep 6% faster than usual. Water subject 1 showed
no signs of moving after drinking Monster, unlike with water. Water and subject 2 fell asleep at an average of 49 minutes
on the three days. With Monster, he fell asleep at only 18 minutes, which was 37% quicker than normal. In conclusion, even
though energy drinks like Monster contain caffeine, drinking a can may cause you to fall asleep faster than usual if that
energy gain is not used. ���
Vu Nguyen and G. Zem (teacher)
3777 Ernest Lawrence Middle School Magnet10100 Variel Ave.Chatsworth, CA 91311
VNY_SciJrnl_interior 9/14/12 10:24 AM Page 113

114 Van Nuys Airport & California State University, Northridge
Building Electromagnets
This study examined the variety of the reactions of magnetic material by building an electromagnet. The magnet was built
using a nail, copper wire and battery. It compared the reactions with the hysteresis loop and observed the relationships
between the magnetic domains. The results showed that the two factors that influenced the magnetic field of the coiled wire
without the nail were 1) the current and 2) how many times the wire was wrapped around the nail. The study also explored
how the magnetic domains were affected by changing the polarity of the material. The domains reacted in arranging them-
selves in the same way as the poles of the magnetic field. Due to the hysteresis loop, after the nail was inserted into the
wrapped wire, it still had some magnetism left in the nail itself. Testing this by disconnecting the battery and attracting
magnetic particles to the nail proved the hypothesis correct. The results suggested that the wider the hysteresis loop is, the
more magnetic field will remain in the material. ���
Effects of Different Liquids on Plant Growth
This experiment was testing the different growth patterns on plants using different liquids (sugar water, saltwater, tonic
water, soap water and tap water). There were two types of plants used: radish Raphanus sativus plants grown from seeds
and Golden Pathos Epipremnum aureum plants, which were purchased grown. Each set of radish and pathos plants was
given 50 ml of the ingredients mixed with 25 ml of tap water every other day for 15 days. The light was controlled light in
a darkened room. The experiment was repeated two more times with purchased pathos plants. In order from least effective
to most effective the results were: 1) The radish plants, even in tap water, could not survive very long; and 2) With the pathos,
it was salt, sugar, soap, tonic, tap water. The results suggest that the growth patterns were most negatively affected by the
sugar, salt and soap. In comparison the tap and tonic water maintained the growth pattern efficiently. ���
Jennifer Krasnova and G. Zem (teacher)
3778 Ernest Lawrence Middle School Magnet10100 Variel Ave.Chatsworth, CA 91311
Jordan Knudsen and G. Zem (teacher)
3779 Ernest Lawrence Middle School Magnet10100 Variel Ave.Chatsworth, CA 91311
Which Substance Allows the Fingerprint to Appear the Clearest onWood, Glass and Plastic?
This experiment that was conducted will show which substance out of these ten – water, flour, oil, jam, butter, dust, mud,
dark pink paint, peanut butter and last of all pink powder – will look the most clear on these three different properties: glass,
wood and plastic. The thumb of the right hand was dipped in one at a time in all of the substances and then firmly pressed
against the glass, and following that the same thing was done to the wood and plastic. When the thumb was dipped in the
substances, it had to be made sure that there wasn’t too much or too little of them. That would’ve ruined the experiment.
After looking at all of the fingerprints, the clearest one that appeared on each property was the dark pink paint. The paint
was a clear winner, considering it was pretty bright compared to the other properties. Even the strawberry jam didn’t come
close to the intense color of the paint. ���
Janar Bauirjan and G. Zem (teacher)
3780 Ernest Lawrence Middle School Magnet10100 Variel Ave.Chatsworth, CA 91311
VNY_SciJrnl_interior 9/14/12 10:24 AM Page 114

115New Journal of Student Research Abstracts 2007
Does Intensity of Light Affect the Energy Production of a Solar Cell?
This study addressed the question of whether intensified light would increase the power production of a solar cell. It was
tested in two ways, with a mirror and a magnifying glass. To do the experiment, a solar cell was wired to a motor.
A revolution counter was then made and attached to the motor. The solar cell was positioned in the sun and the revolutions
observed for thirty seconds. This was repeated two more times. The results were recorded, and then the mean number of
revolutions per thirty seconds was found for the control, 46 revolutions per thirty seconds. The test was repeated three more
times, but with a magnifying glass positioned over the solar cell. The average number of revolutions per thirty seconds was
raised to 66, a 43.47% increase. The results were recorded. The test was repeated three more times, but with a mirror
positioned so it was shining on the solar cell. The average number of revolutions per thirty seconds was 57, a 23.91%
increase from the control. The results show that intensified light does raise the power production of a solar cell, and light
intensified by a magnifying glass more so than a mirror. ���
Which Soap Cleaned the Best?
The purpose of my experiment was to find out which soap (regular hand washing soap, shampoo and toothpaste) cleaned
the fastest. My hypothesis was that the regular hand washing soap would work the best because it was the closest relative
of the dishwashing soap. For this experiment, I first put half of a teaspoon of ketchup onto each plastic spoon and let it dry
for two hours. After all the spoons were dried, I put warm water into three cups and room temperature water into the other
three cups. Next, I labeled the warm cups with odd numbers and the room temperature cups with even numbers. I then put
two tablespoons of shampoo into one warm water cup and one room temperature cup and did the same process for both
the toothpaste and the regular hand washing soap. After the process was done, I dropped one ketchup-stained spoon into
each cup. At the same time, I started the three timers and had each person stir at the same time from the timer onto my
data table. My results were that the regular hand washing soap cleaned the fastest and my hypothesis was right. From this
lab, I learned that whenever you are in a rush and run out of dishwashing soap, regular hand washing soap will clean fast
too. ���
Kathleen Chu and G. Zem (teacher)
3781 Ernest Lawrence Middle School Magnet10100 Variel Ave.Chatsworth, CA 91311
Matthew Marchand and G. Zem (teacher)
3782 Ernest Lawrence Middle School Magnet10100 Variel Ave.Chatsworth, CA 91311
The Science Behind Quicksand
This experiment analyzed the way quicksand, as well as other non-Newtonian fluids, works. Water and cornstarch were com-
bined to create a non-Newtonian fluid, a fluid in which the viscosity changes with the applied strain rate. With the use of a
plastic spoon, the water and cornstarch were mixed until they had an even consistency. This created a fluid whose resist-
ance grew directly proportional to the amount of force being applied. For example, thrusting the surface with the spoon or
swiftly moving it inside the bowl made it behave like a solid. However, more gentle treatment left it in its liquid state. This
is a phenomenon known as dilatant rheology. What had just been created was a dispersion of a solid and a polymer (corn-
starch) in a fluid (water). Polymers are very long chains of atoms that can move past one another, but it does take some
time. So, when trying to force the chain slides to move quicker they got tangled up. ���
Julia Botezatu and G. Zem (teacher)
3783 Ernest Lawrence Middle School Magnet10100 Variel Ave.Chatsworth, CA 91311
VNY_SciJrnl_interior 9/14/12 10:24 AM Page 115

116 Van Nuys Airport & California State University, Northridge
How and How Much the Curveball Curves
My report questioned how the curveball really curves and how much a curveball curves according to the speed at which it
is pitched. My experiment included many things, such as a pitching machine, baseballs, radar gun, extension cord, a cam-
era, ruler, paper and a couple of pens. For my experiment we pitched the curveballs at different speeds to see how much
the ball would curve or break. Then we would take the radar gun to accurately measure how fast the curveball was going.
To accurately measure how much the ball would curve we took a series of about four to six pictures of each pitch. We also
did this various times for each speed so that I could really accurately estimate how much the ball curved. To measure how
much the ball curved, we set up a series of baseballs a half foot apart each. Then I looked at the series of pictures to see
where the ball was out the farthest point away and where the ball ended up. Then I did the math to figure out how much
the curveball curved. The speeds at which we pitched the curveballs were 40 mph (miles per hour), 46 mph, 52 mph, 60
mph and 65 mph. My results were very good and according to my hypothesis. At 40 mph the ball curved an estimated 30
inches, at 46 mph the ball curved an estimated 26 inches, at 52 mph the ball curved an estimated 24 inches, at 60 mph the
ball curved an estimated 22 inches, and lastly at 65 mph the ball curved an estimated 18 inches. So in the end, I found out
that the slower the curveball, the more of a break it will have, and the faster the curveball, the tighter a break or curve it will
have. ���
What is the Best Way to Remove Gum?
This study examined the best household ways to remove gum from shoes, being the easiest to use and according to cost.
After doing research on different remedies, I experimented with the commonly used peanut butter, hair spray, hair condi-
tioner, Vaseline, commercial remover, ice and hot water. After pre-chewing gum to the right consistency, it was added to the
shoe and let harden. The remedies were each timed and rated on ease to use. I also recorded ingredients, cost and fatigue
in a graph. Once all of the experiments had been done five times some of the experiments proved to be inconclusive, such
as with Vaseline and hair conditioner, and were incomplete, as they did not work. The data also suggested that the least
expensive items, ice and hot water, were the most effective, then followed by the most expensive, the commercial remover,
and hair spray. ���
Steven Karkenny and G. Zem (teacher)
3784 Ernest Lawrence Middle School Magnet10100 Variel Ave.Chatsworth, CA 91311
Shelby Flaata and G. Zem (teacher)
3785 Ernest Lawrence Middle School Magnet10100 Variel Ave.Chatsworth, CA 91311
Dynamics of a Curveball
It has been said the hardest thing to do in sports is to hit a pitched baseball. This study examined the different baseball
pitches in order to analyze their trajectory, explaining why some pitches such as the curveball appear to drop off and curve.
My hypothesis is that the fastball will take a direct route from the pitcher to the catcher, staying on the same plane and drop-
ping at a constant even rate. The curveball will start higher and drop in a 12 to 6 arc at a slower speed and curve from right
to left on its path to the catcher. Through research and actual experiments it was shown how the different pitches in base-
ball react and why. The experiment showed exactly how a real curveball thrown by a professional pitcher moves and where
the movement occurs along the trajectory. By using a high-speed digital camera positioned properly, the Magnus effect of
how air affects the path of a spinning object was clearly shown on the different pitches. The experiment was conducted
in real-life conditions on a regulation baseball field with a professional pitcher in order to replicate the different pitches
accurately. The experiment also shows, in a side-by-side picture comparison, the difference between a fastball and a
curveball. ���
Kevin Siegel and G. Zem (teacher)
3786 Ernest Lawrence Middle School Magnet10100 Variel Ave.Chatsworth, CA 91311
VNY_SciJrnl_interior 9/14/12 10:24 AM Page 116

117New Journal of Student Research Abstracts 2007
How to Best Clean Denim
This study examined how to best clean a square of denim. I started out with eight squares of denim. I dirtied four of them
with the substance olive oil and dirtied the other four with the substance marinara sauce. I tried this experiment with
combinations of Ultra Detergent, Clorox Bleach and a number of sprays from the SPRAY ‘n WASH solution, as well as
transferring the sheets of denim into the washing machine. The experiment was tried four times and every time I ran the
experiment I got the same answer 100% of the time. In the experiment the substance marinara sauce was still the hardest
to clean, but there still were some combinations that did clean that completely. My results show that some good
combinations were anything that the Ultra Detergent was involved with the best cleaning. ���
How Does the Shape of the Wings on a Plane Affect the Way It Flies?
I wanted to do this project because I wanted to see why the shape of the wing changes the way it flies and which of the
shapes would fly the best. I did this by first getting the three planes and cutting them into three different shapes. Then,
I made my guess on which plane would fly the farthest. Next, I had to lay out a long ruler that was about 30 feet long. After,
I threw each plane five times each and averaged them. The plane that ended up flying the farthest distance was the plane
with the flat-tip wings. That was also the plane I thought would fly the farthest distance. ���
Ryan Meza and G. Zem (teacher)
3787 Ernest Lawrence Middle School Magnet10100 Variel Ave.Chatsworth, CA 91311
Jacob Burman and G. Zem (teacher)
3788 Ernest Lawrence Middle School Magnet10100 Variel Ave.Chatsworth, CA 91311
Recipe for the Perfect Plant
This experiment was to find how to make a plant grow the best. We take a mint sage (the plant) and make six cuttings from
it to regrow in rock wool. From there, they start rooting. Two plants are moved to a bigger block of rock wool and four are
put into potting soil (African potting soil and regular potting soil). We take the plants in the potting soil outside and leave
the others inside. Half the plants (for inside and out separately) are fed with regular tap water and the other half are fed
with growing formula. The results were that the plants grown outside had their leaves concentrated throughout the stem;
plants inside had their leaves spread out, showing more stem than leaf. The plants grown inside had an aphid infestation,
while the ones outside did not. Both sets were healthy (not so much the plants grown indoors) as well as tall. They
mainly looked all the same except for the conditions they went through indoors and outdoors. I believe that the plants grown
naturally are a lot healthier than those grown artificially. ���
Brooke Popiolek and G. Zem (teacher)
3789 Ernest Lawrence Middle School Magnet10100 Variel Ave.Chatsworth, CA 91311
VNY_SciJrnl_interior 9/14/12 10:24 AM Page 117
118 Van Nuys Airport & California State University, Northridge
What Kind of Paper Airplane Will Fly the Farthest?
For this project I had to take a lot of preparation. I did this project because I’m actually very interested in paper airplanes.
I like to build and fly them. I set out to find of five different types of them, which one would fly the best. There were some
days when I wanted to test them out, but I couldn’t because there was wind outside. I had to ensure that there was not
enough wind that could greatly alter the outcome of my project. I learned from this project that wingspan and aerodynam-
ics have a lot to do with the distance airplanes can travel when thrown with fairly the same amount of force. I believe that
the density of the airplane must also be as low as possible. If it is too heavy for its size, it’s just like throwing a rock. It won’t
glide through the air at all. If the airplane is shaped correctly it also won’t have much wind resistance against it. This goes
back to aerodynamics. To ensure it glides longer, the wingspan must be supportive. I also learned from outside research that
the Bernoulli Effect plays a big part in this. This is what I have learned from this project. ���
Durability of Oiled and Non-Oiled Foods
My purpose for my experiment was to find out whether oiled foods or foods with no or less oil last longer or disintegrate
faster, and why. I wanted to find out which type of foods (fruits, vegetables, starches) the oil affects the most over several
period(s) of time. I discovered and observed the changes that occurred with the variety of foods. My hypothesis was that
the foods with oil would last longer than those without it, and the absorbent foods would make more use of the oil than
those that weren’t absorbent, by lasting longer. I took two different pieces each of oranges, apples, bread and green onions.
I placed them onto a flat surface and kept one of each type of food untouched, and I put canola oil on the other pieces.
I let them sit there for a period of time and observed once or twice every day, and took pictures. I experimented with this
three different times to see if there were any different results. I realized that the absorbent foods did make use of the oil by
lasting longer, but that didn’t happen in every trial. In all three trials, the oiled breads did absorb the canola oil, but didn’t
really make use of it because nothing of their physical appearance changed. This is why I can’t really say whether the oiled
or non-oiled bread lasted longer, in any of the three trials, but I can say that my hypothesis wasn’t fully correct. The oiled
foods didn’t all last longer. The breads did end up turning hard and stale, through. I must say that the non-oiled apples did
last longer than the oiled apples in terms of color and stabilization. I learned that oil changes color, size, appearance and
tangibility of foods. ���
Suman Paul and G. Zem (teacher)
3790 Ernest Lawrence Middle School Magnet10100 Variel Ave.Chatsworth, CA 91311
April Wu and G. Zem (teacher)
3791 Ernest Lawrence Middle School Magnet10100 Variel Ave.Chatsworth, CA 91311
Expanding Soap
The secret to the expansion of Ivory soap is due to heating properties of microwaves. Microwaves cause water molecules to
vibrate. When they vibrate fast enough, the water molecules turn into steam. The heating of the water that is inside of the
soap has the expanding effect. The water vaporizes, forming bubbles; the heat also causes trapped air to expand. This effect
is demonstrating Charles’ Law. His law states that as the temperature of a gas increases, so does its volume. The pressure
of the steam breaks down the walls of the air spaces and a big puffball of soap grows until all the steam has escaped. Unlike
other soaps, Ivory soap is honeycombed with thin-walled air spaces. ���
Marissa Chavez and G. Zem (teacher)
3792 Ernest Lawrence Middle School Magnet10100 Variel Ave.Chatsworth, CA 91311
VNY_SciJrnl_interior 9/14/12 10:24 AM Page 118

119New Journal of Student Research Abstracts 2007
What Type of Student Has a Greater Vital Lung Capacity?
This study examined vital lung capacity of musical students (who play wind instruments or sing), athletic students, and stu-
dents who do neither of those things, and compared which of the averaged scores were higher. Twenty-four students were
tested: eight musicians, athletes and average students. The height and age of the students, sport they play, how often they
play it, the instruments they play, how often they play them, and their level of playing was recorded for each student who
was tested. The students then had to take as much air as they could, and put as much of it as they could into a balloon. The
balloon was tied and measured. The circumference was divided by Pi in order to find the diameter and the diameter was
also recorded. The results showed that the athletes only fell behind the average students by .40. The “average student” cat-
egory might have had an advantage because of some very tall subjects. The Asian subjects were right at the average for
height and vital lung capacity, possibly because of a healthier diet. This could mean that the height (which plays a signifi-
cant role in lung capacity) is based on a good or bad (processed food, hormone-injected food, fast food) diet. ���
Green Roofs
Are your energy bills very expensive at the end of summer or winter? There is something that can help. By putting a garden
on your roof, you can save hundreds of dollars a year. A green roof not only adds beauty to your house, it also insulates it
throughout summer and winter. This means that in the summer, it keeps your house cooler and in the winter, it keeps the
house warmer. For my science project, I wanted to test what kind of roofs did better against nature. The house I built with
a black roof simulated shingles and the house with the white roof simulated cement. The house with a small garden on the
roof simulated a green roof. Surprisingly these three small plywood houses showed differences in temperature. The temper-
atures were taken from January to the end of March at 7 a.m., 3:30 p.m. and 9:30 p.m. At these times, the green roof was
the coolest, then the black roof, and then obviously the white. The soil in the roof of the green-roofed house insulated the
interior and kept it warmer than the other houses. I concluded that the green house was the best for conserving energy. ���
Baheej Saoud and G. Zem (teacher)
3793 Ernest Lawrence Middle School Magnet10100 Variel Ave.Chatsworth, CA 91311
Douglas Marks and G. Zem (teacher)
3794 Ernest Lawrence Middle School Magnet10100 Variel Ave.Chatsworth, CA 91311
Sound Isolation
In this lab I expected to learn and examine the sound waves as they passed through different materials. I did this because
I wanted to determine which materials would isolate the sound the best. My main purpose was to find the material that
could best be used to isolate sound in airplanes without the material weighing down the plane. The five materials I used
for this project were gelatin, spray insulation foam, Silly Putty, plaster and Polyfil. I also used air as a control material. I
thought that the material that would insulate sound the best was going to be the Silly Putty. The putty seemed like a very
dense material, and sound could have trouble traveling through it. I thought that the material that would isolate the sound
the least would be the Polyfil. I thought that because the Polyfil is made of very small fibers, it would not be as dense as
some of the other materials. After doing this lab I found that my hypothesis was somewhat correct. The Silly Putty did the
best job at isolating the sound, although it was one of the heaviest products. I found that I was right in thinking that the
Polyfil isolated the sound the least, and the most sound waves came through it. Polyfil was the lightest product of all the
testing materials. From this lab I learned a lot about how the density of materials not only affects their weight; it also affects
the ability of sound to travel through them. I found that when preparing the materials for testing purposes there was a lot
of waiting involved. Overall I enjoyed doing this experiment because I was always excited to see how the next material would
transmit sound. ���
Caitlin Harrington and G. Zem (teacher)
3795 Ernest Lawrence Middle School Magnet10100 Variel Ave.Chatsworth, CA 91311
VNY_SciJrnl_interior 9/14/12 10:24 AM Page 119
120 Van Nuys Airport & California State University, Northridge
Which Gender Has Better Memory, Male or Female?
This study examined which of the two genders, male or female, has better memory. Three males and three females were
tested to see which of the two genders could better recall the 10 pictures printed on a white sheet of paper. The subjects
were allowed a few seconds to look and try to memorize the pictures, then would have to write down as many as they could
recall in the 45 seconds that the subjects were timed. The results show that the female subjects remembered 9.3 repeating
on average, which means that two female subjects got 9 of the 10 pictures while one female got 10 of the 10 pictures. The
results also show that the male subjects remembered 7.3 repeating on average, which means that one male subject got 9
of the 10 pictures, one male subject got 7 of the 10 pictures, and the last male subject got 6 of the 10 pictures. Research
shows that females have better memories because they socialize more than males do, which means that they can recall
what was said, what a person was wearing, etc. This shows that the hypothesis was correct in that females have better mem-
ories than males. ���
The Rusting Effects on Nails
What I basically did was experiment on the rusting effects of nails. I wanted to find out which factor that the nail was in con-
tact with would rust first. I had 7 nails and 7 different factors that included: air, tap water + salt, drinking water + salt, drink-
ing water, tap water, salt, and soap. I wanted to see if the different types of water also had an effect on rusting. I started out
by measuring the nails first. That way I could tell how many grams I started out with and how many were left after the exper-
iment. After the experiment I made my chart and my hypothesis had matched my results: The nail contained in salty water
rusted the most. It was also concluded that the different types of water didn’t matter because the results were nearly the
same. I also did my experiment twice to get more accurate results. I averaged the two results together to get my final meas-
urements. I have to say, this was quite an experiment I did, not to mention somewhat dirty. But overall, I enjoyed it and
learned much from it. ���
Doyoon Lee and G. Zem (teacher)
3796 Ernest Lawrence Middle School Magnet10100 Variel Ave.Chatsworth, CA 91311
Tiffany Chi and G. Zem (teacher)
3797 Ernest Lawrence Middle School Magnet10100 Variel Ave.Chatsworth, CA 91311
How Do Various Colors Absorb Heat Differently?
This study examined which colors absorb the most heat. Six jars were painted with stain-glass paint six different colors: black,
blue, green, pink, yellow and white. One jar was not painted at all (it was left clear). These jars were placed on a circular
wood piece. In the middle of the wood piece was a 150-watt halogen lightbulb. Each jar was filled with 1/4 cup of water.
After the lightbulb was turned on, each jar was measured in 5-minute intervals. The jar with no paint was the control. The
results showed that the black and blue jars had the hottest temperature. Next hottest was the pink, then the green, then the
yellow, clear, and lastly the white. This is because the darker the color, the more other colors it absorbs. When heat is shone
onto the darker colors, there is more color to absorb the heat, and then the color transfers the heat to the water. Overall,
darker colors absorb the most heat. ���
Sydney Cohn and G. Zem (teacher)
3798 Ernest Lawrence Middle School Magnet10100 Variel Ave.Chatsworth, CA 91311
VNY_SciJrnl_interior 9/14/12 10:24 AM Page 120

121New Journal of Student Research Abstracts 2007
The Analysis of Zinc Contamination in the Los Angeles Harbor
The purpose of our research is to inform the public safety divers of area contaminants since they may be at risk when they
dive in the harbor. The divers dive in the harbor’s waters because they search for any threats from outside terrorism, because
the Los Angeles Harbor is a vital part of the U.S. economy. The results of this study will help public safety divers take
proper precautions against contaminants.
The hypothesis tested, if marine sediments in the Los Angeles Harbor are analyzed for zinc, then the levels present will be
shown to be over acceptable limits, was accepted. We had chartered the RV Yellowfin on December 7 and 14, 2006, and
January 17, 2007, and we used a Van Veen grab to sample sediments. Samples were contained in collection jars and
recorded through chain of custody procedures. We then sent samples to EMAX Laboratories for ICP analysis for CAM-17
metals. The test results of the samples were joined in ArcGIS to the sample point GPS locations. We interpolated zinc levels
throughout the harbor using an ordinary kriging prediction map with the spatial analysis extension in ArcGIS. We manually
classified sediment contamination levels to National Oceanic and Atmospheric Administration (NOAA) SQuiRT
table guidelines.
High levels of zinc were found all over the LA Harbor. The main concentration of zinc was found near the mouth of the LA
River. As a result of the high level of zinc in the sediments, the organs and meat collected from fish had a very high level of
zinc. The infauna and halibut exceeded maximum threshold levels as designated by the NOAA SQuiRT tables. Much of the
seafood from the area will not be safe to eat because of the unsafe levels of heavy metals that exist in the water and
sediments. Divers who dive in the harbor should wear protective equipment that prevents exposure to the water and
contaminants. ���
The Role of the Extracellular Loop (Ectodomain) in EthanolSensitivity of P2X Receptors
P2X receptors (P2XR) are cation-selective ion channels activated by adenosine 5-triphosphate (ATP) that may play a role in
mediating and/or modulating some of the cellular and behavioral effects of ethanol. Currently, the site(s) of ethanol action
on P2XRs is unknown. Previous work in our laboratory has shown that ethanol inhibits ATP-gated currents in P2X2Rs but
potentiates currents in P2X3Rs. We utilized a chimeric strategy that exploited differences in ethanol action between P2X2Rs
and P2X3Rs to identify regions of P2XRs important for ethanol action. We created several chimeric receptors that had
exchanged the TM1 and TM2 regions and/or the ectodomain between P2X2Rs and P2X3Rs. Wild-type P2X3R, P2X2R and
chimeric P2X2/P2X3Rs were expressed in Xenopus oocytes, and the effects of ethanol on ATP-induced currents measured
using two-electrode voltage clamp (Vh = -70mV). Ethanol (10-200 mM) reversibly potentiated ATP-induced currents in
chimeras that contained mainly P2X3R sequences. In particular, ethanol potentiated ATP-gated function of P2X2 ecto3 recep-
tor containing the full P2X3R ectodomain sequence. Furthermore, we found that ethanol inhibited the ATP-gated function
of P2X3 ecto2 chimera that contained a P2X2R ectodomain sequence (residues 66-310) on the backbone of P2X3R. These
data suggest that an important site for EtOH potentiation action is located in the ectodomain of wild-type P2X3R
and P2X2R. ���
Miyo Saito and J.D. Cocozza (teacher)
3799 Francisco Bravo Medical Magnet High School1200 N. Cornwell St.Los Angeles, CA 90033
Jaime Saavedra, Rayhan Yacub and D. Evans-Bye (teacher)
3800 Clark Magnet High School4747 New York Ave. La Crescenta, CA 91214
VNY_SciJrnl_interior 9/14/12 10:24 AM Page 121
122 Van Nuys Airport & California State University, Northridge
The Fishing Issues Surrounding the Population Decline of theYellowfin Tuna
If current fishing practices continue, yellowfin tuna, scientifically known as the Thunnus albacares, will suffer a steady pop-
ulation decline. Many inefficient fishing methods, such as long-lining and purse seining, have led to over fishing and destruc-
tion of marine-based habitats and organisms. By analyzing the National Oceanic and Atmospheric Administration’s (NOAA)
1950-2005 yellowfin annual landings it can be discovered that the number of yellowfin caught each year has been steadily
decreasing. Compared to the 60,000–128,000 metric tons caught between 1950 and 1983, recent landings show that the
amount of yellowfin caught has steadily decreased to a mere 3–30,000 metric tons per year. These results show that the
commercial landings of yellowfin tuna have suffered a 77% decline ever since the 1950s. If change is not brought about
soon, the yellowfin tuna will eventually be on the brink of extinction. This can be prevented if the fisheries that handle this
endeavor exercise seasonal moderation. The reason for this is because the several million eggs spawned by these fish over
the summer of each year are direly needed to sustain this fishery. Disrupting these summer seasons will fatally affect the
yellowfin populations and ensure a more severe decline in the near future. ���
ArcGIS Analysis of Cadmium in the Los Angeles Harbor’s Sediments
The purpose of studying the sediments in the Los Angeles Harbor is to notify public safety divers about poisonous
contaminants. Bioaccumulation of CAM-17 metals in marine life was also investigated in this study. One of the dangerous
CAM-17 metals that was studied was cadmium. The hypothesis – if marine sediments in the Los Angeles Harbor are
analyzed for cadmium, then the levels present will be shown to be over acceptable limits – was tested.
Collections were made from within the Los Angeles Harbor on December 7 and 14, 2006, and January 17, 2007. A Van Veen
grab was used to collect the marine sediments from the harbor. Sediments were sent to EMAX Laboratories to be analyzed
following chain of custody procedures. ArcGIS was used to join GPS sample points in the harbor to the results from EMAX
that were put into a database. Ordinary kriging prediction maps were made by interpolation in spatial analysis extension
with ArcGIS. The contaminants were manually classified by the National Oceanic and Atmospheric Administration (NOAA)
SQuiRT table threshold levels. The apparent threshold level is 9,600 ppb and the threshold effects level 676 ppb for
cadmium in marine sediments.
Cadmium is mostly found at mouth of the Los Angeles River. Cadmium was found in the infauna and it was over the
apparent effects threshold level. Tissues and organs of the other marine life were not affected. The hypothesis was
accepted because the limit of cadmium was high in many areas of the Los Angeles Harbor. It could cause problems for
public safety divers because they will be exposed to toxic levels in the sediments. Generally, infauna isn’t consumed by
humans; therefore there should be no concern of whether or not it would affect the person. ���
Joshua Bravo, Harris Ono and D. Evans-Bye (teacher)
3801 Clark Magnet High School4747 New York Ave. La Crescenta, CA 91214
Arman Torosyan, Matt Zari and D. Evans-Bye (teacher)
3802 Clark Magnet High School4747 New York Ave.La Crescenta, CA 91214
VNY_SciJrnl_interior 9/14/12 10:24 AM Page 122

123New Journal of Student Research Abstracts 2007
Bacteria at School
My project is about bacteria at school. During my experiment I tested different places in the classroom to see where there
was the most bacteria. I thought that the desk would have some bacteria but it didn’t because before I tested the desk my
teacher, Ms. Walzberg, had cleaned it with Simple Green. I really thought that the doorknob and the floor would have the
most bacteria because everybody touches them. They both had about the same amount of bacteria. During the experiment
the chalkboard had the most bacteria, maybe because the chalkboard hasn’t been cleaned for the longest time. ���
Levels of Copper in the Los Angeles Harbor
The purpose of the study was to determine the levels of contaminated metals in the Los Angeles Harbor. With this informa-
tion public safety divers could be notified to follow accurate hazmat etiquette to protect them from extended exposure to
contaminants. If marine sediments in the Los Angeles Harbor are analyzed for copper, then the levels present will be shown
to be over acceptable limits, as defined by the National Oceanic and Atmospheric Administration (NOAA) SQuiRT tables.
Students at Clark Magnet High School collected sediments with the Van Veen grab and water samples with Niskin bottles.
These samples were brought directly to EMAX Laboratories for analysis following chain of custody procedures. The students
then used ArcGIS to join a database table of results to sample points plotted in GPS and manually classified contaminate
levels by using the NOAA SQUiRT tables for marine sediments. Interpolation was done using the spatial analysis extension
and kriging ordinary function to make prediction maps.
The minimum threshold effects level for copper is 18,700 ppb as defined by NOAA. The maximum level of contamination
was 173,000 ppb, found at Outer Fish Harbor. The minimum level of contamination was 10,200 ppb, found at Long Beach
Outer Harbor. Copper is usually accumulated in the liver and kidneys. If the level of copper in the organ exceeds the thresh-
old, the contamination will cause nausea, vomiting, diarrhea and stomach cramps in humans. Our hypothesis was support-
ed because the maximum and minimum levels of copper found in Los Angeles Harbor sediments and organs of area marine
life did exceed the effects level threshold. Public safety divers could be in danger of exposure to this contaminate if proper
precautions are not taken. ���
Lora Khatcherian, Mary Gabrielyan and D. Evans-Bye (teacher)
3803 Clark Magnet High School4747 New York Ave.La Crescenta, CA 91214
Kaylyn Chavez and M. Walzberg (teacher)
3804 John Muir Middle School5929 S. Vermont Ave. Los Angeles, CA 90044
Got Mold?
This project is about mold on bread. We tried to put three pieces of bread in different places because they got different
amounts of light. The one with more mold was the one under the lightbulb. The one with no mold was the bread on the
counter, where in the school time the lights are on and at nighttime they’re off so this bread got both light and dark.
The bread in the box had no light and we thought that it may get mold, but it didn’t get as much as the bread in the light
all the time. ���
Daniel Cubias, Mario Ramirez and M. Walzberg (teacher)
3805 John Muir Middle School5929 S. Vermont Ave. Los Angeles, CA 90044
VNY_SciJrnl_interior 9/14/12 10:24 AM Page 123
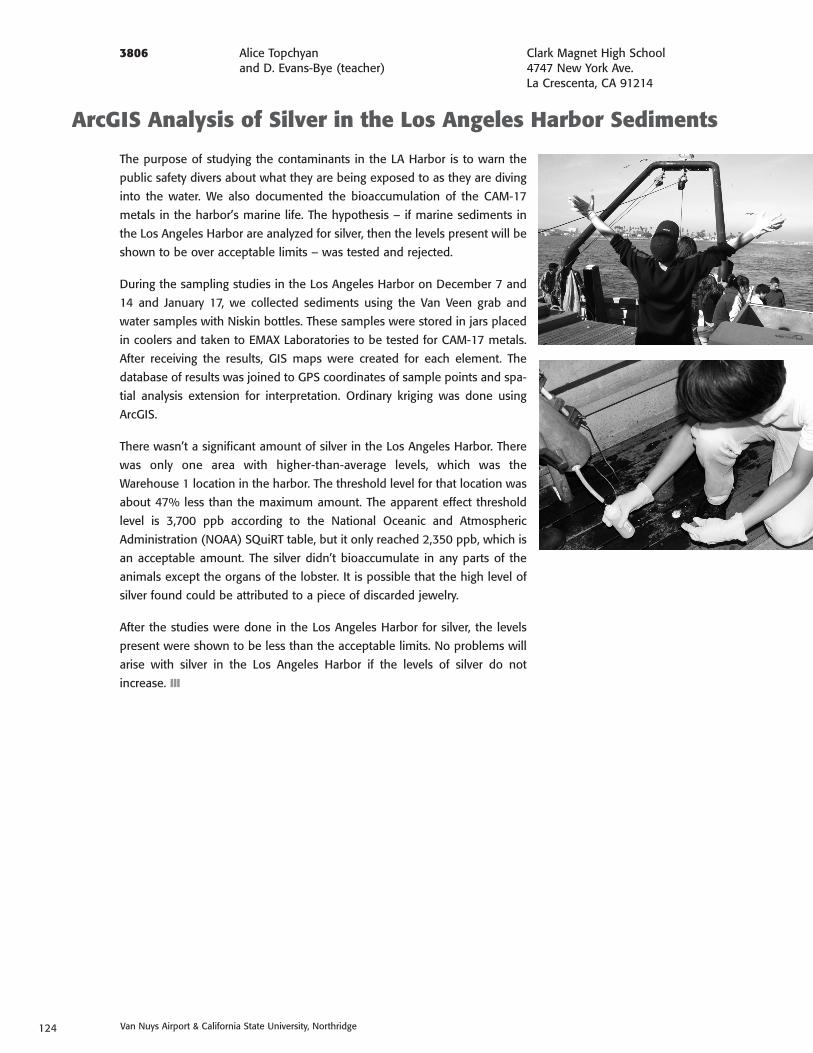
124 Van Nuys Airport & California State University, Northridge
ArcGIS Analysis of Silver in the Los Angeles Harbor Sediments
The purpose of studying the contaminants in the LA Harbor is to warn the
public safety divers about what they are being exposed to as they are diving
into the water. We also documented the bioaccumulation of the CAM-17
metals in the harbor’s marine life. The hypothesis – if marine sediments in
the Los Angeles Harbor are analyzed for silver, then the levels present will be
shown to be over acceptable limits – was tested and rejected.
During the sampling studies in the Los Angeles Harbor on December 7 and
14 and January 17, we collected sediments using the Van Veen grab and
water samples with Niskin bottles. These samples were stored in jars placed
in coolers and taken to EMAX Laboratories to be tested for CAM-17 metals.
After receiving the results, GIS maps were created for each element. The
database of results was joined to GPS coordinates of sample points and spa-
tial analysis extension for interpretation. Ordinary kriging was done using
ArcGIS.
There wasn’t a significant amount of silver in the Los Angeles Harbor. There
was only one area with higher-than-average levels, which was the
Warehouse 1 location in the harbor. The threshold level for that location was
about 47% less than the maximum amount. The apparent effect threshold
level is 3,700 ppb according to the National Oceanic and Atmospheric
Administration (NOAA) SQuiRT table, but it only reached 2,350 ppb, which is
an acceptable amount. The silver didn’t bioaccumulate in any parts of the
animals except the organs of the lobster. It is possible that the high level of
silver found could be attributed to a piece of discarded jewelry.
After the studies were done in the Los Angeles Harbor for silver, the levels
present were shown to be less than the acceptable limits. No problems will
arise with silver in the Los Angeles Harbor if the levels of silver do not
increase. ���
Alice Topchyan and D. Evans-Bye (teacher)
3806 Clark Magnet High School4747 New York Ave.La Crescenta, CA 91214
VNY_SciJrnl_interior 9/14/12 10:24 AM Page 124

125New Journal of Student Research Abstracts 2007
Analysis of Barium Concentrations in Los Angeles Harbor
This study was performed to examine and document potential chemical hazards in the Los Angeles Harbor and to inform
public safety divers who are regularly exposed to the bay water of the potential dangers so they can follow proper hazmat
(hazardous material) protocol for their own protection. The tested hypothesis – that is, if the LA Harbor sediments are test-
ed for barium then the levels found will be unacceptably high – was accepted, posing several health risks for anyone
exposed to the contaminants of the LA Harbor.
On December 7 and 14, 2006, and January 17, 2007, the 2007 Clark Magnet EAST (Environmental and Spatial Technology)
lab went out in the LA Harbor on the RV Yellowfin, and used a Van Veen grab to collect sediment samples and a Niskin bot-
tle to collect water samples from 39 different points. EMAX Laboratories analyzed the collection samples with the ICP
(Inductively Coupled Plasma) method and reported the concentration levels of each CAM-17 measured in milligrams per
kilograms (which we had to convert to parts per billion). These levels were individually mapped with ArcGIS, using National
Oceanic and Atmospheric Administration (NOAA) SQuiRT (Screening Quick Reference) tables to determine the threshold lev-
els of each CAM-17. Furthermore, spatial analyst extension extrapolated the data to produce a spline gradient of estimated
raster data values over the entire bay area.
Barium was an especially prevalent CAM-17 found to be in
high concentrations in the LA Harbor water. The SQuiRT
tables prompted that barium concentrations were over the
safety limit of 48,000 ppb in most of the bay. Given the
retrieved data, it appears that the barium concentration lev-
els are higher at areas closer to the surface. In the speci-
men tissue analysis of the infauna, barium was nearly three
times the acceptable safety limit.
In final closing, our hypothesis that CAM-17 levels in the LA
Harbor area are above toxic is proven to be true, and fur-
thermore, public safety divers are at risk to exposure to
these dangerous contaminants. Also, the public would be
at risk when eating the marine organisms out of the LA
Harbor, as many CAM-17 are prone to bioaccumulate in
their tissues. ���
Marty Fong and D. Evans-Bye (teacher)
3807 Clark Magnet High School4747 New York Ave. La Crescenta, CA 91214
VNY_SciJrnl_interior 9/14/12 10:24 AM Page 125

126 Van Nuys Airport & California State University, Northridge
Sediment Analysis for Nickel in the Los Angeles Harbor in 2006-2007
This study was completed to arouse awareness in public safety divers that contamination levels in the Los Angeles Harborrequire proper hazmat protocol procedures in order to avoid prolonged exposure to harmful contaminants. In addition, thestudy provides a legitimate source of documentation in reference to bioaccumulation of CAM-17 metals in the marine lifeof the harbor. If marine sediments in the Los Angeles Harbor are analyzed for nickel, then the levels present will show to beover acceptable limits as defined by the National Oceanic and Atmospheric Administration (NOAA) SQuiRT tables.
Sediment samples were collected from various points of the LA Harbor December 7, 2006, through January 17, 2007. The GPS coordinates of these points were recorded with trimble geoexplorer units. A Van Veen grab was used to retrievethe sediment from the bottom of the harbor. Following chain of custody procedures, samples were turned into EMAXLaboratories to be analyzed for CAM-17 metals. The samples’ locations were inserted into ArcGIS and joined to the data-base table of the results. Contaminant levels of nickel were classified according to NOAA SQuiRT tables and the spatial ana-lyst extension was used to create an ordinary kriging prediction map of this metal in the harbor. The DOQQs (digital orthophoto quarter-quadrangles) of the area were mosaiced and clipped to coastline shape file.
According to the levels of CAM-17 shown in the collected data and prediction map, some areas in the western part of theLA Harbor, including the Fish Harbor, contain a higher concentration of nickel than is acceptable by the EnvironmentalProtection Agency (EPA). Interestingly enough, only infauna showed to have high levels of nickel in their tissues, while allother organisms were unaffected. This creates the problem of possible biomagnification; organisms that feed on infauna willacquire levels of nickel that might affect their physical and biological structures in negative ways. This is also true for peoplewho consume the fish from the harbor.
The hypothesis is supported. Because contamination levels of nickel are moderately high in certain areas, public safety divers might be directly exposed to contaminated sediment that might undermine their health. Seafood other than infaunais under the threshold levels for nickel. However, the threat of biomagnification is present and other contaminates still posea risk. ���
Gayane Vardoyan, Serly Moosakhanian and D. Evans-Bye (teacher)
3808
What Are We Drinking?
We wanted to find out if the water we were drinking in the school was of good quality and if it contained bad chemicalsthat students mostly think are present in the school water fountain.
My hypothesis was that the water from the school was the same as toilet water and contained bad chemicals and was notpure.
I took three samples of water, one from the science classroom sink, one from the school water fountain and one from bot-tled water. I bought a six-way testing kit that was used to test the water samples from the spa. I tested for total alkalinity,pH level, total bromine and chlorine and hardness of water, and compared the color indicator changes to the one given inthe kit.
Finally, I made a data table and compared the results with the amount of normal levels of pH, alkalinity, total bromine, chlo-rine level as for hardness of water as given in the kit and with the information for normal levels through the informationabout water sources on the Internet.
I concluded that my hypothesis was incorrect. The water samples at school were at the safe levels and the bottled waterwas also safe but had almost everything at the lower level. The water in the science room was the only abnormality, as itwas much more alkaline than the fountain water because it probably does not get used very often and stays in water pipestoo long. ���
Andrea Gutierrez and S. Parmar (teacher)
3809 John Adams Middle School151 W. 30th St. Los Angeles, CA 90007
Clark Magnet High School4747 New York Ave. La Crescenta, CA 91214
VNY_SciJrnl_interior 9/14/12 10:24 AM Page 126

127New Journal of Student Research Abstracts 2007
Does Human Hair Affect the Growth of Plants?
I wanted to find out if human hair affects the growth of a plant. My hypothesis was that the hair was going to affect the
growth because hair has a protein named keratin.
I selected four plants around the same age. I put them in same-sized pots and used a measuring cylinder to give an equal
amount of water to each plant. I put a different amount of hair in each plant, except in the one as a control, to see if hair
has any effect on the growth of plants. I put 4 oz., 5 oz. and 6 oz. in three pots.
I found that the plant with the 4 oz. grew the most. I think that this was the exact amount of hair needed by the plant. I
concluded that there is some correlation between hair and growth of plants. However, I realized that I needed to do this
experiment on different types of plants in order to come to a definite conclusion. ���
Fly Paper Airplanes
Our group wanted to experiment with aerodynamics and find out what designs and paper can be used to fly a paper air-
plane better than usual. Four paper airplane designs and four different types of paper were used in order to see which one
was the best combination. The best one was parchment paper (a sturdy paper), which flew eight feet. ���
Jose Santibanez, David Romero and D. Santamaria (teacher)
3810 John Adams Middle School151 W. 30th St. Los Angeles, CA 90007
Caleb Villanueva and S. Parmar (teacher)
3811 John Adams Middle School151 W. 30th St. Los Angeles, CA 90007
Do Plants Like It Hot?
We wanted to find out how the temperature of water given to a plant affects its growth. My hypothesis was that with very
hot water the plants would die, as it would be too high for the plants to handle. I took six plants, three each of ivy and the
tropical plant. Give each of these plants all the similar conditions, like the same amount of water and similar light and tem-
perature conditions. Give one plant of each type hot water, cold water and regular water. Observe for the changes in height
and characteristics of the plants for several days. My hypothesis was incorrect, as I found that there might be other factors
that decide the growth of the plants. In my experiments, the ivy plant grew most in the hot water, whereas the tropical plant
grew most in regular water. Hence my results were inconclusive. ���
Krupa Bhakta, Michelle Farias and S. Parmar (teacher)
3812 John Adams Middle School151 W. 30th St. Los Angeles, CA 90007
VNY_SciJrnl_interior 9/14/12 10:24 AM Page 127

128 Van Nuys Airport & California State University, Northridge
Does Homework Really Help the Students?
We wanted to find out how the amount of homework given at school helps the students to achieve academically. We
hypothesized that the amount of homework would directly affect the academic grade of the students, as otherwise the
teachers would not make us do it. Also the research on various websites emphasized the importance of homework.
In order to find a solution to this problem, we made a questionnaire and surveyed people in three different age groups of
students and tried to find out how much homework each one of them did and what their academic grades were in the past
and generally are at the moment.
Our hypothesis was wrong. We were expecting that the amount of homework given in each subject would positively affect
the academic outcome, but we found out that actually there was no direct correlation between the two. The data proved
that there were other factors that were probably responsible for students getting good academic grades. We also found out
that some of the students got good grades irrespective of the amount of homework given by the teacher at school.
We conclude that the data obtained by us does not show any direct or positive correlation between the amount of home-
work given at school and the academic grades of the students. ���
The Effect of OTC Drugs on Daphnia
When humans and livestock excrete drugs, it enters the sewers and into our streams, affecting the creatures living underwa-
ter. The objective of this project is to determine what the effect of OTC drugs is on Daphnia. I hypothesized that as the pH
level of the drug decreased, the heartbeat of the Daphnia would increase. To test this out I added over-the-counter drugs to
a group of Daphnia. I also added a combination of drugs to another group of Daphnia to recreate a similar effect one might
find in a pond or stream. The results prove that over-the-counter drugs have an immediate effect on Daphnia; the drugs, all
suppressants, sped up the heart rate between 4% and 31%. So if one “harmless” over-the-counter drug can speed up the
heartbeat of Daphnia by 31%, imagine what is happening today as millions of deadly drugs are pouring into our streams
and lakes. ���
Vanessa Rendon, Alexandra Fonseca, Christine Vargas and S. Parmar (teacher)
3813 John Adams Middle School151 W. 30th St.Los Angeles, CA 90007
Wenelia Baghoomian and A. Darakjian (teacher)
3814 El Camino Real High School5440 Valley Circle Blvd.Woodland Hills, CA 91367
Light, Plants, Action
The starting question was, “What is the effect of differing light cycles, all of which provide the same amount of light in a 24-
hour period, upon plant growth?” I hypothesized that the plants exposed to 12 continuous hours of light followed by 12
continuous hours of dark will grow more quickly than plants exposed to alternating six-hour light/dark cycles or alternating
one-hour cycles. To conduct this experiment, you must make three light boxes. Then every day you must water the plants
with the required amount of water. After you water the plants with the required amount of water, you must record height
and observations, and take pictures. The results were that on average the 12-hour plants were taller than those in either of
the two other light boxes. The tallest 12-hour plant was taller than either of the plants from the one-hour and six-hour boxes.
To improve on this experiment, I would make the light boxes bigger and start with more plants. ���
Grace Grogman and A. Darakjian (teacher)
3815 El Camino Real High School5440 Valley Circle Blvd.Woodland Hills, CA 91367
VNY_SciJrnl_interior 9/14/12 10:24 AM Page 128

129New Journal of Student Research Abstracts 2007
Does Acid Rain Kill?
For my science fair project I studied the effect of acid rain on different kinds of plants. I predicted that the plants that liked
neutral to basic soil would die when given high doses of acid and that the plants which liked acidic soil would grow nor-
mally in the soil with a moderately acidic pH. I purchased three pinks (they like neutral to basic soil) and three lilies (they
like neutral to acidic soil). Over a period of about one month, I watered two of the plants from each species with acidic water
with a pH of three or five, and watered the other two plants with regular water. The pinks which were given acid had stunt-
ed growth, especially the pink which was given an acid with the pH of three. The lily that was watered with a pH of five had
the best growth rate, followed by the lily watered with normal water, and then the lily watered with a pH of three solution.
I think that plants that like acid soil will tolerate acid rain fairly well, while other plants might not be so lucky. I was surprised,
however, how well all the plants handled the acid. If acid rain were to become “normal” rain, I think many types of plants
would shrink in size. ���
Drinking Water Quality
For my project, I wanted to compare different sources of water to answer my question of which source is of the best qual-
ity. I hypothesized that bottled water would be the cleanest according to the tests I conducted. For my procedure, I gathered
five water samples and tested them with aquarium water testing strips. I tested for nitrate, nitrite, total hardness, total
chlorine, total alkalinity and pH. My results showed the measurements of the tested samples of water: filtered tap, pool, tap,
bottled and a water sampling from the city of Sherman Oaks. In conclusion, I found that bottled water had the cleanest and
best quality. ���
Nancy Machadoand A. Darakjian (teacher)
3816 El Camino Real High School5440 Valley Circle Blvd.Woodland Hills, CA 91367
Lianna Martin and A. Darakjian (teacher)
3817 El Camino Real High School5440 Valley Circle Blvd.Woodland Hills, CA 91367
True Importance of Hand Washing
The problem in my experiment is to see which type of the three basic soaps is most effective in killing colonies of bacteria.
The three basic types of soap are bar soap, liquid soap and antibacterial soap. I hypothesize that the antibacterial soap will
be most effective in killing bacteria, then the liquid soap and the bar soap. The first thing I did in my experiment is get the
incubator plates and volunteers. I took bacteria samples from each of their hands before washing and after washing with
the specific soap. Three days later I took the samples out of the incubator and recorded the results. My results showed that
the antibacterial soap was more effective in eliminating colonies of bacteria. The liquid soap had a greater impact than the
bar soap. In conclusion, the antibacterial soap was more effective than the liquid soap, which in turn was more effective
than the bar soap. ���
James Lambert and A. Darakjian (teacher)
3818 El Camino Real High School5440 Valley Circle Blvd.Woodland Hills, CA 91367
VNY_SciJrnl_interior 9/14/12 10:24 AM Page 129

130 Van Nuys Airport & California State University, Northridge
Sex, Age and Memory
For my science fair project, I tested short-term memory of males and females of different age groups to see who tested bet-
ter than others. I hypothesized that females would do better than males in color testing and that younger adults would
remember words better than older ones. Taking two sets of five words and one set of shapes and colors, I tested each sub-
ject individually on each test. My results came that as a whole, both males and females tested about the same, with women
surpassing with a slightly higher average, and the same occurred with different age groups as well, although younger adults
averaged .10% higher. My hypothesis did seem to be correct, although by a very slight margin. If this were to be more accu-
rate, I would still have to test more people. ���
A Day in the Life of an Autistic Child
Do autistic children have a better memory than children who do not have autism? Many people believe that autistic people
have a terrible memory when compared to those who are not autistic. In order to test this statement, I visited a school espe-
cially for autistic children, where I watched children answer the teacher’s questions and perform other everyday tasks. I also
went to a regular elementary school, where I watched one autistic child in a class of non-autistic children and I could com-
pare and contrast regular tasks and difficulties. After this, I tested the children’s memory by a game. Results varied based on
what type of autism the child had. ���
Nedda Amini and A. Darakjian (teacher)
3819 El Camino Real High School5440 Valley Circle Blvd.Woodland Hills, CA 91367
Kashish Nizami and A. Darakjian (teacher)
3820 El Camino Real High School5440 Valley Circle Blvd.Woodland Hills, CA 91367
Medicine for Tomato Plants
What is the effect of Tylenol and Aspirin on the growth of tomato plants? If tomato plants are given Aspirin, they will grow
larger and faster. First, place each tomato plant into an 18-cm-diameter pot and add 2.9 L of potting soil. Then label each
plant Water, Aspirin and Tylenol. Give the Water plant 240 ml of water, the Tylenol plant 250 mg of Tylenol dissolved in 240
ml of water, and the Aspirin plant 250 mg of Aspirin dissolved in 240 ml of water. Water each plant about every other day,
and record your results. During the last week, Tylenol was the tallest of the three plants. Aspirin had the most tomatoes and
flowers compared to Water and Tylenol. Water was the healthiest of all the plants. It had the healthiest leaves, tomatoes and
flowers. Tylenol grew faster than all the plants, while Aspirin had the slowest growth of all. ���
Natalie Mann and A. Darakjian (teacher)
3821 El Camino Real High School5440 Valley Circle Blvd.Woodland Hills, CA 91367
Generator Power for the Future
I would like to see if the number of magnets on an AC electric generator would have an effect on the amount of electricity
produced. I predict that with a greater number of magnets more light will be produced, because there will be a stronger
magnetic field, causing a larger electrical current. I constructed a small AC electric generator out of Plexiglas surrounded by
wire with a spinning magnet inside. This would power a small incandescent lightbulb. I gradually increased the number of
magnets and recorded how this affected the quality of light. With the addition of each magnet, the amount of light increased.
In conclusion, the greater the number of magnets, the greater the amount of light produced. ���
Garrett Brooks and A. Darakjian (teacher)
3822 El Camino Real High School5440 Valley Circle Blvd.Woodland Hills, CA 91367
VNY_SciJrnl_interior 9/14/12 10:24 AM Page 130

131New Journal of Student Research Abstracts 2007
Dyeing to Find Out
The recurring question throughout my project has been: Which natural substance is the best dye and most long-lasting dye
on fabric? The hypothesis during my experiment has been that the blackberries will turn out to be the darkest and most
long-lasting dye on fabric. During my experiment, I have tested berries and plants by boiling them in water and placing fab-
ric into the liquid solution of berries and plants. Then later the dyed fabrics would be placed into the washing machine to
test how the fabrics would last under real conditions of cloth and fabrics, the result concluding that the blueberry would
withstand the experiments conducted on all the fabrics, and still be the darkest and longest-lasting substance used. The
blackberry as based in the hypothesis was not the longest-lasting and darkest substance tested. ���
Chaotic Pendulum
Does a swinging pendulum magnet create a “strange attractor” pattern? A swinging pendulum magnet creates a larger over-
all pattern that can be seen when the data is graphed. First, I created a pendulum using a camera tripod, and tied a mag-
net to the end. I then drew a circle on a poster board that was divided into six sectors. Each trial consisted of pulling the
pendulum back against a leg, letting it go and recording the sectors it bounced in using a tape recorder. I did 180 trials and
graphed the results in a few ways. None of the graphs showed any apparent overall pattern, and some graphs I tried I did-
n’t understand. It probably would take millions of trials and no errors to find a pattern. ���
Hannah Cohen and A. Darakjian (teacher)
3823 El Camino Real High School5440 Valley Circle Blvd.Woodland Hills, CA 91367
Rori Shah and A. Darakjian (teacher)
3824 El Camino Real High School5440 Valley Circle Blvd.Woodland Hills, CA 91367
Hot Tomato: Global Warming’s Impact on Tomato Plants
In my project, the question that I wanted to answer was: How does global warming affect tomato plants? I hypothesized
that tomato plants living in normal climates would grow more rapidly than tomato plants living in global warming. To test
my hypothesis, I bought 12 Early Girl tomato plants, and I put a Ziploc bag for enclosure over 6 plants and left 6 plants with-
out a bag. All received the same amount of light and food, and I daily measured and observed changes that occurred to each
plant. The average daily stem heights of the normal plants were approximately 1-6 centimeters greater than the average daily
stem heights of the global warming plants. The average daily number of leaves of the normal plants was approximately 1-9
leaves greater than the average daily number of leaves of the global warming plants. The number of tomatoes showed no
differences. Based on the results, the conclusion that I have reached is that tomato plants living in normal conditions grow
more rapidly than tomato plants living in global warming conditions. ���
Chelsea Daniels and A. Darakjian (teacher)
3825 El Camino Real High School5440 Valley Circle Blvd.Woodland Hills, CA 91367
VNY_SciJrnl_interior 9/14/12 10:24 AM Page 131

132 Van Nuys Airport & California State University, Northridge
Detecting Danger
I always found it was interesting how the TSA (Transportation Security Administration) can detect whether someone has a
bomb or something like it. I found out that they use metal detectors because metals are used to make bombs. I wanted to
find out how a metal detector worked, so in addition to research, I built one myself. First I bought all the materials and con-
nected them with a circuit board. I connected the coils. Then I made sure it worked by passing it over metal. At first it did-
n’t work, but after a few more trials, I was able to make my metal detector work. Finally, I recorded the calibrations with the
help of an oscilloscope. ���
How Blue Is the Sky?
What is a normal blue sky day? The student believes that the blue sky will be made up of variations of blue with only hints
of green and reds. On clear days, at a particular time, three pictures of the blue sky toward Polaris will be taken. They will
be stored on the computer and analyzed using a histogram, seeing amounts and variations of the colors red, green and blue
in that picture. The NO2 level will be noted and graphed in correlation with the colors. After many days of trials the results
showed that the sky’s color does change slightly from day to day. Although the NO2 amount did not show obvious signs that
it affected the redness of the sky, the numbers did jump down on windy days. This showed that the color of the sky remained
relatively constant, and the NO2 level changed frequently, just not in sync with the colors. ���
Jiann Mok and A. Darakjian (teacher)
3826 El Camino Real High School5440 Valley Circle Blvd.Woodland Hills, CA 91367
Audrey Goldbaum and A. Darakjian (teacher)
3827El Camino Real High School5440 Valley Circle Blvd.Woodland Hills, CA 91367
Let’s Break It Down!
My science fair project was to recreate digestion of carbohydrates with different fiber levels. I used orange juice to act as the
acids and juices in the stomach, bread as the carbohydrate, and clear containers to hold everything. I put the bread and juice
into the container, stirred it around every couple of days, and observed my results. I thought that the bread with the least
amount of fiber (0 grams) would dissolve more than the breads with higher fiber levels (2 and 5 grams). On the first trial
the bread with 5 grams of fiber actually dissolved the most, but on the second trial my hypothesis turned out to be true. ���
Megan McEvoy and A. Darakjian (teacher)
3828 El Camino Real High School5440 Valley Circle Blvd.Woodland Hills, CA 91367
The Magic of Music
My question is: Do different types of music have different effects on the short-term memory capacity of subjects? I hypoth-
esized that listening to classical music will show the greatest increase in memory capacity in relation to listening to rock
music and silence. I had each subject play Simon the electronic memory game three times after listening to Mozart’s sonata,
“Master of Puppets” and silence. In the results, 27% of the subjects scored highest in silence, 9% scored highest after rock,
and 64% scored highest after classical. It is clear that classical music has some small and not completely consistent effect
on people’s memory. ���
Mansur Ghani and A. Darakjian (teacher)
3829 El Camino Real High School5440 Valley Circle Blvd.Woodland Hills, CA 91367
VNY_SciJrnl_interior 9/14/12 10:24 AM Page 132

133New Journal of Student Research Abstracts 2007
The Sound of Music
The purpose of this experiment was to see how the speed of music affects how fast a person can complete a simple task.
The hypothesis was that listening to fast-paced music causes a person to work faster, while listening to slow-paced music
causes a person to work slower. Subjects were given the pictures of three puzzles and told to copy the pattern in the pic-
ture with plastic shapes. The subjects had to replicate the second puzzle with classical music in the background, while the
third puzzle they replicated with rock music in the background. The subjects were timed to see what puzzle they replicated
the fastest. The results show that more than 75% of my subjects were faster with the rock music in the background than
with classical music or with no music. They also show that subjects go the slowest while listening to classical music. Based
on the results, my conclusion is that my hypothesis is true and that fast-paced or slow-paced music affects how fast a per-
son can complete a simple task. ���
Soap vs. Sanitizer
In my experiment, my goal was to see which antimicrobial, sanitizer or soap, would be more effective at killing bacteria. My
hypothesis is that if the sanitizer and soap will be used to kill bacteria, then the sanitizer will kill more bacteria than the liq-
uid soap. I found out which antimicrobial was better at killing bacteria by placing bacteria and filtered paper disks dipped
in either liquid soap or sanitizer in petri dishes. Then, after 24 hours, I measured the diameter of the growth of inhibition
around each paper disk. My results were that the diameters of the growth of inhibition were greater each time around the
paper disk that was dipped in sanitizer. This means that the sanitizer kills more bacteria than the liquid soap. ���
Julia Yesipova and A. Darakjian (teacher)
3830 El Camino Real High School5440 Valley Circle Blvd.Woodland Hills, CA 91367
Allison Santo and A. Darakjian (teacher)
3831 El Camino Real High School5440 Valley Circle Blvd.Woodland Hills, CA 91367
The Most Efficient Angle to the Wind for the Blades of a Wind Turbine
The problem is identifying the most efficient angle to the wind for the blades of a wind turbine. It is hypothesized that if the
blades are perpendicular to the wind, the assembly will rotate faster and generate more energy than blades at a shallower
angle to the wind.
The procedure of the experiment is as follows: Mark one blade of a three-bladed fan. Place the three-bladed fan on sup-
ports of angles 0, 22.5, 45, 67.5 and 90 degrees. Place an electric fan level with the three-bladed fan. Turn the electric fan
on to the highest power level. Move the three-bladed fan horizontally until it begins spinning quickly from the electric fan’s
air current. Count the number of rotations in 10 seconds and multiply this number by 6 to get the rotations per minute.
Data was taken in this manner and recorded. The data collected supports my hypothesis. Having the three-bladed fan
perpendicular to the wind was the most effective at catching the wind from the electric fan. ���
Jesse Chillington and T.C. Chiang (teacher)
3832 Dodson Middle School28014 Montereina Dr.Rancho Palos Verdes, CA 90275
VNY_SciJrnl_interior 9/14/12 10:24 AM Page 133

134 Van Nuys Airport & California State University, Northridge
How Grain Size Affects Water Absorption
My project investigates how grain size affects the rate of water absorption. The purpose of my experiment is to examine
which material has the greater capacity to retain water. The materials used were various types of gravel, split peas and mar-
bles. I learned many things from my science fair project. I learned about surface tension and that it is caused by the attrac-
tion between the molecules of the liquid by various intermolecular forces.
I also learned about erosion during my science fair research. Erosion is distinguished from weathering, which is the compo-
sition of rock and particles through processes where no movement is involved, although the two processes may be concur-
rent. The last thing I learned during my research is that the smaller and more tightly a material’s grains are packed togeth-
er, the more the material resembles a non-permeable solid. Basically, the larger the material’s diameter, the more water it
will hold. ���
Does One Person’s Fashion Affect Another Person’s Behavior?
The problem is how does your mode of dress affect others’ willingness to give aid?
It is hypothesized that if a person is dressed conservatively, then he/she will encounter more people from the general pub-
lic who are willing to give him/her change for a dollar than a person who is dressed in a less-acceptable style.
A brief procedure of the experiment is as follows. On a Saturday afternoon from 12 p.m. to 4 p.m., walk around the Del Amo
Fashion Center in Torrance, California, or the South Bay Galleria in Redondo Beach, California. In one of the five outfits
(sexy/sluttish, athletic, girly, punk/goth and conservative), ask at least 25 people for change for a dollar. Record how they
respond to your question and if they give you change for a dollar, attempt to give you change or completely ignore you.
Repeat this for the other four outfits and record in which outfit people were most willing to give you change for a dollar and
in which outfit people were least helpful.
The result does not support the hypothesis. Based on how I conducted the experiment, much to my surprise, the results
were the opposite of what I had expected. ���
Ausha Ramjohn and W. Reid-Bradley (teacher)
3833 Horace Mann Middle School7001 S. St. Andrews Pl.Los Angeles, CA 90047
Rachel Furcick and T.C. Chiang (teacher)
3834 Dodson Middle School28014 Montereina Dr.Rancho Palos Verdes, CA 90275
VNY_SciJrnl_interior 9/14/12 10:24 AM Page 134

135New Journal of Student Research Abstracts 2007
Density and Angle of Reflection
The problem was to determine if changing water density would affect the refraction of a red laser light beam. It’s hypothe-
sized if the density of water is changed, then the angle of refraction would also change. I filled a fishbowl with water and
flashed a laser to measure the angle of refraction. Then by adding different amounts of salt to the water each time, I changed
its density and measured the angle of refraction. In the end, the results did support my hypothesis. ���
How Cool Is Green?
Urban areas, such as downtown Los Angeles, can reach temperatures up to 10° Fahrenheit (5.5° Celsius) higher than near-
by areas covered with natural land. This enormous bubble of hot air temperature is known as the urban heat island effect.
This phenomenon creates a cycle of negative effects on the environment, the economy and people’s health.
The purpose of this experiment is to investigate how structures called green roofs affect the temperature of urban heat
islands. More specifically, it measures the difference in temperature resulting from using green roofs compared to tradition-
al roofing material, and the amount of green roofs, represented by plants, needed to cool down the heat island. My hypoth-
esis is that the more vegetation is used on green roofs, the more the temperature will drop in the urban heat island.
To conduct this experiment, I used five plastic containers, one of which was empty as a control group. The other containers
were as follows: one with black roofing material, one with plants only, one with grass only and one with plants and grass. I
placed lightbulbs on top of the containers as a source of heat and used a thermocouple digital thermometer to take and
record temperature readings at predetermined times (9 a.m. before turning on the light, 12 p.m. after three hours of light,
3 p.m. before turning off the light, and 6 p.m.). I repeated the process for 10 days.
The overall results support my hypothesis. As the heat increased, all the test groups containing plants had a significantly
lower temperature than the test group containing black roofing and the control group consisting of an empty container.
Furthermore, the lowest temperature readings were taken from Container E, which had the most vegetation. ���
Kamal Kajouke and T.C. Chiang (teacher)
3835 Dodson Middle School28014 Montereina Dr.Rancho Palos Verdes, CA 90275
Greg Duranand T.C. Chiang (teacher)
3836 Dodson Middle School28014 Montereina Dr.Rancho Palos Verdes, CA 90275
VNY_SciJrnl_interior 9/14/12 10:24 AM Page 135

136 Van Nuys Airport & California State University, Northridge
The Effect of Phosphate
The problem is, “How does the amount of phosphate in water affect plant growth?” It is hypothesized that if a plant is grown
with a small amount of detergent, then it would grow faster due to the phosphate. Eggplant plants were exposed to differ-
ent levels of detergent. Their growth was monitored for a period of time. The result does support the hypothesis. ���
Veronica Alayvilla and T.C. Chiang (teacher)
3838 Dodson Middle School28014 Montereina Dr.Rancho Palos Verdes, CA 90275
Brick Strength
The problem statement is, “Does the granule size of sand affect the strength of a brick?” It is hypothesized that if the gran-
ule size of the sand affects the brick’s strength, then the brick will be stronger if the granule size is smaller.
The first procedure is pouring sand through the five different sieve sizes (200, 100, 50, 30 and 16). This separates the sand
by granule size. Each different size of sand is separately mixed with two liters of water and one bottle of Elmer’s Glue. After
all the mixtures are made, each type of sand is equally put in 10 molds. Therefore, 50 bricks in total are made with 10 bricks
of each type of granule size. Next, all molds are put in the same spot in sunlight outside. After a week the bricks dry and
they are ready for experimentation. Two tables are then set 18 cm apart, with one brick placed evenly on top of the two
tables. Then, one weight is put in the middle of the brick and 0.1-kg increments of weight are added until the brick breaks.
This is repeated for all 50 bricks to observe how much weight each brick can withstand.
The data supports the hypothesis because the strongest brick was the one made with sand sifted through sieve size 200.
These granules were the smallest of all five sizes. These bricks were able to endure the most weight of 1.5 kg compared to
the other four bricks. ���
Nadeem Aibani and T.C. Chiang (teacher)
3839 Dodson Middle School28014 Montereina Dr.Rancho Palos Verdes, CA 90275
Carbon Dioxide and Lawn Grass
My problem statement is what is the effect of increased carbon dioxide levels on lawn grass? If an increase in carbon diox-
ide does affect the growth of lawn grass, then a higher level of carbon dioxide will cause the lawn grass to grow faster.
A brief procedure of the experiment is as follows: Five test groups were planted in sealed containers. Each sealed contain-
er was exposed to different levels of carbon dioxide by mixing vinegar and baking soda. All the test groups were exposed to
the same intensity and hours of sunlight each day. Every two days the containers were opened for watering and height meas-
urements were taken. Before resealing, carbon dioxide was added.
The average results for each independent variable are as follows: Test Group A (lowest carbon dioxide level) grew up to
around 5.6 cm on average by the end of the two weeks. Test group B grew up to around 5.8 cm on average by the end of
the two weeks. Test Group C grew up to around 6 cm on average by the end of the two weeks. Test Group D grew up to
around 6.2 cm on average by the end of the two weeks. Test Group E (highest carbon dioxide level) grew up to around
6.5 cm on average by the end of the two weeks.
The results do support my hypothesis. ���
Debbie Kol and T.C. Chiang (teacher)
3837 Dodson Middle School28014 Montereina Dr.Rancho Palos Verdes, CA 90275
VNY_SciJrnl_interior 9/14/12 10:24 AM Page 136

137New Journal of Student Research Abstracts 2007
The Effect of Current/Coils on an Electromagnet
This experiment showed if current or coils were added to an electromagnet, if the amount of weight the electromagnet could
hold went up in a linear way. A 60-coil magnet, an 80-coil magnet and a 100-coil magnet were all given three amps of cur-
rent. It turned out that the 100-coil magnet held more than double the 60-coil magnet. This shows that the amount of coils
does not go up in a linear way. As I decreased the current, it also did not go down in a linear way. This shows that if you
double the current it will go up more than two times. ���
Acid Rain
The experiment was going to demonstrate the effect of acid rain on the rate of photosynthesis of a radish plant. It was
hypothesized that the radish plant would have a slower rate of photosynthesis when watered with a solution of a higher pH
level and the radish plant would have a faster rate of photosynthesis when watered with a solution of a lower pH level.
Radish seeds were grown and watered with five different pH levels. Ten plants were watered with a solution with a pH level
of 7. Ten more were watered with a pH level of 5. Ten more were watered with a pH level of 4. Ten more were watered with
a pH level of 3, and the last 10 were watered with a pH level of 2.5. To change the pH levels, different amounts of vinegar
were added to the water. To calculate the rate of photosynthesis, a baking soda solution was made by adding a small amount
of baking soda to water. Two- to three-leaf discs would be placed in 5 mL of the solution using a syringe. Air would be sucked
out of the leaf discs by creating a vacuum. The leaf discs would sink and the time at which each disc took to float was record-
ed.
The results supported the hypothesis. The plants watered with a pH level of 2.5 and a pH level of 3 never grew. The plants
watered with a pH level of 4 floated at an average time of 367.065 seconds. The plants watered with a pH level of 5 float-
ed at an average time of 339.488 seconds. The plants watered with a pH level of 7 floated at an average time of 308.816
seconds. ���
Alyssa Munson and T.C. Chiang (teacher)
3840 Dodson Middle School28014 Montereina Dr.Rancho Palos Verdes, CA 90275
Connor Nicholson and D. Shah (teacher)
3841 Portola Magnet Center18720 Linnet St.Tarzana, CA 91356
Effects on Helium When Being Inserted Into a Basketball
This study examines the question of when helium is inserted into a basketball. There were three groups that tested if the
helium basketball or the air basketball would stay longer in the air. When it came to the results, it did indeed stay longer in
the air. It weighed less too. But there was something that happened that I didn’t expect. The helium-filled basketball actu-
ally got bigger in width. ���
Paige Armas and D. Shah (teacher)
3842 Portola Magnet Center18720 Linnet St.Tarzana, CA 91356
VNY_SciJrnl_interior 9/14/12 10:24 AM Page 137

138 Van Nuys Airport & California State University, Northridge
Effects of Temperature on the Hardness of Walnuts
This project examined how temperature affected the hardness of a walnut. In the experiment, the walnuts were placed in
both warm and cold water bowls. After leaving both piles of walnuts in each of the bowls for about 20 minutes, they were
taken out and cracked using a nutcracker. In conclusion, the warm-water walnuts cracked more easily. ���
The Analysis of Cadmium Contamination in Los Angeles Harbor
The Clark Magnet High School Marine Science Research class conducted a study in the Los Angeles Harbor on December 7
and 14, 2006, and January 17, 2007. The purpose of our research was to investigate CAM-17 heavy metal contamination on
the LA Harbor and also inform the public safety divers who may be exposed to the harbor contaminants. The Van Veen grab
was used to collect the sediments and sample locations were recorded with GPS units. The samples were sent to the EMAX
Laboratories for testing. For analysis, they used the ICP method for quantifying heavy metals. The sample points were joined
to the database table and an ArcGIS map was constructed of the study area. After receiving the results, the spatial analysis
extension was used. The ordinary kriging method was used to interpolate a prediction map showing cadmium levels
throughout the harbor. The sediment results were manually classified to the National Oceanic and Atmospheric
Administration (NOAA) SQuiRT table guidelines.
There were high levels of cadmium all over the harbor, especially near the mouth of the LA River. One is allowed to intake
only 500 micrograms (µg) of seafood per week that contains cadmium; otherwise it may damage organs. The hypothesis –
if marine sediments in the LA Harbor are analyzed for cadmium, then the levels present will be shown to be over accept-
able limits – was tested. Since the levels of contaminants were above the effects range low threshold, the hypothesis was
shown to be correct. The public safety divers are recommended to wear dry suits, dry hood and dry gloves to avoid any con-
tact with the contaminants. ���
Allen Rojhani and D. Shah (teacher)
3843 Portola Magnet Center18720 Linnet St.Tarzana, CA 91356
Argineh Ebrahimi and D. Evans-Bye (teacher)
3844 Clark Magnet High School4747 New York Ave. La Crescenta, CA 91214
VNY_SciJrnl_interior 9/14/12 10:24 AM Page 138

139New Journal of Student Research Abstracts 2007
The Impact of Commercial Fishing on King Crab Populations The purpose of this research paper was to find out if the current rate of commercial fishing of king crab, Paralithodes
camtschatica, was sustainable or not. The hypothesis – If current fishing practices continue, then king crab populations will
remain stable – was not supported. The methods used to capture king crabs are using pots that weigh 600-700 pounds,
with steel frames covered with nylon webbing. Fishing is managed tightly and the traps do not affect the habitat of the king
crab. Data from the National Fisheries Service was compiled by the National Oceanic and Atmospheric Administration
(NOAA). Excel was used to analyze the commercial landings data of king crab from 1950-2005. The results show that
between the years of 1950-1966, landings had gradually increased to 72,000 metric tons and in 1967, the annual catch
dropped sharply to 25,000 metric tons. From 1970-1978, there was another gradual increase, reaching a maximum catch of
84,000 metric tons, followed by a sharp decline to approximately 10,000 metric tons. It has since stabilized at this low level.
In conclusion, it was found that fishing for king crabs in Alaska has significantly impacted the population of the king crab.
For this fishery to become sustainable we should impose stricter limits on the fishing industry for approximately 10 years in
order for crab populations to recover. This recommendation comes from trends shown from 1970-1980 commercial land-
ings, when it took approximately 10 years for stocks to recover from a peak landing of 72,000 metric tons. ���
Sediment Analysis for Lead in the Los Angeles Harbor
The purpose of this study was to document CAM-17 (California Administrative Manual 17) metals contamination and bioac-
cumulation in the Los Angeles Harbor. This information is to be distributed among the public safety divers to inform of pos-
sible exposure to these metals. The hypothesis – “If marine sediments in the Los Angeles Harbor are analyzed for lead, then
the levels present will be shown to be over acceptable limits” – was accepted.
The Clark Magnet High School EAST (Environmental and Spatial Technology) class chartered the RV Yellowfin and used the
Van Veen grab to collect sediment samples. The otter trawl was used to collect marine life specimens in the harbor. Chain
of custody procedures were followed for collecting samples, and sample locations were recorded with GPS. The sediments
and specimen tissues were analyzed for CAM-17 metals in ppm (parts per million) by EMAX Laboratories using the ICP
method. Clark students later converted ppm to ppb (parts per billion). The database results were joined to sample locations.
ArcGIS spatial analysis extension was used to interpolate the contamination levels into a kriging prediction map and deter-
mine the probable values of contamination within the harbor. According to the NOAA SQuiRT tables (National Oceanic and
Atmospheric Administration Screening Quick Reference Tables), lead levels were above the acceptable limit in sediments.
However, the amount of lead in specimens (lobster, halibut, white croaker and the horny head turbot) was below the thresh-
old effects level.
All of the lead contaminants sampled in specimen tissues were 0 ppb, while the infauna was measured at 5,860 ppb. Lead
samples in the sediments near the mouth of the Los Angeles Harbor were measured at approximately 77,900 to 87,000 ppb,
which is considered above the acceptable limit of lead, which is 30,420 ppb.
The hypothesis – “If marine sediments in the harbor are analyzed for lead, then the levels present will be shown to be over
acceptable limits” – was proven true. It is recommended that public safety divers wear protective gear such as a dry suit
made with vulcanized rubber material, dry hood and a full facemask to protect their skin from being exposed to lead
(Florence et al. 1996). Lead may go into one’s body through the skin, but will not directly go into the bloodstream. Therefore,
when blood tests are taken, it shows no signs of lead poisoning in the blood system, but there may be a significant amount
of lead in other systems of the body. Therefore, lead may affect divers who are continuously exposed to the water and sed-
iments in the LA Harbor. ���
Ally Lemmer and D. Evans-Bye (teacher)
3845 Clark Magnet High School4747 New York Ave.La Crescenta, CA 91214
Argineh Ebrahimi and D. Evans-Bye (teacher)
3846 Clark Magnet High School4747 New York Ave. La Crescenta, CA 91214
VNY_SciJrnl_interior 9/14/12 10:24 AM Page 139

140 Van Nuys Airport & California State University, Northridge
CO2 Hi-Brid or Low-Brid
Do hybrids really have lower carbon dioxide (CO2) emissions than non-hybrids? I believed that hybrids have the same CO2
emissions as non-hybrids. I used one 2004 Toyota Prius, one 2004 VW Beetle, a CO2 gas sensor and a computer program
called Data Studio. I collected samples of emissions from each car and then I measured the CO2 levels with the CO2 gas
sensor and compared the data. I found that the hybrid had higher CO2 emissions than the non-hybrid. ���
Jelloctrophoresis
The purpose of this lab was to discover whether a homemade gel apparatus would be successful in performing a gel
electrophoresis. Unfortunately, my experiment did not work, but possibly, if performed a different way, it should result in the
visualization of several bands of DNA in the gel. The gel was to be stained with methylene blue solution to view the running
of the DNA banana tissue cells. ���
Emanuel Carrillo and C. Bayley (teacher)
3847 John C. Fremont High School7676 San Pedro St. Los Angeles, CA 90003
Claudia Garcia and A. Flagan (teacher)
3848 Ramona Convent Secondary School1701 W. Ramona Rd.Alhambra, CA 91803
The Effect of Tobacco Mosaic Virus on Tomato Plants
Before the project could be undertaken, I first had to acquire a tomato plant. Prepare solution: Place two pinches of
tobacco from cigarette, kinetin and caffeine into three separate mortars for each. Add 5 ml of buffer and grind the mixture
with the pestle until it is fine slurry. Place slurry in a test tube until ready for use. Then I had to label each tube with
pertinent information. After I had to use the emery board and scrape the surface of some of the leaves. I then used a cot-
ton swab and treated the abraded leaves with the three control solutions (tobacco, kinetin and caffeine). I then drew a
sketch of my plant in order to indicate where my solution had been applied. Finally, I placed my plant in a well-lit area for
a week to 10 days, observing the changes and recording my data on a chart. Within a few weeks my tomato plant began to
change its physical being. The leaves began to change colors and they became very brittle and dry. The leaves turned a light
green to yellowish color. However, the tobacco virus never killed my plant; instead it just lowered the quality of my crop. ���
Danielle Galicia and A. Flagan (teacher)
3849 Ramona Convent Secondary School1701 W. Ramona Rd.Alhambra, CA 91803
Heat Absorption and Conductivity
The purpose of my experiment was to run different liquid substances through an active solar collector and observe the
differences in temperature fluctuations. Conductivity affects a substance’s ability to conduct electricity, but does the presence
of ions affect heat absorption? The goal of my experiment was to observe whether or not conductivity levels have an effect
on heat absorption. I ran different substances – tap water, deionized water, NaCl solutions and MgCl2 solutions, each with
different conductivity levels – through an active solar collector. After two minutes in the solar collector, each of the
substances came out at different temperatures, that is, the temperature varied from substance to substance. This indicates
that substances with greater conductivity levels absorb more heat. My experiment was a success, and it gave me the oppor-
tunity to observe the effects conductivity has on heat absorption. ���
Jessica Ochoa and A. Flagan (teacher)
3850 Ramona Convent Secondary School1701 W. Ramona Rd.Alhambra, CA 91803
VNY_SciJrnl_interior 9/14/12 10:24 AM Page 140

141New Journal of Student Research Abstracts 2007
Impact of Commercial Fishing on the Lesser Amberjack Populations Worldwide
If the lesser amberjack, Seriola fasciata, is continued to be caught at the rate it is now, then I predict that its population willsoon be an endangered species. This hypothesis is supported. The data from the National Oceanic and AtmosphericAdministration (NOAA) commercial fishing landings were graphed in Excel to analyze trends in population dynamics. My graph shows a high catch of the fish, which went from 13 to 30 metric tons in 1991 to 1995, then a dramatic drop from34 to 13 metric tons in 1996 to 1998. This concludes that this fish was most likely over-fished since there were fewer beingcaught right after the drop. The average landings from 1991-2005 resulted in 24 metric tons, with a minimum of 13 metrictons in 1998 and a maximum of 51 metric tons in 2002.
The lesser amberjack is commonly caught by using the long-lining method of fishing. Not only is it very effective, but it hasbeen shown to have a high instance of by-catch. I recommend restrictions for the fishing of the lesser amberjack. A limit of13 metric tons total annual landings should be imposed on the fishery until populations again reach sustainable numbers. Long-lining should be banned due to excessive by-catch. ���
Hungry Ants
In my science fair project, I am testing how fast an ant moves toward food with sugar. The ant will use its sense of smell todetect where the food source is coming from. I predict that the ants will move rather quickly and accurately to food with themost sugar. I have an ant farm, which looks like a mini-skate park for ants, and in this skate park there is a start line and finish line. I am starting my stopwatch from the time the ants cross that start line to the time they cross the finish line. At the end of the finish line, I will place a certain type of food ants may or may not be attracted to. I will use a variety offood to put at the end of the finish line. I will record my results, and they will show what kinds of food ants are attracted to most. ���
Samantha Cuevasand A. Flagan (teacher)
3851 Ramona Convent Secondary School1701 W. Ramona Rd.Alhambra, CA 91803
Adrine Ghazarian and D. Evans-Bye (teacher)
3852 Clark Magnet High School 4747 New York Ave.La Crescenta, CA 91214
Impact of Fishing Practices on Pacific Halibut Populations
It has been noted in the past years that Pacific halibut fisheries have been increasing in popularity. This study was conducted to find out if there is a direct impact between Pacific halibut populations and the fishing practices used to catchthem. The Pacific halibut, Hippoglossus stenolepis, is known to be the largest flatfish in the world. It is also one of the most valuable fishes located around the Pacific Ocean. This fishery is protected by the International Pacific Halibut Commission.If current fishing practices continue, Pacific halibut populations will remain stable. Annual fishing landings provided by theNational Oceanic and Atmospheric Administration (NOAA) from 1950 to 2005 were analyzed. The information was graphedin Microsoft Excel to observe the trends of reported annual landings. The graph shows the amount of Pacific halibut caughtincreased from 17,000 metric tons to 35,000 metric tons from 1950 to 2005. The average catch during those 55 years was21,000 metric tons. On the other hand, the minimum amount caught was 7,000 metric tons in 1979, whereas the maximum amount caught was about 39,000 metric tons in 1989 – an increase of more than 30,000 metric tons, all withina period of 10 years. By examining these numbers along with the biology and ecology of this fish, it could be concluded thatPacific halibut fisheries are in no danger. They have high reproduction rates and their fisheries are constantly regulated. The International Pacific Halibut Commission reported that female halibut spawning biomass is three to four times what itwas in the mid-1970s, indicating that the Pacific halibut population is in good condition and supporting the proposedhypothesis. ���
Ericson Aguilar, Karel Ignacio and D. Evans-Bye (teacher)
3853 Clark Magnet High School 4747 New York Ave.La Crescenta, CA 91214
VNY_SciJrnl_interior 9/14/12 10:24 AM Page 141

142 Van Nuys Airport & California State University, Northridge
Impact of Commercial Fishing on Pink Shrimp Worldwide
If the current fishing practices continue, then pink shrimp populations will decrease; this hypothesis has been accepted.
The pink shrimp’s scientific name is Penaeus duorarum. The pink shrimp is caught by trawl boats. Bottom trawling destroys
their habitats and kills fish as incidental by-catch. The annual commercial landings data was provided by the National
Oceanic and Atmospheric Administration (NOAA) from the years 1963-2005 and graphed in Excel. In 1963 the catch of pink
shrimp started at 2,000 metric tons, but as a couple years went by there was a rapid increase to about 12,000 metric tons.
Ever since that increase the rates have fluctuated in a repeating pattern with the lowest being 2,000 metric tons and the
highest 14,000 metric tons. Throughout the years of 1984 to 1992 there was a major increase from 6,000 tons to 12,000
tons, and through the next years of 1992 to 1996 there was an increase from 6,000 tons to 14,000 tons. Currently, the catch
is low and has been staying between 6,000 to 8,000 metric tons for the past five years with no sign of recovery. Pink shrimp
have a fast reproductive rate, so to stabilize this fishery, it is recommended that catch limits of 500-600 metric tons are
imposed for annual landings until populations increase to sustainable levels. ���
Impact of Commercial Fishing on Albacore Populations Worldwide
If current fishing practices continue, then albacore populations will decrease. This hypothesis was supported. The scientific
name for albacore tuna is Thunnus alalunga. Annual commercial fishing landings data from the National Oceanic and
Atmospheric Administration (NOAA) were analyzed with Excel from the years 1950-2005. The results show that in the
earlier years, approximately from 1950-1978, the fishing rate of albacore tuna was high, in the average range of 30,000 met-
ric tons. During the years 1979-2005, fishing rates decreased to an average of 7,000 metric tons. During the years 1979-2005
the metric tons were unstable. They fluctuated to a low of 1,942.8 metric tons in 1989. Not until 1992 did they finally start
increasing and maintaining a normal average level of over 10,000 metric tons. There was another sharp dip for annual catch
landings in 2005, decreasing significantly under the 10,000-metric-ton mark. This might mean that the fishermen need to
cut down on the amount of albacore they collect from the oceans. I recommend for them to close down the albacore fish-
ery for a couple of years or to limit the total allowed annual landings to a maximum of 5,000 metric tons. That way we can
help lower the chance of this species becoming endangered and we can ensure a sustainable fishery for albacore tuna. ���
Shant Krikorian, Paul Karmiryan and D. Evans-Bye (teacher)
3854 Clark Magnet High School 4747 New York Ave.La Crescenta, CA 91214
Sarin Pakhdikian and D. Evans-Bye (teacher)
3855 Clark Magnet High School4747 New York Ave.La Crescenta, CA 91214
VNY_SciJrnl_interior 9/14/12 10:24 AM Page 142

143New Journal of Student Research Abstracts 2007
Alternative Energy: Solar Energy for AA Batteries
Solar energy is now used as an alternative energy. Two solar panels supply one 1.5V–3.0V DC motor each, with enough
power to spin a wheel attached to each motor. Different lamps provide different wavelengths: visible light, infrared, ultra-
violet, etc. Using four different types of lamps, halogen, natural light, soft white and bright white, the motors may or may not
run with the provided lamp. On the halogen bulb, the wheels spun almost instantaneously, with the motors getting power
from the solar panels at 3”, 9” and 12”. At 24”, one motor started instantly while the other motor took a few seconds. Again,
at 36”, one motor turned on instantly while the other took some time. With the natural lightbulb, the wheels spun
instantaneously at 3”, 9” and 12” away from the bulbs. At 24”, one motor spun well and the other did not. At 36” away from
the solar panels, neither motor turned on. On both the soft white and bright white bulbs, none of the motors worked.
The wheels never spun. ���
Impact of Fishing Practices on Atlantic Salmon Populations Worldwide
If current fishing practices continue, then the Atlantic salmon populations will decrease. The hypothesis was supported. The
Atlantic salmon is prone to predators and is a highly over-fished species. About 40% of Atlantic salmon is eaten by trout
alone. Other predators like the common seal, birds and other fish commonly eat the salmon. Annual commercial fishing
landings from the National Oceanic and Atmospheric Administration (NOAA) during the years of 1950-1990 were analyzed
with Excel. The rate of survival to this period has been estimated at around 14% and 53%. In 1953, a total of 3.4 metric tons
of Atlantic salmon were caught by the commercial fisheries. Fishing practices including drift nets, ranging in length from 25
meters to 2.5 miles, were used to catch the fish. After the few series of record yearly catches, the numbers went down
between the years 1979 and 1990; catches fell from 4 million to 700,000. Other factors including human involvement with
the environment, which includes dams, also affect the breeding and natural cycle of the fish.
A way they can bring the fish populations back up is to close off the fisheries for a little while so that the fish populations
could go back up to normal. Although Atlantic salmon remains a popular fish for human consumption, fishing practices are
changing the fish populations drastically. ���
Narineh Papazyan, Paul Karmiryan, Zore Markosyanand D. Evans-Bye (teacher)
3856 Clark Magnet High School4747 New York Ave. La Cresenta, CA 91214
Margaret Chan and A. Flagan (teacher)
3857 Ramona Convent Secondary School1701 W. Ramona Rd. Alhambra, CA 91803
Growing Crystals
My experiment’s purpose was to see if crystals could grow in different types of chemical substances. I used 13 different types
of chemicals, ranging from table salt to potassium dichromate. For over three weeks I made observations. The jars all have
different results in them. For some jars only a few have crystal formations in them, but not all. ���
Stephanie Han and A. Flagan (teacher)
3858 Ramona Convent Secondary School1701 W. Ramona Rd. Alhambra, CA 91803
VNY_SciJrnl_interior 9/14/12 10:24 AM Page 143

144 Van Nuys Airport & California State University, Northridge
Sound Waves and Frequencies in an Acoustic Guitar
The purpose of my project was to be able to get the frequencies of various sound waves in an acoustic guitar. I did this by
plucking or strumming certain frets and chords on the guitar, recording them on the audacity software, and getting the fre-
quencies through the sound waves emitted. The frequencies varied from different frets by the placement of my fingers. The
closer to the sound hole, the higher the frequencies got. The sound waves in an acoustic guitar differ by being higher as you
get to the sound hole and lower on the first frets. They also differ depending on the mass of the strings. The strings with
higher mass have a lower frequency than the strings with lower mass. By knowing this information you are able to predict
the frequencies just by the placement of your fingers. You also get a better understanding of the way a guitar works by under-
standing the sound and the variations of sounds that are possible on a guitar.
My results were obtained by testing out various frets, chords and strings in order to obtain different frequencies. Once I test-
ed them out I got the various frequencies and was able to make predictions of frequencies based on my previous observa-
tions and experimentation.
Step one was where I got the frequencies of the individual strings (at standard tune: EADGBE). They were an open note and
ranged from 140-323. The mistake in this is the sixth string, E. This frequency should have been in the 80-90s, but it was
140 Hz. The rest of the strings are pretty accurate.
In step two I got the frequencies of various frets on the individual string. Doing this allowed me to be able to predict cer-
tain frequencies in my next step. As the frets were closer to the sound hole, they increased. The frets closer to the top of the
guitar were greater than the ones closer to the sound hole.
The final step was applying all of the previous information to be able to predict the range of frequencies in the final step. I
found the various frequencies for basic guitar chords. I first found the range of where the frequencies should be, and then
I got the actual frequencies. They were all in the range of what I predicted. ���
Fooling Gravity
Over the time span of four weeks I have attempted to fool gravity by growing corn seeds in gelatin in test tubes in different
positions, environments and timing. I sanitized the corn seeds and test tubes and used tweezers to inject the seeds. Most
of the seeds, except for twelve, were directly injected in the tubes and the other twelve were run in the gel electrophoresis
for various hours. In a second experiment I grew the seeds under vacuum. These seeds were grown over a two-week peri-
od. Even with magnets and gel electrophoresis there was not any way to trick gravity; the seeds grew in the direction of the
gravitational pull. ���
Brittany Martinez and A. Flagan (teacher)
3859 Ramona Convent Secondary School1701 W. Ramona Rd.Alhambra, CA 91803
Janelle De La Fuente and A. Flagan (teacher)
3860 Ramona Convent Secondary School1701 W. Ramona Rd.Alhambra, CA 91803
VNY_SciJrnl_interior 9/14/12 10:24 AM Page 144

145New Journal of Student Research Abstracts 2007
Is Saccharin Considered a Cancer-Causing Agent?
The purpose of this experiment was to determine whether the chemical saccharin contained in the substance Sweet'N Low
can be considered a cancer-causing agent. In order to do so, two identical petri dishes were composed of stomach cells of
a mouse. One was the control, while the other received the sugar compound. It was assumed that if the dish with sugar
metabolized faster, then it maintained a cancerous characteristic and was a cancer-affected cell. The results showed that the
saccharin did produce more cells, but not as a result of increased metabolic rate. Instead, the saccharin served solely as a
food source for the existing cells. ���
The Effects of Plant Hormones on Root Cuttings
The purpose of this experiment was to see if various sections of viable root cuttings’ growth could be drastically expedited,
or instigated in some cases, with the addition of the plant hormones gibberellic acid and auxin. To do this, I cut up various
roots: potatoes, radishes and carrots; planted them in separate containers; introduced certain groups to either auxin
or gibberellic acid; and monitored the results. The results of my experiment were that only the cuttings which had any
predisposed chance of surviving grew shoots, while the other sections showed no signs of growth, although I did notice that
it took them longer to decompose than other cuttings I have observed in the past. These results prove that while auxin and
gibberellic acid are useful with certain types of horticulture, they are not successful in bringing about extreme changes in
the growth patterns of replanted root cuttings. ���
Joanna Danielak and A. Flagan (teacher)
3861 Ramona Convent Secondary School 1701 W. Ramona Rd.Alhambra, CA 91803
Caitlin Koestner and A. Flagan (teacher)
3862 Ramona Convent Secondary School 1701 W. Ramona Rd.Alhambra, CA 91803
Fruit Munchers
My experiment was a fun one. I tested if fruits would absorb carbon dioxide. I tested three types of apples: yellow, red and
green. I placed them in Plexiglas containers that I specially made. Then, I used a carbon dioxide probe that connected to the
computer and measured the amount absorbed. I measured each apple for 40 minutes, twice. I then placed the apples in
the refrigerator to see if the apples would be rejuvenated for 40 minutes again. After, I placed the apples in the freezer.
They still did not rejuvenate. After testing them, the apples rotted and I threw them away, just like the old batch of apples.
I bought a new batch of apples at the store and tested them for 15 minutes each. Next, I tested a strawberry plant, a banana,
a mango and a plum, each for 40 minutes. All fruits did not absorb a lot of carbon dioxide, but the mango absorbed
the most. ���
Sydney Acevedoand A. Flagan (teacher)
3863 Ramona Convent Secondary School 1701 W. Ramona Rd.Alhambra, CA 91803
VNY_SciJrnl_interior 9/14/12 10:24 AM Page 145

146 Van Nuys Airport & California State University, Northridge
Geology and Porosity
My class was given the simple assignment to think of a broad field of science, and to narrow that field down in a way which
allowed us to come up with an experiment. The immediate difficulty that developed was finding an experiment that was
advanced enough to be credible, and extensive enough for it to last the whole semester. The proposal which I settled upon
was based on geological study. Geology was an area of interest for me and I was convinced to study it after finding an
experiment set around testing for porosity of dirt samples. At the time I knew this sounded a bit simplistic, but I figured there
would be variations I could think to integrate, and I also figured that I would be able to get help from Mrs. Flagan. The
variation I thought to include was a change in temperature of the sample. For a single type of dirt, I had three separate
samples: one at room temperature, one in an incubator and one in a freezer. The three samples were kept in their
respective settings for approximately 24 hours before testing for porosity.
The objective of my project became to find the porosity of different samples of dirt, soil or sand that come from differing
climates, altitudes, etc. To accomplish this I used a simple process that involves water displacement/soil saturation.
The results allowed me to infer what type of climate the dirt came from, to coordinate samples that seemed to be from
similar climates, and, among other things, to see what difference (if any) a slight temperature change makes in the
porosity of a single sample of soil. One thing the results showed is that quite simply, desert sand is more porous than
mountain soil. I was also able to infer that a change in temperature (extreme heat or extreme cold) mostly affected the
samples that contained more water. ���
“A Cricket’s Life”
The purpose of this project for me was to learn something new about a certain type of insect. I was also interested in
seeing how long they would survive if I put them in an environment that is not the norm for them, and to ask myself the
questions of how they acted: In this different environment did any of them die faster than others, and did any survive longer
than others? I studied this by having 10 crickets in each container. These containers each had colored transparent paper
inside of them. Every day I would check on them to see how they were and I would record what I would see. The final results
proved my hypothesis to be correct, as the container that had the yellow transparent paper was the one with the least effect
on how long the crickets lived. While the crickets in the containers with the red and purple transparent paper started dying
within the first week, the container with the yellow paper didn’t have any dead crickets until the fourth week into the
project. In the end, all of the crickets in the other containers were dead by the fourth week and the crickets in the
container with the yellow paper survived until the fifth week. ���
Elizabeth Lara and A. Flagan (teacher)
3864 Ramona Convent Secondary School1701 W. Ramona Rd.Alhambra, CA 91803
Laura Hernandez and A. Flagan (teacher)
3865 Ramona Convent Secondary School1701 W. Ramona Rd.Alhambra, CA 91803
VNY_SciJrnl_interior 9/14/12 10:24 AM Page 146

147New Journal of Student Research Abstracts 2007
Hair Dye Damage
In this experiment, my goal was to observe and analyze the effects of coloring one’s hair too often with permanent hair dye.
I started this experiment by collecting samples of hair from different people. I made sure to ask them if they had what they
call “virgin” hair, which means it has never been permed, colored or chemically straightened. If they did, I made sure to take
note of it. I collected five different samples and put them in a container with the name of each person on it. Once I
purchased the hair dye I took it to school and dyed the samples of hair. When the samples dried I analyzed and compared
them to each other and to a sample of the person’s original hair (untainted) under a microscope. There was no difference
except for the color. Because nothing changed, I decided to dye it one more time to see if there were any changes. Again
there were no differences and because I used the same hair color, even the color stayed the same. The hair dyeing produced
no results. Because of this I came to the conclusion that someone must have to dye their hair very often to get a noticeable
amount of damage. Also, hair dye isn’t the only component that might damage the hair. Things such as straightening, blow
drying, perming, tight ponytails and over-brushing can cause damage as well. ���
Does Red Plastic Wrapping Affect the Growth of Herbs?
The purpose of my project is to see if there are any differences in growth with two groups of the same herbs, one having a
red wrapping over it and the other not. The two groups with the same three herbs include basil, thyme and parsley.
The first group is covered with a red plastic wrapping to absorb mostly red rays of light, which are the strongest. The second
group consisted of the same three herbs without the colored wrapping absorbing normal light rays. After the plants have
grown, samples from each pot will be extracted and mixed with acetone to retrieve a pigment color. The results are the red
wrapping made a slight difference within the time limit that I had working on this project. The pigment colors were darker
and the herbs grew a bit more than the normal group. ���
Letty Velazquez and A. Flagan (teacher)
3866 Ramona Convent Secondary School1701 W. Ramona Rd.Alhambra, CA 91803
Michelle Garcia and A. Flagan (teacher)
3867 Ramona Convent Secondary School1701 W. Ramona Rd.Alhambra, CA 91803
VNY_SciJrnl_interior 9/14/12 10:24 AM Page 147

148 Van Nuys Airport & California State University, Northridge
Different Factors Affect Seed Germination
The purpose of this experiment is to determine if the chemical, magnesium nitrate, is safe to use on plants (vegetables and
flowers). Using the same vegetable seeds, I placed two groups into two different environments – an outdoor group with
numerous amounts of sunlight, and an indoor group with little sunlight. Then I broke the two groups down into two small-
er groups – two groups watered with chemical water and the last two groups watered with regular tap water. For the past
two months the indoor and the outdoor plants grew to more than 2 inches but toward the end of the month of April, the
plants started to deteriorate because of the lack of water and moisture, and the dry weather. ���
Nicole Bugante and A. Flagan (teacher)
3869 Ramona Convent Secondary School1701 W. Ramona Rd.Alhambra, CA 91803
The Effects of Acid Rain on Building Materials
Acid rain is a form of pollution in which the production of sulfur dioxide and nitrogen oxides from the burning of fossil fuels,
such as coal, natural gases and oil, reacts with water and other chemicals in the air to form sulfuric acid, nitric acid and other
pollutants. This can be very harmful to our plants and even our structures and monuments.
I tested the effects of acid rain on building materials by gathering up six different types: Wood with four different sealants
and one without, and aluminum. I then took an acid rain solution (2.5 pH), put it in a bottle and let the bottle drip onto
each material. Every day I recorded the progress, but there were also days in which Mother Nature took its course and I let
natural rain fall onto the materials.
Throughout the experiment I noticed that the wood fluctuated in size from smaller to larger. This was probably due to the
fact that the water was swelling up the wood, but then as it would dry, the wood shrank. The minute it dampened, it swelled
back up.
The experiment resulted in the fact that the only change was water spots on the surface. They were not what I expected so
I decided to repeat the experiment, this time using a lower pH of 1.
In repeating the experiment I proved my hypothesis correct: That the enamel sealant proved to be the most effective in with-
standing the high pH-leveled rain. The other wood pieces secreted a jelly-like fluid, most likely due to the fact that they were
in the same container in which the aluminum was in. As for the aluminum, it began to break down and started to rust and
thin out and even erode.
In conclusion, it seems that the lower the pH, the more affected the materials are. ���
Monica Delgadoand A. Flagan (teacher)
3868 Ramona Convent Secondary School1701 W. Ramona Rd.Alhambra, CA 91803
VNY_SciJrnl_interior 9/14/12 10:24 AM Page 148

149New Journal of Student Research Abstracts 2007
Microscopic Analysis of Mushroom Spores Under a Variety of Conditions
Since February 23, 2007, I have been growing mushrooms. To begin, I put food wastes at the bottom of 11 containers.
The food wastes, in order, beginning with container number 3, were oranges, tomatoes, white bread, butter, almonds, olive
oil, Coca Cola and white sugar. Once the mushrooms grew, I viewed their spores under a microscope and then I
separately added water, salt and calcium nitrate to fresh samples so that I could microscopically analyze the similarities and
the differences in the reactions between each sample. The purpose of my experiment was to observe the effect of contam-
inants such as scraps of food on the development of organisms (in this case, mushroom spores). By doing so, I hoped to
better understand the effects that wastes have on our environment. On March 27, 2007, I noticed that container number 7
had maggots. All of my containers had growth, but the growth on container number 3 was very minimal and the growth on
container number 7 ceased after the maggots appeared. The final component of my experiment was to document the life-
span of the mushrooms by observing how long they survived. In the end, the mushrooms proved to last approximately
one month since I first saw them emerge. Also, there now seem to be new spores developing in almost all of
the containers. ���
Inhibition of Bacterial Growth By Light Wavelengths and Antibiotic Exposure
The purpose of this experiment is to test different conditions to impair or promote the growth of bacteria. Plates of
bacteria were tested with different wavelengths and a colony count was taken. The results suggested that light did not
inhibit the growth of bacteria.
Bacteria was also grown alongside another bacteria, one which produced antibiotics. The effects of the interaction of
the bacteria were observed. The results were inconclusive as the interaction between the bacteria promoted the growth
of fungi. ���
Michelle Chang, Apiradee Sanglimsuwan and A. Flagan (teacher)
3870 Ramona Convent Secondary School1701 W. Ramona Rd.Alhambra, CA 91803
Christina Pimentel and A. Flagan (teacher)
3871 Ramona Convent Secondary School1701 W. Ramona Rd.Alhambra, CA 91803
Strength in Wood
The purpose of my project was to test chemicals on pieces of wood that had been layered with four different wood
substances. I had to take the four wood samples and fit them in four different beakers. After filling each beaker with
distilled water I set each beaker on a burner to produce a liquid substance. After I had received the substance, I got four
wood slices and created a layer with each liquid. I put two coats on each wood slice. I then needed to get different chemi-
cals and test the durability. The results determined that the apple wood sample withheld the best. ���
Sonia Bustos and A. Flagan (teacher)
3872 Ramona Convent Secondary School1701 W. Ramona Rd.Alhambra, CA 91803
VNY_SciJrnl_interior 9/14/12 10:24 AM Page 149

150 Van Nuys Airport & California State University, Northridge
The Change of Eruptions
I wanted make three volcanoes, then I wanted to change one variable and see if it makes a significant difference when it
comes to the eruption. I bought plaster and thin cardboard. With these two materials I made the structure of the volcanoes.
I mixed the water with the plaster and molded each of the volcanoes. I built three 8 by 8 volcanoes. I placed a thin glass
tube in the middle of each of the volcanoes. Each of the thin tubes was half filled with baking soda. I changed the size of
hole at the top to see whether or not it would have an effect on the eruption. Then I poured two teaspoons of vinegar and
watched the eruption. I watched the eruptions and compared them to each other to see whether or not the size of the hole
made a difference and whether or not I was successful with changing a significant variable of the volcanoes. The results were
that the eruption changed slightly due to the change in pressure, so I realized that I picked an okay variable to change. ���
Soil as a Buffering Agent
This topic interested me the most because I wanted to know what caused acid rain and if soil really absorbed acid rain.
I looked through the Internet to only find enormous terms that I could not comprehend. I had to do more research than I
originally planned. When I found the sites that explained the whole procedure I was thrilled to discover that it was a hands-
on experiment. My father provided me with transportation to and from various locations so that I could obtain soil samples.
We went when it rained and when it was hot! The weather was so unpredictable and caused many delays in my
experiment. As the collection of samples grew I started preparing my materials for my first experiment. Day after day, I would
do an experiment and the results were incredible. After recording my results, I realized that I wanted a more accurate chart.
I used the probe device that calculated the results that are now displayed. To find out whether or not soil can be used as a
buffering agent we compare and contrast pH levels in soil. My goal was to inform myself and my community about our
delicate environment and what’s going on beneath our feet. ���
Vanessa Bond and A. Flagan (teacher)
3873 Ramona Convent Secondary School1701 W. Ramona Rd.Alhambra, CA 91803
Megan Rodriguez and A. Flagan (teacher)
3874 Ramona Convent Secondary School1701 W. Ramona Rd.Alhambra, CA 91803
How Do Ozone Gases Affect the Growth of Strawberry Plants?
For this project I built a greenhouse out of PVC pipe and painters plastic (heavy-duty plastic), and bought strawberry plants.
I placed them in the greenhouse and subjected them to various amounts of ozone gases using an ozone machine. I took
another set of plants, placed them in a heavy plastic container, cut a hole in the container, and placed the container next to
the car exhaust of a 2000 Mazda Millenia. I let the car run for 30-90 minutes every other day for a week before running the
car for 30 minutes every day for a week, killing the strawberry plants. The effects on the strawberry plants were varied. The
plants that had been exposed to various amounts of ozone gases showed some signs of spotting and dead leaves, and the
strawberries were much smaller than normal. The plants that were exposed to car exhaust fumes were dead within two
weeks of first being introduced to the exhaust. The strawberry plants that were exposed to the car exhaust fumes showed
signs of dying, leaves quickly wilted, brown spots began to appear and leaves that did grow were significantly smaller than
all other leaves. Ozone gases and car exhaust do have a significant effect on plants. The ozone gases and car exhaust
quickly destroy or cause the plants to become underdeveloped. Ozone gas effects were not as quick to show as those plants
exposed to car exhaust. ���
Jennifer Flores and A. Flagan (teacher)
3875 Ramona Convent Secondary School1701 W. Ramona Rd.Alhambra, CA 91803
VNY_SciJrnl_interior 9/14/12 10:24 AM Page 150

151New Journal of Student Research Abstracts 2007
Effects of Water Limitations on Plant Growth
The purpose of this experiment was to determine how well pea plants would grow given a limited amount of water. Four
pairs of plants were used. In each pair, one cup had a hole to allow water to drain out and the other did not. One addition-
al plant in a cup with no drainage hole was given no water. Two germinating peas were planted in each cup to ensure that
results could be obtained under each condition. Initially, all germinating peas were given 40 mL of water to begin growing.
The plants were kept under the same conditions of temperature (25° C) and light intensity. After one week from the initial
watering, each of the four pairs of plants was given a different amount of water – 30 mL, 60 mL, 90 mL or 120 mL. One
month from the start of the experiment, the plant that was not watered died. The plants given 30 mL of water and kept in
the cup with holes died. The plants kept in the cup with no holes given 30 mL of water wilted. Both plants given 60 mL of
water wilted, but the plants in the cup with no holes were not completely withered. The plants given 90 mL of water and
kept in the cup with holes wilted. The plants kept in the cup with no holes given 90 mL of water were alive and healthy.
Both plants given 120 mL of water and kept in the cup with holes were slightly limp, but alive. ���
The Dehydrating Factor
This experiment was conducted in order to study the effects of differing salt concentrations on germinating pea seeds.
At first, the germinating pea seeds were planted in cups with equal amounts of topsoil. Each cup was designated a specific
amount of salt: 1.0 g, 1.5 g, 2.0 g and 2.5 g. The salt was mixed with 100 ml of water and then given to the plants every
four days. There was also a control that was not exposed to salt. It was used as a marker to compare growth among the
other experimental peas. The peas that contained salt in their soil experienced no growth. The only growth occurred in the
control cup with a total measurement of 16 inches. This proves that salt impedes growth in germinating seeds. ���
Austyn Gabig, Annemarie Mak, Leslie Pierce and L. Durbin (teacher)
3876 Ramona Convent Secondary School1701 W. Ramona Rd.Alhambra, CA 91803
Gloria Feng, Rebeka Hernandez, Alyssa Kitaguchi, Gabriela Moriel and L. Durbin (teacher)
3877 Ramona Convent Secondary School1701 W. Ramona Rd.Alhambra, CA 91803
iPlant
The purpose of this experiment was to test the effects of various music genres on the growth of plants. The experiment was
conducted by setting up five different environments and one control. The five environments were the following: techno,
classical, rock, rap and alternative. The control plant was not exposed to any music throughout the duration of the
experiment. The remaining five plants were exposed to their respective music genres for an hour each day any time during
the hours of 8 p.m.-11 p.m. The pea seeds were implanted in soil that filled Styrofoam cups to the same capacity. Each cup
was approximately three-fourths full. Each plant received 40 mL of water each day. The plants were placed in the kitchen
windows in order to receive a sufficient amount of sunlight without overexposure. This was done also to prevent exposure
of the plants to any harsh weather conditions such as rain or wind. The results were that the plants that were exposed to
harsher sounds grew quicker than the plants that were exposed to softer music or no sound. The plants that were exposed
to rap, rock and alternative grew faster than the plants exposed to silence, classical and techno. ���
Melissa Gutierrez, Neresa De Biasi, Victoria Linand L. Durbin (teacher)
3878 Ramona Convent Secondary School1701 W. Ramona Rd.Alhambra, CA 91803
VNY_SciJrnl_interior 9/14/12 10:24 AM Page 151

152 Van Nuys Airport & California State University, Northridge
The Effects of Various Factors on Plant Growth
The purpose of our experiment was to determine the effects of glucose, 7UP, hydrogen peroxide (H2O2) and bleach on the
growth of plants. We planted three germinating peas in seven separate cups and added glucose, H2O, 7UP, bleach and H2O2
in different combinations to each cup every five days, for a period of one month. We kept one cup as a control, by only
adding water, without any other variable. We measured the overall growth at the end of the experiment to determine the
effects each combination of variables had on the plants. General trends showed that plants exposed to glucose and 7UP
grew quickly in the first few days of the experiment. Bleach seemed to negatively affect plant growth, while H2O2 did not
have much of an effect on the plant. Our control showed the most plant growth overall. ���
Plant Hormones
Plant hormones play a vital role in plant growth. We decided to visualize and determine the effects that various hormones
have on week-old pea plants. In this experiment we watered week-old pea plants with a gibberellic acid concentration, a
kinetin concentration, an indole-3-acetic acid concentration and a coconut water concentration. We watered each of the
plants with their corresponding solutions on days 6 and 10. Overall, due to neglect, our plants died and experienced no dif-
ferences. However, on a cellular level we did find intriguing results. The plants exposed to the auxin concentration had dra-
matically elongated cells. Those exposed to coconut water had larger, swollen cells. Plants exposed to gibberellic acid and
kinetin both had similar physical traits as the cells contained in the control plant, although the plant exposed to the kinetin
concentration had a slightly thicker stem, which may indicate accelerated cell division. Through this research we found that
hormones play an integral part in plant development. ���
Joanna Barnheiser, Josephine Huang, Shruthi Murali, Jacqueline To and L. Durbin (teacher)
3879 Ramona Convent Secondary School1701 W. Ramona Rd.Alhambra, CA 91803
Jessica Ochoa, Caitlin Koestner and L. Durbin (teacher)
3880 Ramona Convent Secondary School1701 W. Ramona Rd.Alhambra, CA 91803
Photo-Stimulation of Auxin in Pea Plants
We will examine the phototropic effect of auxin on plant elongation by exposing plants to light sources placed at different
angles. We begin by planting germinated pea seeds in individual cups and watering them at specific intervals. After shoots
appear, we place each cup near separate light sources that are positioned at 30°, 60°, 90°, 150° or 180°. We then monitor
the growth and direction of growth in each plant regularly, and record our results. Our results are inconclusive since the
plants died before we could acquire sufficient data. ���
Laura Ann Belisario, Nicole Gargano, Mira Mehta, Chandani Shukla, Amanda Spoto, Ashley Toh, Vanessa Vazquez and L. Durbin (teacher)
3881 Ramona Convent Secondary School1701 W. Ramona Rd.Alhambra, CA 91803
VNY_SciJrnl_interior 9/14/12 10:24 AM Page 152

153New Journal of Student Research Abstracts 2007
Colored vs. Black
The purpose of my project was to test whether a student could memorize a list of words that were colored faster than words
written in black. I made a list of 20 words: 10 words in black and the other 10 words colored. I tested two groups of
8th-graders without informing them of what my intention was. I gave them 5 minutes to memorize the list of colored words
and 5 minutes to memorize the colored words. My results showed that the colored words were easier to memorize. ���
A Springing Spring
The purpose of my project is to investigate the passing of electric current through a copper wire. I twisted a thin wire around
a pencil to form a coil. I carefully pushed the thick copper wire through the Styrofoam ball. I taped the other end of the
pencil to a stack of books. I gently pulled the coil so that it formed a spring. I attached the opposite end of one of the wires
to the thick copper wire. I prepared saltwater solution and dipped the wire into the solution. I found out that a 9-volt
battery sends more vibrations through the wire than a 6-volt battery because of its stronger voltage. ���
Aria Hangval and M. Kazanjian (teacher)
3882 Columbus Magnet Middle School22250 Elkwood St.Canoga Park, CA 91304
Allison Hamoy and M. Kazanjian (teacher)
3883 Columbus Magnet Middle School22250 Elkwood St.Canoga Park, CA 91304
Photosynthesis in Plants
The purpose of my experiment was to determine under what conditions photosynthesis occurs best. I took six sets of
yellow pepper plants and put all of them in sunlight. I watered three of the plants regularly with equal amounts of water. I
added effervescent tablets to the other three plants while watering them with the same amount of water as the first three
plants. After 48 hours, I extracted the chlorophyll from the leaves of the plants to test them for the presence of food. Based
on my observation, I found out that the plants watered with effervescent tablets contained more food due to the fact that
effervescent tablets released carbon dioxide gas, which is an important component of photosynthesis. ���
Crystal Avarez and M. Kazanjian (teacher)
3884 Columbus Magnet Middle School22250 Elkwood St.Canoga Park, CA 91304
Eggs’n Baking
The purpose of my project is what effect do eggs have on baking cakes? I baked a cake with eggs and another without eggs
and recorded my observation. I repeated the process two more times and recorded my observation. After comparing the
cakes with eggs to the ones without eggs, I concluded that eggs help the dough parts bind together because the ones baked
with no eggs were dry and they crumpled and fell apart. ���
Taylor Millman and M. Kazanjian (teacher)
3885 Columbus Magnet Middle School22250 Elkwood St.Canoga Park, CA 91304
VNY_SciJrnl_interior 9/14/12 10:24 AM Page 153

154 Van Nuys Airport & California State University, Northridge
What Kind of Stress Affects Teenagers the Most?
The purpose of our project was to find out what type of stress affects teenagers the most. We prepared a questionnaire and
surveyed 99 middle school students, 33 from each grade level. We recorded and graphed the survey results. We found out
that the number one stressor was schoolwork (tests, quizzes, homework and projects) followed by home environment
(arguments, problems, chores and siblings). The third stress factor was peer pressure and the fourth and the least stress
factor was violence (experienced/witnessed). ���
Constructing a Rocket
The purpose of my project was to show that the greater the volume of the balloon, the farther the balloon travels. I had a
straw pushed through a 50-ft-long fishing line. I taped a balloon to the straw, inflated it until its circumference was 10 in,
and released it. I measured the distance the balloon traveled. I repeated this step two more times for accuracy. Then I
inflated the balloon until its circumference was 20 in and released it. I measured the distance traveled and tried it two more
times. I averaged the three trials for each step and compared the results. I found out that the greater the volume of air
released from the balloon, the farther the balloon travels. My experiment proved Newton’s third law of motion. ���
Marielle Bunye, Sonia Orellano and M. Kazanjian (teacher)
3886 Columbus Magnet Middle School22250 Elkwood St.Canoga Park, CA 91304
Evelyn Ruvalcaba and M. Kazanjian (teacher)
3887 Columbus Magnet Middle School22250 Elkwood St.Canoga Park, CA 91304
Viscosity in Action
The purpose of my project was to compare the viscosity of different liquids. For my project, I used water, honey, vegetable
oil, milk and maple syrup. I took a rectangular cardboard, covered it with wax paper, and marked two lines, 20 cm apart,
labeling them as START and FINISH. I added a drop of each of the liquids at the START mark, one liquid at a time, and meas-
ured the time it took for the liquid to reach the FINISH line. I repeated the process two more times for each liquid and aver-
aged the three trials. I found out that honey was the most viscous liquid and water was the least. ���
Valeria Perez and M. Kazanjian (teacher)
3888 Columbus Magnet Middle School22250 Elkwood St.Canoga Park, CA 91304
An Icy Issue
The purpose of our project is to determine the effect of salt on the freezing point of water. We took six cups containing 50
ml of water each. We dissolved 10 g of salt in three cups and placed all six cups in the freezer. We measured the time it took
for each of the cups to freeze by observing them every 5 minutes. We found out that the cups containing water only froze
faster than the ones with saltwater. We concluded that adding salt lowers the freezing point of water. ���
Anna Golombek, Maddison McDonald and M. Kazanjian (teacher)
3889 Columbus Magnet Middle School22250 Elkwood St.Canoga Park, CA 91304
VNY_SciJrnl_interior 9/14/12 10:24 AM Page 154

155New Journal of Student Research Abstracts 2007
The Greenhouse Effect
Did you know that the Earth is undergoing global warming? Many factors are contributing to global warming, such as burn-
ing fuels that release gases into the atmosphere. These gases trap sunlight, causing a greenhouse effect. The purpose of my
project is to see how the atmosphere traps sunlight. I took six jars and filled each of them with two cups of cold water and
five pieces of ice cubes. I covered three of the jars with clear plastic wrap and placed all of the six jars under a lamp. I meas-
ured the temperature of each of the jars every hour for four hours. My results showed that the jars covered with a plastic
bag had higher temperatures than the uncovered ones. ���
Inclined to Roll
The purpose of our project is to study the effect of the steepness of a ramp on the speed of an object. For our experiment,
we used a flat board 1.5 m long. We marked a starting line on the board and a finish line on the floor 2 m away from the
start line. We placed two books under the start end of the board to create an inclined plane. We placed a toy car at the start
mark and released the car while measuring the time it took for the car to reach the finish line. We tried this step two more
times and recorded our results. We repeated the same procedure after increasing the steepness of the ramp by adding two
more books every time for two more times. After tabulating and graphing our results, we found out that the greater the
steepness of the ramp, the greater the speed of the toy car. ���
Smarica Poudyal, Stephanie Vega and M. Kazanjian (teacher)
3890 Columbus Magnet Middle School22250 Elkwood St.Canoga Park, CA 91304
Vivian Doan and M. Kazanjian (teacher)
3891 Columbus Magnet Middle School22250 Elkwood St.Canoga Park, CA 91304
The Life of a Bubble
The purpose of my project was to find out if bubbles last longer in cold and clear atmospheric condition than hot and humid
atmospheric condition. On a cold and clear day, I blew bubbles and timed them using a stopwatch. I timed three trials of
bubbles with bubble additives: 1/4 teaspoon vanilla extract, 1/4 teaspoon aftershave lotion and 3 drops of food coloring. Then
I timed three trials of bubbles with bubble additives half the amount of the first test. Finally, I timed three trials of bubbles
containing no additives. All three parts of the procedure were conducted on a hot, humid day. After comparing my results,
I found out that bubbles last longer on a hot and humid day. ���
Jennifer Um and M. Kazanjian (teacher)
3892 Columbus Magnet Middle School22250 Elkwood St.Canoga Park, CA 91304
Cheaper Batteries: Money-Saver or Rip-Off?
All the people in the world use batteries for daily life. They use them for video games, iPods, clocks, cell phones, etc. Some
battery brands are more expensive than others. The purpose of my experiment is to test the longevity of different brands of
batteries and see if their durability justifies their prices. I tested four different brands of batteries: Eveready, Sony, Panasonic
and Varta. I used a CD player that uses a single AA battery. I tested each brand twice and averaged my results. I found out
that the Panasonic brand battery, the most expensive one, lasted the longest. ���
Carmelli Cadiz and M. Kazanjian (teacher)
3893 Columbus Magnet Middle School22250 Elkwood St.Canoga Park, CA 91304
VNY_SciJrnl_interior 9/14/12 10:24 AM Page 155

156 Van Nuys Airport & California State University, Northridge
Which Yeast Mixture Grew Most
The purpose of my project was to find out which brand of yeast grows most. I took four large bowls and filled each of them
with four cups of lukewarm water. I added half a cup of sugar to each bowl. After dissolving the sugar, I added 1 teaspoon
of Fleischmann’s Yeast to the first two bowls, and then added 1 teaspoon of Red Star Yeast to the other two bowls.
I observed the growth of the yeast after 30 minutes and found out that the Fleischmann’s Yeast grew more than the Red
Star Yeast. ���
How Many Books Can an Eggshell Support?
The purpose of my project is to see how much weight an eggshell can support. I emptied the contents of four eggshells
and cut them in half. I then placed them at the four corners of a square shape. I started placing books slowly and adding
one book at a time until one of the eggshells broke. I found out that the eggshells could hold up to six books without
breaking. ���
Anila Ismail and M. Kazanjian (teacher)
3894 Columbus Magnet Middle School22250 Elkwood St.Canoga Park, CA 91304
Miriam Valenzuela and M. Kazanjian (teacher)
3895 Columbus Magnet Middle School22250 Elkwood St.Canoga Park, CA 91304
Hydroponics vs. Soil
Hydroponics has been around for nearly 200 years! But what is “Hydroponics”? It is crop production with mineral nutrient
solutions instead of soil. The purpose of my experiment was to determine which method helps plants grow faster. I
planted six primrose seeds, three of them in soil and the other three hydroponically. I found out that the hydroponic method
helped leaves grow faster and the flowers bloom faster. ���
Anna Raskind and M. Kazanjian (teacher)
3896 Columbus Magnet Middle School22250 Elkwood St.Canoga Park, CA 91304
Desalinization on Ice
The world is on the verge of facing a fresh water shortage. The purpose of my science project is to test if the freezing method
is an effective way of separating salt from water. I measured the salt concentration of 1 cup of saltwater and let it freeze.
I thawed the frozen saltwater and measured its salinity. Every time I repeated the process of freezing and melting, I noticed
that the solution’s specific gravity decreased. After three trials, I found out that the freezing method is effective in
desalinating saltwater. However, the process involved several times of freezing and thawing until the salinity decreased to
harmless levels. ���
Daniel Hoisch and M. Kazanjian (teacher)
3897 Columbus Magnet Middle School22250 Elkwood St.Canoga Park, CA 91304
VNY_SciJrnl_interior 9/14/12 10:24 AM Page 156

157New Journal of Student Research Abstracts 2007
Effect of Saltwater on Plants
In order to grow, plants need food and water. Water is essential for life and plays an important role in the process of
photosynthesis. Plants are an important food source. The purpose of this project is to find out if saltwater can be used when
the Earth runs out of fresh water. I planted radish seeds in six identical containers containing the same amount of potting
soil. I divided the plants into two groups, three plants per group. I watered group A plants with regular water every day and
watered group B plants with saltwater. After two weeks of observing the plants, I found out that saltwater killed the plants
because the plants lost their water instead of absorbing it. ���
Soapy Growth
The purpose of our project was to find out how detergents affect the growth of plants. We used six English primrose plants.
We kept the plants under the same conditions of light and temperature. We separated the plants into two groups of three
plants each. One group was watered daily with the same amount of tap water and the other group was watered daily with
the same amount of tap water with some detergent added to it. We observed the two groups of plants for two weeks. We
found out that the group #1 plants were healthy, while the group #2 plants that had detergent added to the water with-
ered and died. This happened because the detergent dissolved the cell membranes of the roots. This experiment showed
us how changes in the environment can affect plant growth. ���
Nicole Lim, Thanida Pattana and M. Kazanjian (teacher)
3898 Columbus Magnet Middle School22250 Elkwood St.Canoga Park, CA 91304
Janine Leano and M. Kazanjian (teacher)
3899 Columbus Magnet Middle School22250 Elkwood St.Canoga Park, CA 91304
Tasting Colors
The purpose of our project is to prove that taste partially involves eyesight. In order to test our hypothesis, we filled two con-
tainers with carbonated water and dissolved a tablespoon of sugar in each. We then added two drops of food coloring to
one of the containers. We asked 40 classmates to taste a sample of each of the solutions and recorded their responses. We
found out that 80% of the students preferred the red solution. ���
Alex Sanchez, Joseph Hwang and M. Kazanjian (teacher)
3900 Columbus Magnet Middle School22250 Elkwood St.Canoga Park, CA 91304
VNY_SciJrnl_interior 9/14/12 10:24 AM Page 157

158 Van Nuys Airport & California State University, Northridge
An Innovative Method of Measuring Respiration Rates ofGerminating Seeds
It is known that germinating seeds require a high amount of energy, which is reflected in an increased rate of cellular
respiration. In this experiment, I wanted to test a simple innovative method to measure the respiration rate of dormant and
germinating seeds. Four kinds of germinating seeds were used to measure respiration rates: cucumber seeds, pea seeds,
pumpkin seeds and squash seeds. All four seeds were chosen because they all had fast germination rates. A dormant
version of each seed was used as the control. Two seeds of each kind were placed into a pipette containing a cotton ball
with 1% NaOH solution. The pipettes were placed over petri dishes filled with water. When the germinating seeds respire,
they produce carbon dioxide. Carbon dioxide is trapped with NaOH, resulting in water moving up the pipette.
The movement of water up the pipette was recorded in centimeters, giving an idea of the amount of respiration going on
amongst the seeds. Using the method described above, 10 pipettes containing germinating seeds and 10 pipettes
containing the control dormant seeds were set up for each seed type tested. Therefore, for each seed type tested 80 pipettes
(40 of which served as the control) were used. The experiment was then repeated twice. Our results showed a significant
difference in the respiration rate in the germinating seeds as compared to the corresponding dormant seeds. At the end of
a 12-hour period the average rise of water in the pipettes in the experimental group containing the germinating seeds was
pumpkin (3.2 cm), pea (2.9 cm), squash (2.6 cm) and cucumber (2.2 cm), respectively, vs. 0.5 cm in the corresponding
dormant seed. This data was further supported using Carbon Dioxide Probes to measure the level of carbon dioxide
produced in a chamber containing each of the four types of seeds. Germinating pumpkin seeds produced the highest
amount of carbon dioxide (1,912 ppm), followed by pea seeds (1,586 ppm), squash seeds (1,219 ppm) and cucumber
seeds (863 ppm), respectively. Here too the germinating seeds had an increased respiration rate when compared to the dor-
mant seeds. The results show that this simple innovative method can be used to measure the respiration rate in seeds. This
inexpensive and innovative method could be very useful for agriculturalists. It would help them to determine whether a seed
is dormant or dead without the use of expensive equipment. ���
Shadman Chowdhury and N. Pal (teacher)
3901 Arcadia High School189 Campus Dr.Arcadia, CA 91007
VNY_SciJrnl_interior 9/14/12 10:24 AM Page 158

159New Journal of Student Research Abstracts 2007
How Much Vitamin C Is Really in Our Juices?
Some common fruit juices were measured for Vitamin C content. The method of analysis is known as the titration.
This titration uses the number of drops of iodine to qualify the number of milligrams (mg) of Vitamin C in each of the
samples. First a Vitamin C pill was used to obtain a standard quantity of Vitamin C. A 1,000-mg Vitamin C pill (1.50 grams)
was chopped into small pieces and weighed. Using a 0.1-gram (65-mg) Vitamin C piece, it was determined that 35 drops
of iodine were required to titrate it. This gives a reference to be used for all the juice samples. Equal amounts (30 mL) of
each juice were mixed with a 5% starch solution. Each was then titrated using drops of iodine to compare with the
reference. The results show a wide range of Vitamin C in each of the different juice samples. Nutritional facts labels are either
estimates or inaccurately reported. There does appear to be an ample quantity of Vitamin C in the fruit juices to meet the
recommended daily value. ���
Biomechanical Analysis of Human and Porcine Eyewall Tissue
The purpose of our research is to investigate the viscoelastic properties of human and porcine eyewall tissue. Biological
tissue is characterized by a short elastic phase followed by a protracted plastic phase, which is distinguished by irreversible
deformation. Types of tissue used were the choroid, sclera and retina belonging to Sus domesticus (domestic pig) and
human. We used the posterior pole of human eyes (average age 76 years) obtained from an eye bank, and porcine eyes
(6 months) obtained from an abattoir. Each eye was used a multiple number of times as avowed in the lab’s protocol of
reuse, reduce and recycle. Porcine and human choroid, sclera and retina were analyzed using dynamic mechanical analysis.
Upon receiving the porcine eyes from the abattoir, they were stored at 4° C for 6 hours prior to testing. After receiving the
human eyes from the eye bank, they were stored at 4° C for 36 hours prior to testing. In pigs, specimens from the
equatorial, limbal, posterior poles of the choroid, sclera and retina – in humans, the posterior poles of the choroid, sclera
and retina were collected using a custom razor tool. Specimens were cut 2 mm wide by 8 mm long, and their thickness was
measured microscopically (Olympus microscope) by the change in focus between nanospherules placed on the inner and
outer surfaces. Each specimen was placed 2 mm apart using the Dynamic Mechanical Analysis machine - Bose ELF3100 and
stretched at a constant rate of .5 mm/s for 4 s to 100% strain. Trials were held with load and displacement control using a
high-resolution control configuration for choroid and retina. Stress-strain relationship of human and porcine eyewall tissue
was nonlinear, and the elastic modulus varied as a function of strain. Porcine and human eyewall tissue was characterized
as having a short phase of elasticity and an expansive phase of plastic deformation. A correction factor will be used to
account for the disparities in the strengths of human and porcine eyewall tissue. The experimental data will allow
researchers to construct a finite element model of the eye and improve limitations of human ophthalmic treatments. ���
Arsen Beremesh, A. Rowley*, B. Basinger*, J.D. Weiland* and J.D. Cocozza (teacher)
3902 Francisco Bravo Medical Magnet High School1200 N. Cornwell St.Los Angeles, CA 90033
Karmina Padgett and D. Shah (teacher)
3903 Portola Magnet Center18720 Linnet St. Tarzana, CA 91356
*Doheny Eye InstituteKeck School of MedicineUniversity of Southern California1450 San Pablo St. Los Angeles, CA 90033
VNY_SciJrnl_interior 9/14/12 10:24 AM Page 159

160 Van Nuys Airport & California State University, Northridge
Effects of Hummingbird Feeder Color on Feeder Preference
This experiment examined the question: What color feeder do hummingbirds prefer? The feeders were red, blue, green,
yellow and white. The feeders were filled up to approximately 17 cm with hummingbird food, measured, refilled and
recalibrated. The feeders were positioned in one of five locations for approximately four days, measured, recorded and
rehung in a different location. This was repeated five times with each feeder in a different location. The food was prepared
with 2 liters of water and one 1/2 liter of sugar. The results of the experiment showed that the blue feeder was the favorite
color because the feeder had the largest total amount of hummingbird food consumed (as measured by the total decrease
in hummingbird food), 6.3 cm. The red had a total of 5.8 cm of hummingbird food consumed, the green feeder had a total
of 4.55 cm of hummingbird food consumed, the yellow had a total of 4.25 cm and the white had a total of 3.95 cm. ���
What Battery Lasts Longer, Duracell or Kirkland?
The objective in this project was to see whether Kirkland or Duracell would last longer. The method for this was pretty
simple. You placed a set of batteries in an electronic, let it run, timed it and recorded the data. The result was that Kirkland
lasted longer than Duracell in both tests. The conclusion of this is that Kirkland batteries lasted longer than Duracell in these
two tests and most likely many others. ���
Camille Saucier and D. Shah (teacher)
3904 Portola Magnet Center18720 Linnet St.Tarzana, CA 91356
Alex Abravanel and D. Shah (teacher)
3905 Portola Magnet Center18720 Linnet St.Tarzana, CA 91356
Difference Between Generic and Supermarket Brands of Food
This study examined the question of taste difference in generic foods vs. supermarket brands. All subjects were tested three
times. They were given a choice of generic or supermarket with each food. Each was given 1 tbsp of each product. The results
were even and most people could taste the difference. Whipped cream was the only product for which people could not
taste the difference. There is no point in paying more money for whipped cream. ���
Daniella Piyavanich and D. Shah (teacher)
3906 Portola Magnet Center18720 Linnet St.Tarzana, CA 91356
Effects of Different Types of Variables on Marshmallow Peeps and Haribo Gold-Bears
This study put two types of candies against various conditions. Marshmallow Peeps and Haribo Gold-Bears were exposed to
various conditions such as fire, water and Coke. When they were left in Coke overnight, the bears swelled and the Peeps
turned brown. When heated in the microwave, the bears melted and the Peeps expanded and developed a tear. When left
in the freezer overnight, both became hard and stiff. When dropped in boiling water, they both dissolved. When left in water
overnight, the bears swelled and the Peeps turned the water yellow. When burned, the bears melted and then burned, while
the Peeps burned. The Peeps only stretched a little when pulled, but the bears stretched three times their original length.
These show the various reactions these candies have to different variables. ���
Christine Choi and D. Shah (teacher)
3907 Portola Magnet Center18720 Linnet St.Tarzana, CA 91356
VNY_SciJrnl_interior 9/14/12 10:24 AM Page 160

161New Journal of Student Research Abstracts 2007
Effect of Height on Lung Capacity
This study examined the question of possible height involvement in the size of a typical middle school student’s lung
capacity. Various size subjects were gathered and asked to blow into a bottle of approximately 3 liters of water. The air that
the subject would blow in would displace much of the water within the bottle. The amount of water left within the bottle
would then be subtracted from the amount of water in the bottle before to provide the subject’s lung capacity. Each subject
was then measured and their height was recorded, along with their lung capacity. To ensure that the results were accurate,
an equation formulated to find one’s vital lung capacity was used: 0.014 (height in cm) – 0.018 (age) – 2.69 = Vital Lung
Capacity in Liters of Air. One example of the experiment also shows that a 167.64 cm tall 11-year-old displaces
approximately 1.5 L more than her 137.26 cm tall equal. Comparing the results of all the subjects’ lung capacity and height,
along with the results of the equation, it appears as though height plays a significant role in a middle school student’s lung
capacity and that taller people will have a greater lung capacity than shorter people because of this. ���
Effect of Music on Blood Pressure
This experiment involved the effect of music on blood pressure. Patients’ blood pressure was measured by machine and
recorded. Patients had listened to two different types of music, both at the same volume. Patients’ blood pressure was
tested again and steps were repeated twice more. Results showed that most people’s blood pressure rose when listening
to rock and lowered when listening to rap. ���
Joshua Lee and D. Shah (teacher)
3908 Portola Magnet Center18720 Linnet St.Tarzana, CA 91356
Tiffany Kim and D. Shah (teacher)
3909 Portola Magnet Center18720 Linnet St.Tarzana, CA 91356
Gravity’s Effect on Human Height
The goal of this experiment was to test what would happen to the human spine if the vertebrae were put in an anti-gravi-
ty place. This, of course, could not be tested using a real human’s spine. So, to make the spine, four spools were used to
represent the spine. The spools were then put on top of one another into a 2-liter bottle. The 2-liter bottle was filled with
water to make the spools float lightly. The spaces between the spools were 0.5 cm. In all 12 tests, the average heights were
gathered. The level of spools in water was 17 cm. The level of spools without water was 15 cm. The level of water was 13.5
cm. In the end, the hypothesis was proven correct; the spine stretches without gravity. ���
Allison Li and D. Shah (teacher)
3910 Portola Magnet Center18720 Linnet St.Tarzana, CA 91356
VNY_SciJrnl_interior 9/14/12 10:24 AM Page 161

162 Van Nuys Airport & California State University, Northridge
Measurement of Gravity By Applying Newton’s Laws of Motion to Moving Objects
This study performed a simple experiment to determine the magnitude of the Earth’s gravitational acceleration. The motions
of a basketball, a tennis ball and a marble along a slightly tilted table were observed and the time of travel over a specific
distance was recorded. The effect of friction along the surface of the table was calibrated out by rolling the objects both
downward and upward. This approach invokes only a small fraction of the gravity, resulting in a relatively longer time of
travel and better accuracy than that of a free-falling object at comparable distance. By applying Newton’s Laws of Motion to
the data, the averaged gravitational acceleration was calculated to be 9.43 m/s2, in fairly good agreement (3.8% error) with
the true vale of 9.8 m/s2. ���
Effects of Sunlight on Biodegradation of Fruit
This experiment answered the question if sunlight has any effect on the biodegrading of fruit over 5 days. In this experiment
3 types of fruit were left in either shade or sunlight, cut in half for 5 days and data was recorded. Each experiment
was repeated a total of 3 times. After 5 days the fruit in the sunlight had shown more damage from rotting and
biodegradation than the ones left in the shade. The results of the experiment show that sunlight has an effect on the
biodegradation of fruit. ���
Andrew Ho and D. Shah (teacher)
3911 Portola Magnet Center18720 Linnet St.Tarzana, CA 91356
Michael Schwinger and D. Shah (teacher)
3912 Portola Magnet Center18720 Linnet St.Tarzana, CA 91356
The Effects of Music When Doing Math ProblemsThis science project was about music and how it helps with doing math if it helps at all. A math worksheet was made
and was distributed to a certain amount of people to do. Half of the people listened to the music of their choice and the
other half were not listening to anything at all. Thirteen people didn’t listen to music and 15 people did. Five listened to rock,
five listened to slow and five listened to rap. No music got 15.77/30. Rock got 15.40/30. Rap got 15.40/30. Slow got
13.40/30. Music got a total average of 14.73. According to this experiment, when you are not listening to music while doing
math, you will do a little better than when you are doing math with music. But smartness, most likely, plays a big role in
how well you do. ���
Nicholas Chaiand D. Shah (teacher)
3913 Portola Magnet Center18720 Linnet St.Tarzana, CA 91356
Video Game PressureThis experiment examined the question: Does playing video games affect blood pressure and pulse rate? The objective of
this project was to determine whether pulse rates and blood pressure rates increase when participants play the video game
“Star Wars Battlefront.” Each participant’s blood pressure and pulse rate were measured twice, three minutes apart, as a con-
trol. This was first done in a room away from where the game was played. Then, the participant was taken to another room
to play the video game “Star Wars Battlefront.” Each participant’s blood pressure and pulse rate were measured twice, three
minutes apart, while playing the game. The average of the data showed that the pulse rates increased when the participants
played the game, but the results of the blood pressure rates were inconclusive. Some of the blood pressure rates increased
with the participants, and some even decreased. The results of this project demonstrate that people should limit playing the
video game “Star Wars Battlefront” because it can cause pulse rates to increase. ���
Jason Peretz and D. Shah (teacher)
3914 Portola Magnet Center18720 Linnet St.Tarzana, CA 91356
VNY_SciJrnl_interior 9/14/12 10:24 AM Page 162

163New Journal of Student Research Abstracts 2007
Different Melting Points of Cheeses
This experiment examined the different melting points of several cheeses. The cheeses used were Monterey Jack, Cheddar,
Swiss and American. The cheeses were placed each on two different pans, American and Swiss on one, and Monterey Jack
and Cheddar on another. They were heated at high heat at the exact same time and monitored with a stopwatch to count
the time it took to melt. A cheese was classified as melting after the whole cheese was bubbling. The experiment was
repeated three times for accurate information. I have concluded after the experiment that Monterey Jack melted the fastest,
then Cheddar, then American. I found that it took the Swiss cheese longer than 2 minutes 45 seconds to melt, so I
classified it as “inconclusive results.” ���
The Effects of Liquids to Create Rust on Metal
This study is to show which liquids rust a nickel faster. Nickels were placed in labeled see-through plastic cups. The liquids
water, saltwater, vinegar, Sprite and hydrogen peroxide were then poured into their respective cups. The experiment was
over a 25-day period of observation. Water tarnished the nickels. Saltwater had crystallized salt left in the cup and had an
average of 76.7% of rust. Vinegar dissolved a little bit of the nickels and left little black dots when evaporated, with an
average of 26.7% of rust. Sprite when evaporated left a small amount of gooey (sugar) liquid. Hydrogen peroxide had an
average of 81.7% of rust. Hydrogen peroxide was made up of one more atom of oxygen than water and the other elements
that were in the saltwater, vinegar and Sprite. The result shows that oxygen is the most essential element needed for rust
to form and also shows that if there is more contact with oxygen the speed of the process of rust is increased. ���
Darren Yin and D. Shah (teacher)
3915 Portola Magnet Center18720 Linnet St.Tarzana, CA 91356
Dillon Dejam and D. Shah (teacher)
3916 Portola Magnet Center18720 Linnet St.Tarzana, CA 91356
What Types of Beans Will Germinate the Fastest in Different Temperatures?
This experiment will test the question of which beans will be best and germinate the fastest in different temperature rates.
Lima beans, soybeans and mung beans were tested. Each type of bean was placed in a hot temperature (under a light), cold
temperature (refrigerator) and room temperature. The beans were examined over a three-day period. Each experiment was
tested five times and the data was recorded. The results suggest that mung beans will grow the fastest in both hot and
moderate temperatures. ���
Yen Hoang and D. Shah (teacher)
3917 Portola Magnet Center18720 Linnet St.Tarzana, CA 91356
Voltage in Different Types of Fruits
This study examined the question of which fruit has the highest voltage based on acids in the fruits. A single nickel and penny
were inserted into each fruit and after one minute, the reading of the multimeter was recorded. Each record on a single type
of fruit was repeated three times, and the total number of recording voltages of fruits was 21 times (three of each kind of
fruit). The nickel and penny served as electrodes for the multimeter, an instrument used to measure voltage. The results
show that limes have the highest voltage compared to apples, grapefruits, lemons, oranges, pears and tangerines. ���
Gloria Koh and D. Shah (teacher)
3918 Portola Magnet Center18720 Linnet St.Tarzana, CA 91356
VNY_SciJrnl_interior 9/14/12 10:24 AM Page 163

164 Van Nuys Airport & California State University, Northridge
JavaScript vs. VBScript: Which Is Better for Animation?
This experiment was to find which scripting language is more efficient for simple animation. A series of criteria were creat-
ed and then tested on a number of computer languages. JavaScript and VBScript were selected, and scripts were written for
a ball to move in an up and down motion. The two scripts were then tested repeatedly by changing one variable at a time,
such as speed (the number of milliseconds to complete the function), starting position, and upper and lower boundaries.
The scripts were timed and pictures were taken at the beginning and end of the cycle. The results prove that JavaScript was
the better scripting language for simple animation. ���
What Color M&M Melts the Fastest?
All six M&M colors were tested nine times during the course of three days. The internal body temperature ranged from 36°
to 37° C. The meltdown is as follows: brown—under 145 seconds, blue—under 136 seconds, yellow—under 106 seconds,
orange—under 102 seconds, green—under 177 seconds, and red—under 86 seconds. In conclusion, the red M&M’s melted
the fastest. ���
Jonathan Woo and D. Shah (teacher)
3919 Portola Magnet Center18720 Linnet St.Tarzana, CA 91356
Kelsey Macapagal and D. Shah (teacher)
3920 Portola Magnet Center18720 Linnet St.Tarzana, CA 91356
To See if People Can Taste the Difference Between Full-Fat and Low-Fat Foods
This study examined the question of whether people could identify full-fat and reduced-fat foods when presented together.
People were tested with five foods. The five foods were potato chips (Pringles), popcorn (Vons), tortillas (Mission), sour
cream (Knudsen) and ranch dressing (Vons). These foods were given to the subjects and they were asked which one they
thought was full fat or low fat. Ten people were tested with this experiment. The results show that in all variables tested,
80% of the people who ate the foods got them correct and 20% of the people who ate the foods got them incorrect. ���
Natalia Romchuk and D. Shah (teacher)
3921 Portola Magnet Center18720 Linnet St.Tarzana, CA 91356
The Effect of Antibiotics on Escherichia Coli
This study examined how the antibiotics Zoysn (piperacillin sodium and tazobactam sodium), tobramycin sulfate and
trimethoprim affect the bacteria Escherichia coli. Agar plates were covered in the E. coli bacteria, and then received a drop
of one of the antibiotics. They had their lids placed on immediately and remained untouched. Over the course of five days
the growth and prevention of growth were observed and recorded. After repeating the experiment twice, the results revealed
that Zoysn (piperacillin sodium and tazobactam sodium) showed the most direct prevention and limit of growth on the
E. coli, the antibiotic trimethoprim worked the second best, and tobramycin sulfate worked the least well. It was, however,
concluded that all did have direct prevention and limit of growth on the E. coli. ���
Rachel Brookshire and D. Shah (teacher)
3922 Portola Magnet Center18720 Linnet St.Tarzana, CA 91356
VNY_SciJrnl_interior 9/14/12 10:24 AM Page 164
165New Journal of Student Research Abstracts 2007
Effect on the Reflection of Infrared Radiation By Color and Material
The experiment examined the reflection rate of infrared radiation from a remote control, and possible differences in this rate
due to different material. Infrared radiation was reflected off of black, white, red and green fabrics, papers and plastics.
It was also bounced off brown leather, wood and fabric, using a mirror as the control. Each material was used to reflect near
infrared waves at varying intervals ranging from 7.1 meters for the mirror to 3 meters for the black fabric and 0 meters for
the black plastic. Minor fluctuations were detected between the varying objects, with the mirror qualifying as most
reflective. Also, the color black was a poor reflective surface (most notably the plastic), and the semitransparent samples of
red and white plastics were also unusually bad reflectors. ���
Effects of Specific Nutrients on Specific Plants
This study tried to find out which fertilizer was the best food for three kinds of plants – Kentucky wonder beans, snap-
dragons and cabbages. The fertilizers used were Schultz Fertilizer, Bandini Lawn Food, Alaska Fish Fertilizer and Miracle-Gro.
The plants were exposed to the same sunlight conditions, the same temperature and same amount of water. All plants were
planted on the same material, Gromulch Premium Planting Mix and 50% soil. The growth of the plants was observed for
56 days, recording the growth every two weeks. The records show that Miracle-Gro is the best fertilizer for Kentucky won-
der beans. For the snapdragons, the best fertilizer is Miracle-Gro, followed closely by Alaska Fish Fertilizer. For cabbage, the
best fertilizer is the Bandini Lawn Food. ���
Diane Cabuguason and D. Shah (teacher)
3923 Portola Magnet Center18720 Linnet St.Tarzana, CA 91356
Dani Bork and D. Shah (teacher)
3924 Portola Magnet Center18720 Linnet St.Tarzana, CA 91356
Lung Wars: Which Gender Can Hold Its Breath Longer?
This experiment issued the question of whether one gender would be able to hold its breath longer than the other gender.
A stopwatch was used to time the amount of breath held in the lungs. Forty people of all ages were tested. Twenty females
and twenty males had a variety of the daily amount of exercise among the patients. The results concluded that the male
gender was able to hold its breath longer. The daily amount of exercise doesn’t seem to matter, but the age does. ���
Annie Hwang and D. Shah (teacher)
3925 Portola Magnet Center18720 Linnet St.Tarzana, CA 91356
Which Gender Can Hold Its Breath Longer?
This problem asks which one of the genders, male or female, would be able to hold its breath longer. A person of either sex
was found. The person was asked to hold his or her breath and was timed. The time and age of the person was recorded
on a chart. A person of the opposite sex and the same age was found. The time and age of the person was recorded as
before. The process was repeated a few times. This repeated with people of different ages. The conclusion showed that
males would be able to hold their breath longer than females. ���
Richard Kim and D. Shah (teacher)
3926 Portola Magnet Center18720 Linnet St.Tarzana, CA 91356
VNY_SciJrnl_interior 9/14/12 10:24 AM Page 165

166 Van Nuys Airport & California State University, Northridge
How Much Weight a Brass Roof Truss Could Hold
This study tested how much weight a brass roof truss could hold. Three roof truss models of wood and three of brass about
3 inches tall were built. The trusses were tested in this manner: a piece of wood was balanced on the tip of the truss and
weight was added until the truss was broken. The brass trusses were able to withstand over 35 kilograms of weight with-
out breaking. Two of the wood trusses broke at about 13 and 22 kilograms, while the remaining one withstood over
35 kilograms without breaking. The two wood trusses that broke gave way because they swayed to the side. The results
suggest that roof trusses can withstand staggering amounts of downward force on their tip but are susceptible to breaking
from swaying. ���
Static Thrust
The purpose of this project is to measure the impulse (I) of model rocket engines. In addition, these measurements were
compared with the measurement claims by the manufacturer’s data specifications. The rocket is mounted on a bracket.
The bracket is connected to a force sensor, and the force sensor is connected to a handheld computer (GLX). The comput-
er will generate a graph, the y-axis representing force, while the x-axis represents time. The area under the graph is
calculated. The units that are used are newton (N) and seconds (s). The results are compared to the manufacturer’s
specifications. Each rocket was tested no less than seven times. Six types of rockets were tested. No discrepancy was
detected. ���
Neil Borja and D. Shah (teacher)
3927 Portola Magnet Center18720 Linnet St.Tarzana, CA 91356
Lori Shirajian and L. Arslanian (teacher)
3928 C. & E. Merdinian Armenian Evangelical School13330 Riverside Dr.Sherman Oaks, CA 91423
What Is the Optimum Angle for a Remote Control Car to Clear a Ramp?
The purpose of this project was to investigate the optimum angle at which a remote control car can jump an inclined plane
and arrive safely on the opposite platform. Since the optimum angle of throwing a football is 45 degrees, the assumption is
the same angle seemed applicable to the remote car. A movable ramp around the y-axis was built. A protractor was attached
to the ramp. Two aspects were investigated: angle of elevation and the speed of the car (the latter was disregarded when
the car failed). More than one car was tested. Each run was tested 15 times. My hypothesis was not right, as the car went
the farthest at 40 degrees. ���
Gregory Abajian and L. Arslanian (teacher)
3929 C. & E. Merdinian Armenian Evangelical School13330 Riverside Dr.Sherman Oaks, CA 91423
VNY_SciJrnl_interior 9/14/12 10:24 AM Page 166
167New Journal of Student Research Abstracts 2007
Why Do Leaves Change Color in the Fall?
The question I wanted to answer was, “Why do leaves change color in the fall?” I took five jars with a different type of leaf
in each one. I grinded the leaves in the cups and poured a quarter of a cup of rubbing alcohol into each jar. The pigments
of each leaf, then, would come out and float in the rubbing alcohol. I then loosely covered the jars with aluminum foil and
left them like that for an hour. Then, I removed the aluminum foil and placed a long and thin strip of filter paper into each
jar. Slowly, the alcohol rises, bringing along with it the inner color of each leaf. There were many shades of green, yellow,
brown and very few oranges. From this experiment, I learned that a leaf changes color in the fall because of the cold
weather. As the top layer of the leaf (chlorophyll) disappears, the inner color of the leaf appears. ���
I See Vitamin C
The purpose of my project was to find out which solution of orange juice had the most Vitamin C. According to my
hypothesis, the freshly squeezed OJ will have the most Vitamin C. I started out my project by making my Vitamin C
indicator out of starch and iodine. This solution would be made to determine which solution contained the most Vitamin C.
Then with the use of pipettes one by one, I dropped (canned, freshly squeezed, bottled and frozen) OJ into four separate
15-mL Vitamin C indicator solutions and stirred. After three tries, I noticed that freshly squeezed OJ had the most Vitamin C
and canned OJ had the least Vitamin C. ���
Tanya Adamian and L. Arslanian (teacher)
3930 C. & E. Merdinian Armenian Evangelical School13330 Riverside Dr.Sherman Oaks, CA 91423
Silva Sourfazian and L. Arslanian (teacher)
3931 C. & E. Merdinian Armenian Evangelical School13330 Riverside Dr.Sherman Oaks, CA 91423
Nut Heat
I wanted to find out how much energy each type of nut will give to the water. I chose peanuts, almonds and walnuts.
I made a type of chimney where I could burn the nuts. I got a smaller can and poked holes on the top (this is the contain-
er that the water was poured into). I put a metal stick through and placed the smaller can in the big one so that it hung on
top of it. Then I got a needle and put it onto a piece of cork. I would then slide each nut on the needle and carefully light
the fire. When I burned the walnut it gave off black smoke. The fire was very high and juices flowed out. It burned on
average of about 2 and half minutes. The almond burned slowly with a small fire. It burned for about 3 minutes. The peanut
burned quickly. Juices also flowed out. First there was about 20-30 seconds of very high fire, then it cooled down. It burned
for 3 minutes. I thought, though, that the peanut would have the most energy. After performing my experiment three times,
it was found that the walnut gave the highest amount of energy, followed by the almond and then the peanut. I found the
energy by measuring the change in the water temperature, and then I put it in a formula and found out how many BTUs
each type of nut gave. ���
Mary Kasmajian and L. Arslanian (teacher)
3932 C. & E. Merdinian Armenian Evangelical School13330 Riverside Dr.Sherman Oaks, CA 91423
VNY_SciJrnl_interior 9/14/12 10:24 AM Page 167

168 Van Nuys Airport & California State University, Northridge
Factors of Frictional Force
“Factors of Frictional Force” deals with finding out how different weights and different areas of wooden blocks affect friction-
al force, as well as how different surfaces affect it. We hypothesized that an increased weight would increase frictional force;
any change in area would not have an effect; and the rougher the surface, the greater the frictional force. To prove this
hypothesis, the experimental setup utilized pulleys, thimbles, string, metal, cardboard, aluminum, different wooden blocks,
a spring scale and an electronic scale. Essentially a pulley system was made. By attaching the specific block to the pulley,
pulling the thread (which should be kept straight to avoid any error) and reading the electronic scale, the frictional force, in
grams, was recorded. There were three variables: weight of the wooden block, area of contact and type of surface (plywood,
aluminum, cardboard). Two of these were kept constant during each experiment in order to record the effects of the third.
Therefore, the experiment was conducted on five different weights of a long block of plywood and then repeated on a short
one. This setup was again repeated for aluminum and cardboard. After analyzing the data of the three trials, it was
determined that increasing the weight of the block increased frictional force; the area of contact had no effect; and the
rougher surface had a greater frictional force. ���
Relationship Between the Diameter of Wooden Dowels and Their Breakage Point and Elasticity
This project analyzed the effect of different weights added consecutively to wooden dowels of different diameters. Wooden
dowels were used in diameters of 1/16 inches, 1/8 inches, 3/16 inches, 1/4 inches and 5/16 inches. All dowels were at a length
of 36 inches, and above the ground at a height of 41.5 inches. Bricks and other weights were used to hold the dowel
firmly on both sides, and weights were added at set increments to a bucket attached to the center of the dowel. After each
additional amount of weight (w) was added, the distance between the new height of the dowel and the floor was record-
ed using a measuring tape. The experiment was repeated four times for each diameter. Outcomes showed that while the
rate of change of the height of the object aboveground (a measure of the dowel elasticity) changed linearly with increments
of the diameter of the dowel, the amount of weight carried before breakage point (a measure of the dowel load-bearing
capacity) was not linearly proportional to the diameter of the dowel. This work has significance to architectural projects that
may use dowel-shaped materials. ���
Armen Arslanian and L. Arslanian (teacher)
3933 C. & E. Merdinian Armenian Evangelical School13330 Riverside Dr.Sherman Oaks, CA 91423
Vivek Banerjee and D. Shah (teacher)
3934 Portola Magnet Center18720 Linnet St.Tarzana, CA 91356
The Amount of Smoke in Cigars and Cigarettes
This study examined whether cigars or cigarettes had more smoke according to mass. My materials were packs of cigars and
cigarettes, an electric balance beam, a metal tray and a lighter. In this experiment, I got cigars and cigarettes and weighed
them on an electric balance beam. We measured them so that they had the same mass and we burned them on a tray. We
then measured the ashes of the cigars and cigarettes on the electronic balance beam again. Then we subtracted the mass
of the tray from the total. I did this experiment three times and my results suggest that cigars contain more smoke than
cigarettes. ���
Edwin Choi and D. Shah (teacher)
3935 Portola Magnet Center18720 Linnet St.Tarzana, CA 91356
VNY_SciJrnl_interior 9/14/12 10:24 AM Page 168

169New Journal of Student Research Abstracts 2007
The Effect of Electromagnetic Fields on the Growth and Health of Chlamydomonas
This experiment was conducted to see if there was any effect of electromagnetic fields on the growth and health of
Chlamydomonas. In the experiment, two samples of Chlamydomonas were thoroughly mixed with 1 mL of water in two test
tubes. One of these was exposed to an electromagnetic field while the other wasn’t. Each test tube had a pipe in it which
led to a bubbler. This kept the algae dispersed. Every hour for five hours, a sample of algae was taken from each test tube
and was observed with a microscope. This experiment was repeated 10 times. The activity of the algae that were exposed
to the electromagnetic field lessened as time passed, while the activity of the algae not exposed gradually went up.
The results suggest that electromagnetic fields weaken algae and lower their growth. ���
Amount of Vitamin C Contained in Freshly Squeezed Oranges and Orange Juices
Vitamin C is a very important nutrient that helps prevent many illnesses and keeps the body healthy. Starch and tincture of
iodine were added to water to make a Vitamin C indicator. This indicator, which is a dark blue color, was placed in a
container. A number of drops of orange juice, from carton, bottle or freshly squeezed, were added to the solution. The num-
ber of drops needed to change the indicator from a dark blue color to a clear color was multiplied by 10 to get the percent
of Vitamin C the orange juice contains. Types of orange juices came from Tropicana cartons and bottles of orange juice.
Freshly squeezed orange juice came from Orlando tangelos and juice oranges bought at Ralphs. The average amount of
Vitamin C was about 110% Vitamin C. The Orlando tangelo, which was freshly squeezed, had 130% Vitamin C. Therefore,
the conclusion is that freshly squeezed orange juice has the most Vitamin C, but the juice orange, another example of a
freshly squeezed orange, only had 95%. The results also depend on which type of orange was squeezed. ���
Andrew Char and D. Shah (teacher)
3936 Portola Magnet Center18720 Linnet St.Tarzana, CA 91356
Austin Lee and D. Shah (teacher)
3937 Portola Magnet Center18720 Linnet St.Tarzana, CA 91356
Effects of Temperatures on the Resistivity of Electrolytes
I was trying to investigate the difference in current when I changed the temperature of my solution. The electrolyte I used
was copper. First, I made the copper sulfate solution and poured it into a 300-mL beaker. Next, I connected the copper
electrodes to the electrode ring. I set the power source to the AC. I connected one terminal of the electrode ring to the power
source. Then, I set the multimeter to AC 20 mA. I connected the other terminal of the power source to the multimeter.
Next, I connected the other terminal of the electrode ring to the multimeter. Finally, I put the thermometer on the lab stand,
I heated the solution and read the thermometer at every 5 degrees Celsius. As the temperature rose I checked the
multimeter. I concluded that whenever you heat the solution there is more conductivity and less resistivity. I believe I got
these results because when the temperature got higher the molecules moved faster, so the current changed by 0.1 mA.
This occurred until 80 degrees Celsius, and then it started to decrease. ���
Angel Abajian and L. Arslanian (teacher)
3938 C. & E. Merdinian Armenian Evangelical School13330 Riverside Dr.Sherman Oaks, CA 91423
VNY_SciJrnl_interior 9/14/12 10:24 AM Page 169

170 Van Nuys Airport & California State University, Northridge
Comparison of Insulators in Resisting and Retaining Heat
This experiment examined the ability of four different types of home insulation to resist and retain heat. In the heat resist-ance test, boxes of fiberglass, Styrofoam, loose fill, adobe insulation and a control box were heated for 90 minutes. The internal temperatures of the boxes were recorded approximately every 10 minutes. This test was repeated five times. The temperature in the adobe box increased by 6° C, while the control increased by 11.8° C. The fiberglass, loose fill andStyrofoam boxes increased by 10° C, 8.8° C and 8.8° C, respectively. In the heat retaining test, the five boxes were openedand allowed to heat up to equal temperatures. The boxes were then closed and temperatures were recorded approximate-ly every 10 minutes for 90 minutes (the majority of the temperature decrease occurred in the first 30 minutes). This wasrepeated four times. The temperature in the loose fill box decreased by 5.75° C, while the control decreased by 8.5° C. Thefiberglass, Styrofoam and adobe boxes decreased by 7° C, 7° C and 6.75° C, respectively. The results suggest that adobe insulation resists heat the best, while loose fill insulation retains heat the best. ���
How Does Carbon Dioxide Affect Air’s Rate of Temperature Change?
Summary StatementI used glass jars, dry ice, sun lamps and computer-controlled temperature probes to investigate how the amount of carbondioxide in the atmosphere affects the speed and severity of atmospheric temperature increase.
Objective/GoalsThe purpose of my experiment was to observe carbon dioxide as an essential contributor to global warming, and to accu-rately model how, in the near future, the amount of carbon dioxide in the atmosphere will correlate to an abrupt spike inatmospheric temperature. Once I began my experiment, I expected to see a sudden increase in temperature in the environ-ments containing the highest amount of carbon dioxide.
Methods/Materials
Materials:
-Four jars with lids -Laptop with Data Studio Program -Dry ice
-Four temperature probes -Drill
Methods:I decided to set up a series of four jars, each containing a progressively larger amount of carbon dioxide in the form of dryice. The amount in each jar corresponded to research I had done. I used heating lamps as a light source in substitution forthe sun, as it provided a constant and non-varied amount of heat. Over time, I analyzed the temperature change each atmos-phere experienced over the course of 11,000 seconds.
ResultsEach jar had an initial temperature of 5 degrees Celsius, and each resulting temperature told a story. Group A, my controlgroup, in which no dry ice was used, had actually decreased in temperature over time. Group B, the jar representing the year1900, slightly increased over time. Group C, the jar representing the year 2006, significantly increased over time. Finally,Group D, the jar representing the hypothesized atmospheric pressure concentration of carbon dioxide in the year 2100,experienced a pronounced spike in temperature. This group had a final temperature of 76 degrees Celsius. This concludedthe results of my experiment.
Conclusions/DiscussionBased on my results, I can confidently say that carbon dioxide is certainly contributing to global warming and that the morecarbon dioxide that is present in the atmosphere, the more extreme the effects are. ���
Justine Goode and D. Shah (teacher)
3939 Portola Magnet Center18720 Linnet St.Tarzana, CA 91356
Dennis Ojogo and L. Simonsen (teacher)
3940 Hollenbeck Middle School2510 E. 6th St. Los Angeles, CA 90023
VNY_SciJrnl_interior 9/14/12 10:24 AM Page 170

171New Journal of Student Research Abstracts 2007
Is It Safe to Eat Fish?: Toxic Heavy Metals in Urban Lake Sediment
Summary Statement
I tested lake bottom sediment from Echo Park Lake in Los Angeles to see if lead, mercury and cadmium are present at high
enough levels to cause concern about eating the Channel catfish caught there.
Objectives/Goals
My goal for this project was to see whether or not it is healthy for Los Angeles residents to eat Channel catfish caught from
Echo Park Lake. I expected to find high concentrations of lead, mercury and cadmium in the sediment.
Methods/Materials
The way I conducted my investigation was I went out on two Saturdays, rented a paddleboat and collected soil samples from
six different locations at Echo Park Lake. I used a soil sampler that would work with a lock on top of it. I dropped it into the
lake and once it hit the bottom I would tug on it so it would be sure to close. Then I would pull it up onto the paddleboat
to fill up sample containers with soil. After all the samples from 12 different sites were collected, I took them to school and
put them in petri dishes and spread them flat. For this I used a small plastic spatula so it wouldn’t affect my results. Next,
I put all of my samples in an incubator because I only needed the soil, so I dehydrated them. I then took them to the
California Institute of Technology (Caltech), where I smashed each one of them with a mortar and pestle until the soil was
very fine. I then measured 4.01 grams of each sample and added .95 grams of paraffin, because I was going to turn them
into tablets. To turn the samples into tablets I used a soil press. I put a total of 1,500 kg or weight on each sample. Finally,
I put the samples into an X-ray spectrometer and this told me how much of each element there was in each of the sam-
ples, as a percentage of the total sample.
Results
My results show that there are potentially toxic levels of lead in Echo Park Lake sediment. Mercury levels were not high
enough to cause concern of toxic exposure. Cadmium levels were high enough for possible toxic exposure, depending on
how much fish a person ingests.
Conclusions/Discussion
My results partially confirm my hypothesis because I only found high levels of lead and cadmium, but not mercury. According
to a study done by J.M. Czarnezki, if the metals are found at high levels in the sediment, they will be found in the catfish
because they are bottom feeders. He tested the tissue of bottom-feeding fish and found that these elements accumulate in
fish tissues. The next step in my investigation should be finding the mechanism by which these metals get into Echo Park
Lake, and even testing the tissue of real fish that are caught in the lake. ���
Edwin Espinoza and L. Simonsen (teacher)
3941 Hollenbeck Middle School2510 E. 6th St. Los Angeles, CA 90023
VNY_SciJrnl_interior 9/14/12 10:24 AM Page 171

172 Van Nuys Airport & California State University, Northridge
How Does Seasonal Change Affect Respiration Parameters forOncorhynchus mykiss Living in Shallow Urban Lakes?
Summary statement
We examined the effect of seasonal temperature change on water temperature, dissolved oxygen and water clarity in two
shallow urban lakes where rainbow trout are stacked.
Objectives/Goals
The objective of our investigation was to determine how seasonal temperature changes affect respiration parameters
(temperatures, dissolved oxygen and turbidity) for Oncorhynchus mykiss living in MacArthur Park and Echo Park Lakes, which
are shallow, cement-lined lakes. We predicted that regardless of the season (summer, fall and winter), conditions in Echo
Park and MacArthur Park Lakes would not support healthy respiration in rainbow trout due to high water temperatures and
high nutrient levels, which lead to high turbidity and low or even hypoxic oxygen levels.
Methods/Materials
We conducted a nine-month (July 2006-March 2007) transect study of the lakes. Every three weeks we would paddle down
to the center of the lakes and stop at four different testing stations. We used a water sampler to collect water at every
1 meter of depth of the water column. We then tested for dissolved oxygen with a dissolved oxygen probe. We also used a
thermocline sensor to test for temperature at every .5 meters of depth of the water column. After testing for temperature
we lowered a Secchi disk to measure water clarity.
Results
Throughout our investigation, we found high water temperatures that at times were twice as high as trout hatchery
standards, as well as consistently eutrophic nutrient levels and dissolved oxygen levels ranging from stressful to hypoxic.
Conclusions/Discussion
Our results support our hypothesis because during each season (summer, fall, winter), we found potentially stressful and
sometimes fatal conditions for trout. The lakes are so shallow that there is often no comfortable water temperature for the
fish to live in, and warmer water carries less oxygen. Also, biochemical oxygen demand and chemical oxygen demand reduce
oxygen levels in the water, probably due to large amounts of bird waste and dead plant and animal matter. Finally, aeration
pumps are not being used consistently. The next step in our study would be to continue testing these respiration
parameters through spring. A solution to this problem is that rainbow trout should not be stocked in these shallow urban
lakes. Also, more aeration pumps should be installed for the water to be sufficiently replenished with oxygen. ���
Amy Franco, Jessica Mira and L. Simonsen (teacher)
3942 Hollenbeck Middle School2510 E. 6th St. Los Angeles, CA 90023
VNY_SciJrnl_interior 9/14/12 10:24 AM Page 172

173New Journal of Student Research Abstracts 2007
The Nautilus Shell: Golden Mean or Logarithmic Spiral?
Summary Statement
I studied Nautilus shell growth patterns using line segments created by radii that intersected the spiral of the shell, and
calculated ratios to see if the shell grows according to the Golden Mean.
Objectives/Goals
My objective for this project was to understand the mathematical nature of the growth pattern of the Nautilus shell. I want-
ed to determine if the growth pattern of the Nautilus shell in fact follows the Golden Mean or the Logarithmic Ratio.
My hypothesis was that the Nautilus shell would follow the Logarithmic Ratio instead of the Golden Mean because during
my research I found out that many people often confuse the Logarithmic Ratio with the Golden Mean.
Methods/Materials
Materials:
-A 12-inch ruler -A camera -An Apple computer
-A protractor -Two Nautilus shells and 16 Nautilus shell photos
-A number 2 pencil -A calculators
Methods:
I used 16 photos of unique Nautilus shells for my investigation. First, I found the center of a Nautilus shell and made an
X- and Y-axis through it. Then I rotated the photo 45 degrees and drew another X- and Y-axis. This gave me a picture with
eight radii from the center of the shell to the edge of the last part of the spiral of the shell. I labeled every point where the
radii intersected the Nautilus spiral. I then used a ruler to measure the line segments that were a part of each radius. Next
I created ratios with neighboring line segments to see if they produced the Golden Mean. Finally, I recorded the given ratios
into a list and plotted them on a scatter plot.
Results
In my graph it shows specifically where the Golden Mean (1.6) and Logarithmic Ratio (1.3) were located. In doing so it
shows that only six of the ratios out of 212 fell on 1.6, and 13 fell on 1.3. But most of the ratios that are on the graph are
below the 1.3 line. My hypothesis was supported by these results.
Conclusions/Discussion
In the end of my experimentation, I found that Nautilus shells do not appear to follow the Golden Mean, but more likely the
Logarithmic Ratio. ���
Joshua Navarette and F. Quintrell (teacher)
3943 Hollenbeck Middle School2510 E. 6th St. Los Angeles, CA 90023
VNY_SciJrnl_interior 9/14/12 10:24 AM Page 173

174 Van Nuys Airport & California State University, Northridge
How Many Holes Should I Put in the Lid?: Investigating OxygenConsumption Differences in Jumping and Flying Invertebrates
Summary Statement
I used a metabolism chamber to measure oxygen consumption rates and volumes for painted lady butterflies, ladybugs and
crickets.
Objectives/Goals
My goal was to see if butterflies consume more oxygen than ladybugs or crickets. Since they all fly or jump they need
energy to move, and if they need energy then they need oxygen, because in an animal oxygen and glucose produce
energy. I hypothesized that butterflies would, on average, consume more oxygen than the other insects because they have
very large wings to move and a small body that has to move them.
Methods/Materials
I used a metabolism kit to perform each trial with ladybugs, butterflies and crickets. I put a group of one of the types of
invertebrates I was testing inside the organism holder and measured their mass. After that I put the organism holder inside
the metabolism chamber with 13-15 potassium hydroxide pellets. The pellets absorbed carbon dioxide that was coming
from the insects, which created a vacuum so that I could measure how much oxygen the insects were consuming. I record-
ed the number on the capillary tube that the index solution was passing, which I did each 30 seconds for five minutes.
I repeated this process for every trial I performed.
Results
My results show that butterflies consume more oxygen than crickets and ladybugs. The mean oxygen consumption for
crickets was 0.109 cc/g, the mean oxygen consumption for ladybugs was 0.004 cc/g, and for butterflies it was 0.174 cc/g
(g stands for gram of insect mass).
Conclusions/Discussion
My hypothesis was supported because butterflies did consume more oxygen than the other insects that I tested. I believe
based on my results that butterflies consume more oxygen because they have small bodies and big wings, so they need
more energy. ���
Mayte Gutierrez and L. Simonsen (teacher)
3944 Hollenbeck Middle School2510 E. 6th St. Los Angeles, CA 90023
VNY_SciJrnl_interior 9/14/12 10:24 AM Page 174

175New Journal of Student Research Abstracts 2007
How Does Living With a Smoker Affect Lung Functions in Children(Ages 12-14) Throughout the Four Seasons of the Year?
Summary Statement
The effects of environmental tobacco smoke (in the home) on the lung functions of 12- to 14-year-old children.
Objectives/Goals
My objective was to determine how living with a smoker affects lung function in children throughout the four seasons of the
year, in comparison to those who do not live with a smoker. I hypothesized that children exposed to ETS (environmental
tobacco smoke) in their homes would exhibit evidence of greater compromise in their lung functions (FVC and FEVI) when
compared to children who do not live with a smoker.
Methods/Materials
The experiment was conducted from June 2006 to March 2007, and I tested my participants during each of the four
seasons. My study required 108 randomly selected middle school students, a medically certified spirometer, a digital scale,
two yardsticks and my log book. I created a survey that contained questions about exposure to environmental tobacco
smoke, as well as other factors that might influence respiratory function, including asthma, height, weight, gender and age.
I entered the height, weight, age and gender of each student into the spirometer. This would allow the spirometer to calcu-
late each student’s expected lung function values. Then each participant would perform a series of exhalations into the
spirometer until reproducibility was achieved, and I would print out and analyze their results.
Results
According to my results, students who live with a smoker in their home experienced lung diagnoses of Mild Restriction to
Very Severe Restriction from summer through spring. These students showed no sign of Normal Spirometry to Moderate
Restriction, but diagnoses were predominantly normal. Also, students exposed to ETS in their own homes exhibited experi-
mental lung function values that were rarely close to their predicted values for either FVC (Forced Vital Capacity) or FEVI
(Forced Expiratory Volume in the 1st Second). On the other hand, students who are not exposed to ETS in their homes
displayed experimental lung function values that were very close to if not equal to their predicted values for both FVC
and FEVI.
Conclusions/Discussion
My results show that there was significant compromise in the lung functions of students who are exposed to ETS in their
homes, and this compromise intensified during seasons with colder weather. Perhaps windows are closed during these
seasons, and people stay indoors. These results support my hypothesis. ���
Catherine Soto and L. Simonsen (teacher)
3945 Hollenbeck Middle School2510 E. 6th St. Los Angeles, CA 90023
VNY_SciJrnl_interior 9/14/12 10:24 AM Page 175

Student Abstract IndexNumber following name refers to abstract number
Abajian, A., 3938Abajian, G., 3929Abravanel, A., 3905Acevedo, S., 3863Adamian, T., 3930Aftalion, P., 3688Aghoian, K., 3716, 3717Aguilar, D.A., 3564Aguilar, E., 3853Aguirre, S., 3576Ahdoot, M., 3670Aibani, N., 3839Alayvilla, V., 3838Almazan, A., 3715Alongi, M., 3640Alves, G., 3743Amin, J., 3671Amini, N., 3819Aquino, R., 3562Araujo, T., 3582Arisue, J., 3716Armas, P., 3842Arslanian, A., 3933Ashrafian, S., 3762Avarez, C., 3884Avila, G., 3716Avitia, J., 3715Baca, K., 3645Baghoomian, W., 3814Bak, J., 3715Baker, T., 3715Banerjee, V., 3934Barnheiser, J., 3879Baroth, C.M., 3628Bartlett, K., 3637Bauirjan, J., 3780Beiser, K., 3689Belisario, L.A., 3881Beremesh, A., 3902Berg, B., 3573Bernard, T., 3661Bernardino, A.M., 3775Betita Jr., R., 3583Bhakta, K., 3812Bishay, M., 3716, 3718Bond, V., 3873Borja, N., 3927Bork, D., 3924Botezatu, J., 3783Boutros, N., 3715, 3719Bozuki, S., 3712Bravo, J., 3801Brenner, C., 3622Brooks, G., 3822Brookshire, R., 3922Bugante, N., 3869Bugayong, S., 3715Bunye, M., 3886Burman, J., 3788Bustos, S., 3872
Butch, A., 3715, 3720Cabuguason, D., 3923Cadiz, C., 3893Calderon, G., 3715Campo, P., 3569Capitulo, R., 3716, 3721Caplan, C., 3690Carrillo, E., 3847Casillas, J., 3716, 3722Castillo, J., 3716Cedar, R., 3711Chai, N., 3913Chan, M., 3745Chan, M., 3857Chan, V., 3593Chang, M., 3870Char, A., 3936Chavez, K., 3804Chavez, M., 3792Chen, G., 3754Chi, T., 3797Chillington, J., 3832Cho, M., 3668Cho, N., 3618Choi, C., 3907Choi, E., 3935Chong, J.K., 3627Chowdhury, S., 3901Chu, K., 3781Cicchetti, A., 3716, 3723Cohen, H., 3823Cohn, S., 3798Cooper, C., 3716, 3724Corn, S., 3748Cortez, D., 3563Cramer, E., 3691Cubias, D., 3805Cuevas, S., 3851Dahan, J., 3672Danielak, J., 3861Daniels, C., 3825Dardashti, M., 3692Davidson, J., 3605De Biasi, N., 3878De La Fuente, J., 3860Dejam, D., 3916Delafraz, H., 3712Delgado, M., 3868Dill, O., 3650Doan, V., 3891Dodge, F., 3716, 3725Dokhanian, A., 3693Dominguez, D., 3715Donnelly, O.S., 3611Druyan, S., 3738Dungan, D., 3667Duran, G., 3836Eang, K., 3715Ebrahimi, A., 3844, 3846Encinas, K., 3773
Enriquez, A., 3657Espinoza, E., 3941Eyrich, L., 3757Farias, M., 3812Feng, G., 3877Fernandez, S., 3716Feuer, D., 3572Firouz, C., 3673Fischel, D., 3674Fish, R., 3620Fitzmorris, A., 3571Flaata, S., 3785Flores, J., 3875Fong, M., 3807Fonseca, A., 3813Franco, A., 3942Freedy, K., 3694Freeman, J., 3695Frese, T., 3588Friedman, A., 3675Friedman, J., 3676Furcick, R., 3834Furlong, D., 3656Gabig, A., 3876Gabrielyan, M., 3803Galicia, D., 3849Garcia, C., 3848Garcia, M., 3867Garcia, S., 3761Garden, K., 3712Gargano, N., 3881Gaudioz-Young, A., 3741Getlin, W., 3598Ghani, M., 3829Ghazarian, A., 3852Giglione, B., 3652Gilad, A., 3574Gill, B., 3753Golab, M., 3712Goldbaum, A., 3827Golmohammadi, O., 3566Golombek, A., 3889Gomes, C., 3568Goode, J., 3939Gordon, D., 3696Grimberg, N., 3648Grinstein, N., 3677Grogman, G., 3815Gutierrez, A., 3809Gutierrez, M., 3878Gutierrez, M., 3944Guzman Jr., F., 3715Ha, J.M., 3740Halfen, L., 3772Hamoy, A., 3883Han, S., 3858Handelman, S., 3697Hangval, A., 3882Hansen, M., 3726Hanson, P., 3742
Harrington, C., 3795Harris, R., 3606Heikali, A., 3698Hernandez, F.P., 3608Hernandez, L., 3865Hernandez, R., 3877Ho, A., 3911Hoang, Y., 3917Hoisch, D., 3897Hong, J., 3575Hoon, S., 3632Horrocks, M., 3614Hsu, I., 3597Huang, J., 3879Huang, K., 3603Huerta, A., 3715Hwang, A., 3925Hwang, J., 3900Ickowitz, N., 3699Iglesias, T., 3715Ignacio, K., 3853Ip, J., 3609Ismail, A., 3894Itzep, C., 3658Iwata, L., 3613Jimenez, L., 3715Jimenez, L., 3727Kajani, R., 3770Kajani, R., 3770Kajouke, K., 3835Kanter, R., 3710Karkenny, S., 3784Karmiryan, P., 3854, 3856Kasmajian, M., 3932Kempler, T., 3678Kessler, C., 3589Khatcherian, L., 3803Kim, D., 3570Kim, D., 3600Kim, M., 3578Kim, R., 3926Kim, T., 3656Kim, T., 3909Kitaguchi, A., 3877Knudsen, J., 3779Koestner, C., 3862, 3880Koh, G., 3918Kohandarvish, S., 3712Kohli, A., 3767Kol, D., 3837Kolodny, D., 3679Krasnova, J., 3778Kriegsman, A., 3680Krikorian, S., 3854Kwok, I., 3763Kwok, J., 3760Lambert, J., 3818Landau, N., 3769Lara, E., 3864Le, J.Q., 3715, 3728
176 Van Nuys Airport & California State University, Northridge
VNY_SciJrnl_interior 9/14/12 10:24 AM Page 176

Leano, J., 3899Lee, A., 3581Lee, A., 3937Lee, D., 3656Lee, D., 3796Lee, J., 3908Lee, L., 3751Lemmer, A., 3845Leon, G., 3771Levine, R., 3700Li, A., 3910Lieberman, S., 3681Lim, J., 3587Lim, N., 3898Lin, J., 3638Lin, S., 3617Lin, V., 3878Link, T., 3701Lipp, M., 3682Lombard, C., 3643Loredo, W., 3749Lowensohn, J., 3585Macapagal, K., 3920Macdonald, C., 3715Machado, N., 3816Macneil, D., 3716Mak, A., 3876Mallari, R.J., 3714Mann, N., 3821Mannshahia, A.K., 3646Marchand, M., 3782Margossian, K., 3666Markosyan, Z., 3856Marks, D., 3794Marroquin, A., 3715Martin, L., 3817Martin, O., 3715Martinez, B., 3859McCauley, S., 3565McDonald, M., 3889McEldowney, D., 3607McEvoy, M., 3651McEvoy, M., 3828Mehta, M., 3881Melancon, C., 3604Melgar, E., 3715, 3729Melkumyan, T., 3669Mendoza, A., 3659Meza, R., 3787Millman, T., 3885Milstein, N., 3702Mira, J., 3942Mirza, M., 3615Mirza, S., 3766Mok, J., 3826Moncada, Y.R., 3746Moosakhanian, S., 3662, 3808Moriel, G., 3877Muñoz, M., 3764Munson, A., 3840
Murali, S., 3879Naim, A., 3683Navarette, J., 3943Navarro, B., 3716Nelson, K., 3660Ngo, M., 3715Nguyen, A., 3739Nguyen, B., 3655Nguyen, J., 3716, 3730Nguyen, J., 3750Nguyen, M., 3716Nguyen, V., 3777Nicholson, C., 3841Nizami, K., 3820Ochoa, J., 3850, 3880Oh, B., 3663Oh, S., 3776Ojogo, D., 3940Ono, H., 3801Orellana, R., 3716Orellano, S., 3886Ortiz, J., 3715Ortiz, J., 3716Padgett, K., 3903Padgett, S., 3744Pak, R., 3639Pakhdikian, S., 3855Palomino, C., 3715Papazyan, N., 3856Park, J., 3747Park, T.H.S., 3633Partida, J., 3715Partovi, V., 3654Pastor, J., 3714Pattana, T., 3898Paul, S., 3790Paullada, A., 3712Peleg, M., 3703Perales, L., 3715Peraza, E., 3716Peretz, J., 3914Perez, C., 3623Perez, V., 3888Pierce, L., 3876Pimentel, C., 3871Pinpin, C., 3612Piyavanich, D., 3906Popiolek, B., 3789Poudyal, S., 3890Quan, V., 3713Quiambao, K., 3715Rader, M., 3601Ragas, L., 3647Ramirez, M., 3805Ramjohn, A., 3833Ranit, L., 3567Raskind, A., 3896Reid, Z., 3684Rendon, V., 3813Rico, V., 3653
Ro, K., 3631Robinson, M., 3716Rodriguez, M., 3752Rodriquez, M., 3874Rojhani, A., 3843Rollman, J., 3685Romchuk, N., 3921Romero, D., 3810Roxas, K., 3716Ruiz, E., 3602Rusheen, R., 3586Ruvalcaba, E., 3887Saavedra, J., 3800Sabalburo, C., 3649Saito, M., 3799Salazar, J., 3716Samano, L., 3716, 3731Samsanovich, A., 3635Sanchez, A., 3900Sanglimsuwan, A., 3870Sankarram, S., 3755Santibanez, J., 3810Santo, A., 3831Saoud, B., 3793Saucier, C., 3904Schwinger, M., 3912Shah, R., 3824Shahbazian, P., 3735Shandler, S., 3629Sheldon, A., 3704Shim, H., 3621Shirajian, L., 3928Shoohed, N., 3686Shukla, C., 3881Sidrak, D., 3561Siegel, K., 3786Singh, H., 3610Skager, A., 3636Snyder, M., 3716Soto, C., 3945Sourfazian, S., 3931Spoto, A., 3881Srikureja, J., 3590Strobel, R.W., 3737Sung, B., 3580Supannarat, D., 3716Taguchi, R., 3595Tallas, A., 3634Tang, J., 3625Tarighat, M., 3592Tawil, A., 3705Tell, N., 3616Ter-Ghukasyan, A., 3735Thomas, S., 3664To, J., 3879Toh, A., 3881Tolentino, J.C., 3736Topchyan, A., 3806Topf, T., 3759Torkan, A., 3706
Torosyan, A., 3802Tran, C., 3756Truong, L.V., 3626Turcios, K., 3715Turner, N., 3707Um, J., 3892Ung, J., 3577Valenzuela, M., 3895Vardoyan, G., 3662, 3808Vargas, C., 3813Vazquez, V., 3881Vega, S., 3890Velasquez, C., 3715Velazquez, L., 3866Vera Jr., R., 3715Vidar, E., 3758Villanueva, C., 3811Viray, C., 3715Vogler, K., 3716, 3732Waitley, J., 3716Wang, J., 3599Warfel, E., 3656Webster, T., 3596Weiss, R., 3708Weyman, J., 3709Whitmer, C., 3774Williams, A., 3715Wirtz, R., 3624Won, S., 3584Wong, D., 3641Woo, J., 3919Wu, A., 3791Wu, J., 3716Wyckoff, M., 3665Xing, H., 3594Xu, S., 3644Yacub, R., 3800Yang, A., 3579Yesipova, J., 3830Yin, D., 3915Yong, L., 3716, 3733Yoo, R., 3619Yoque, G., 3716, 3734Young, M., 3765Yu, N., 3591Zari, M., 3802Zarinshesnas, R., 3656Zepeda, A., 3715Zepeda, S., 3642Zev, J., 3630Zicker, G., 3768Zohar, J., 3715Zwick, A., 3687
177New Journal of Student Research Abstracts 2007
VNY_SciJrnl_interior 9/14/12 10:24 AM Page 177

Teacher and Mentor Index
L. ArslanianC. & E. Merdinian Armenian Evangelical School13330 Riverside Dr.Sherman Oaks, CA 91423
T.C. ChiangDodson Middle School28014 Montereina Dr.Rancho Palos Verdes, CA 90275
C. HallDe La Salle School16535 Chatsworth St.Granada Hills, CA 91344
M. KazanjianColumbus Magnet Middle School22250 Elkwood St.Canoga Park, CA 91304
T. MillerHolmes International Middle School9351 Paso Robles Ave.Northridge, CA 91325
S. ParmarJohn Adams Middle School151 W. 30th St.Los Angeles, CA 90007
F. QuintrellHollenbeck Middle School2510 E. 6th St.Los Angeles, CA 90023
W. Reid-BradleyHorace Mann Middle School7001 S. St. Andrews Pl.Los Angeles, CA 90047
D. SantamariaJohn Adams Middle School151 W. 30th St.Los Angeles, CA 90007
D. ShahPortola Magnet Center/Middle School18720 Linnet St.Tarzana, CA 91356
L. SimonsenHollenbeck Middle School2510 E. 6th St.Los Angeles, CA 90023
M. WalzbergJohn Muir Middle School5929 S. Vermont Ave.Los Angeles, CA 90044
G. ZemErnest Lawrence Middle SchoolMagnet10100 Variel Ave.Chatsworth, CA 91311
R. BakerUniversity High School11800 Texas Ave.Los Angeles, CA 90025
C. BayleyJohn C. Fremont High School7676 San Pedro St.Los Angeles, CA 90003
J.D. CocozzaFrancisco Bravo Medical Magnet High School1200 N. Cornwell St.Los Angeles, CA 90033
S. CoopermanMilken Community High School of Stephen S. Wise Temple15800 Zeldins’ WayLos Angeles, CA 90049
A. DarakjianEl Camino Real High School5440 Valley Circle Blvd.Woodland Hills, CA 91367
L. DurbinRamona Convent Secondary School1701 W. Ramona Rd.Alhambra, CA 91803
D. Evans-ByeClark Magnet High School4747 New York Ave.La Crescenta, CA 91214
A. FlaganRamona Convent Secondary School1701 W. Ramona Rd.Alhambra, CA 91803
D. GaughenTaft High School5461 Winnetka Ave.Woodland Hills, CA 91364
N. PalArcadia High School189 Campus Dr.Arcadia, CA 91007
N. PalRobert Fulton College PreparatorySchool7477 Kester Ave.Van Nuys, CA 91405
J. RansomUniversity High School11800 Texas Ave.Los Angeles, CA 90025
J. WiseNew Roads School3131 Olympic Blvd.Santa Monica, CA 90404
G. ZemCleveland High School8140 Vanalden Ave.Reseda, CA 91335
Middle School
High School
178 Van Nuys Airport & California State University, Northridge
VNY_SciJrnl_interior 9/14/12 10:24 AM Page 178

179New Journal of Student Research Abstracts 2007
B. BasingerDoheny Eye InstituteKeck School of MedicineUniversity of Southern California1450 San Pablo St.Los Angeles, CA 90033
W. GekelmanUCLA Physics DepartmentUniversity of California, Los AngelesBox 951547Los Angeles, CA 90095
W. LaytonUCLA Physics DepartmentUniversity of California, Los AngelesBox 951547Los Angeles, CA 90095
P. NiknejdiPhysics DepartmentCal Poly Pomona3801 W. Temple Ave.Pomona, CA 91768
P. PibylUCLA Physics DepartmentUniversity of California, Los AngelesBox 951547Los Angeles, CA 90095
R. RansomUCLA Mathematics DepartmentUniversity of California, Los AngelesBox 951555Los Angeles, CA 90095
A. RowleyDoheny Eye InstitueKeck School of MedicineUniversity of Southern California1450 San Pablo St.Los Angeles, CA 90033
J. SkrzypekPhysics DepartmentCalifornia Institute of TechnologyPhysics Department 103-33Pasadena, CA 91125
J.D. WeilandDoheny Eye InstituteKeck School of MedicineUniversity of Southern California1450 San Pablo St.Los Angeles, CA 90033
College and University
VNY_SciJrnl_interior 9/14/12 10:24 AM Page 179

180 Van Nuys Airport & California State University, Northridge
Subject IndexNumber refers to abstract number
359435973604
364537223751
375537873790
38103928
Aviation and Aerospace
3634 3646
36663668
37293799
38483849
38623902
Cellular/Molecular Biology and Genetics
356635723574357535713577359636123621
362836323635366536743676368036913694
369636973702370337193721372637313738
374737663774377537923797380938163828
384238583872388938973903391539303936
Chemistry
35813585358936003613362436263630363136363647
36483651367836793681368637073709371737333741
37453746375237733780378137843785378837913798
38243833383938433863386738853888389238933895
3905390639073916392039213927393239353939
Comparison
3605362936623669368237253735
3793380038013802380338063807
3808381738253835384038443845
3846384738523853385438553856
3868387438753891394039413942
Ecology and Environmental Biology
3568356936173623
3642365836643715
3716372037243727
3734373938143851
386539433944
Invertebrate Biology
3562358035883644
3659366036613712
3804380538183830
3870389439223937
Microbiology
VNY_SciJrnl_interior 9/14/12 10:24 AM Page 180

35763743
38273864
38713873
3919
Miscellaneous
35643578359936083609361136193620365536563667
36733683368436873688368936933698370437083710
37113713371437373744374937533768377837823783
37863795382238233826383238363841385038573859
3882388738903911391839243929393339343938
Physics
3565356735903591359235933601
3610361636273637364036413643
3650367136723677370137573758
3763376537793821383838693876
387938963898389939233931
Plant Biology – Chemistry
356135733579359536063622362536393649
365736923723372837303732373637403742
375437563759376037613762377137763789
381138123815383738603861386638773878
388038813884390139123917
Plant Biology – Environmental
35823586360336143618
36523663369037183750
37643767376937773796
38133819382938313834
38833886390839133914
Psychology
3563357035833584358735983602
3607361536333638365336543670
3675368536953699370037053706
3748377037723794382039003904
39093910392539263945
Vertebrate Biology
181New Journal of Student Research Abstracts 2007
VNY_SciJrnl_interior 9/14/12 10:24 AM Page 181

182 Van Nuys Airport & California State University, Northridge
Answers to Vinny word puzzle, page 28.
VNY_SciJrnl_interior 9/14/12 10:24 AM Page 182


![Student Poster Abstracts - u:scholar300620.pdf · Student Poster Abstracts ... and extend battery life. Apple’s Siri and iCloud [1] are two remarkable examples. However, cloud offloading](https://static.fdocuments.us/doc/165x107/5caa28ac88c9939f3e8dbf8d/student-poster-abstracts-uscholar-300620pdf-student-poster-abstracts-.jpg)