New Jersey State Investment Council Annual Meeting … · New Jersey State Investment Council...
49
New Jersey State Investment Council Annual Meeting FY 2009 Investment Environment and Results William G. Clark, Director New Jersey Division of Investment November 19, 2009
Transcript of New Jersey State Investment Council Annual Meeting … · New Jersey State Investment Council...

New Jersey State Investment CouncilAnnual Meeting
FY 2009 Investment Environment and Results
William G. Clark, DirectorNew Jersey Division of Investment
November 19, 2009

Outline
Summary of Market Environment
Portfolio Actions During FY09
FY09 Performance
Performance by Asset Class
FY 2010 So Far
Concluding Thoughts

Market Returns for FY 2009Ending June 30, 2009
1 Year 3 Years 5 Years
US Equities
S&P 1500 Index -26.34 -8.23 -1.97
International Equities
MSCI EAFE ex-prohibited -31.17 -8.14 2.20
Emerging Markets Equities
MSCI Emerging Markets Index -25.23 3.56 14.88
Investment-Grade Bonds
Barclays US Treasuries Index 6.47 7.41 5.46
Barclays Corporate Index 3.84 4.49 3.82
Barclays Mortgage Backed Index 9.38 7.86 5.98
High Yield Bonds
Barclays High Yield Index -2.43 2.09 4.33

Market Returns for FY 2009Ending June 30, 2009
1 Year 3 Years 5 Years
Commodities
DJUBS TR Index -47.09 -8.30 -0.23
Private Equity* -22.00 3.00 12.17
Real Estate
NCREIF Property Index -19.57 0.98 7.66
Hedge Funds
HFRI Funds of Funds Index -15.24 -1.13 2.62
Cash
90 Day US T-Bill Index 0.80 3.04 3.02
These returns do not fully capture the impact of the “shock” to the financial markets and the economy.

The return on US stocks for FY09 was the lowest since 1932
-
20
40
60
80
100
120
S&P 500 Index June 2007 – June 2009

More importantly, the ten year annualized return on stocks was negative for the first time since the 1930’s
-10%
-5%
0%
5%
10%
15%
20%
25%
Rolling 10 yr return
S&P 500 Index Rolling Ten Year Return

Emerging market equity returns were slightly better than global equities because of the weakening U.S. dollar and the superior financial position of
many emerging markets countries
0
20
40
60
80
100
120
140
MSCI EAFE MSCI EM
MSCI EAFE and Emerging Markets Return June 2007 – June 2009

The credit markets were hit even harder by the “seizing up” of the global financial system
Option Adjusted Spread (bps)
Source: Barclays Capital; History Through August 31, 2009, monthly data
0
200
400
600
800
1000
1200
1400
1600
1800
2000
Aug-99 Aug-00 Aug-01 Aug-02 Aug-03 Aug-04 Aug-05 Aug-06 Aug-07 Aug-08 Aug-09
0
200
400
600
800
1000
1200
U.S. Corporate Investment Grade
U.S. Corporate High Yield
High Yield: +849 bps
Investment Grade: +232 bps
Incremental Yields on U.S. Corporate Bonds vs. U.S. Treasuries 1999 - 2009

The market was reacting to the economy falling off a cliff
(3-Month Percent Change Annualized, September to December)
(79%)
(47%) (46%)
(37%)
(29%)
(9%)
Housing Starts Durable Goods
Orders
New Home Sales Exports Retail Sales Industrial
Production
Source: U.S. Census, Bureau of Economic Analysis, Gluskin Sheff

Warren Buffett, October 1, 2008, PBS “The Charlie Rose Show”

“The long-feared
capitulation of
American consumers
has arrived”
— October 31, 2008
How did the consumer respond?

―Something is definitely going on.
We’re back to eating dog food.‖
How did the consumer respond?

What Brought the Global Financial MarketsBack From the Brink
Monetary Stimulus
Fiscal Stimulus
Other Government Intervention

The Federal Reserve and other Central Banks cut short-term interest rates to unprecedented levels
01
234
5678
9101112
13141516
FED BOE ECB BOJ
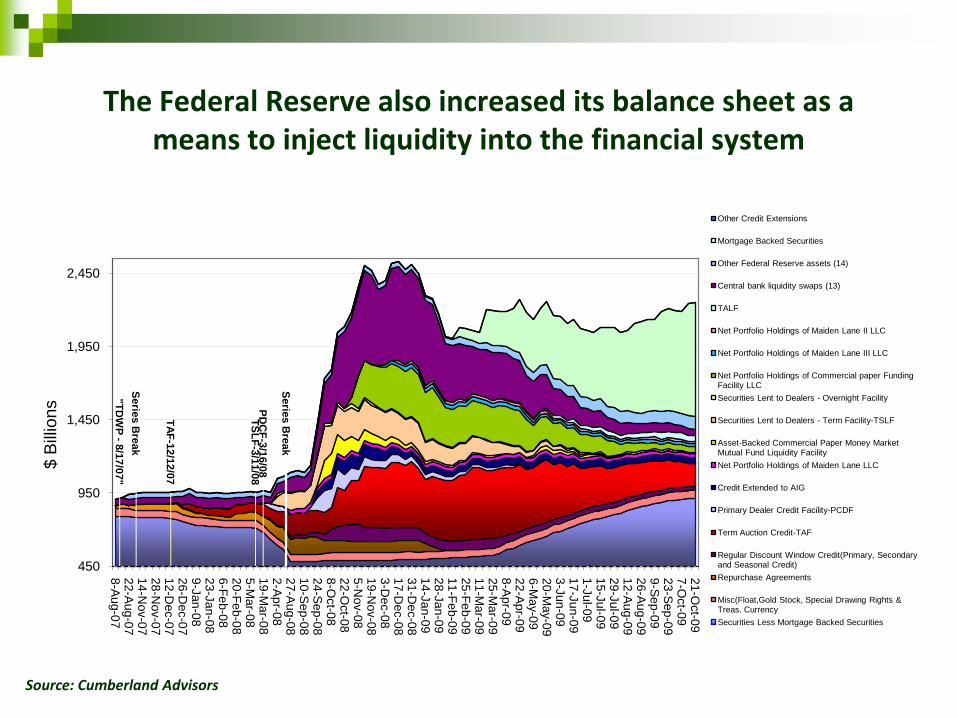
The Federal Reserve also increased its balance sheet as a means to inject liquidity into the financial system
"T
DW
P -
8/1
7/0
7"
TS
LF
-3/1
1/0
8P
DC
F-3
/16/0
8
Serie
s B
reak
TA
F-1
2/1
2/0
7
Serie
s B
reak
450
950
1,450
1,950
2,450
8-A
ug
-07
22
-Au
g-0
71
4-N
ov-0
72
8-N
ov-0
71
2-D
ec-0
72
6-D
ec-0
79
-Ja
n-0
82
3-J
an
-08
6-F
eb
-08
20
-Fe
b-0
85
-Ma
r-08
19
-Mar-0
82
-Ap
r-08
27
-Aug
-08
10
-Se
p-0
82
4-S
ep
-08
8-O
ct-0
82
2-O
ct-0
85
-No
v-0
81
9-N
ov-0
83
-De
c-0
81
7-D
ec-0
83
1-D
ec-0
81
4-J
an
-09
28
-Ja
n-0
91
1-F
eb
-09
25
-Fe
b-0
91
1-M
ar-0
92
5-M
ar-0
98
-Ap
r-09
22
-Ap
r-09
6-M
ay-0
92
0-M
ay-0
93
-Jun
-09
17
-Ju
n-0
91
-Ju
l-09
15
-Ju
l-09
29
-Ju
l-09
12
-Au
g-0
92
6-A
ug
-09
9-S
ep
-09
23
-Se
p-0
97
-Oct-0
92
1-O
ct-0
9
$ B
illio
ns
Other Credit Extensions
Mortgage Backed Securities
Other Federal Reserve assets (14)
Central bank liquidity swaps (13)
TALF
Net Portfolio Holdings of Maiden Lane II LLC
Net Portfolio Holdings of Maiden Lane III LLC
Net Portfolio Holdings of Commercial paper Funding Facility LLC
Securities Lent to Dealers - Overnight Facility
Securities Lent to Dealers - Term Facility-TSLF
Asset-Backed Commercial Paper Money Market Mutual Fund Liquidity Facility
Net Portfolio Holdings of Maiden Lane LLC
Credit Extended to AIG
Primary Dealer Credit Facility-PCDF
Term Auction Credit-TAF
Regular Discount Window Credit(Primary, Secondary and Seasonal Credit)
Repurchase Agreements
Misc(Float,Gold Stock, Special Drawing Rights & Treas. Currency
Securities Less Mortgage Backed Securities
Source: Cumberland Advisors

Both developed and emerging countries injected massive amounts of fiscal stimulus into their economies
3.4%
0.0%
0.3%
0.5%
1.0%
1.3%
1.3%
1.5%
1.7%
1.7%
2.2%
2.4%
2.6%
2.8%
2.8%
3.5%
4.4%
4.5%
5.0%
5.9%
9.2%
0% 2% 4% 6% 8% 10%
G-20
Turkey
Italy
Brazil
Mexico
France
Argentina
U.K.
Russia
India
Japan
Indonesia
South Africa
Korea
Canada
Germany
China
Australia
Spain
U.S.
Saudi Arabia
Fiscal Stimulus as a % of GDP

Various other steps taken by the government also helped to unfreeze the financial market
TARP related capital infusions into systemically important financial institutions
Increase in FDIC deposit insurance limits
Extension of FDIC guarantees to inter-bank loans and to certain public debt issuances

The “Alphabet Soup” of Government Responses
TAF TALF
TSLF TARP
PDCF CAP
AMLF MMIFF
CPFF PPIF
TLGP PPIP
TMMGP SCAP

Concern #1: Is the U.S. Economy becoming too dependent on monetary stimulus?
Long-Term Interest Rates: Choke Points Have Been Progressively Lower
Double
dip
14
12
10
8
6
4
80 85 90 95 2000 05 10
14
12
10
8
6
4
U.S. 10-Year Government Bond Yield
% %
S&L
crisisMid-cycle
slowdown
Mexican
peso crisis Burst tech
bubble Burst
real estate
bubble
© BCA Research 2009

Concern #2: After the fiscal stimulus wears off, then what?
Impact of ARRA 2009 on the Growth of GDP
-2.0
-1.5
-1.0
-0.5
0.0
0.5
1.0
1.5
2.0
2.5
2009.1 2010.1 2011.1 2012.1 2013.1 2014.1 2015.1 2016.1 2017.1
Source: Macroeconomic Advisers, LLC
Ann
ualiz
ed P
erce
nt C
hang
e
1-Quarter
4-Quarter
From ―Fiscal Stimulus to the Rescue – Final Answer‖
(MA’s MACRO FOCUS, February 19, 2009)

Concern # 3: The level of fiscal stimulus is unprecedented and unsustainable
-4%
-2%
0%
2%
4%
6%
8%
10%
12%
14%
16%
55 58 61 64 67 70 73 76 79 82 85 88 91 94 97 00 03 06 09 12
USA Federal Budget Deficit %PGDP 1yr moving avg BW Forw ard-Looking Estimate

How much more debt can the Government issue?

Concern # 4: The debt levels of both U.S. consumers and businesses remain at all-time high
1.1
1.12
1.14
1.16
1.18
1.2
1.22
1.24
1.26
1.28
1.3
60 63 66 69 72 75 78 81 84 87 90 93 96 99 02 05 08
Household Leverage
Leverage levels at highs
Source: Bridgewater
1.3
1.4
1.5
1.6
1.7
1.8
1.9
2.0
2.1
60 63 66 69 72 75 78 81 84 87 90 93 96 99 02 05 08
Non-Financial Business Leverage
Leverage levels at highs

Concern # 4: Growth in consumer spending is likely to remain low as the savings rate rises
0
2
4
6
8
10
12
14
16US Savings Rate %

Concern # 5: Growth in capital spending will be impacted by the spare production capacity already in the system
50
55
60
65
70
75
80
85
90
95
100

Policy objective is to replace private sector debt with public sector borrowing to maintain an “acceptable” level of growth while U.S.
consumers and businesses continue to “delever”
15
10
5
0
70 75 80 85 90 95 2000 05 10
15
10
5
0
U.S. Net Issuance*: Non-Government Debt Gov ernment Debt
% of GDP
% of GDP
* Source: Flow of Funds data.Note: Shaded areas represent NBER-designated periods of recession.
© BCA Research 2009

Change in New Jersey’s Portfolio During FY 2009
Asset Class June 08 June 09 Difference
US Equities 30.8% 25.9% -4.9%
International Equities 17.4% 17.4% 0.0%
Emerging Markets Equities 1.4% 1.9% 0.5%
US Fixed Income 24.1% 29.3% 5.2%
US High Yield 0.9% 2.4% 1.5%
International Fixed Income 2.7% 0.1% -2.6%
Commodities/Real Assets 1.2% 1.0% -0.2%
TIPS 4.5% 5.2% 0.7%
Private Equity 3.4% 4.6% 1.2%
Real Estate 2.4% 2.8% 0.4%
Absolute Return 4.2% 4.3% 0.1%
Cash 7.0% 5.1% -1.9%
Actual $ Millions $78,201 $63,179

FY 2009 Net Purchases/Sales by Quarter
(1,500,000)
(1,000,000)
(500,000)
-
500,000
1,000,000
1,500,000
2,000,000
9/08 12/08 3/09 6/09 9/09
Tho
usa
nd
s
Domestic Equities Domestic Fixed Income Int'l Equities

Notable portfolio moves during FY 2009
Purchase of $2.5 billion of investment grade corporate bonds in August 08 –March 09. Result: Up 21% from November 08 – June 09
Made additional investments of $243 million in several bank loans funds in October 08 in response to margin calls to prevent forced liquidation of nearly $750 million in positions. Result: Up 19% from October 08 – June 09
Bought $2.6 billion in Japanese equities as a means to capitalize on a likely global economic recovery. Result: Too early to tell
In January 2009 cancelled five commitments totaling $365 million to private equity and real estate funds and redeemed $200 million from two hedge fund investments. Result: Preserved liquidity to take advantage of better opportunities in other asset classes

Estimated FY 2009 Performance
Asset Class Actual Benchmark Difference
US Equities -22.84 -26.34 3.5
International Equities -31.17 -31.17 0
Emerging Markets Equities -28.37 -25.40 -2.97
US Fixed Income 6.64 7.38 -0.74
US High Yield 10.38 -2.40 12.78
Mortgages 12.35 9.38 2.97
International Fixed Income 19.73 8.54 11.19
Commodities -43.03 -47.09 4.06
TIPS -3.99 -1.12 -2.87
Private Equity* -25.89 -25.20 -0.69
Absolute Return -17.70 -13.02 -4.68
Real Estate* -32.38 -15.16 -17.22
Cash 1.58 0.80 0.78
Overall Portfolio -14.20 -16.47 2.27
* Returns are through 3/31/09

The Division also exceeded its respective benchmarks in each of its internally managed portfolios over the previous 3 and 5 year periods as well
1-Year 3-Years 5-Years
US Equities -22.84 -5.80 -0.15
Benchmark -26.34 -8.18 -1.94
International Equities -23.98 -3.89 4.71
Benchmark -31.17 -8.14 2.20
US Investment Grade Fixed Income 6.64 7.02 5.52
Benchmark 7.38 6.19 4.85
Annualized Returns

For FY 2009, New Jersey was the top performing fundin the country
State FundFY 09 Estimated
Performance
New Jersey DOI -14.2%
CalSTRS -25.0%
Florida -19.0%
Illinois Teachers -22.3%
North Carolina -14.2%
Ohio Teachers -21.7%
Pennsylvania School Employees -26.5%
Texas Teachers -21.9%
Wisconsin SIB -17.7%
Average of 44 State Funds that have reported FY09 results -19.6%

Over the longer term, New Jersey has consistentlyout-performed its peer group
1 Year 3 Years 5 Years
New Jersey -14.20% -0.73% 3.16%
Wilshire TUCS Category
All Master Trusts -17.00% -2.51% 2.06%
Public Funds -17.06% -2.69% 2.19%
All Master Trusts with Assets > $1 billion -18.13% -2.60% 2.45%
Public Funds with Assets > $1 billion -18.76% -2.69% 2.36%
All Master Trusts with Assets > $5 billion -18.76% -2.47% 2.64%
Public Funds with Assets > $5 billion -18.76% -2.77% 2.41%
Note: Outperformance of 1% for one year equates to $700 million inportfolio value

Putting the Year in PerspectiveThe Division had minimal or no exposure to…..
Debt
Subprime Mortgage Securities
Non-agency Mortgage Backed Securities
CDOs
Asset Back Commercial Paper/SIVs
Student Loan Paper
Equities
Mortgage Brokers
Monoline Insurers
Student Loan Issuers
Thrifts/S&L’s
Auto Makers (GM/Ford)
Freddie Mac/Fannie Mae Common Stock
Rating Agency Stocks (Moody’s & McGraw Hill)
Bear Stearns

S&P 500FY 2009 Returns by Sector
SectorS&P 500
FY09 Returns
Consumer Discretionary -16.60
Consumer Staples -10.20
Energy -41.34
Financials -37.33
Health Care -11.49
Industrials -34.47
Information Technology -18.03
Materials -38.79
Telecommunication Services -19.24
Utilities -28.23
Total -25.82
Energy, Materials and Financials were the biggest drag on the market. We were significantly underexposed to financials for the entire fiscal year.

For FY 2009 “Success” was defined by “Dodging Bullets”
# of Stocks inDOI Universe % Examples
Down >50% 420 20.7% LehmanWashington Mutual
FNMA/FHLMCCitigroup
GMLiz Claiborne
AlcoaCBS
Down 25% - 50% 545 26.8% ChevronBank of America
MonsantoMedtronic
Down 0% - 25% 605 29.8% Exxon MobilProcter & Gamble
MicrosoftJohnson & Johnson
UP 463 22.7% JP Morgan ChaseWells Fargo
OracleMcDonald’s

MSCI EAFE ex-ProhibitedFY 2009 Returns by Sector
SectorMSCI EAFE ex-Prohibited
FY09 Returns
Consumer Discretionary -22.54
Consumer Staples -18.15
Energy -32.72
Financials -36.25
Health Care -19.34
Industrials -32.71
Information Technology -29.84
Materials -44.62
Telecommunication Services -21.99
Utilities -29.98
Total -30.85
Energy, Materials and Financials were also the worst-performing sectors in the international markets. We were significantly
under-exposed to Financials in this portfolio as well.

Emerging market equities rebounded the most in 2009. We are evaluating whether it makes sense to increase our very small
exposure to this asset class.
0
20
40
60
80
100
120
140
S&P 500 MSCI EAFE MSCI EM

Domestic Fixed Income: Participating in the significant turn in High Grade and High Yield Credit was the key to strong performance
FY 2009 Performance by Quarter
BarclaysLong Govt/Credit
BarclaysLong Treasuries
BarclaysLong Credit
BarclaysHigh Yield
July - Sept -3.40 2.82 -8.78 -8.89
Oct - Dec 13.06 18.66 8.16 -17.88
Jan – March -6.16 -5.23 -6.94 5.98
April - June 2.78 -7.14 12.93 12.07

While inflation does not seem to be an imminent threat, both Commodities and TIPS have rebound nicely from their lows in the Fall of 2009
0.00
0.50
1.00
1.50
2.00
2.50
3.00
TIPS Breakeven Inflation SpreadCommodities
-40
-30
-20
-10
0
10
20
30
S&P GSCI TR (%Total Return)

New commitments to Private Equity have slowed in 2009
New Commitments
Source: Thomson Venture EconomicsTM as of June 2009
(US$ in billions)
$93$63
$39 $47 $65
$163$215
$259 $240
$38
$213
$124
$59 $49
$82
$143
$187
$245$242
$52
$0
$100
$200
$300
$400
$500
$600
2000 2001 2002 2003 2004 2005 2006 2007 2008 2009 YTD
Global buyouts Global private equity ex buyouts
While total 2008 fundraising remained strong, there were significantly fewer commitments in 1H 2009 as the broader market went through a downturn

Private Equity: While recent performance has been disappointing, our portfolio is significantly under exposed to the mega-buyout funds, which
were the worst-performing sector of the market
25%
37%
12%
14%
6%
4% 2% 0%
NJDOI PE allocation
LBO
MMBO /SMBO
Distressed
International Buyouts
Mezzanine
Secondaries
Venture Capital
Other
48%
10%
10%
19%
2%
1%
9% 5%
Avg of 4 largest US Pension plans
LBO
MMBO /SMBO
Distressed
International Buyouts
Mezzanine
Secondaries
Venture Capital
Other

Real Estate: The pace of the current correction is unprecedented
65
70
75
80
85
90
95
100
0 1 2 3 4 5 6 7 8 9 10 11 12 13 14 15 16 17 18 19 20 21
Cap
ital
Val
ue
fro
m P
eak
Quarters from Peak
Peak to Trough Write-downs for US Real Estate (NFI-ODCE)Previous Major Correction vs Current through 2nd Qtr Prelim
1990-1994 Correction
Cumulative write-downs over the last three quarters equals five years of the 1990’s downturn
Source: The Townsend Group

Long-Term Real Estate Indices
All sectors show a material correction The premium for taking risk has evaporated (traditional core now outperforming)
-10%
-5%
0%
5%
10%
15%
20%
25%
30%
35%
1994 1995 1996 1997 1998 1999 2000 2001 2002 2003 2004 2005 2006 2007 2008
Real Estate Indices - Rolling Five Year ReturnsAs of June 30, 2009
NCREIF Property Index NCREIF-Townsend High Return Fund Index EPRA/NAREIT Global REIT Index
Source: The Townsend Group

Hedge Funds have rebounded in 2009 as liquidity and market conditions improved
Hedge Fund Performance %
Hedge Fund Style July – December 08 January – June 09
Fund of Funds -19.36 4.27
Credit - Other -33.13 7.95
Credit - Loan Funds -47.11 50.38
Distressed -16.75 14.12
Event Driven -21.09 9.06
Equity Long/Short -21.69 14.48
Multi-Strategy -26.42 12.74

Over The Long Run, Hedge Funds Have Experienced Lower Volatility Than Public Equities
-60.0%
-40.0%
-20.0%
0.0%
20.0%
40.0%
60.0%
Jan-95
Jan-96
Jan-97
Jan-98
Jan-99
Jan-00
Jan-01
Jan-02
Jan-03
Jan-04
Jan-05
Jan-06
Jan-07
Jan-08
Jan-09
S&P 500 Index
HFRI (Hedge Fund) Fund Weighted Index
Rolling 12 Month Returns: 1994 – July 2009

FY 2010 So Far
Asset Class June 09 ($mm) September 09 ($mm)
US Equities 16.4 17.6
International Equities 11.0 12.8
Emerging Markets Equities 1.2 1.2
US Fixed Income 18.5 19.2
US High Yield 1.5 1.7
International Fixed Income 0.0 0.0
Commodities/Real Assets 0.6 0.7
TIPS 3.3 3.7
Private Equity 2.9 3.1
Real Estate 1.8 1.6
Absolute Return 2.7 2.8
Cash 3.2 3.6
Total 63.2 68.2

FY 2010 Investment Performance ThroughSeptember 30, 2009
Asset Class Performance % Benchmark %
US Equities 15.19 16.06
International Equities 19.30 20.03
Emerging Markets Equities 22.57 21.96
US Fixed Income 9.34 8.53
US High Yield 15.52 14.22
International Fixed Income 6.07 2.03
Commodities/Real Assets 4.95 4.24
TIPS 2.79 3.08
Private Equity NA NA
Real Estate NA NA
Absolute Return 6.91 4.11
Cash 0.14 0.04
Total 11.62 11.99

Current Division staff dedicated to internal management
6/30/2009 InvestmentAmount ($mm)
InvestmentProfessional FTEs*
Asset Per InvestmentProfessional ($mm)
Cash Management 14,563 2.5 5,825
Domestic Fixed Income 21,832 1.5 14,555
Subtotal – Fixed Income 36,395 4.0 9,099
Domestic Equity 16,351 8 2,044
Int’l Equity 11,022 4 2,756
Subtotal – Public Equity 27,373 12 2,281
Total 63,768 16 3,986
•Excludes Director and Deputy DirectorFigures are unaudited and are subject to change