New Jersey School Counselor Association Professional ... Jersey School Counselor Association...
64
1 NAEP: CHARTS, CURVES AND CONCLUSIONS National Assessment of Educational Progress (NAEP) New Jersey School Counselor Association Professional Development Conference Ocean Place Resort & Spa Long Branch, NJ October 22, 2007 Barbara Smey-Richman, EdD. New Jersey NAEP Coordinator
Transcript of New Jersey School Counselor Association Professional ... Jersey School Counselor Association...

1
NAEP: CHARTS, CURVES AND CONCLUSIONS
National Assessment of Educational Progress (NAEP)
New Jersey School Counselor Association Professional Development Conference
Ocean Place Resort & SpaLong Branch, NJOctober 22, 2007 Barbara Smey-Richman, EdD.
New Jersey NAEP Coordinator
2
Hi! I’m from the “NJDOE” and I’m
here to help!!
Barbara Smey-Richman, Ed.D.
New Jersey NAEP Coordinator

3
NAEP Rhymes
with “Grape”NAEP is also called the
Nation’s Report Card

4
Session Topics (NAEP 101):
What’s NAEP?NJ results compared
to others Trend linesHit the Achievement
“Gap”(s)

5
What is NAEP?
NAEP was authorized by Congress in 1969 to create a reliable way of determining areas of strengths and weaknesses in the American school system
NAEP is the only test of its kind, and it performs an important function – -to track the achievement of U.S. students over time

6
What is NAEP?
NAEP was created to answer the question:
Are students in American schools learning what they should be learning?

7
What is NAEP?
NAEP’s mission is to produce national and state-level results for student populationsNAEP does not provide individual student, school or district results

8
NAEP Has Many Components
State (Public)
(Grades 4 & 8)
NationalPublic & Nonpublic
Grades 4, 8, & 12 National Public & Nonpublic9, 13, & 17 yr olds
District -Trial(Public)
(Grades 4 & 8)
The National Assessment of Educational Progress
MAIN LONG-TERM

9
Many NAEP Assessments NAEP tests for grades 4, 8 and 12The subjects tested are:
Reading - Math – major focus Writing – ScienceOthers (e.g., civics, history, etc)
NAEP also funds “special studies”NAEP is called the “Gold Standard”

10
NAEP Assessment Schedule
Year National State 2003 Reading, Mathematics Reading, Mathematics
2004 Foreign Language, Long-term Trend
2005 Reading, Mathematics, Science
Reading, Mathematics, Science
2006 U.S. History, Civics, Economics
2007 Reading, Mathematics, Writing
Reading, Mathematics, Writing
2008 Arts, Long-term Trend
2009 Reading, Mathematics, Science
Reading, Mathematics, Science
2010 World History, Geography
2011 Reading, Mathematics, Writing
Reading, Mathematics, Writing
2012 Civics, Foreign Language, Long-term Trend
(Cancelled)
11
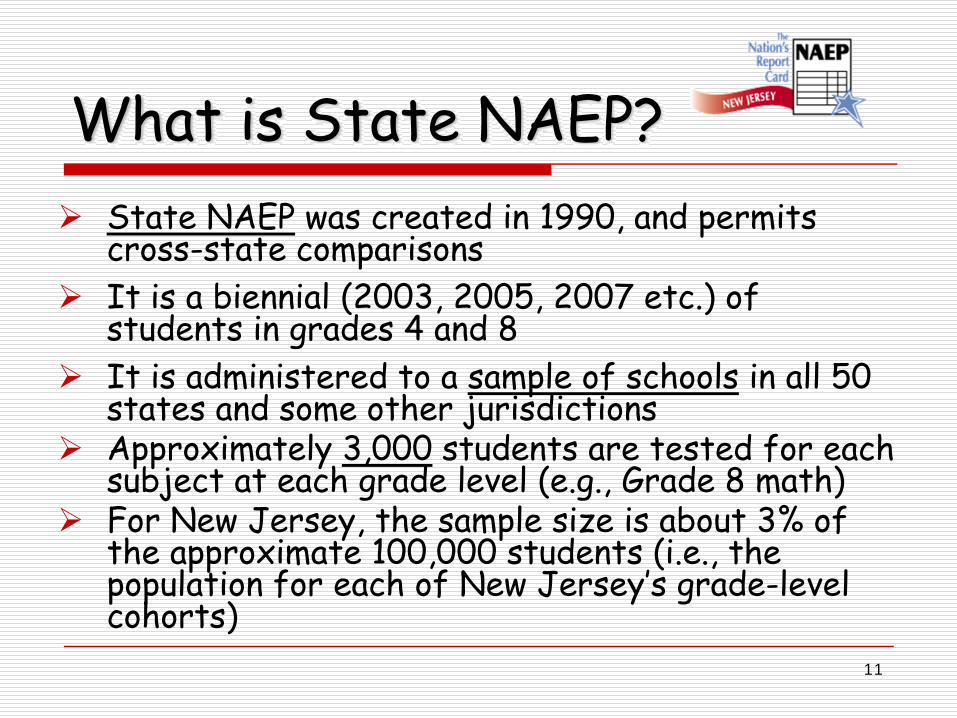
What is State NAEP?State NAEP was created in 1990, and permits cross-state comparisonsIt is a biennial (2003, 2005, 2007 etc.) of students in grades 4 and 8It is administered to a sample of schools in all 50 states and some other jurisdictionsApproximately 3,000 students are tested for each subject at each grade level (e.g., Grade 8 math) For New Jersey, the sample size is about 3% of the approximate 100,000 students (i.e., the population for each of New Jersey’s grade-level cohorts)

12
NAEP
and
New Jersey
Assessments

13
Pop Quiz #1

14
What’s Going on Here?

15
The Power of the Metaphor
Comparing NAEP with the New Jersey
tests is like comparing …??
Apples and Oranges

16
NAEP and State TestsNAEP’s assessment frameworks are developed as a result of a national-based process and reflect a national view
New Jersey’s content standards and test specifications for NJASK 4 and GEPA reflect the New Jersey perspective

17
The Tests Assess Different Content: Conceptual Model
Assessed by NJ LAL, but not by NAEP
WRITING ITEMS
Assessed byNAEP, but not
by NJ LAL
This diagram is only an approximation of how the NAEP reading and New Jersey LAL tests relate to each other. The diagram is not drawn to “scale,” and the extent to which the tests overlap is not based on an alignment study.

18
An Obvious Difference
Language Arts Literacy
Combined TestsCombined Scores only
Reading and Writing
Separate R/W TestsSeparate R/W Scores

19
NJ Tests – How Difficult?NJ state tests are high-stakes with major consequences for students, schools, and districts (AYP)In accordance with NCLB, state tests must assess grade–level performanceCut-scores are determined with the awareness of these two factors

20
NAEP – How Difficult?NAEP is not a grade-level testProficient refers to:
“Aspirational,” world-class performanceMastery of knowledge and skills beyond what is commonly associated the grade assessed
NAEP has no consequences for test takers, but indirect consequences for all schools since used by policymakers

21
NAEP’s Achievement LevelsLevel Descriptors
Basic: Partial mastery of prerequisite knowledge/skills that are fundamental for proficient work (At grade level)Proficient: Solid academic performance --demonstrated competency over challenging subject matterAdvanced: Superior performance
+++++++++++++++++++++++++++++++++++++++++++[Below Basic: Incomplete knowledge/skills necessary
for proficient work]

22
Achievement Levels Labels
Performance equivalency:
NAEP Basic & Above = NJ Proficient & Above

23
What are the Implications?
The definitions of “proficient” set by states and by NAEP have no observable agreement*
* Linn, Robert, Large-Scale Assessment Conference, San Antonio, TX, June 2005
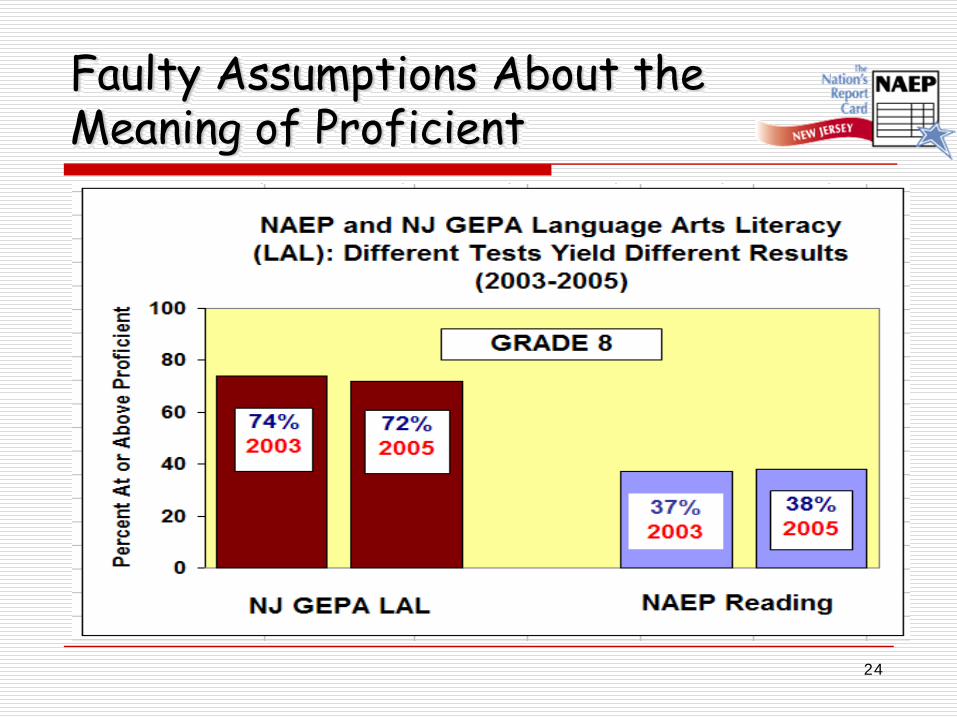
24
Faulty Assumptions About the Meaning of Proficient

25
NAEP 12th Grade Findings
Only National Results
26
High School Transcript Study, 2005
Graduates completed more rigorous curriculum than previous graduates
68% took at least a standard curriculum41% took college prep10% took AP or International Baccalaureate Program
The overall grade-point average (GPA) climbed since 1990 and was 2.98 in 2005

27
Pop Quiz # 2

28
Reading: Achievement Levels Lower in 2005 than in 1992

29
Reading: Scores for Whites & Blacks Lower in 2005 than in 1992, Grade 12

30
Reading Gaps: Unchanged Since 1992, Grade 12 (Scale Scores)
31
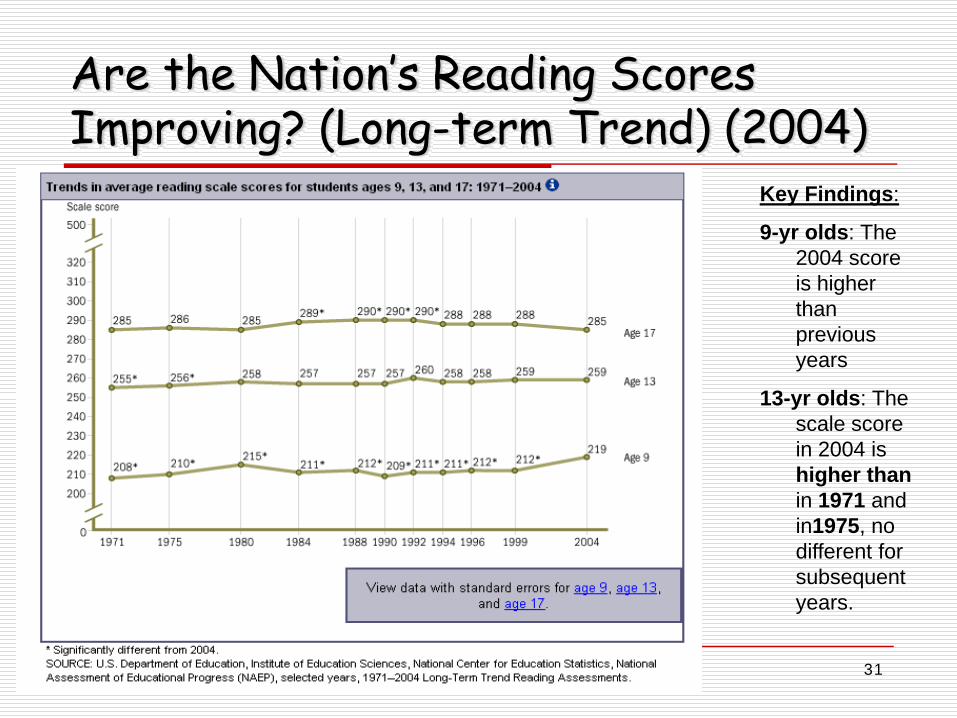
Are the Nation’s Reading Scores Improving? (Long-term Trend) (2004)
Key Findings:
9-yr olds: The 2004 score is higher than previous years
13-yr olds: The scale score in 2004 is higher than in 1971 and in1975, no different for subsequent years.

32
Math: Why Can’t Results Be Compared to Previous Years, Grade 12

33
Math: White and Asians Outperform Others, Grade 12

34
Math 2005: Just 59% At or AboveBasic, Grade 12
35
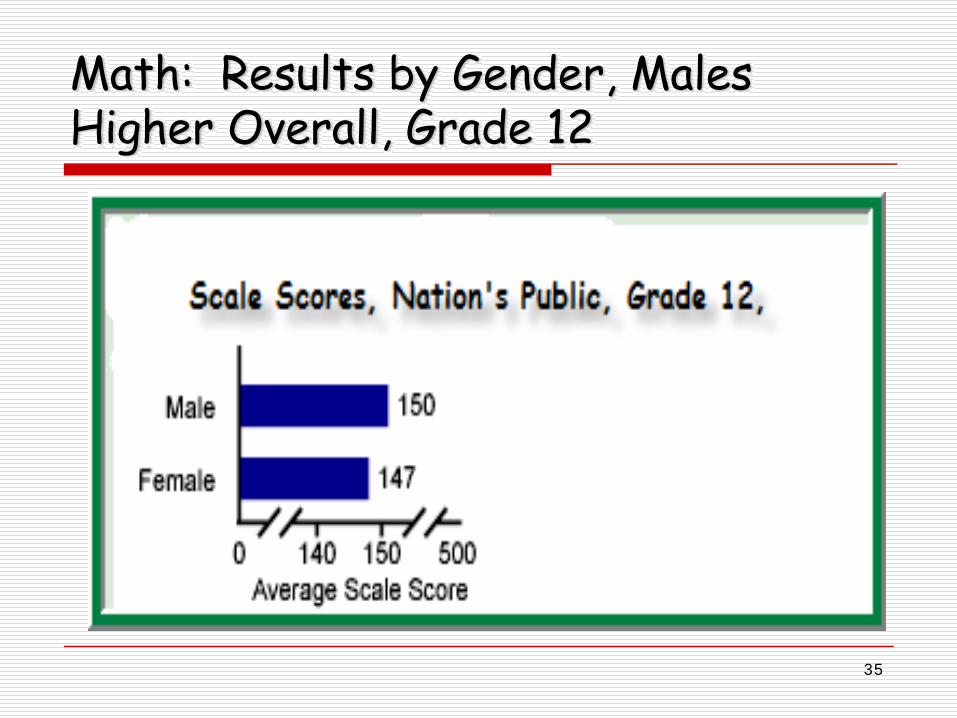
Math: Results by Gender, Males Higher Overall, Grade 12

36
Comparing Jurisdictions With Similar Demographics

37
NJ Is Like States in Northeast

38
How Do the Nation’s Census Regions Compare? Reading, Grade 4
MW NE S W
Midwest (MW)
< > >
Northeast (NE)
> > >
South (S) < < >
West (W) < < <
NAEP 2003 & 2005
NE Compared to Other Regions

39
Pictures at An Exposition
Overall Results
Grades 4 & 8

40
Pop Quiz #3:

41
Grade 4 Reading, 2007 (Scale Scores)

42
We Have
Reason
To Cheer!!

43
Reading 2007 Up for Key Subgroups, Grade 4 (Scale Scores)
GRADE 4 READING
44
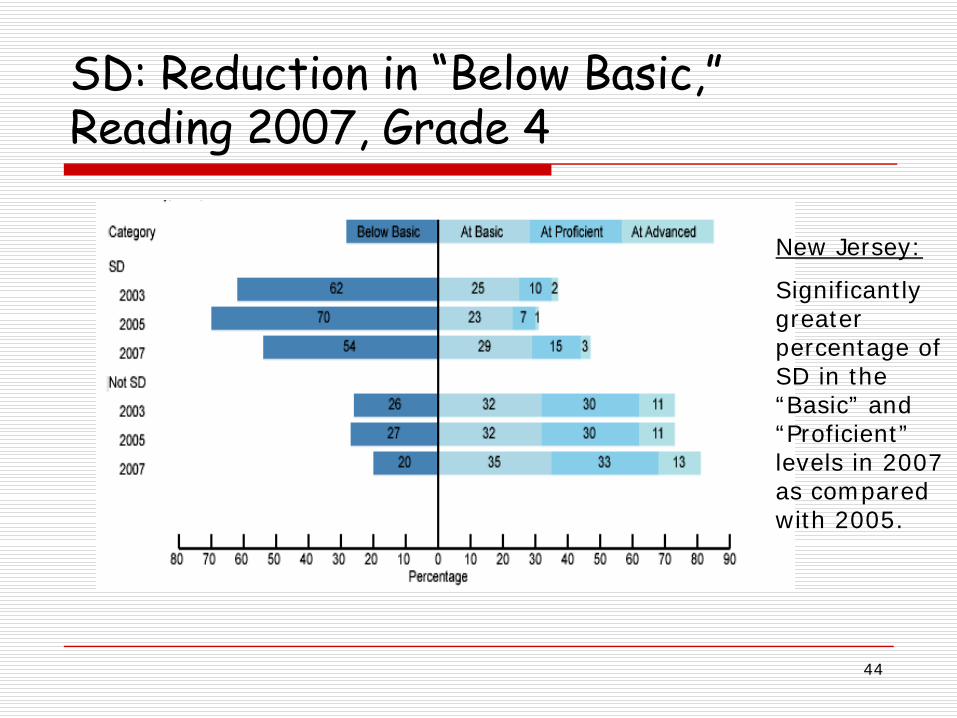
SD: Reduction in “Below Basic,” Reading 2007, Grade 4
New Jersey:
Significantly greater percentage of SD in the “Basic” and “Proficient” levels in 2007 as compared with 2005.

45
Low-Income Gap in NJ NAEP, At/Above Basic, Grade 4 (2003 and 2005)
Below Basic NJ Eligible for Free or Reduced Lunch
Eligible At or Above Basic
For all Comparisons
Eligible < Non Eligible

46
NJASK 4 & the District Factor Groups
Low SES
High SES
From the Instructional Data Management System, www.idms.com

47
Low-Income’s Impact on NJASK 4Abbott/Non-Abbott Districts (2004)
From the Instructional Data Management System, www.idms.com

48
Gender Gap: NJASK 4 –Abbott/Non-Abbott (2004)
Abbott Male
Abbott Female
Non-Abbott Male
Non-Abbott Female
From the Instructional Data Management System, www.idms.com

49
Grade 4 Reading Gaps, 2007(Scale Scores)
The White/Black gap narrowed by 7 scalescore points: (26 pts in 2007 from 33 pts in 2005)The White/Hispanic gap narrowed by 2 scale score points: (24 pts in 2007 from 26 pts in 2005)The male/female achievement gap continued unchanged (6 scale score points in 2007 from 5 scale score points in 2005)

50
These 2007 Reading Gains Did Not Happen by Chance
High Quality Preschool Education Early Literacy Task Force begun in 2002Reading Coaches and Professional Development for Teachers, K-3, though the
Abbott Intensive Early Literacy Program Reading First Grant, and Governor’s Literacy Initiative
Collaboration between the Offices of Special Education and Literacy New Jersey’s Standards and Assessments

51
Grade 4 Mathematics, 2007 (Scale Scores)

52
Math Up for Most Subgroups, 2007

53
SD: Reduction in “Below Basic,” 2007, Mathematics, Grade 4
In 2007, 70% of New Jersey SD students were at or above Basic (i.e. defined as “grade-level” performance for NAEP), compared with 49% of the SD students in 2005

54
Grade 4 Mathematics Gaps, 2007The White/Black gap narrowed by 15scale score points: (23 scale score points in 2007 from 38 scale score points in 1992)
The White/Hispanic gap narrowed by 10scale score points: (21 scale score points in 2007 from 32 scale score points in 1992)

55
Grade 8 Reading (Scale Scores)

56
Grade 8 Reading, 2007New Jersey’s reading results were flatsince 2003 as were the results from the nation’s public schools
There were no changes in the New Jersey racial/ethnic gaps since 2003
57
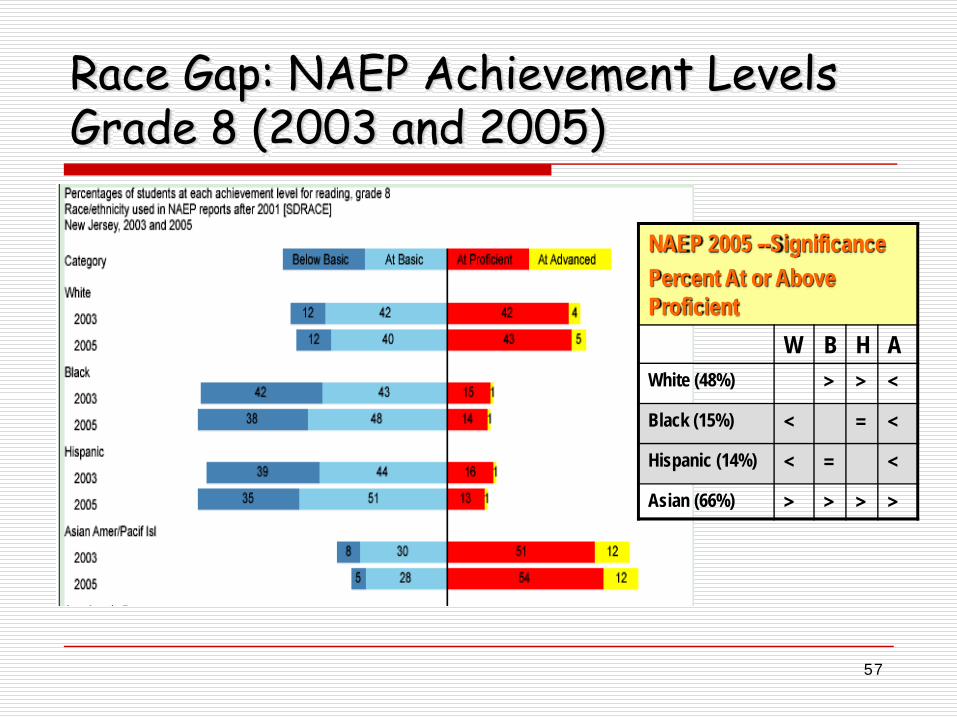
Race Gap: NAEP Achievement Levels Grade 8 (2003 and 2005)
NAEP 2005 --SignificancePercent At or AboveProficient
W B H AWhite (48%) > > <Black (15%) < = <Hispanic (14%) < = <Asian (66%) > > > >

58
Gender Gap: NJ, US, NE, Grade 8
Scale Scores, Grade 8 Reading, 2005
Females Males Scale ScoreDifference
Male/Female Gap
New Jersey 273 266 -8 Significant
National Public
266 255 -11 Significant
Northeast Census Region
272 263 -9 Significant

59
Grade 8 Mathematics, 2007(Scale Scores)

60
Grade 8 Mathematics, 2007New Jersey’s average scale scores were higher in 2007 (289) as compared with all previous tests“Female” was the only demographic group that scores higher in 2007 than in 2005The White/Hispanic gap narrowed by 10 scale score points since 1990: (27 scale score points in 2007 from 37 scale score points in 1990)

61
NAEP 2007 SummaryNew Jersey 4th grade students made significant progress especially in reading and also in mathematics since 2005
New Jersey’s 8th grade students improved in mathematics from 2005 to 2007, but were unchanged in reading

62
CONTACT INFORMATION
Barbara Smey-Richman, EdDNew Jersey Department of EducationOffice of Evaluation and Assessment
P.O. Box 500Trenton, NJ 08625-0500
Tel: (609) 984-1540Fax: (609) 984-6032
Email: [email protected]

63
NAEP on the Web
NJ NAEP:http://www.nj.gov/njded/assessment/naep
National Center for Education Statistics:http://nationsreportcard.gov

64
Do you Have Any Questions?