
NEW JERSEY ENERGY UPDATE MASTER PLAN - … · NEW JERSEY ENERGY MASTER ... Jersey Central Power &...
81
NEW JERSEY ENERGY MASTER PLAN UPDATE New Jersey Board of Public Utilities New Jersey Department of Environmental Protection December 2015
Transcript of NEW JERSEY ENERGY UPDATE MASTER PLAN - … · NEW JERSEY ENERGY MASTER ... Jersey Central Power &...

NEW
JERSEY
ENERGY
MASTER
PLAN
UPDATE
New Jersey Board of Public Utilities
New Jersey Department of Environmental Protection
December 2015
i | P a g e
TABLE OF CONTENTS
Table of Acronyms……………………………………………………………………..………………....ii
Glossary and Definitions…………………………………………………………….…………………....iv
Introduction………………………………………………………………..…………………………..…..1
Five Overarching Goals……………………………………………………………………….………......3
1. Drive Down the Cost of Energy for All Customers……………………………………..…….3
2. Promote a Diverse Portfolio of New, Clean, In-State Generation…………………..……..….5
3. Reward Energy Efficiency and Energy Conservation/Reduce Peak Demand………….……..8
4. Capitalize on Emerging Technologies for Transportation and Power Production….……….11
5. Maintain Support for the Renewable Energy Portfolio Standard………………...……….…12
Plan for Action……………………………………………………………………………...……………15
Expand In-State Electricity Resources………………………………………..…………..….16
Cost Effective Renewable Resources……………………………………………..……..…..22
Promote Cost Effective Conservation and Energy Efficiency……………………….....……33
Support the Development of Innovative Energy Technologies…………………….........…..43
Additional Challenges and Goals Since 2011 Energy Master Plan: Improve Energy
Infrastructure Resiliency & Emergency Preparedness and Response…………………………….……45
Conclusion……………………………………………………………………………………………… 54
Appendix………………………………………………………………………………..…………….…55

ii | P a g e
TABLE OF ACRONYMS
ACE Atlantic City Electric Company
ANSI American National Standards
Institute
BGS Basic Generation Service
BGSS Basic Gas Supply Service
BOEM Bureau of Ocean Energy
Management
BPU Board of Public Utilities
BRA Base Residual Auction
C&I Commercial and Industrial
CC Combined Cycle
CDBG Community Development
Block Grant
CEEEP Center for Energy, Economic, and
Environmental Policy
CEP Clean Energy Program
CHP Combined Heat and Power
CNG Compressed Natural Gas
CO Carbon Monoxide
CO2 Carbon Dioxide
CSP Curtailment Service Provider
DA Distribution Automation
DCA Department of Community Affairs
DEP Department of Environmental
Protection
DER Distributed Energy Resources
DG Distributed Generation
DOE Department of Energy
DOT Department of Transportation
DR Demand Response
EDA Economic Development Authority
EDC Electric Distribution Company
EDF Environmental Defense Fund
EDECA Electric Discount and Energy
Competition Act
EE Energy Efficiency
EMP Energy Master Plan
EPA Environmental Protection Agency
ERB Energy Resilience Bank
ESIP Energy Savings Improvement
Programs
ETG Elizabethtown Gas
ETR Estimated Time of Restoration
FERC Federal Energy Regulatory
Commission
GATs Generator Attributes Tracking
System
GDC Gas Distribution Company
GT Gas Turbine
GW Gigawatt
GWh Gigawatt Hour
HV High Voltage
HVAC Heating, Ventilation and Air
Conditioning
ICP Investor Confidence Project

iii | P a g e
ICS Incident Command System
IECC 2009 International Energy Conservation
Code
IVR Interactive Voice Response
JCP&L Jersey Central Power & Light
Company
kW Kilowatt
LCAPP Long-Term Capacity Agreement
Pilot Program
LNG Liquefied Natural Gas
MW Megawatt
MWh Megawatt Hour
NERC North American Electric
Reliability Corporation
NGV Natural Gas Vehicle
NJAES New Jersey Agricultural
Experiment Station
NJNG New Jersey Natural Gas
NJCAT New Jersey Corporation for
Advanced Technology
NOx Nitrogen Oxides
OCE Office of Clean Energy
OREC Offshore Wind Renewable Energy
Certificate
OWEDA Offshore Wind Economic
Development Act
PSE&G Public Service Electric and Gas
PSN Prepared Sale Notice
PV Photovoltaic
REC Renewable Energy Certificates
RECO Rockland Electric Company
RFS Retail Fuel Station
RGGI Regional Greenhouse Gas Initiative
ROW Right of Way
RPM Reliability Pricing Model
RPS Renewable Portfolio Standard
RTEP Regional Transmission Expansion
Plan
RTO Regional Transmission Organization
SACP Solar Alternative Compliance
Payment
SG Smart Grid
SJG South Jersey Gas
SO2 Sulfur Dioxide
SREC Solar Renewable Energy Certificate
TPS Third-Party Supplier
TO Transmission Owner
iv | P a g e
GLOSSARY AND DEFINITIONS Basic Generation Service (BGS)
The EDCs obtain wholesale power supplies to serve customers who do not shop for their own
power through an annual procurement process that is approved by the Board.
Board of Public Utilities (BPU or Board)
The BPU regulates the EDCs and GDC, participates in the PJM planning process, and
advocates for New Jersey’s interests before FERC. The BPU sets utility rates and reliability
standards, oversees the BGS procurement process; administers the Clean Energy Program,
and approves ratepayer-supported utility programs.
Base Residual Auction (BRA)
Under the RPM construct, PJM conducts annual BRAs to set capacity prices on a locational
basis.
British Thermal Unit (Btu)
A BTU is a standard measure of energy and provides a basis to compare energy sources and uses.
Capacity
Power plant size or capacity is measured in megawatts (MW). Capacity Factor
Capacity factor is the ratio of the actual output of a power plant divided by the theoretical
output of the plant if it had operated at full nameplate capacity the entire time.
Clean Energy Program (CEP)
New Jersey's Clean Energy Program is a statewide program that offers financial incentives,
programs and services for New Jersey residents, business owners and local governments.
Clearing Price
The price as determined by a PJM, or other entity-administered auction, or marketplace. Combined Cycle (CC) CC plants consist of one or more GTs generating electricity where exhaust is captured in a heat recovery steam generator to produce steam that generates additional electricity without the
need for additional fuel. Combined Heat and Power (CHP)
CHP plants, also referred to as cogeneration, provide electric and thermal energy, thus
obtaining high overall efficiency from the fuel.
Compressed Natural Gas (CNG)
Natural gas can be stored under pressure in specialized tanks to substitute for gasoline or other
fuels. Although its combustion does produce greenhouse gases, it is a more environmentally
clean alternative to diesel fuel or gasoline and much less expensive.
v | P a g e
Delivery Year
PJM defines a Delivery Year as the twelve month period from June 1 through May 31. Demand Response
Measures consumers take to minimize their demand for energy. It includes curtailment of
energy or the use of on-site generation of electricity at critical times
Department of Environmental Protection (DEP)
DEP is responsible for protecting the quality of New Jersey’s air, water, land, and natural and
historic resources. It issues permits for air pollution control, water pollution control, land use,
and the management of other environmental impacts.
Dispatch
New Jersey’s generating units are economically dispatched along with virtually all other
plants in the PJM system by PJM operators according to plants’ energy bids that are a
function of the plant’s efficiency, fuel price, and other operating costs.
Distributed Generation
Small-scale electricity production that is on-site or close to the primary users and is
interconnected to the utility distribution system
District Energy System
Systems that provide energy from a centralized location rather than multiple localized facilities.
District energy systems tend to be more efficient and less polluting than multiple local energy
generation systems
Electric Discount and Energy Competition Act (EDECA)
New Jersey’s Electric Discount and Energy Competition Act deregulated the State’s
electricity industry.
Electric Distribution Company (EDC)
Atlantic City Electric (ACE), Jersey Central Power & Light (JCP&L), Public Service Electric & Gas Company (PSE&G), and Rockland Electric Company (RECO). Eastern Mid-Atlantic Area Council (EMAAC)
EMAAC is part of PJM that includes all of New Jersey, Philadelphia Electric, and Delmarva
Power & Light. PJM evaluates reliability, sets capacity prices, and plans transmission upgrades
for this region.
Federal Energy Regulatory Commission (FERC)
FERC has jurisdiction over the interstate sale and transmission of electricity and natural gas, and
regulates PJM.
Gas Distribution Companies (GDC)
Elizabethtown Gas (ETG), New Jersey Natural Gas (NJNG), Public Service Electric and Gas
(PSE&G), and South Jersey Gas (SJG).

vi | P a g e
Gas Turbine (GT)
GTs operate in simple-cycle mode and typically operate as peaking plants with low capacity
factors.
Gigawatt
A Gigawatt (GW) is a unit of electrical capacity equal to 1,000,000,000 watts. Gigawatt-day
A unit of energy, especially electrical energy, equal to the work done by one Gigawatt acting for
one day.
Gigawatt-hour (GWh)
1 GWh is a unit of electrical energy equal to 1,000 MWh or 1 million kWh. High Voltage (HV)
HV transmission normally refers to lines rated 110 kV and above. PJM’s highest voltages for
its backbone transmission system serving New Jersey are 345 kV and 500 kV.
kilowatt (kW)
A kW is a unit of electrical capacity equal to 1,000 watts. It is estimated that a typical
residential home (without electric heating) can have a peak load as high as 8 kW.
kilowatt-hour (kWh)
A kWh is a unit of electrical energy equal to 1,000 watt-hours. According to the DOE, the
average New Jersey residential home consumes almost 700 kWh/month.
Long-Term Capacity Agreement Pilot Program (LCAPP)
New Jersey enacted the LCAPP legislation to facilitate the development of 2,000 MW of
baseload and mid-merit generation facilities for the benefit of in-State electric customers. Locational Marginal Price (LMP)
LMPs are wholesale energy prices set by PJM at each node throughout its system based on
generator and demand-side energy bids and the expected load. PJM operates a Day-Ahead
energy market and a Real-Time balancing energy market. In the predominant Day-Ahead
market, all dispatched plants receive the same LMP (with adjustments for losses and congestion) equal to the bid of the last, most expensive dispatched plant, regardless of their own
bid prices. Mid-Merit
Among conventional generation technologies, mid-merit generation, such as a CC plant, is
moderately expensive to construct, moderately expensive to operate, and has considerable
flexibility. Mid-merit plants are most often dispatched to meet on-peak loads, generally
weekday days.
Megawatt (MW)
A MW is a unit of electrical capacity equal to 1,000 kilowatts or 1,000,000 watts.

vii | P a g e
Megawatt-day
A unit of energy, especially electrical energy, equal to the work done by one Megawatt
acting for one day.
Megawatt-hour (MWh)
A MWh is a unit of electrical energy equal to 1,000 kWh.
Million Cubic Feet (Mcf)
Is a unit of volume of natural gas equal to 1,000 cubic feet of natural gas or approximately
1,000,000 Btus (MMBtu) of natural gas. Nameplate Capacity
Nameplate capacity is the intended technical full–load sustained output of a power plant as
indicated on a nameplate that is physically attached to the plant and is expressed in MW or kW.
Office of Clean Energy (OCE)
The New Jersey Office of Clean Energy oversees the CEP. Oil-to-Gas Price Ratio
The ratio between crude oil ($/barrel) and natural gas ($/MMBtu) prices. Offshore Wind Renewable Energy Certificate (OREC)
ORECs are a specific type of REC created in New Jersey for offshore wind. Peakers
Among conventional generation technologies, peaking plants, such as GTs, are the least
expensive to construct, the most expensive to operate, and can run for just a few hours per day.
PJM PJM is the RTO responsible for planning and operating the electric transmission grid across thirteen Mid-Atlantic and Midwestern states and the District of Columbia. PJM is also the independent system operator that administers the wholesale power markets in its territory to assure bulk system reliability.
Reliability Must Run
Generators operating under Reliability Must Run Agreements receive payments to generate
power as needed to ensure system / grid reliability.
Reliability Pricing Model (RPM)
PJM’s capacity pricing mechanism that attempts to set “market-based” capacity prices for
different regions based on supply-side and demand-side factors submitted in annual auctions.
Renewable Portfolio Standard (RPS)
An RPS is a state requirement that mandates the increased production of energy from renewable
energy sources, such as wind, solar, biomass, and geothermal, to meet a specified goal. Twenty-
nine states and the District of Columbia have RPS requirements.
Renewable Energy Certificate (REC)
A certificate representing the environmental benefits or attributes of one megawatt-hour of

viii | P a g e
generation from a generating facility that produces Class I or Class II renewable energy, but
shall not include a solar renewable energy certificate or an offshore wind renewable energy
certificate.
Regional Transmission Organization (RTO)
A Regional Transmission Organization, e.g. PJM, is an entity responsible for planning and
operating regional electric transmission grids.
Regional Transmission Expansion Plan (RTEP)
The RTEP identifies transmission system upgrades and enhancements to meet operational,
economic and reliability requirements.
Secondary General Service
Refers to PSE&G general lighting and power, ACE monthly secondary general service, and JCP&L and RECO secondary general service. Solar Alternative Compliance Payment (SACP)
The SACP is an alternative compliance payment specifically for SRECs. Solar Renewable Energy Certificate (SREC)
An SREC is a tradable certificate that represents the clean energy benefits of electricity generated
from a solar energy system. An SREC is generated after 1000 kWhs are produced by the solar
system. SREC quantities are established by New Jersey’s RPS, and SREC prices are established
by the competitive market, up to the SACP ceiling.
Therm (t)
Is a unit of heat energy equal to 100,000 Btus or approximately 100 cubic feet of natural gas. It
is a measure a natural gas used converted from volume to energy at the meter.
Third-Party Supplier (TPS)
A BPU-registered company that sells electricity or natural gas supplies directly to an energy user.
This entity includes, but is not limited to, marketers, aggregators and brokers.

1 | P a g e
I. INTRODUCTION
The production and distribution of clean, reliable, safe, and sufficient supplies of energy is
essential to New Jersey’s economy and way of life. Energy is a vital tool of economic growth
and job creation across New Jersey’s entire economy. Economic growth depends on abundant,
affordable supplies of energy. When considering where to locate or expand businesses often
identify energy costs as second only to labor costs in their decision-making process.
New Jersey’s most recent Energy Master Plan was released by the New Jersey Board of Public
Utilities (BPU) in December 2011. It outlined the State’s strategic vision for the use,
management, and development of energy in New Jersey over the next decade. It further serves
as a guide to the present and future energy needs of the State. This document is an update to the
2011 Energy Master Plan (2011 EMP); it is not a rewrite of the 2011 EMP.
The 2011 EMP has guided both the Administration and private-sector decision makers through a
period of economic challenge. It has provided long-term goals and implementation strategies
flexible enough to respond to market changes and new information about the relative merit of
competing energy technologies and strategies. It also helped guide decisions that affected the
State’s environment, most notably New Jersey’s air quality. Energy production and use,
economic growth, and environmental protection are all inextricably linked and must be
considered together. As this report shows, New Jersey is achieving a successful balance among
these three areas.
The impact of energy costs on New Jersey’s economy must be balanced with the economic
benefits offered by the energy sector. The generation and delivery of reliable and safe energy is
a key element of a healthy economy.
The economic data reported by the New Jersey Utilities Association shows the significant capital
infusion offered by all the regulated utilities operating in New Jersey.
The regulated companies serve nearly seven million residential customer accounts and one
million non-residential customer accounts 24 hours a day, 365 days a year. The companies
employ approximately 28,000 men and women for a combined payroll in excess of $2.5 billion
per year. New Jersey’s investor-owned utilities own and operate physical infrastructure valued at
more than $37 billion and have been making capital expenditures in New Jersey averaging more
than $4.4 billion per year – investment that strengthens and enhances the State’s economy and
critical infrastructure.
In addition, these companies contribute approximately $837 million in annual revenues to local
and state government through gross receipts, corporate business, property and various excise
taxes. These positive economic impacts do not account for the employment or other financial
contributions from the generation industry, renewable energy and energy efficiency sectors.
When the utility industry’s substantial financial contribution to the state’s economy are coupled
with the companies’ critical mission of managing and maintaining their infrastructure, which

2 | P a g e
keeps the electric, gas, water and data flowing, it’s easy to appreciate why stable and viable
utility companies are critical for the existence of all businesses and residents in New Jersey.
Included in this update are measures of the State’s progress toward achieving the 2011 EMP
goals. Where circumstances have changed, the update makes adjustments to certain goals. For
example, the 2008 Energy Master Plan warned that natural gas was in short supply and three
times the cost of coal, contributing to much higher costs for both electric and heating customers.
By 2011, however, the energy landscape had changed. The United States had become a dominant
producer of natural gas, driving down electric and heating prices. As a consequence, the 2011
EMP encouraged greater use of natural gas to improve the environmental performance of the
state’s power generating units and to drive down the cost of energy for consumers. This policy
decision was critical to New Jersey’s success in driving down the cost of electricity.
Where goals from the 2011 EMP have been modified or altered in this update, those changes
reflect the effects of a new energy environment.
This EMP Update also includes a new section to address the challenges to New Jersey’s energy
infrastructure identified in the aftermath of Superstorm Sandy. It also includes a report on the
ways in which the Administration is addressing those challenges.
In developing this update, BPU held three public hearings: August 11, 2015 in Newark; August
13, 2015 in Trenton; and August 17, 2015 in Galloway. In addition, written comments were
received by BPU over a 30-day period ending August 24, 2015. A total of 82 individuals offered
comments at the public hearings. In addition, 1093 written comments were received and
reviewed. The written comments were posted to BPU’s website and can be found at
http://nj.gov/emp/comments/2015/approved/comments_archive.html. In preparing this update,
BPU considered all of the comments offered on all relevant topics in the public hearings and
submitted in writing.
Following the public hearings, a draft EMP Update was completed. BPU released that document
for public comment on November 20, 2015. This draft EMP Update and notice were posted at
http://www.nj.gov/emp/index.shtml. The Public Comment period was open until December 4,
2015. Thirty comments were submitted by individuals, organizations, companies and regulated
energy utilities. These comments can be found athttp://www.nj.gov/emp/ comments/2015/
approved/comments_archive.html. The EMP Committee carefully considered the comments it
received in finalizing this EMP Update.
Finally, this EMP Update will help ensure that New Jersey continues to advance the goals of the
2011 EMP, meets the new challenges which have arisen since 2011, and meets the needs of a
thriving and prosperous state.

3 | P a g e
II. FIVE OVERARCHING GOALS
The 2011 EMP contains five overarching goals:
1. Drive Down the Cost of Energy For All Customers
2. Promote a Diverse Portfolio of New, Clean, In-State Generation
3. Reward Energy Efficiency and Energy Conservation/Reduce Peak Demand
4. Capitalize on Emerging Technologies for Transportation and Power Production
5. Maintain Support for the Renewable Energy Portfolio Standard
Over the past 3 years New Jersey has made substantial progress in advancing these five
overarching goals. This section of the EMP Update summarizes the progress made toward
meeting each of the five goals.
Periodic reporting on the progress towards achieving the goals of the 2011 EMP:
Identifies when progress toward a goal is on target;
Provides the opportunity to make for midpoint corrections in policies or programs when
needed; and
Allows the State to identify new challenges due to changing circumstances affecting the
energy environment.
1. Drive Down the Cost of Energy For All Customers
Since the issuance of the 2011 EMP, electricity prices in New Jersey have fallen across all
customer classes. Based in part on the decrease of the average electricity prices among the four
EDCs between 2011 and 2015, the state has dropped from having the fourth highest costs in the
nation to tenth highest costs. 1 This is progress, but it is not enough. New Jersey should continue
to pursue measures that will help drive down prices even further, especially because future costs
associated with building significant new transmission infrastructure will place upward pressure
on prices.
Today, New Jersey’s natural gas prices are among the lowest in the country. Prices in our state
were the 17th
highest in the nation in 2011; today we rank 46th
.2 This huge decrease was
anticipated in the 2011 EMP and has been critical to successfully reducing the cost of electricity
and improving the environmental performance of New Jersey’s electric generation.
The State’s commitment to actively promote new electric natural gas generation and the
enhancement and expansion of the natural gas transmission and distribution system, has helped
1 http://www.eia.gov/state/rankings The ranking is from highest (1) to lowest (50) 2 http://www.eia.gov/state/rankings. The ranking is from highest (1) to lowest (50)
4 | P a g e
to reduce energy costs. Over the past several years, more than $1 billion in new and upgraded
natural gas distribution infrastructure has been added in New Jersey. This has helped to
moderate New Jersey energy prices overall and has the potential to increase economic
development in the State.
Looking beyond the price of electricity and natural gas, the word “energy” also can be used to
encompass all sources that produce power. It includes electricity and the sources that generate it,
fuels used for heating and industrial processing, and fuels used for transportation. Although retail
electricity prices range higher relative to other states, the latest data from the United States
Energy Information Agency (EIA) and Gas Buddy shows that the average New Jersey energy
customer has a lower overall energy cost than most of the country when combining the cost of
electricity, natural gas, and gasoline.
This simple fact, when viewed from the perspective of state energy policies, can assist the State
in its overall economic development efforts, especially in industries that use natural gas as a raw
material in the development of products, such as the pharmaceutical and chemical industries. It
also can assist in developing and expanding clean in-state electric generation, including
renewables and distributed generation, as well as advancing energy efficiency and demand
response given the customers availability to potentially finance projects.
New Jersey also offers a number of programs designed to assist low and moderate income New
Jersey households. The Board created the Universal Service Fund (“USF”) to help make energy
more affordable for qualifying households. The Board also established the Temporary Relief for
Utility Expenses (“TRUE”) and Payment Assistance for Gas and Electric (“PAGE”) programs to
assist low and moderate income New Jersey households experiencing a temporary financial
crisis. The Board mandated a Winter Termination Program (“WTP”), which protects specific
categories of customers from having their gas or electric service shut off between November 15th
and March 15th
.
In addition, the Lifeline Program, administered by the NJ Department of Human Services
provides an annual benefit to seniors and the disabled who meet eligibility requirements; and the
Low Income Energy Assistance Program (“LIHEAP”), administered by the NJ Department of
Community Affairs, helps New Jersey households including some renters pay for heating costs
and certain medically necessary cooling expenses.
Further reductions in the cost of energy, especially electricity, will help to increase the State’s
economic competitiveness.

5 | P a g e
2. Promote a Diverse Portfolio of New, Clean, In-State Generation
New Jersey has made significant progress toward achieving a diverse portfolio of clean energy.
The State’s promotion of new electric natural gas generation has contributed to this progress.
Currently, more than 2,000 megawatts (MW) of new combined cycle natural gas generation units
are under construction and all will be operational by 2015-2016 calendar years.3 This newer,
more efficient generation will help maintain lower wholesale prices for electricity, reduce
emissions, and maximize integration of variable and intermittent power produced by renewable
energy sources.
New Jersey also has benefitted from the enhancement and expansion of its natural gas
transmission and distribution systems. Expanding and upgrading the natural gas inter- and intra-
state pipelines will help further lower the cost of energy to New Jersey’s homeowners and
businesses and reduce emissions. BPU has approved almost $1 billion for natural gas utility
infrastructure upgrades and mitigation projects. An additional $280 million in proposed projects
is pending.
New Jersey enjoys some of the lowest emission rates from power plants in the country.
According to the U.S. Energy Information Administration (EIA), New Jersey’s sulfur dioxide
(SO2) emissions are among the three lowest states in the nation, and its nitrogen oxide and
carbon dioxide (CO2) emissions are among the six lowest states in the nation. In comparison to
the other states in the 13-state PJM regional transmission region, New Jersey ranks, by far, the
lowest of all.
*(Vermont excluded; limited power sector); Source of Base Data: 2013 EIA State Historical Tables 1991-2013 (www.eia.gov/electricity/data/state ); Emission Rate calculated as: (total emissions in Metric Tons/total generation in MWh) X 2,204.6 pounds/metric ton.
3 Source: PJM market data and DEP Air Permits.
21
29
2
09
6
20
01
1
97
5
19
06
1
88
5
18
51
1
75
4
16
66
1
64
5
16
40
1
59
5
15
94
1
52
4
15
07
1
40
5
13
85
1
36
5
13
50
1
34
1
13
10
1
27
9
12
59
1
25
7
11
65
1
07
7
10
75
1
06
2
10
57
1
05
5
10
36
1
00
2
99
7
99
4
98
8
98
1
94
9
94
5
70
4
66
7
63
2
57
8
54
2
54
0
53
8
38
4
35
0
28
2
24
2
0
500
1000
1500
2000
2500
WY
KY
WV IN ND
MO UT
NM NE
OH
CO HI
WI
IA KS
MI
OK
AR
MT
DE
TX AK LA
MN
MD AZ FL IL PA
TN GA RI
NC
VA
MA AL
NV
MS
SD SC CA
ME
NY
CT NJ
NH
OR ID
WA
lb/M
Wh
State*
All Sources CO2 Emission Rate (lb/MWh), 2013

6 | P a g e
And, looking just at the fossil-fuel sector, New Jersey’s existing electric generation power sector
already beats the carbon dioxide standards for new fossil electric generators contained in the U.S.
Environmental Protection Agency’s (EPA) “Clean Power Plan.” These low levels of emissions
are especially impressive given the fact that New Jersey is the 22nd
largest generator of electricity
in the nation. (See Appendix, p. 58-63, 64, 65, 67, 68).
New Jersey’s four nuclear power plants (at two sites) produce, on average, about 50 percent of
New Jersey’s electric power. Because nuclear power plants do not emit greenhouse gases and
criteria pollutants, nuclear power generation in New Jersey is a critical component of the State’s
clean energy portfolio.
The State is ranked among the top three states in the nation in PV solar energy capacity and
ranks second for “net-metered” PV solar generation.4 Net-metered systems produce and use
energy on-site. Most net metered solar PV systems are located on existing rooftops and do not
present land use issues. Some large scale, ground mounted net-metered projects or grid-supply
projects can consume significant amounts of open space, sometimes measured in square miles.5
The results of the rankings, BPU’s solar PV installation reports and the recent amendments to the
Solar Act reflect the State’s commitment to this clean, renewable energy source while not
sacrificing open space to achieve this goal.
Since 2011, nearly 100 MW of new Distributed Generation (DG) Combined Heat and Power
(CHP), and fuel cell power generating facilities have been installed. We recognize the
importance of these DG technologies for decreasing dependence on the grid and increasing
energy resilience – important lessons underscored by the experience from Superstorm Sandy.
Both of these technologies are critical to reducing emissions from our power sector.
Combined heat and power facilities, MW for MW, yield approximately three times the carbon
reduction benefit of photovoltaic (PV) solar and, in comparing the State’s investment in dollars
per ton of CO2 displaced, CHP has received roughly 1/20th
the financial support of PV
solar. The development of financing programs through the Energy Resilience Bank (ERB),
coupled with policy changes and other incentives in place since the 2011 EMP, will further assist
in advancing progress toward this goal. 6
The development of microgrid projects, including single building, campus-wide and advanced
microgrids to address enhanced energy resilience will also help meet the goal for new DG, CHP,
and fuel cells. Two advanced microgrid studies funded by the U. S. Department of Energy
4 U.S. SOLAR MARKET INSIGHT REPORT - 2014 YEAR IN REVIEW - FULL REPORT GTM Research for the Solar Energy
Industries Association http://www.njcleanenergy.com/renewable-energy/project-activity-reports/installation-summary-by-technology/solar-installation-projects. 5 Approximately 5 acres of land are required per MW of solar PV installed capacity.
6 The Energy Resilience Bank (ERB) was initially managed and overseen by both BPU and EDA as set forth in a
subrecipient agreement and as approved by both Boards. Subsequently the management and oversight for the ERB was transferred directly to the EDA with BPU providing technical support in an amended subrecipient agreement as approved by both Boards.

7 | P a g e
(DOE) in partnership with BPU have been completed – one in Hoboken and one for NJ
TRANSIT.
NJ TRANSIT sought funding to implement the microgrid study as part of the DOE/BPU
partnership and, on November 5, 2014, the U.S. Department of Transportation awarded to NJ
TRANSIT $409,764,814 in competitive federal funding to advance the project: a first-of-its-
kind microgrid capable of providing highly reliable power to support critical transit
services. “NJ TRANSITGRID,” as the project will be called, will include DG, CHP, and fuel
cell elements.

8 | P a g e
Between 2011 and 2014, electricity usage in New Jersey from in-state sources increased slightly
from 65 million MWh to 67 million MWh. Significantly, however, imports from out-of-state
substantially declined from 15 million MWh to 9 million MWh, demonstrating a net decrease in
overall consumption from 80 million MWh to 76 million MWh between 2011 and 2014. (See
Appendix, p. 66).
*In 2013, NJ imported approximately 9% of its electricity needs (Source: NJDEP) Source of base data: USDOE/EIA, 30 September 2015 ( http://www.eia.gov/electricity/state/newjersey/)
As the chart below shows, New Jersey’s in-state electricity generation by fuel type has changed
significantly since 2011. In-state electricity generation is measured as the total retail sales, less
the out-of-state imports. Notably, imports now only account for approximately 12% of New
Jersey’s total electricity usage. Between 2011 and 2014, coal in-state generation was cut in half,
from 8% to 4%; renewables doubled, from 2% to 4%; natural gas increased by one-third, from
33% to 44%; and nuclear held steady at an average of about 50 percent (the annual rate
fluctuates due to scheduled and unscheduled outages). With the drop in natural gas prices,
electricity demand has increasingly been met by cleaner, in-state, combined cycle natural gas
generation (NGCC) and less on imported power from facilities with higher, more polluting,
emission profiles. (See Appendix, p. 57).
-
10
20
30
40
50
60
70
80
19
90
19
91
19
92
19
93
19
94
19
95
19
96
19
97
19
98
19
99
20
00
20
01
20
02
20
03
20
04
20
05
20
06
20
07
20
08
20
09
20
10
20
11
20
12
20
13
Mill
ion
Me
gaw
att-
ho
urs
(M
Wh
)
Year
New Jersey Net In-State Generation and Imported Electricity, 1990 - 2013
Net In-state(70% increase)
Imported (70% decrease)
Linear (Imported (70%decrease))

9 | P a g e
Source of Base Data: EIA State Electricity Profiles – New Jersey
3. Reward Energy Efficiency and Energy Conservation/Reduce Peak Demand
The State has implemented a variety of Energy Efficiency (EE) and conservation programs,
including CHP programs, to advance the goal of improving energy efficiency, conserving energy
and lowering ratepayer costs by reducing our peak demand, which effectively determines a large
portion of our total electricity bill. The State’s wide array of conservation, EE, and CHP
programs were designed to be a cost-effective way to reduce energy and capacity costs and
reduce emissions. Nevertheless, as the State’s energy portfolio changes, programs that were
once cost-effective may no longer provide the same savings.
The New Jersey Clean Energy Program’s (NJCEP) programs assist ratepayers with reducing
energy need and reducing costs. These programs have resulted in savings of over 4 million MWh
of electricity and 80 million therms of natural gas, between Calendar Year (CY) 2001 and Fiscal
Year (FY) 2014. They also resulted in over 860 MW of peak demand reduction during this same
time period. These energy savings by customers have the net result of less electricity and natural
gas having to be produced, generated, transported and distributed through the energy systems.
The NJCEP programs help to lower the overall environmental impact of energy usage and, in the
case of peak demand reductions, help to reduce costs to all ratepayers. The BPU is currently in
the process of transitioning from three market managers to a single market manager, which is
expected to further develop cost savings and efficiencies.
1%
8%
33%
56%
2% 0.1%
3%
43%
51%
2% 0.3%
3%
42%
52%
2.3% 1% 4%
44% 47%
4%
0%
10%
20%
30%
40%
50%
60%
Petroleum Coal Natural Gas Nuclear Renewables
New Jersey Electricity Generation by Fuel Type (%), 2011-2014
2011
2012
2013
2014

10 | P a g e
The CY 2001 program operated for less than six months during the initial startup of the programs. The 2012- 2013 program year
is extended to 18 months due to changeover from a calendar to a fiscal program year. Data from the NJCEP programs -
http://www.njcleanenergy.com/main/public-reports-and-library/financial-reports/clean-energy-program-financial-reports
The NJCEP reporting was initially based on a calendar year (CY) basis. The CY 2001 program operated for less than six months
during the initial startup of the programs since the program was approved by the BPU as of March 2001 and was not operation
until June 2001. The 2012- 2013 program year was extended to 18 months due to changeover in that year from a calendar year to
a fiscal program year reporting. Data from the NJCEP programs - http://www.njcleanenergy.com/main/public-reports-and-
library/financial-reports/clean-energy-program-financial-reports.
0
100,000
200,000
300,000
400,000
500,000
600,000
700,000
MW
h
Years
NJCEP Annual Electricity Saving 2001 -2014
0
20,000
40,000
60,000
80,000
100,000
120,000
140,000
kW
Years
NJCEP Electric Peak Demand Reduction 2001-2014

11 | P a g e
The chart below shows the impact of energy efficiency measures on electricity use in New
Jersey, illustrating both the actual usage and what the expected usage would have been absent
any energy efficiency programs.
NJ Historic electric sales from EIA: http://www.eia.gov/electricity/data/state/sales_annual.xls. NJ electric energy savings from
http://www.njcleanenergy.com/main/public-reports-and-library/financial-reports/clean-energy-program-financial-reports
In addition to the peak demand from NJCEP programs, demand reduction (DR) programs are
operated through electric distribution companies (EDCs) and third party curtailment service
providers (CSPs). These programs include appliance cycling and large customer curtailment
programs, which further reduce annual demand by approximately 200 MW, providing both
economic and environmental benefits for ratepayers.
Furthermore, the EDCs and gas distribution companies (GDCs) operate EE and/or RE programs
in their services territories. An amendment to the Electricity Discount and Energy Competition
Act (EDECA) in 2008 allowed the EDCs and GDCs to implement EE and renewable energy
(RE) programs on their side of the meter (distribution supply side) or the customer side of the
meter (demand side).
Since the EDECA amendment was enacted, Public Service Electric & Gas (PSE&G), New
Jersey Natural Gas, South Jersey Gas, and Elizabethtown Gas have been approved to operate
natural gas EE programs in their respective service areas. Rockland Electric Company and
PSE&G have submitted, and been approved, to operate electric EE programs in their service
areas. These programs complement and enhance the NJCEP EE programs. The BPU is currently
exploring ways to enhance and expand these programs to achieve a higher degree of cost
effective energy savings.

12 | P a g e
4. Capitalize On Emerging Technologies For Transportation and Power
Production
New Jersey will continue to evaluate emerging energy technologies for energy production and
transportation, but will concentrate on implementing new technologies that are cost effective,
that advance both economic development and environmental quality, but have yet to penetrate
the market. For example, CHP has proven its worth in terms of cost, reliability, emission
reduction, and resiliency, but has been slow to take hold in the business sectors for which it is
primarily suited. Similarly, there have been advances in transportation technologies that make
electric, natural gas, and hybrid technology worthwhile for heavy duty and passenger vehicles,
but the markets are not yet fully developed.
Energy markets can change quickly and therefore can affect the success or failure of virtually
any technology. These changes have been most noticeable in the recent price decreases of
petroleum and natural gas. It is worth noting that the 2008 EMP warned of overreliance on
natural gas due to its high costs and lack of supply. The markets dramatically changed by the
time of issuance of the 2011 EMP, with the United States transforming from a major importer to
a dominant world source of natural gas and petroleum.
New Jersey has many options to pursue for clean and cost-effective sources of electricity, to
utilize fuels more efficiently, and to reduce reliance on gasoline and diesel fuel as transportation
fuel. These technologies will reduce emissions, create jobs, and help businesses throughout the
State.
In addition, consumers seeking to purchase energy efficient products also increasingly have more
choices available to them. Consider that as recently as 2010, Chrysler did not have any vehicles
delivering 30 mpg; now, it manufactures a half dozen. And in 2012, General Motors sold more
than one million vehicles that deliver 30 mpg or better. Last year, Ford offered eight models that
are expected to deliver 40 mpg or higher. These trends in fuel efficiency are expected to
continue.
As of June 2014, a total of 222,590 plug-in vehicles have been sold since the mass market roll-
out in late 2010. The June 2014 number reflects 99% growth over the 111,962 sold through June
2013. In a single year-over-year comparison, 110,628 plug-ins were sold from July 2013
through June 2014, a 46% increase over the 76,045 sold between July 2012 and June 2013. The
drop in petroleum prices will likely affect this trend, slowing EV sales and driving an upsurge in
purchases of light trucks and SUVs. Market forces and consumer interest can quickly
overwhelm policy objectives.
Battery Electric Vehicles (BEVs), Plug-in Hybrid Electric Vehicles (PHEVs), and natural gas
heavy duty vehicles have the potential to increase energy efficiency and reduce emissions in the
transportation sector. Worldwide, the automobile industry has made strides in the development
of electric-hybrid and electric and natural gas passenger vehicles.
13 | P a g e
The State must continue to expand its efforts to promote the use of alternative fuel vehicles.
The State is committed to promoting and removing barriers to the development of infrastructure
needed throughout the state to encourage heavy duty vehicle class conversion from expensive
and polluting diesel fuel to less costly and clean natural gas (CNG and LNG). The State will
continue to facilitate the infrastructure needed to support broader use of alternatively-fueled
vehicles by fleet owners as well as individuals. The State will also promote new and cleaner in-
state power generation and the improvement of our electric grid, which will be needed as the
electric vehicle industry continues to grow on a state and national scale. The BPU and DEP are
exploring programs they can develop and implement to enhance and expand the use of alternate-
fueled vehicles.
5. Maintain Support for the Renewable Energy Portfolio Standard
New Jersey remains committed to meeting the renewable energy production target of 22.5% by
2021, which was established by BPU in 2006, and adopted in subsequent energy master plans
published in 2008 and 2011.7 As set forth at N.J.S.A. 48:3-51, New Jersey statutes define two
types of renewables, Class I and Class II.
"Class I renewable energy” means electric energy produced from solar technologies,
photovoltaic technologies, wind energy, fuel cells powered by a renewable fuel, geothermal
technologies, wave or tidal action, small scale hydropower facilities with a capacity of three
megawatts or less and that were put into service after the effective date of P.L.2012, c.24, and
methane gas from landfills or a biomass facility, provided that the biomass is cultivated and
harvested in a sustainable manner.
"Class II renewable energy” means electric energy produced at a hydropower facility with a
capacity of greater than three megawatts (MW) and less than 30 MW, or a resource recovery
facility, provided that such facility is located where retail competition is permitted and provided
further that the Commissioner of the New Jersey Department of Environmental Protection (DEP)
has determined that such facility meets the highest environmental standards and minimizes any
impacts to the environment and local communities.
The State’s RPS can be met by both in-state electricity generation as well as electricity delivered
throughout the PJM region. Compliance with the Class I, Class II and Solar renewable energy
portfolio standards (RPS), other than for small scale hydropower facilities and solar PV, can be
accomplished through purchase of renewable energy certificates (REC) generated by facilities
supplying the PJM region, but solar and small scale hydropower facilities must be connected to
the New Jersey distribution system in order to generate RECs for compliance with the RPS.
7 Based on recent amendments to N.J.S.A 48:3-87 the total Class I, Class II and Solar RPS will be 24.39% in Energy Year 2028.
14 | P a g e
A REC, Solar REC (SREC) or Offshore wind REC (OREC) represents the environmental
attributes of renewable energy and does not represent the actual electricity generated by the
renewable energy source. The actual electricity generated from the renewable source is either
unbundled or sold separately into the PJM Energy Market, or used onsite through net-metering.
A history of the RPS is available at http://www.njcleanenergy.com/renewable-energy/program-
activity-and-background-information/rps-background-info. The total minimum RPS requirement
for Energy Year 2028 is 24.39%.
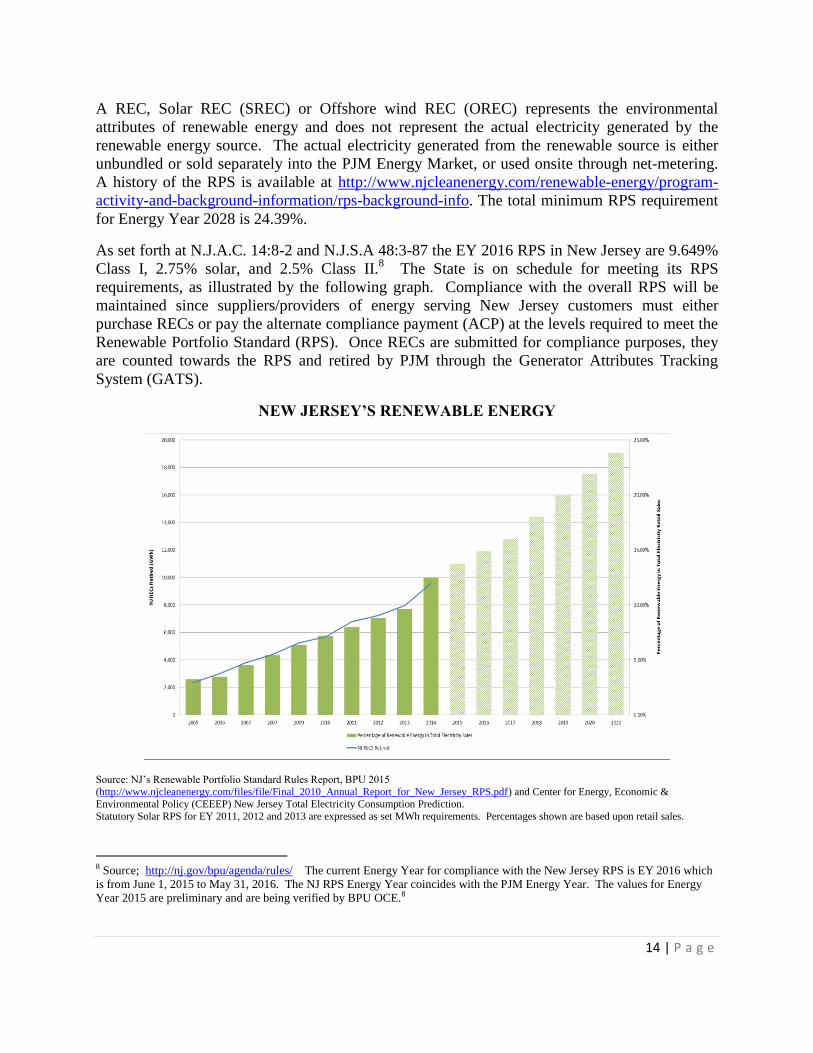
As set forth at N.J.A.C. 14:8-2 and N.J.S.A 48:3-87 the EY 2016 RPS in New Jersey are 9.649%
Class I, 2.75% solar, and 2.5% Class II.8 The State is on schedule for meeting its RPS
requirements, as illustrated by the following graph. Compliance with the overall RPS will be
maintained since suppliers/providers of energy serving New Jersey customers must either
purchase RECs or pay the alternate compliance payment (ACP) at the levels required to meet the
Renewable Portfolio Standard (RPS). Once RECs are submitted for compliance purposes, they
are counted towards the RPS and retired by PJM through the Generator Attributes Tracking
System (GATS).
NEW JERSEY’S RENEWABLE ENERGY
Source: NJ’s Renewable Portfolio Standard Rules Report, BPU 2015
(http://www.njcleanenergy.com/files/file/Final_2010_Annual_Report_for_New_Jersey_RPS.pdf) and Center for Energy, Economic &
Environmental Policy (CEEEP) New Jersey Total Electricity Consumption Prediction.
Statutory Solar RPS for EY 2011, 2012 and 2013 are expressed as set MWh requirements. Percentages shown are based upon retail sales.
8 Source; http://nj.gov/bpu/agenda/rules/ The current Energy Year for compliance with the New Jersey RPS is EY 2016 which
is from June 1, 2015 to May 31, 2016. The NJ RPS Energy Year coincides with the PJM Energy Year. The values for Energy
Year 2015 are preliminary and are being verified by BPU OCE.8
15 | P a g e
In EY 2012, the RPS for both Class I and Class II renewable energy was achieved through a
combination of in-state and out-of-state sources. All of the solar renewable energy to meet the
solar RPS was provided by in-state sources.
Renewables installed in New Jersey advance the State’s goal of increasing diverse, clean in-state
generation. The Solar Act of 2012, signed by Governor Christie, has helped to lower the long-
term cost of solar to the ratepayer by lowering the SACP and has stabilized the solar market.
2.75% of the electricity used by New Jersey electric customers will be generated from solar after
this full Energy Year and only a handful of states can make this claim. New Jersey is third in the
nation for total installed solar capacity, behind only California and Arizona9. The Solar Act of
2012 successfully stabilized the SREC market by boosting the RPS for several years and
protected ratepayers through a reduction in the RPS requirements originally scheduled for later
years.
Solar energy dominates New Jersey’s in-state renewable electricity generation. It has required
policy support and significant subsidies to implement. However, the significant drop in the cost
of solar means this policy should be continually evaluated, especially if solar reaches parity with
the cost of grid power. Given the current cost projections, this will occur in the foreseeable
future with larger commercial and grid supply systems. The added costs associated with
upgrades to the electric transmission and distribution grid become increasingly critical to
consider as this intermittent renewable energy technology becomes a larger part of New Jersey’s
energy portfolio.
New Jersey’s limited ability to generate renewable energy in-state is due to its constrained
geographic size, dense development, and limited climatic and natural resource features (e.g.,
solar radiance, wind, and hydrologic assets). Overall, 24% of the RPS is coming from in-state
sources and 76% from out-of-state sources. The REC is supplied through a market mechanism
based on the most competitive supply. The EY 2012 out-of-state RECs were supplied from
renewable energy facilities in Illinois (26%), Pennsylvania (17%), Indiana (15%), West Virginia
(9%), Ohio (4%), Virginia (3%) and Maryland (2%). All of the solar RPS is achieved through
in-state supply10
.
The BPU and the Electric Distribution Company (EDC) solar programs assist residents and non-
residential customers with installing solar at their homes, businesses, and public buildings.
Because of the commitment to solar, New Jersey residents and businesses experience some of
the lowest installation costs in the country. Nonetheless, the State should continue to evaluate the
costs and benefits of this technology versus other technologies (both economic and
environmental), and analyze the future need for and scope of subsidies to support the continued
development of the maturing solar industry.
9 http://www.seia.org/research-resources/2013-top-10-solar-states 10 Clean Energy State Alliance (CESA) Cross State RPS Implication Report Feb 2015
16 | P a g e
III. PLAN FOR ACTION
The 2011 EMP set forth a Plan for Action that grouped 31 policy recommendations into four
general sections, which are shown below:
Expand In-State Electricity Resources
Build new in-state generation
Develop 1500 MW of CHP and DG
Evaluate lost nuclear capacity
Promote expansion of gas pipelines
Clean energy to be 70% of supply by 2050
Cost Effective Renewable Resources
Temporarily increase the solar Renewable Portfolio Standard (RPS)
Evaluate and lower Solar Alternative Compliance Payment (SACP)
Extend the EDC’s solar programs
Evaluate solar incentives
Return to the percentage obligation for solar
Promote certain solar photovoltaic (PV) installations
Reduce the cost of solar panels
Support offshore wind
Monitor European and Chinese wind
Promote effective use of biomass
Exploit tidal power in New Jersey
Support other renewable technologies
Promote Cost Effective Conservation and Energy Efficiency
Evaluate alternatives to Office of Clean Energy (OCE) programs
Incentivize geothermal heat pumps
Monitor EE effect on solar
Promote EE and Demand Response (DR) in State buildings
Monitor PJM’s DR programs
Evaluate use of sub-metering in residential buildings
Apply cost benefits test to EE programs
Evaluate dynamic pricing and metering
Add aggressive EE building codes
Increase natural gas EE
Expand education and outreach
Monitor energy storage developments
17 | P a g e
Support the Development of Innovative Energy Technologies
Improve vehicle efficiency and funding
Support emerging technologies
This EMP Update adds a new section, “Improve Energy Infrastructure Resiliency & Emergency
Preparedness and Response,” based upon New Jersey’s Plan for Action in the aftermath of
Superstorm Sandy.
Improve Energy Infrastructure Resiliency & Emergency Preparedness and Response
Protect the State’s critical energy infrastructure
Improve EDC emergency preparedness and response
Increase the use of microgrid technologies and applications for distributed
energy resources (DER)
Create long-term financing for local energy resiliency measures through the
ERB and other financing mechanisms
Expand In-State Electricity Resources
Build New In-State Generation
2011 Goal
The 2011 EMP directs the State to address barriers to new in-state generation in relation to
regulatory authority and actions of the Federal Energy Regulatory Commission (FERC) and
PJM; i.e., investigate New Jersey’s electric capacity needs, transmission planning, proper
functioning of the power market, barriers to, and opportunities for, new entry, and to
implement the Long-Term Capacity Agreement Pilot Program (LCAPP) legislation enacted
in 2011. [For more detailed information about this subject see the 2011 Energy Master Plan,
page 81-84.]
Goal Status
The BPU expects that more than 2,000 MW of new capacity will be in operation in calendar
years 2015 and 2016. The Long-Term Capacity Agreement Pilot Program (LCAPP) was key
to drawing attention to building new, in-state power generation. The LCAPP law was
challenged and on October 11, 2013 the U.S. Federal District Court held that the LCAPP law
interferes with FERC’s ability to run a competitive capacity market and is, therefore,
unconstitutional under the Supremacy Clause of the U.S. Constitution (a comparable action
by the Maryland Public Service Commission was overturned for federal preemption). The
United States Court of Appeals for the Third Circuit affirmed the District Court’s ruling. A
petition for certiorari was filed by the State with the U.S. Supreme Court.
The denial of Maryland’s program was appealed to the Fourth Circuit, which upheld the
ruling and likewise prompted a petition for certiorari. To date, the Court has not acted on
New Jersey’s petition. However, on October 19, 2015, the Supreme Court of the United
States granted certiorari to review the Fourth Circuit’s determination that the Maryland

18 | P a g e
Public Service Commission’s Generator Order is preempted by federal law. The Maryland
Generation Order and New Jersey LCAPP Act are factually similar and share the same legal
question of whether state-sponsored contracts for differences that require participation in the
PJM capacity market are preempted by federal law. Thus, despite the Court neither granting
nor denying petitions for certiorari of New Jersey’s LCAPP Act, the Court’s ruling in the
Maryland case will determine the fate of LCAPP.
Prior to the Federal District Court’s ruling, three contracts were awarded under the LCAPP
program: Hess Corporation’s 655 MW plant in Newark (which, since its sale by Hess, is now
known as the Newark Energy Center); NRG Energy Inc.’s 680.1 MW plant; and CPV Power
Development’s 663.4 MW plant in Woodbridge.
As required under LCAPP, the three selected companies bid into PJM’s May 2012 capacity
auction (requiring capacity to be available beginning June 1, 2015). The CPV Power and the
Newark Energy Center projects cleared the 2012 auction. NRG’s project, however, did not
and, after also failing to clear in the 2013 auction, was canceled. An additional project – LS
Power’s 770 MW plant in West Deptford – which was not chosen under LCAPP but
nevertheless bid into the 2012 PJM Capacity Auction – cleared the auction as well.
As stated earlier, the BPU expects more than 2,000 MW of new capacity to be built and in
operation by 2015-2016. The Newark Energy Center is nearly complete, LS Power Plant
(Phase 1) began construction in early 2012 and is now in service, with Phase 2 under
construction with an expected operation date in 2016, and the Woodbridge Energy Center is
under construction and is expected to be in service by early 2016. In addition, the 563 MW
BL England repowering project, which includes an upgrade from coal to cleaner burning
natural gas, awaits a decision on the alignment and construction of a new natural gas
pipeline.
While imports of electricity from out-of-state sources are down in recent years because of
lower prices and lower demand, increases in these areas could result in higher imports of
electricity and the need to increase transmission lines and systems if sufficient in-state
generation is not available. Lower cost and more efficient in-state electricity generation, as
well as increased energy efficiency, including increases in the building energy codes and
appliance standards, can continue to stabilize and potentially lower New Jersey’s electricity
costs.
The increase in in-state electricity generation to maintain the progress on controlling energy
costs must also include newer, more efficient distributed generation such as combined heat
and power, fuel cells and solar. Interest in local generation is growing alongside interest in
DG. Distributed generation technologies can also improve and enhance the State’s energy
resiliency at the local level through the development and implementation of microgrids.
Recommendations
The State will continue to encourage new in-state generation, especially in areas of high
congestion. The State will continue to work to assist in reducing financial, regulatory, and
technical barriers and provide for opportunities for new entry. The State will continue its

19 | P a g e
evaluation and analysis of New Jersey’s electric capacity needs as well as other issues
associated with transmission planning to identify areas of congestion, inordinately high
electricity prices, and the proper functioning of the power market. This includes enhancing
the capacity of the natural gas pipeline infrastructure to take advantage of low natural gas
prices to assist in lowering electricity prices.
Develop 1500 MW of Combined Heat and Power (CHP) and Distributed Generation (DG)
2011 Goal
Distributed Generation includes on-site generation from both renewables, such as solar, wind
and biomass, and from conventional fossil fuel facilities. Combined Heat and Power
facilities include district power plants that produce electricity while capturing and making
use of thermal energy, as well as smaller units for on-site energy needs of a specific facility.
The specific goal identified DG to reduce peak and included development of 1,500 MW of
new CHP by 2021. [For more detailed information about this subject see the 2011 Energy
Master Plan, pages 84-85.]
Goal Status
The total new DG capacity installed since 2011 is over 1,300 MW in over 31,000 facilities
statewide. This includes CHP, fuel cells, wind and solar. Development of DG in New Jersey
has been dominated by solar. To qualify for SRECs, all New Jersey solar must be connected
to the distribution system and would qualify as DG, whether used on-site or as grid supply.
New Jersey has almost 3,000 MW of CHP which is one of the highest concentrations of CHP
in the country, but only 10 percent is classified as DG. Less than 100 MW of new CHP has
been installed since 2011. Of all the DG systems promoted and advanced by New Jersey,
including solar, CHP is the most energy efficient and cost effective in terms of emission
reductions. Because of its ability to run continuously, it also improves and enhances local
energy resiliency and reliability and can provide the basis for a microgrid.
The 2011 goal of seeking 1,500 MW of CHP by 2021 was set at a specific incentive level
based on the 2010 USDOE CHP Technical Assistance Program-Market Assessment study.
Since Superstorm Sandy, however, the conditions for establishing this goal have expanded
from economic and environmental benefits to also include energy resiliency. The
implementation of resilient DG for the establishment of micro-grids is another technology
under active development; however, it is more costly and takes more time to develop such
projects.
With the current economic environment, and the low rate of participation in existing
incentive programs, the remaining CHP market potential may be insufficient to produce
additional new CHP without a more targeted effort. The State is pursuing strategic measures
to advance new CHP, such as leveraging the outreach and funding available through the ERB
and other means, including revisions to the NJCEP CHP and fuel cell incentive programs.

20 | P a g e
Several State agencies are collaborating in order to achieve the goal of developing 1,500 MW
of new CHP projects. The DEP recognizes the environmental and energy benefits and has
simplified approvals for CHP technology by developing streamlined general permits under
its air quality permitting program. The BPU administers a CHP-Fuel Cells incentive
program for both large and small facilities and both BPU and Economic Development
Authority (EDA) have made the advancement of CHP a priority program under the newly-
created ERB in order to finance energy resiliency projects for critical facilities important to
public health, safety, and the environment.
The ERB was the first public infrastructure bank in the nation to focus on energy resilience.
The ERB is utilizing $200 million from a federal HUD Community Development Block
Grant-Disaster Recovery (CDBG-DR) allocation. The ERB will assist in advancing the
State’s new goal of increasing local energy resiliency through DG including CHP, fuel cells,
storage technology, solar inverters and micro-grids that can operate during and after an
emergency.
Recommendations In conjunction and coordination with the recommendations noted above, the State will
continue to encourage new DG of all forms and keep a focus on expanding use of CHP by
reducing financial, regulatory and technical barriers and identifying opportunities for new
entries. The BPU should initiate a stakeholder process to determine how to reduce these
barriers and increase the development of DG with a focus on CHP, fuel cells within a
microgrid. This should include evaluating revisions to the CHP and fuel cell incentives to
promote local energy resiliency.
Evaluate Lost Nuclear Capacity
2011 Goal
New Jersey has four operational nuclear plants (at three sites) which produce about half of
the electrical energy generated in New Jersey. The State sees nuclear power as an important
element of a diverse resource portfolio. The oldest nuclear power plant in the state, Oyster
Creek, is scheduled to retire in 2019. The retirement will result in the removal of a 654 MW
carbon-free baseload resource. New Jersey should remain committed to the objective
assessment of how nuclear power fits into the diversified resource mix to meet economic,
reliability, and environmental goals. New Jersey should continue to coordinate with the U.S.
DOE regarding the next steps needed to accelerate a federal solution to the problem of
storing nuclear waste. [For more detailed information about this subject see the 2011
Energy Master Plan, page 84.]
Goal Status
With Oyster Creek scheduled to retire in 2019, state and local officials have been
investigating how the energy and capacity associated with the facility can be replaced.
Along with PJM, the State continues to encourage solutions to replace the lost energy and
capacity. One option is the development of Combined Cycle Natural Gas (NGCC) power

21 | P a g e
plants. This new, energy efficient NGCC technology reduces CO2 emissions by 60-75%, as
compared to traditional coal-fired generation. Absent the development of new, in-state
power generation, New Jersey will need to rely on more transmission to meet local electricity
deficiencies.
Transmission planning for enhancement and expansion of the transmission system is one of
PJM’s primary functions. PJM’s RTEP process identifies transmission system upgrades and
enhancements to provide for the operational, economic and reliability requirements of PJM
customers. The process integrates transmission with generation and load response projects to
ensure the overall PJM load obligations are served. PJM annual plan process reviews
reliability criteria over a 15-year period. The process identifies transmission constraints and
other reliability concerns as well as upgrades to mitigate identified reliability issues for
feasibility and costs. Transmission upgrades have alleviated the pressure to replace aging
elements of the transmission system, but as the transmission system continues to age the need
for instate generation grows.
Recommendations
Despite the current economics of bringing online new nuclear power plants, New Jersey
should remain committed to the objective assessment of nuclear power’s role in New
Jersey’s diverse resource portfolio. In order to sustain New Jersey’s existing fleet of nuclear
energy resources (which New Jersey ratepayers funded before industry restructuring in
1999), the State should continue an active role in federal nuclear regulatory activities and
continue to evaluate the economics of the nuclear industry.
In light of EPA’s Clean Power Plan, the State recognizes the need to continue to support the
nuclear power industry in New Jersey. As such, New Jersey remains strongly committed to
the nuclear industry, which has a strong track record in New Jersey of providing safe,
reliable, carbon-emission-free electricity, and is evaluating the impact of potential lost
capacity and planning for the replacement of this emission-free capacity.
Promote Expansion of Gas Pipelines
2011 Goal
As New Jersey increases its reliance on natural gas for electricity generation, delivery
pipelines will have to be improved and expanded. Expansion of the natural gas pipeline
system will also strengthen New Jersey’s ability to achieve innovations in transportation
fuels. [For more detailed information about this subject see the 2011 Energy Master Plan,
pages 85-86.]
Goal Status
Although the oversight of expanded or new interstate pipeline facilities is the responsibility
of FERC, the State is committed to expanding, in a safe and environmentally responsible
way, the existing pipeline network that serves gas utilities, power plants, businesses, and
residents throughout New Jersey. The State recognizes the controversies involved with siting
new pipeline infrastructure and will evaluate applications based on applicable statutes,
regulations, and policies.

22 | P a g e
Expansion of the State’s gas distribution companies’ (GDCs) intrastate pipeline capacity and
the capacity of the interstate pipelines serving the state provides an opportunity for the State
to take advantage of relatively low priced and abundant nearby natural gas supplies. This
will assist in meeting the increased and competing demands upon natural gas supply as fuel
for residential and commercial heat and electric generation.
Although New Jersey is generally well-supplied with natural gas pipeline capacity for heat
and existing power generation, the state lacks adequate natural gas infrastructure to support
new, gas-fired electrical generation, as well as substitution for other fuels in the residential
and commercial sectors. Expanding the capacity for natural gas can increase economic
development with lower costs for energy and enhance environmental quality through lower
emissions.
Since the release of the 2011 EMP, the BPU has approved $1.93 billion dollars for gas utility
infrastructure upgrades and mitigation projects.
Recommendations
No changes to the 2011 EMP goal are recommended. The BPU should continue to advocate
for enhanced intrastate capacity at local levels and interstate pipeline infrastructure before
FERC.
Clean Energy to be 70% of Supply by 2050
2011 Goal
Ensure that 70% of the State’s electric needs are generated by “clean” energy sources by
2050. As a practical matter, this is only achievable with current technologies if the definition
of clean energy includes renewables, nuclear, natural gas, and hydroelectric facilities. [For
more detailed information about this subject see the 2011 Energy Master Plan, pages 76-77.]
Goal Status
New Jersey’s promotion of new electric natural gas generation and enhancement/expansion
of the natural gas transmission and distribution systems have assisted in achieved this goal.
Overall, based on EIA and PJM Environmental Information Services (EIS) data 93% of the
State’s total annual electricity consumption and 96% of the State’s annual in-state electricity
generation is produced by clean sources, as defined in the 2011 EMP. 11
Based on U.S. Energy Information Administration (EIA) data, the electric energy supply for
New Jersey for 2014 was 47% nuclear, 44% natural gas, 4% coal, and 4% renewables. New
Jersey’s power plants produce fewer emissions than the vast majority of the states across the
country. 12
According to PJM EIS data from its Generator Attributes Tracking Systems
11 Sources http://www.eia.gov/electricity/data/state/sales_annual.xls and
https://gats.pjm-eis.com/gats2/PublicReports/PJMSystemMix. 12 Source: EIA, Electric Power Monthly

23 | P a g e
(GATS), the annual PJM wide system mix for EY 2014 was 35% nuclear, 19% natural gas,
43% coal and almost 2% renewables.13
According to the EIA, New Jersey’s sulfur dioxide (SO2) emissions rank amongst the lowest
three states in the nation and our nitrogen oxide emissions and carbon dioxide (CO2)
emissions from in-state electric generation units are among the lowest six states in the
country. And, when considering only existing fossil fuel-fired power plants, New Jersey
already surpasses the standards EPA proposes for the construction of new power plants.
Most significantly, this clean generation portfolio has been achieved in a state that is ranked
by EIA as the 22nd
largest generator of electricity in the United States.
Despite New Jersey’s achievements, however, EPA’s Clean Power Plan under Section
111(d) of the Clean Air Act does not properly credit this success. EPA has set 2030 goals for
more than half of the states at less stringent levels than New Jersey’s fossil sector achieved in
2012. Accordingly, New Jersey will continue to advocate for fair recognition that our
ratepayers have already borne the cost of an exemplary clean power sector. Nevertheless, as
the 2011 EMP and this Update identify, New Jersey will continue to pursue an even cleaner
power sector.
Recommendations
New Jersey has exceeded this goal; approximately 96% of New Jersey’s electricity
generation on an annual basis is produced by clean sources. The State will strive to improve
upon this record by promoting cleaner and renewable electric energy sources, demand
response and energy efficiency.
Cost Effective Renewable Resources
Temporarily Increase the Solar RPS
2011 Goal
Temporarily accelerate the RPS to provide interim relief for the SREC market and an
opportunity for the industry to adjust. Increase the RPS over the next three years and reduce
the outlier years of the RPS schedule to minimize the impact to ratepayers. This should
provide the foundation for the solar industry to continue to develop and receive SREC
payments trading within a reasonable range and would facilitate a reduced SACP schedule.
[For more detailed information about this subject see the 2011 Energy Master Plan, pages
105-106.]
13 Source https://gats.pjm-eis.com/gats2/PublicReports/PJMSystemMix.

24 | P a g e
Goal Status
The Solar Act of 2012 accelerated the solar RPS and gave the State greater oversight over
solar development. The Solar Act more than doubles the amount of solar energy that
suppliers and providers must purchase annually in the near term and commensurately reduces
the amount of solar that suppliers and providers must purchase in later years; the overall
amount of solar that must be purchased by suppliers and providers through 2028 is
approximately the same between the Solar Act of 2012 and the Solar Advancement Act of
2009. This allows for continued activity in New Jersey’s solar market while also protecting
the ratepayers of New Jersey from burdensome costs.
On May 21, 2014, BPU issued an Order Docket No. QO140504402, with instructions for
how the suppliers and providers are to comply with the Solar Act acceleration. The first
Energy Year under the Solar Act was completed on May 31, 2014, and the BPU is evaluating
the reports for compliance with the requirements of the Solar Act.
After an extensive stakeholder process, which resulted in several recommendations, the BPU
directed Staff to continue to:
i. Monitor solar market development activity and associated metrics, including, but not
limited to, capacity installation rates, SREC registration activity, EDC financed
program participation, and SREC prices; and
ii. Work with stakeholders to identify gaps in New Jersey solar market data availability
and improve data transparency to benefit market participants, decision makers and
stakeholders.
The Solar Act contained several provisions, which are credited with the stabilization of solar
market development activity. The increase in the near term Solar-RPS purchase obligations,
the authority for BPU to limit some types of SREC generating development and, to a less
certain degree, the reduction in the Solar Alternative Compliance Payment (SACP), have
helped to stabilize SREC prices. The SREC price has rebounded. BPU estimates that, based
on the current installed solar capacity and the pipeline of projects, the SREC market will be
oversupplied through Energy Year 2017. This means that through at least 2017 there will be
more SRECs generated than are needed to satisfy the RPS. With demand for SRECs lower
than supply, the price of SRECs will decrease and SREC prices will rebound after demand
once again outpaces supply. If the solar industry continues to overbuild, SREC prices will
decline accordingly.
Should “significant solar development volatility” extend for three consecutive quarters, with
significant volatility defined as 40% or more change in quarter over quarter market capacity
additions, the BPU recommends the following action:
i. Evaluating whether the quarterly changes in the market reflect typical market cycles
and/or normal variations not requiring regulatory intervention;
ii. Engaging stakeholders in considering limiting EDC sales of SRECs to recover costs,
stopping the offering of net metering for large solar electric generation facilities if

25 | P a g e
and when the total statewide aggregate of net-metered energy meets the newly
established cap of 2.9% of total annual kilowatt-hours sold in this State, or
considering other approaches to mitigating solar development volatility; and
iii. Considering possible means of further restricting eligibility of large grid supply and
net-metered projects greater than 2MW to participate in the SREC market that may
present potential and significant SREC market impacts.
Based on the revisions to the solar RPS in the Solar Act of 2012, the State should not make
changes in the Solar RPS until there is a full assessment of the impact of grid supply and
large net-metered projects (equal to or greater than 2 MW) on the market for behind-the-
meter solar for residential and small business customer projects. If the industry overbuilds
large projects it should be expected to consider that it does so at its own risk. New Jersey
should analyze the future need for, and scope of, subsidies to support the continued
development of the maturing solar industry.
Recommendations
No changes to the 2011 EMP goal are recommended. The Solar Act of 2012 addressed this
goal. The BPU should continue to evaluate this market.
Evaluate and Lower Solar Alternative Compliance Payment (SACP)
2011 Goal
To minimize the potential rate impact of an RPS acceleration, and the cost burden borne by
non-participants in New Jersey’s solar market, the State should materially reduce the SACP.
[For more detailed information about this subject see the 2011 Energy Master Plan, page
106.]
Goal Status
The Solar Act sharply reduced the SACP beginning in Energy Year 2014, and extends the
SACP schedule out to Energy Year 2028. This has the effect of continuing to foster
development of New Jersey’s solar market while protecting the ratepayers from unduly
burdensome costs. In 2012, the BPU adopted regulations to implement the SACP schedule
in the Solar Act.
Recommendations
Because the Solar Act of 2012 reduces the SACP, and the BPU amended the RPS rules to be
consistent with the Act, no further action is required.
Return to the Percentage Obligation for Solar
2011 Goal
Change the explicit gigawatt hour (GWh) requirement for solar energy to a defined
percentage of total energy sales. [For more detailed information about this subject see the
2011 Energy Master Plan, page 106.]

26 | P a g e
Goal Status
The Solar Act includes a provision that changes the solar RPS to a percentage of retail sales.
It also provides an exemption from the increased requirements for certain retail electricity
providers with supply contracts in place prior to the effective date of the Solar Act. With this
change, the short term increase in the solar RPS and the requirement to meet the increased
purchase obligation of suppliers will be shouldered by the non-exempt suppliers and
providers.
The BPU has issued guidance to retail electricity suppliers and providers on how the
increased solar requirements that will not be borne by exempt providers will be allocated to
non-exempt suppliers and providers. The methodology approved by the BPU through an
Order Docket No. QO140504402 is also anticipated to be proposed in rules to amend the
RPS.
Recommendations
No changes to the 2011 EMP goal are recommended. The Solar Act of 2012 addressed this
goal.
Extend the EDCs’ Solar Programs
2011 Goal
The State will consider programs to allow New Jersey residents who have been unable to
take advantage of individual PV systems to do so, and will support an extension of the long-
term contracting programs offered by utilities. [For more detailed information about this
subject see the 2011 Energy Master Plan, pages 107-10.8]
Goal Status
In 2013, BPU approved extensions of the EDC-supported solar programs for 180 MWs, and
PSE&G was approved for extensions of its Solar Loan 3 and Solar 4 All programs. These
filings include a component to assist residential markets, small businesses, and landfill
projects.
The continuation of the EDC Solar programs is, in effect, an incentive that facilitates
participation in the New Jersey solar market by those residents who have been unable to take
advantage of individual PV systems. The State should evaluate the continuation of the EDC
Solar programs, especially with solar panel prices continuing to decline at dramatic rates and
the proliferation of companies offering innovative ways to participate in the New Jersey solar
market. The evaluation should be specific to the need for residents and small businesses to
directly participate in the solar market.
Recommendations
No changes to the 2011 EMP goal are recommended. Based on projects currently pending
and installed capacity, large net-metered projects greater than 2 MW and grid-supply projects
may not need further incentives.

27 | P a g e
Evaluate Solar Incentives
2011 Goal
Conduct a regulatory review of solar PV to ensure that State-sponsored programs represent
worthwhile initiatives that achieve a sensible balance among competing resource planning,
economic, and environmental objectives from both a participant’s and non-participant’s
perspective. [For more detailed information about this subject see the 2011 Energy Master
Plan, page 105.]
Goal Status
Active stakeholder meetings to discuss this topic are ongoing. The Solar Act of 2012 made
clear what types of solar projects achieve the sensible balance noted above and it tailored
state-sponsored subsidies accordingly.
Since the inception of the NJCEP incentives for solar programs in 2001, ratepayers have
invested $363.5 million for solar rebates and $910.5 million through the solar RPS, including
SREC and SACP, but this does not include the investments by ratepayers in net metering
incentives. 14
. New Jersey, as of the end of September 2015, had installed 1,546.2 MW of
solar at 39,500 locations. The majority of these projects are behind the meter projects. There
are now 430.3 MW of solar projects in the pipeline at 9,796 locations, the majority of which
are direct grid-supply projects.15
In addition to the above, from 2009 through 2015, New Jersey ratepayers through the EDC
Solar programs have invested $1.25 billion . 1
The EDCs that have applied for and offer solar
programs are, Public Service Gas and Electric, Rockland Electric, Jersey Central Power and
Light and Atlantic City Electric. While the EDCs have made these investments in solar.
some of their costs are returned to the ratepayer based on SREC revenues.
Recommendations
Changes implemented as a result of the Solar Act of 2012 address this goal. The Solar Act
made clear what types of solar projects achieve the sensible balance noted above and it
tailored State-sponsored subsidies accordingly. As the solar market matures, an oversupply
of SRECs would be expected to drive their prices down. BPU will continue to monitor and
review development in the solar market, especially as the solar RPS is reached and in light of
the EPA’s Clean Power Plan, the impact of which on the solar market is not yet known.
14 Source: http://www.njcleanenergy.com/renewable-energy/project-activity-reports/project-activity-reports. The solar RPS cost
is estimated based on the weighted average price for the SREC. 15 Source: http://www.njcleanenergy.com/renewable-energy/project-activity-reports/installation-summary-by-technology/solar-
installation-projects

28 | P a g e
Promote Certain Solar PV Installations
2011 Goal
Solar projects that offer both an economic and environmental “dual benefit” should take
priority, and any legislative expansion of SREC eligibility should also provide BPU with the
ability to review and approve subsidies for grid-supply projects to ensure compatibility with
environmental, land use, and energy policies. Additionally, the development of solar projects
should not adversely affect the preservation of open space and farmland. [For more detailed
information about this subject see the 2011 Energy Master Plan, pages 106-107.]
Goal Status
The Solar Act gives BPU significantly more oversight over solar projects, particularly for
grid-supplied projects and those on farmland. Consequently, such authority will allow BPU
to approve projects that are more compatible with the State’s policy goals. The Solar Act of
2012 set the priority to promote development of grid-supply solar on properly closed sanitary
landfill facilities, brownfields, and areas of historic fill.
Pursuant to the Solar Act, BPU directed staff to initiate a stakeholder proceeding to
investigate approaches to mitigating solar market development volatility including an
evaluation of techniques used nationally and internationally toward the development of a
report to be completed within two years of the effective date of the law. Staff led the
proceeding through its monthly meetings issuing periodic requests for stakeholder comments
on various aspects of the issue.
After establishing a record of stakeholder input on solar development volatility in New
Jersey's market, potential definitions, causes and mitigating factors, BPU engaged the
Rutgers Center for Energy, Economic and Environmental Policy (CEEEP) to analyze the
findings and assist with recommendations. Based on a review the public record compiled by
BPU staff, CEEEP conducted a literature review of national and international approaches to
mitigate solar development volatility and engaged a consultant to write a report detailing its
findings, provide specific short term and long term recommendations regarding approaches
to mitigate solar development volatility in New Jersey, and present the results at a public
forum.
Since stakeholders could not arrive at a consensus definition of solar market volatility, the
contractors defined solar market volatility as “significant and rapid changes in market
capacity additions over time in both aggregate capacity and within sectors.” The report
found that the market had experienced volatility, especially prior to enactment of the Act.
The volatility was in response to changes in federal incentives, substantial declines in solar
module costs and SREC price fluctuations (most prior to the Act), with the grid supply
market segment showing the most volatility.
BPU continues to evaluate solar PV incentives to ensure that State-sponsored programs
achieve an appropriate balance of economic and environmental objectives from both a
participant’s and a non-participant’s perspective. Although a number of grid-supply solar

29 | P a g e
installations have been proposed for, and installed on, what were previously working farms
and open space, the State strongly discourages the use of ratepayer subsidies to turn
productive farmland and open space into grid-supply solar facilities. The policy of
encouraging the development of renewable energy resources should not undermine taxpayer
programs and policies that emphasize the importance of preserving open space and farmland.
Recommendations
The existing goals to promote solar projects that provide both economic and environmental
benefits are sound and should be continued. The State should continue its policy of
discouraging the development of solar farms on farmland and undeveloped open spaces, such
as forests, and encouraging their placement on or above impervious surfaces or on landfills,
brownfields or areas of historic fill. The Solar Act gives flexibility to the BPU in determining
what solar projects should go forward. While no further additional legislative action is
presently required, the BPU will continue to monitor the issues related to net-metering.
Should solar market volatility develop (as defined in the CEEEP report), BPU has the option
to invoke the statutory provision enabling the review of offering net-metering to projects
greater than 2 megawatts (MW).
Reduce the Cost of Solar Panels
2011 Goal
New Jersey must foster solar efficiency, material, and technological breakthroughs aimed at
reducing solar costs. Not only will these benefit ratepayers in terms of reducing SREC costs,
but they will also create additional economic opportunities for the entire solar industry. [For
more detailed information about this subject see the 2011 Energy Master Plan, pages 91-
100.]
Goal Status
BPU continues to monitor the solar panel pricing market as well as supporting some new
solar technologies. Although the State has limited influence on primarily market forces,
according to the U.S. Solar Market Insight Reports issued quarterly and annually by GTM
Research for the Solar Energy Industries Association (SEIA), New Jersey has among the
lowest installation costs in the United States.
Recommendations
No changes to the 2011 EMP goal are recommended.
Support Offshore Wind
2011 Goal
Examine the viability of developing offshore wind generation subsidized by the OREC
program. [For more detailed information about this subject see the 2011 Energy Master
Plan, page 108.]
30 | P a g e
Goal Status
The United States Department of the Interior’s Bureau of Ocean Energy Management
(BOEM) identifies seven East Coast states as actively involved in some stage of the auction
program for the leasing of underwater lands for offshore wind development (Massachusetts,
Delaware, Maryland, Virginia, New Jersey, New York, and Rhode Island). The leasing of
lands for the Cape Wind project in Massachusetts was announced by the Department of the
Interior with great fanfare in 2010, and Massachusetts invested over $100 million to create a
staging area for construction of offshore wind farms, although it was apparent that
construction and jobs were to go to European manufacturers. The project stalled for failure
to obtain financing, which was contingent upon the developer’s ability to secure purchase
agreements for the high cost of power to be produced.
A recent auction by BOEM for additional parcels off the coast of Massachusetts drew little
interest from developers, with two of the parcels drawing no bids at all, and the two others
going for prices considered relatively low. Although leases have been awarded in other
states, none of the states are any closer to actual development of an offshore wind project,
with the exception of a small project near Block Island.
BOEM conducted a federal lease auction for parcels off the coast of New Jersey on
November 9, 2015. In the auction, three bidders competitively placed bids for the right to
develop one of two lease areas in federal waters. Qualified bidders, who met the
requirements and deadlines for participation, including the submission of bid deposits,
participated in the auction. Two provisional winners of the auction were identified, one each
for the North Lease Area and South Lease Area designated by BOEM. New Jersey will
continue to actively monitor the development of these lease areas.
While offshore wind may become a valuable energy resource, generating energy through
offshore wind carries significant drawbacks. The rigors of the offshore environment and the
associated technological challenges for construction, operation, and maintenance, put upward
pressure on the costs of any offshore wind project. Fortunately, the Offshore Wind
Economic Development Act of 2010 (OWEDA) contains provisions to protect ratepayers
from the unacceptable costs associated with unproven technologies. For a project to be
approved, it is critical that a developer demonstrate the project’s net economic and
environmental benefits.
Although OWEDA provides an opportunity for the offshore wind industry to prove itself,
and further positions New Jersey for federal dollars if Congressional incentives become
available, the Act is also intended to prevent New Jersey’s businesses and residential
ratepayers from being exposed to unreasonable risks. While the future may bring change,
offshore wind in the U.S. is not economically viable at this time.
Nonetheless, to establish a framework for a potentially viable project in the future, the BPU
adopted rules (N.J.A.C. 14:8-6.1 et seq.) establishing an Offshore Renewable Energy
Certificate (OREC) program in 2011. These rules provide an application process and a
framework under which the BPU will review any application. BPU amended these rules in

31 | P a g e
2013, and continues to work with stakeholders and other interested parties regarding further
refinements to these rules.
Recommendations
Although offshore wind projects have not yet proven economically feasible in New Jersey,
BPU remains interested in examining the potential for offshore wind projects to become part
of the State’s energy portfolio, provided that the projects are economically viable and that
New Jersey ratepayers and businesses are protected.
Monitor European and Chinese Wind
2011 Goal
New Jersey will benefit on multiple levels from lessons learned with respect to wind in
Europe and China, and should actively monitor technology and operating developments in
Europe and China in the years ahead. [For more detailed information about this subject see
the 2011 Energy Master Plan, page 108.]
Goal Status
New Jersey’s power industry is extremely clean when compared to other states, is extremely
low in GHG emissions when compared to all other states, but electricity costs are amongst
the highest when compared to almost every other state. The fundamental question is whether
offshore wind technology can become economically feasible to the point where New Jersey’s
business and residential ratepayers are protected.
While Europe’s plans for offshore wind continue to be ambitious, as we near the end of 2015,
Europe is reassessing the high level of subsidies in all renewables and some utilities are re-
thinking investments in capital intensive offshore wind. In China, officials have confirmed
that the nation will not meet its 2011 plan to build 5,000 MW of offshore wind turbines in
four years, enough to power 5.4 million homes. To date, less than 10 percent of that
projected capacity is in place.
Recommendations
No changes to the 2011 EMP goal are recommended.
Promote Effective Use of Biomass
2011 Goal
New Jersey should reassess the existing renewable energy incentives to use available in-state
biomass resources more effectively and should pursue opportunities for public/private
partnerships to build and operate biomass-to-power fuel plants. Fostering a more complete
use of the State’s underutilized biomass resources should also support the goal of preserving
valuable farmland. Biomass includes energy from waste such as biogas from landfills and
wastewater facility digesters, energy from organic wastes such as food waste and other
vegetative waste and energy from specifically grown crops. [For more detailed information
about this subject see the 2011 Energy Master Plan, page 109.]

32 | P a g e
Goal Status
In 2013, Rutgers University’s EcoComplex updated the Biomass Energy Potential study it
conducted for the 2011 EMP. The updated study determined that approximately 65% of the
8.2 million tons of biomass generated annually in New Jersey could ultimately be available
to produce energy. This would include either 1,124 MW of electricity generation and
recovery of useful thermal energy or the production of 311 million gallons of gasoline16
.
With advancement in technology including anaerobic digestion and gasification, biomass can
be converted to a sustainable biogas that could be used for power generation or transportation
fuel. This opens up the potential for utilization of biomass through wastewater treatment
facilities to develop them as microgrids for power and fuel generation. The study reports a
number of opportunities to develop biopower and the barriers that dampen this development.
Barriers include the need to develop long term contracts to collect the organic material
(sometimes source separated) and the need to develop long term contracts for sale of the
energy.
DEP has developed a systematic process to determine if environmental permitting of
qualified biomass projects meets sustainability criteria. In addition, a number of working
groups have been formed, in conjunction with Rutgers University’s EcoComplex, to
coordinate the development of biomass and waste-to-energy. BPU approved a budget of $3
million in competitive incentives in the Renewable Energy Incentive Program in New
Jersey’s Clean Energy Program. As of March 31, 2015, 31.15 MW of biomass capacity has
been installed under NJCEP Renewable Energy Incentive Program in New Jersey.17
Recommendations
In the context of the new goals of promoting a more resilient energy industry through the
ERB, the State will work with stakeholders to revisit the role of biomass in the state energy
mix, especially biogas from wastewater treatment plant digesters. With the data in the
Rutgers biomass study, particularly the feedstock fractions with potential for power
production, BPU and DEP should review the State’s clean energy incentive policies for their
effectiveness in contributing to the State’s resiliency, in-state generation, and environmental
goals.
Exploit Tidal Power in New Jersey
2011 Goal
New Jersey should support the Department of Transportation’s Office of Maritime
Resources’ proof of concept partnership that will install a turbine system in Point Pleasant on
the Manasquan River. The proof of concept partnership will reveal economic and operational
16 “Assessment of Biomass Energy Potential in New Jersey.” The New Jersey Agricultural Experiment Station. July 2007.
NJAES Report 2007-1. http://bioenergy.rutgers.edu/biomass-energy-potential/njaes-biomass-assessment-finalreport.pdf 17 Source: http://www.njcleanenergy.com/renewable-energy/project-activity-reports/installation-summary-by-technology/wind-
biopower-and-fuel-cell-installation-reports

33 | P a g e
information that will help guide New Jersey’s assessment of the potential long term role this
renewable technology may play in meeting the State’s environmental, economic, and
reliability objectives. [For more detailed information about this subject see the 2011 Energy
Master Plan, pages 129.]
Goal Status
The Department of Transportation initiated a pilot project to evaluate the effectiveness and
efficiencies of this technology. However, due to changing market conditions, which lowered
the overall market potential for this technology, the pilot project was discontinued.
Recommendations
BPU and DEP should continue to monitor this technology if and when market conditions
change.
Support Other Renewable Technologies
2011 Goal
New Jersey should encourage emerging cost-effective renewable energy technologies, such
as fuel cells powered by renewable fuels, wave, tidal, micro hydro technology, geothermal
heat pump systems, and advanced technologies that have the potential to incubate new
businesses in the State. [For more detailed information about this subject see the 2011
Energy Master Plan, pages 127-130.]
Goal Status
Since the inception of the New Jersey Renewable Energy Portfolio Standard (RPS), the New
Jersey ratepayers have invested over $242.4 million for Class I and Class II renewables
through renewable energy certificates (REC) and alternate compliance payments (ACP). In
addition, the NJCEP has provided over $25 million in rebates to wind, biomass, and fuel cell
projects since 2001.
BPU staff continues to evaluate the viability of these technologies. The EDA, with BPU
input, is continuing to explore opportunities for new funding mechanisms, including
revolving loan funds that can provide funding and capital for new technology projects.
Recommendations
No changes to the 2011 EMP goal are recommended.
Promote Cost Effective Conservation, Energy Efficiency
Evaluate Alternatives to OCE Programs
2011 Goal
Consider new ways to provide capital for Renewable Energy and Energy Efficiency to
eventually eliminate the need for cost incurrence through the Societal Benefits Charge
34 | P a g e
(SBC). [For more detailed information about this subject see the 2011 Energy Master Plan,
page 119.]
Goal Status
To align clean energy programs with the investment community and increase the volume of
investor-ready projects in New Jersey, BPU has directed staff to implement a pilot project
with the Environmental Defense Fund’s (EDF) Investor Confidence Project (ICP). EDF is
working with leaders from the finance industry, engineers, project developers, and energy
efficiency programs nationwide to achieve widespread adoption of standardized protocols for
developing, measuring, and verifying the savings associated with EE projects.
The adoption of standardized industry protocols will allow private capital to better assess the
risk associated with financing EE projects and thereby attract private investment in pools of
these “investor-ready” projects. BPU has continued to update EE savings protocols since
2001.
A single market manager and program administrator of the NJCEP has been selected. This
restructuring will increase administrative efficiency and allow the NJCEP to continue to
implement cutting edge, market transforming EE programs. The new structure will also
enable the NJCEP to transition to a greater mix of financing options for program participants.
Since 2001 through the end of fiscal year 2014, New Jersey ratepayers have invested over
$2.053 billion in the NJCEP renewable energy (RE) and EE programs. This included $1.5
billion in EE and $480 million for RE programs and the remainder in administrative costs18
.
The EE investment included incentives for lighting, efficiencies in appliances, and energy
efficiency beyond building code requirements. Future returns from such investments could
likely become more expensive because of increasing energy building codes and appliance
standards. Ultimately, EE projects should be implemented where they provide a savings over
the initial investment.
In addition to the above, from 2009 through 2015 , New Jersey ratepayers through the EDC
and GDC EE programs have invested $727.4 million. The utilities that have applied for and
offer EE programs are Elizabethtown Gas, New Jersey Natural Gas, Public Service Gas and
Electric, Rockland Electric, and South Jersey Gas. The EDC and GDC energy efficiency
programs have increased participation in the Clean Energy Program energy efficiency
programs and enhanced and increased the energy efficiency savings to the customers and the
system. BPU is in the process of evaluating new energy efficiency programs for various
utilities.
BPU and EDA established the State’s ERB in 2014 and it is now managed by EDA. The
mission of the bank is to finance the development of energy systems that enhance and
improve energy efficiency and resiliency at the local level through, among other things, DG
18 Source: http://www.njcleanenergy.com/main/public-reports-and-library/financial-reports/clean-energy-program-financial-
reports. The remainder represents administrative and other costs such as the True Grants.
35 | P a g e
and microgrids. This financing program can serve as a model for the transition of the NJCEP
to other incentive models that advance this EMP goal.
Recommendations
No changes to the 2011 EMP goal are recommended. New Jersey’s Clean Energy Program
will evaluate the programs through a stakeholder process and other analyses and will update
the programs as appropriate. BPU also should evaluate ways to enhance the effectiveness of
the EDC and GDC programs and consider whether it should shift energy efficiency programs
to the EDCs and GDCs.
Incentivize Geothermal Heat Pumps
2011 Goal
BPU can advance geothermal heat pump systems in the state by creating incentive programs
that are similar to those available to promote solar to help reduce installation costs. Over the
past three years, according to the NJCEP, there were 20 rebates paid to commercial/industrial
organizations while on the residential side there were 167 unit rebates. The program also
provides thousands of natural gas furnace/boiler rebates to customers annually. In addition,
BPU, DEP and the New Jersey Corporation for Advanced Technologies (NJCAT) can work
together to verify the performance of innovative systems that are efficient and affordable to
New Jersey residents. [For more detailed information about this subject see the 2011
Energy Master Plan, page 128.]
Goal Status
BPU is monitoring Office of Clean Energy programs that may support developments.
Recommendations
Reassess this goal and determine whether it should be modified or continued in view of
changed circumstances.
Monitor Energy Efficiency Effects on Solar
2011 Goal
To prevent a potential negative impact on the solar market from the State’s focus on EE,
BPU should be authorized to increase the overall percentage of solar required in the RPS in
the event of a noticeable impact from EE Programs. [For more detailed information about
this subject see the 2011 Energy Master Plan, pages 91-100.]
Goal Status
The Solar Act of 2012 reverted the solar RPS back to a percentage requirement from the set
MWh requirement in the Solar Advancement Act of 2009. Savings from the NJCEP EE
programs average approximately one half of 1% annually and cumulatively have an
approximate 4% reduction on electricity consumption statewide through 2014. The effects of
EE are unlikely to have a noticeable impact on solar. BPU continues to monitor the impact
on the solar market from the State’s focus on EE.

36 | P a g e
Recommendations
No changes to the 2011 EMP goal are recommended.
Promote Energy Efficiency and Demand Response in State Buildings
2011 Goal
Leading by example, New Jersey’s State government will continue to improve the energy
efficiency of State owned and operated buildings through the State Energy Office in the
BPU. Operating costs for these facilities may be lowered by using performance-based
contracting for capital improvements to energy equipment, such as lighting upgrades,
heating, ventilation, and air conditioning replacement. [For more detailed information about
this subject see the 2011 Energy Master Plan, page 116.]
Goal Status The mission of the SEO is to obtain energy related cost savings for State government and
agency buildings and facilities through programs and services in the areas of energy
conservation, renewable energy and fuel efficiency. The SEO has implemented a number of
projects and is working as a member of the State Energy Savings Initiative Oversight
Committee to develop a long-term plan for energy savings in many of the 300 plus state-
owned/operated facilities. The SEO has leveraged federal, state and private-sector resources
to deliver the greatest energy conservation, environmental, and cost reduction benefits to the
agencies and taxpayers.
To achieve its mission, the SEO strives to identify energy savings projects at government
facilities, develop and support projects to decrease energy demand/consumption, provide
technical support to public officials at all levels of government and produce long term
savings through supply-side and demand-side energy management.
The SEO also provides guidance and services to local government, school districts and
business sectors.
The Energy Savings Improvement Program Act of 2012 (ESIP), allows State agencies to
contract with third parties with experience, expertise, and financial resources to implement
and fund EE measures in government owned and/or operated buildings, without upfront
capital investment.
BPU currently has 63 projects submitted under ESIP, and has identified more than $191
million in projects to date. Thus far, 16 projects have been completed and the remaining 47
projects are in various stages of completion of the investment grade audit or are under
construction. The program estimates $14.7 million in energy cost savings from the completed
projects. In addition, the State Energy Office is assisting State facilities in renegotiating
energy supply contracts, and has saved the State more than $13 million so far in utility
expenditures.
37 | P a g e
The State intends to provide lease financing to State agencies for the acquisition of energy
efficiency projects, including those implemented through energy savings performance
contracts. The State of New Jersey’s Department of Treasury (Treasury) has developed an
Energy Line of Credit (LOC) Program similar to the current Line of Credit Program devoted
to the short term acquisition of equipment which has been successfully in place since 1995.
The lending documents were executed in August 2014. Because multiple energy audits have
already been completed and each recommended improvement costs in the neighborhood of
$5-10 million, the Treasury has awarded the issuance of $100 million in lease obligations to
finance these projects.
Recommendations
No changes to the 2011 EMP goal are recommended.
Monitor PJM’s Demand Response Programs
2011 Goal
In addition to monitoring the PJM initiatives, BPU needs to be proactive in promoting cost-
effective Demand Response (DR) activities that are not recognized and supported by PJM
programs. New Jersey will also continue to participate in DR programs that are
economically sensible. [For more detailed information about this subject see the 2011
Energy Master Plan, page 120.]
Goal Status
Demand Response (DR) refers to actions taken by a consumer under contractual agreement
to adjust the amount or timing of energy consumption to reduce overall peak demand and
avoid system emergencies and outages. DR can be a more cost-effective alternative than
adding electric generating units simply to meet the periodic peaks or surges in energy
demand that most often occur during the hottest summer days.
PJM was in the process of implementing new incentives to support DR to make it easier for
the developers of those resources to participate and be rewarded through PJM’s energy and
capacity markets. However, in May 2014 the U.S. Court of Appeals for the District of
Columbia Circuit (D.C. Circuit) vacated FERC Order 745, which required regional
transmission organizations (RTO) to compensate DR resources participating in wholesale
energy markets at the full price for energy. In part, the D.C. Circuit found that demand
response was a retail transaction and, thus, subject to oversight by state utility commissions –
not FERC. FERC appealed that decision, which is currently under review by the United
States Supreme Court .
The District Court’s ruling calls PJM’s DR programs into question. The Supreme Court is
expected to issue a decision in 2016. BPU staff is actively monitoring that matter and what
impact the Supreme Court’s decision will have on existing state DR programs. BPU is
evaluating the State’s ability to implement DR programs moving forward, no matter the
results of the Court’s decision.
Recommendations

38 | P a g e
BPU should evaluate new opportunities for state-run DR programs in the event the Supreme
Court determines FERC has no regulatory authority over DR programs.
Evaluate Use of Sub-Metering in Residential Buildings
2011 Goal
Enable tenants in apartment buildings and commercial buildings to monitor their own utility
use and be billed for actual use. [For more detailed information about this subject see the
2011 Energy Master Plan, page 118.]
Goal Status
This goal has proven difficult to implement because of the challenges associated with
retrofitting existing buildings with individual meters. New construction codes and building
technologies may better support this policy goal in the future.
Recommendations
Despite the challenges to advancing this goal, no changes to the 2011 EMP goal are
recommended.
Apply Cost Benefits Test to EE Programs
2011 Goal
Perform cost-benefit test to assess the net benefit of EE subsidies and investments. [For more
detailed information about this subject see the 2011 Energy Master Plan, pages 111-114.]
Goal Status
Most EE programs are subject to a cost-benefit test. The cost benefit analysis (CBA) is
conducted for the entire program or on a facility-specific basis, as in the Combined Heat and
Power (CHP) programs. The CBA must demonstrate a net benefit or provide other social or
policy benefits, as do the low income EE programs.
Recommendations
No changes to the 2011 EMP goal are recommended.
Evaluate Dynamic Pricing and Metering
2011 Goal
New Jersey should consider expanding the implementation of smart meters and gradually
exposing customers with lower energy demands to real-time pricing in order to encourage
behavioral changes that result in wiser energy use and reduced retail prices for all residents.
[For more detailed information about this subject see the 2011 Energy Master Plan, pages
126-127.]
Goal Status

39 | P a g e
This goal must be re-evaluated within the context of the advancement of smart meter
technologies and changing costs. Consistent specification and standards for advanced meters
across the board, as well as security issues, need to be fully evaluated before expanding smart
meters. In addition, the uniformity of the methods to determine costs and benefits from
implementing smart meters needs to be further developed. BPU is refocusing this goal to
evaluate smart grid and distribution automation systems that can improve and enhance the
reliability and resiliency of the electric grid and could allow for options for smarter meters
and real time pricing in the future.
Recommendations
While no change in the 2011 EMP goal is recommended, the focus of this goal should
include distribution automation and smart grid and not just smart meters. The development
of distribution automation/smart grid can lead to the development of smart meters. The BPU
will work with the four EDCs and other interested stakeholders to evaluate the future
development of advanced technologies within the context of smart grid and distribution
automation plans. In addition progress in this goal can assist in the development of new DG
and microgrids as well as advancing EE and demand reduction.
Add Aggressive Energy Efficiency Building Codes
2011 Goal
Incorporate more aggressive Energy Efficiency (EE) requirements within the New Jersey
Building Code to reduce energy use without jeopardizing economic development or
environmental goals. [For more detailed information about this subject see the 2011 Energy
Master Plan, pages 116-118.]
Goal Status
From 2011 to 2012, residential greenhouse gas emissions from fuel use decreased
approximately 16% and the commercial sector’s emissions declined by 7%. While the
relatively mild heating and cooling demands due to the moderate weather in 2012 could
account for a portion of these decreases, the effects of increased energy efficiency should not
be discounted since it may have played a considerable part in the reductions.
The Department of Community Affairs (DCA) oversees the administration of the New Jersey
Uniform Construction Code including building energy requirements. According to the State
Uniform Construction Code Act, DCA cannot adopt its own building energy codes and is
required to adopt a national model building energy code from a nationally recognized
building energy code organization.
DCA conducts reviews of each edition of the national building energy model codes,
including the International Energy Conservation Code, to determine whether the newer
edition is in keeping with the intent and purposes of the Uniform Construction Code Act and
should be adopted. Additionally, the State meets or exceeds the dictates of the U.S.
Department of Energy, under the Energy Policy Act (Title III of the federal Energy
Conservation and Production Act of 1976.)

40 | P a g e
DCA adopts by reference the International Energy Conservation Code (IECC) for low-rise
residential buildings and the American Society of Heating, Refrigerating and Air
Conditioning Engineers (ASHRAE) standard for commercial buildings. In 2010, the New
Jersey Department of Community Affairs adopted the 2009 edition of the IECC for
residential buildings and ASHRAE 90.1-2007 for commercial buildings.
On September 13, 2014 the US Department of Energy (USDOE) issued a determination on
the ASHRAE 90.1-2013 which is referenced in the e 2015 IECC for commercial buildings as
the energy standard for commercial buildings. In addition to ASHRAE, the energy
conservation standard for commercial buildings is now sponsored by the American National
Standards Institute (ANSI) and the Illuminating Engineering Society (IES) making the full
title of the standard ANSI/ASHRAE/IES Standard 90.1-2013. States are required to certify
to USDOE that their commercial building energy codes meet or exceed this requirement one
year after publication in the Federal Register.
In January 2015, DCA published a proposal for public comment to adopt the 2015 edition of
the IECC for both residential and commercial energy sub-codes. The codes will promote
energy efficiencies in new commercial and residential buildings. An analysis of the energy
savings from adoption of these new codes for both residential and commercial buildings is
available at https://www.energycodes.gov/regulations/determinations. These proposed codes
were adopted by DCA in the September 21, 2015 issue of the New Jersey Register.
The State, in partnership with Rutgers University, has developed the New Jersey Green
Building Manual. This manual defines a baseline of performance and provides enabling
economic and environmental best practices for green building. BPU, through the NJCEP
Zero Energy Ready Home and Zero Energy Home 100% Renewable programs, provides
incentives for the construction of new, very high energy efficient homes. The incentive
assists developers to achieve the strategies in the State’s Green Building Manual.
In addition, BPU reviews appliance standards for energy efficiency as they become available,
including the costs and benefits of such changes. The USDOE pre-empts the majority of the
states, including New Jersey, from adopting standards other than federal standards. The State
participates in a number of DOE advisory groups that help to advance more efficient building
energy codes and appliance standards. Although the State is satisfied with appliance
standards set by the federal government, BPU should continue to monitor the changes in
building energy codes and appliance standards and modify the NJCEP incentives as changes
are implemented.
Recommendations
No changes to the 2011 EMP goal are recommended.
Increase Natural Gas Energy Efficiency
2011 Goal

41 | P a g e
Encourage increased use of natural gas for power generation and for residential and
commercial applications, including the use of high-efficiency natural gas appliances such as
replacing distillate oil appliances with natural gas furnaces and hot water heaters. [For more
detailed information about this subject see the 2011 Energy Master Plan, page 121.]
Goal Status
The Clean Energy Program provides incentives for new or upgraded boilers and furnaces that
are more efficient than the current appliance standard or building energy code upgrade. The
size of the rebate depends on the overall energy saving of the new unit over the required
code. On the residential side, the rebates range from $300 for a boiler to $900 for a boiler/
hot water heater combination. On average, the NJCEP provides approximately 20,000 to
25,000 rebates for more efficient residential natural gas units.
On the commercial and industrial side, the rebates range from $330 to $400, for high
efficiency gas-fired boilers and furnaces, to $2,400, for high efficiency boiler economizer
controls. The NJCEP’s annual avoided usage of natural gas that directly results from natural
gas EE programs are shown below. This avoided annual usage can be more than ten times
the avoided annual usage over the lifetime of the equipment.
In addition to New Jersey’s Clean Energy programs, the gas distribution companies (GDC)
also operate natural gas energy efficiency programs in their services territories. New Jersey
Natural Gas, South Jersey Gas, and Elizabethtown Gas have been approved to operate these
efficiency programs in their service areas. The plans enhance the rebates available for higher
efficiency gas equipment as well as repayment plans at 0% interest.
The 2012- 2013 program year represents 18 months because of the switch from a calendar program year to a fiscal program
year. Data from the NJCEP programs - http://www.njcleanenergy.com/main/public-reports-and-library/financial-
reports/clean-energy-program-financial-reports.
Recommendations
0200000400000600000800000
100000012000001400000
Dth
erm
NJCEP Natural Gas Savings 2001 -2014

42 | P a g e
No changes to the 2011 EMP goal are recommended. BPU should evaluate ways to enhance
the effectiveness of the GDC programs and continue discussions with the GDCs to evaluate
their EE programs.
Expand Education and Outreach
2011 Goal
The 2011 EMP calls for educating consumers about energy conservation measures that they
can implement, as well as EE tools available from State agencies, utilities, non-profits, and
membership organizations. [For more detailed information about this subject see the 2011
Energy Master Plan, pages 120-121.]
Goal Status
In conjunction with the Clean Energy Program (CEP) program administrator, the
Ombudsman’s Office in BPU participates in ongoing educational activities and has partnered
with Sustainable Jersey to increase municipal, business, and residential awareness of the
CEP. The Office of Clean Energy has issued an RFP for the marketing of New Jersey’s
Clean Energy Program.
In response to Superstorm Sandy, BPU expanded its outreach efforts, enhanced existing
incentives, and increased the suite of eligible technologies for those affected by the storm.
This includes the outreach on the transition from a rebate centered incentive program to a
clean energy program that focuses on financing incentives.
With electric and gas prices decreasing, it is important to increase the outreach and education
for energy aggregation and retail energy procurement through third party suppliers. Outreach
and education in this area are important to protect customers from exposure to third party
suppliers engaged in fraud and deceit.
Recommendations
The State should consider increasing the outreach for financing clean energy programs. In
addition, this goal should be expanded to include retail energy procurement and overall
energy systems outreach and education.
Monitor Energy Storage Developments
2011 Goal
Monitor the success of the State’s newly developed energy storage incentive programs and
the evolving development and improvement of energy storage technologies, modifying
incentives where appropriate. [For more detailed information about this subject see the 2011
Energy Master Plan, pages 123-125.]
Goal Status
Analysis of market potential for various storage technologies concluded that there are 50
MW of economic potential in New Jersey. As part of the Comprehensive Resource
43 | P a g e
Assessment (CRA) and annual budget process, the BPU approved a Fiscal Year 2016
competitive Renewable Energy Incentive Program with a budget of $6 million. This is in
addition to the $3 million allocated in the FY 2015 budget. Though a competitive
solicitation, BPU awarded incentives to 27 projects totaling 8,750 kW of battery storage
projects for 4,451 kWhs of charging capacity per cycle.
This is an emerging and still expensive technology. The ERB is creating program phases to
offer grants and low interest loans to public and critical facilities, such as wastewater
treatment plants, hospitals, public housing and schools that could serve as shelters during
extended power outages - for the application of storage technologies.
The initial offer for battery storage in wastewater and water treatment facilities was $5
million in grants, forgivable loans, and low interest loans, approved by the BPU and EDA
Boards in October 2014 and amended October 2015. The total allocation for this sector is
$65 million. The ERB program was expanded to include battery storage for hospitals. . In
order to streamline the administrative functions the ERB financing program is now fully
managed through EDA with only technical support by BPU.
Recommendations
No changes to the 2011 EMP goal are recommended.
Support the Development of Innovative Energy Technologies
Improve Vehicle Efficiency and Funding
2011 Goal
Encourage the greater use of Battery Electric Vehicles and Plug-in Hybrid Electric Vehicles
by improving and expanding the infrastructure needed throughout New Jersey. To induce
heavy duty vehicle class conversion from expensive and polluting diesel fuel to less costly
and clean natural gas, the State should facilitate the infrastructure needed to support broader
use of alternative fuel vehicles (AFV) by fleet owners as well as individuals. The State
should also promote new and cleaner in-state power generation and the improvement of our
electric grid which will be needed as the electric vehicle industry continues to grow on a state
and national scale. [For more detailed information about this subject see the 2011 Energy
Master Plan, pages 134-137.]
Goal Status
In 2012, the BPU approved a pilot program by New Jersey Natural Gas to build compressed
natural gas (CNG) fueling stations. In 2013, South Jersey Gas and Elizabethtown expanded
their compressed natural gas (CNG) fueling stations program under existing tariffs.

44 | P a g e
New Jersey Natural Gas is developing three CNG refueling stations. The host sites are:
Waste Management, Toms River; Middletown Department of Public Works; and Shore Point
Distribution Co. in Freehold Township.
South Jersey Gas (SJG) has three company-owned CNG fueling stations, located in
Glassboro, Millville, and Lindenwold. These stations are available for public use. SJG has
converted 60 vehicles of its 170 vehicle fleet to CNG and is on track to convert all 170 within
5 to 7 years.
In 2013, SJG and Wawa entered into an agreement for a three store pilot to provide CNG
fueling capabilities at Wawa fueling stations. SJG and Wawa are in the site selection phase
and anticipate construction starting in 2015.
According to USDOE New Jersey presently has 11 public CNG refueling stations and 143
electric charging stations.19
In addition, the website “Powered by CNG” lists another 22
CNG stations on private facility sites in New Jersey.20
Use of these alternative fuel stations
has resulted in 19,218 tons of avoided CO2 greenhouse gas emissions and 3,898,356 gallons
of avoided gasoline usage, according to the Clean Cities Coalition. EMP workgroup
activities on transportation are ongoing.
Recommendations
More work is needed to accelerate the progress to achieving the 2011 EMP goal. BPU and
DEP will continue to develop policies that remove barriers and expand the use of the entire
array of alternative fuel vehicles, including plug-in electric vehicles (EV), vehicles powered
by Compressed Natural Gas (CNG) and any other AFV from the transportation sector that
has the potential to increase mileage efficiency and reduce emissions.
BPU and DEP are working to develop incentives to promote and increase the use of
alternately fueled vehicles including CNG and electric vehicles in New Jersey
Support Emerging Technologies
2011 Goal
Support initiatives that capitalize on emerging technologies for clean energy solutions in
power production and transportation. The State must continue to monitor the evolving
development and improvement of innovative energy technologies and businesses. Based on
the ranking of technologies available in the near term, the State should evaluate program
opportunities to support increased development and use of these technologies. [For more
detailed information about this subject see the 2011 Energy Master Plan, page 136.]
19 http://www.afdc.energy.gov/fuels/electricity_locations.html 20 http://poweredbycng.com/new-jersey-cng-stations/
45 | P a g e
Goal Status BPU, through a partnership with EDA, supports the commercialization and proof of concept
of innovative clean energy technologies. These programs include the Edison Innovation
Clean Energy Manufacturing Fund (CEMF) and the Edison Innovation Green Growth Fund
(GGF).
BPU continues to explore opportunities for new funding mechanisms including revolving
loan funds.
Recommendations
No changes to the 2011 EMP goal are recommended.

46 | P a g e
IV. ADDITIONAL CHALLENGES AND GOALS SINCE 2011 ENERGY
MASTER PLAN
Improve Energy Infrastructure Resiliency & Emergency Preparedness and
Response
In recent years New Jersey has been struck by a series of unprecedented weather events which
have damaged the State’s economy and energy infrastructure. The magnitude and increased
frequency of these events have produced a paradigm shift for weather event preparedness and
critical infrastructure protection, especially in the energy sector. While this increased focus on
emergency preparedness was prompted by weather events like Hurricane Irene and Superstorm
Sandy, such planning efforts will protect the State in the event of any major emergency event,
weather related or otherwise (i.e.: cyber-attack).
The economic impact to the State and loss of essential services to the public caused by the
extended power outages during Hurricane Irene in 2011, the 2011 October snowstorm, and
Superstorm Sandy in 2012, have prompted policymakers and industry leaders to take a closer
look, not only at infrastructure resiliency and hardening measures, but also at emergency
preparedness and response.
To illustrate the scope of the problem, Superstorm Sandy downed 9,441 utility poles, left more
than 100 transmission lines out of service, and damaged or flooded more than 4,000 transformers
statewide, leaving 2.8 million electric customers without power after the peak of the storm. Full
restoration of power took 14 days, despite having more than 17,000 crew workers, coming from
across the country, and working around the clock.
The damage caused by Superstorm Sandy highlighted the interdependency of New Jersey’s
energy system and the risks posed by such interdependency. Some gas stations were unable to
run their gas pumps when the overall electric grid failed, and many stations with back-up diesel
generators were unable to provide service because the pipelines that move liquid fuels and the
“racks” for supplying delivery trucks were down as a result of the grid failure. Panic buying was
a major factor in short-term gasoline shortages, resolved quickly with implementation of an
“odd-even” purchase requirement, and the arrival of supplementary fuel from refineries and
storage facilities in South Jersey and the surrounding region.
Additionally, 94 wastewater treatment plants across all 21 counties lost power and were flooded,
leading to between 3 and 5 billion gallons of untreated wastewater being discharged into New
Jersey waterways. A total of 267 of the 604 water systems across the State were without power,
and 37 of those systems issued boil water advisories following the storm. Power to hospitals was
down, and, in some critical areas, patients had to be transported to other facilities after the storm.
The damage and disruption caused by Superstorm Sandy was unprecedented, but weather-related
disruptions to the State’s power infrastructure are not uncommon. Between 1985 and 2013, New
Jersey experienced 143 events that caused a sustained outage (greater than 5 minutes), and of

47 | P a g e
those sustained outages, 27 were found to be a “major outage” – or an outage that impacts more
than 100,000 electric customers (defined as electric meters) for a period of more than one day.
Based on a review of the events and consequences described above, the State revisited the EMP
and created a new overarching goal: Improve Energy Infrastructure Resiliency & Emergency
Preparedness and Response, which includes the following action steps:
Protect the State’s Critical Energy Infrastructure
Background
From a regional perspective, high-level electricity, natural gas, and liquid fuel critical
infrastructure assets are designed and operated with built-in redundancy to ensure a certain
degree of system reliability and resiliency.
In the electric power sector, system vulnerabilities and critical infrastructure protection at the
regional grid level are addressed as part of PJM’s annual Regional Transmission Expansion
Plan (RTEP) process. Through the RTEP process, load forecasts, studies, and computer
models test the transmission system for vulnerabilities and weaknesses against mandatory
North American Electric Reliability Corporation (NERC) reliability standards.
At the State level, non-intentional threats and vulnerabilities identified by the EDCs tend to
be local in nature. Overhead distribution systems on power poles, for example, are highly
susceptible to tree damage during high winds or tropical storms, and substations located near
rivers and streams are vulnerable to flood waters during heavy rains or tropical storms. The
consequences of these threats and vulnerabilities were evident during the recent series of
severe weather events, including Superstorm Sandy when tree damage and flood waters
disrupted service to more than 2.8 million New Jersey residents for an extended period of
time.
Lessons learned and recommendations to improve these areas were documented in the BPU’s
December 14, 2011 Staff Report following Hurricane Irene21
. Infrastructure protection and
resiliency issues uncovered in the wake of the 2011 and 2012 weather events were also
addressed in a series of BPU Orders including an Order establishing a generic proceeding to
review and investigate the prudency costs incurred prior to, during, and following any Major
Storm Event22
.
EMP Update Goal
Reduce the vulnerability of the State’s critical energy infrastructure by encouraging the
assessment of current vulnerabilities to threats and promoting efforts to reduce those
vulnerabilities and increase response and restoration times to damage to the State’s critical
energy infrastructure.
21 New Jersey Board of Public Utilities, Hurricane Irene Electric Response Report 22 BPU Docket No. AX13030196
48 | P a g e
Goal Status
Between January 2013 and April 2014, the BPU issued a series of Board Orders in response
to the devastating weather events that struck New Jersey in 2011 and 2012. The Board’s
Orders not only direct the EDCs and GDCs to implement specific measures with regard to
emergency preparedness and response, storm mitigation, and vegetation management, but
also direct the review and investigation of EDC prudency costs related to Major Storm
Events.
In response to the Board’s Orders, four separate petitions were filed with the BPU in 2013
for approval of infrastructure hardening and storm mitigation projects. Petitions were
submitted by PSE&G, New Jersey Natural Gas (NJNG), Elizabethtown Gas (ETG), and
South Jersey Gas (SJG). The Board approved approximately $1.3 billion in infrastructure
hardening and storm mitigation projects. The State as a matter of policy through the years
has supported proposals, especially for infrastructure investment after recent storm events, to
support infrastructure hardening as long as these measures were structured in a financially
prudent fashion.
New Jersey’s liquid fuel infrastructure is not just important to New Jersey residents and
businesses, but it also plays a critical role in delivery of transportation, electric generation
and heating fuels to customers in New York and Pennsylvania. In evaluating lessons learned
from Superstorm Sandy, New Jersey recognized that commercial suppliers and delivery
services were best equipped to respond to emergent needs, with appropriate guidance from
government emergency personnel.
New Jersey developed a resiliency program specifically for retail fuel. The Retail Fuel
Station (RFS) – Energy Resiliency Program is a grant program created by the Governor’s
Office of Recovery and Rebuilding and implemented by the New Jersey Economic
Development Authority (EDA), New Jersey Department of Environmental Protection
(NJDEP) and New Jersey Board of Public Utilities (BPU). The program is funded through
$7 million from the FEMA Hazard Mitigation Grant Program (HMGP).
This voluntary grant program is designed to enhance the operational resiliency of retail fuel
stations statewide from future outages by incentivizing the installation of back-up generators,
quick-connects or back-up electric generators. (A quick-connect is a fixture for facilitating a
rapid connection of a portable generator.) To date, this program has approved $3.625 million
in grant awards to retail gas stations in the form of reimbursement for the cost of 48
permanent generators and 57 quick-connects. Another $230,000 is allocated for applications
currently under review by FEMA, and $445,000 is allocated for applicants that are currently
under review.
In October of 2013, the State announced the $25 million Hazard Mitigation Grant Program
(HMGP) Energy Allocation Initiative to support back-up power and alternative energy
solutions for local governments to enhance energy resilience. Due to the overwhelming
demand for this program and the availability of additional HMGP funding, the State targeted
an additional $13 million in HMGP funds to support the new "Lifeline / Life Safety

49 | P a g e
Program" to fund additional local energy projects at critical facilities. This initiative builds
upon the Administration's efforts in the aftermath of Superstorm Sandy to enhance energy
resilience at critical infrastructure throughout New Jersey.
HMGP awardees consisted of two groups; A. Energy Resilience grants; and, B. Lifeline and
Life Safety Grants. Awardees represented all 21 counties, receiving almost $38 Million in
funding to various energy projects. http://www.ready.nj.gov/programs/hmgp.html
Recommendations
The State should increase the focus on energy assurance planning that ensures effective all-
hazards response to all energy emergencies, emphasizing infrastructure resiliency measures
and system hardening. BPU should review the GE Energy Consulting Group Report and
consider the report’s recommendations as they relate to storm hardening costs and benefits,
and industry initiatives. BPU should also continue to work with EDCs on the new vegetation
management pilot program currently under way to reduce tree-related outages. The State
should continue to support infrastructure hardening or preparedness applications of the utility
companies as long as financially prudent.
Improve EDC Emergency Preparedness and Response
Background
Every New Jersey community is dependent on electric power, and the loss of electric service
causes immediate community impact. Communities must increase their ability to prepare for
future major events and to respond to such events more quickly and effectively.
EMP Update Goal
The State should encourage and promote greater emergency preparedness and response
among its local and county governments to reduce the impact of future emergency events.
Goal Status
Following the widespread utility outages in 2011 caused by Hurricane Irene and the October
snowstorm, BPU initiated an investigation of electric utility storm preparedness and response
efforts. This review resulted in two BPU Orders directing the EDCs to implement emergency
preparedness, response and restoration improvement measures.
The first Board Order, issued on January 23, 2013, incorporated more than 120 improvement
measures recommended by BPU’s consultant. A second Order, issued on May 29, 2013,
included additional measures designed to address communications concerns of customers and
municipal officials that were raised during Superstorm Sandy. The improvement measures
outlined in the Board Orders fall into the following five categories: 1) Preparedness Efforts;
2) Communications; 3) Restoration and Response; 4) Post Event; 5) Underlying
Infrastructure Issues.
BPU is tracking the EDC’s implementation of the improvement measures as outlined in both
the January 23, 2013 Order and the follow-up Order of May 29, 2013, and actively monitors
their progress. Some of the key recommendations include the need for EDCs to improve the

50 | P a g e
estimated time of restoration (ETRs), establish and maintain EDC webpages describing
storm safety and preparedness information, plan for worst-case scenario, adopt the Incident
Command System (ICS) emergency response model, mobilize all communications channels
at an EDC’s disposal as soon as potential Major Events are forecasted, and develop
Interactive Voice Response (IVR) messages to provide customers with immediate
information.
Recommendations
The EDCs should continue to test and exercise all new preparedness and response measures,
particularly those involving the application of new technologies used to inform customers
about potential outages before a storm hits or ETRs during the restoration process. The
EDCs should also work with emergency management officials on ways to improve existing
measures as disaster planning assumptions continue to change.
Improve and Enhance the EDC Smart Grid and Distribution Automation Plans
Background As noted above, New Jersey electric systems have been negatively impacted by significant
weather events. This has highlighted our dependency on electric power. In addition to
community preparedness and assessment of vulnerabilities and threat response, the electric
distribution systems must be continually upgraded with the most current technology to
improve and enhance the grids reliability and resiliency. While focusing on critical facilities,
the analysis and upgrade to a smart grid (SG) through distribution automation (DA) should
advance. A smarter grid through distribution automation can address increased DG systems,
including renewables and storage on the grid, as well as demand response and advanced
meters options in a smarter grid.
EMP Update Goal
BPU will require the four EDCs to submit updated plans for Smart Grid/Distribution
Automation (SG/DA) that further detail the progress to date, future plans and the overall
costs and benefits of SG/DA for reliability and resiliency. BPU will initiate a proceeding to
work with the four EDCs to further develop and enhance a smarter grid through distribution
automation with detailed plans for future development for SG/DA by the EDC.
Goal Status
As required in the Irene Order dated January 23, 2014, the four electric utilities filed their
Smart Grid-Distribution Automation (SG/DA) plans by April 24, 2014. The SG/DA plans
were focused on storm hardening, improved reliability and resiliency and not “smart” or
advanced meters for dynamic pricing. A summary of the resiliency SG/DA plan is as
follows:
ACE has automated sectionalization and reclosures (ASR) to 33 substations, is
currently installing ASR in 19 substations and will install a similar amount annually
until all ACE substations have ASR.
51 | P a g e
JCP&L has installed programmable reclosers at targeted substations and new
substations and has added remote switching at 10 additional substations.
RECO has installed midpoint reclosers on 30 circuits, 30 circuits have automatic
loops and 10 circuits have smart loops.
PSE&G has installed Supervisory Control and Data Acquisition programs (SCADA)
at 100 substations and will install 10 per year until all substations have full SCADA.
An evaluation of the SG/DA plan filings in the four areas of storm outage prevention,
prediction, restoration and management as prepared by GE Energy Consulting in its final
report to the BPU titled NJ Storm Hardening Recommendations and Review/Comments on
EDC Major Storm Response Filings, dated November 26, 2014, is available at
http://www.nj.gov/bpu/pdf/reports/NJ_Major_Storm_Response-GE_Final_Report-2014.pdf.
The development of storm hardening/resiliency SG/DA systems and plans could lead to the
development of advanced meters for utilization of dynamic pricing. This could assist in
meeting a number of goals in the EMP.
Recommendations
The BPU should require the four EDCs to update their SG/DA plans to detail the progress to
date and future plans, including all costs and benefits.
Increase the Use of Microgrid Technologies and Applications for Distributed Energy
Resources (DER)
Background
Distributed Energy Resources (DER) are on-site systems, equipment or processes that are
small, modular, and decentralized, as compared to larger centralized power plants that also
include transmission and distribution systems, and can include DR, EE, and DG. DER can be
either grid-connected or off-grid energy systems located in or near the place where energy is
used.
DER systems can be designed to function in “island mode,” isolated from the grid during a
power outage or other event. A system with islanding capabilities would be defined as a
microgrid within the larger electric distribution system if it includes blackstart capabilities.
Similar to a car engine that requires a battery in order to start, a DER system requires an
extra “battery” system, such as a small diesel generator or battery system, to blackstart
without assistance from the grid.
The USDOE defines a microgrid as: “An integrated energy system consisting of a group of
interconnected loads and DER with clearly defined electrical boundaries that acts as a single
controllable entity with respect to the grid and can connect and disconnect from the grid to
enable it to operate in both grid connected or island mode.” Microgrids can increase
reliability with the use of DG, increase efficiency with reduced transmission length, and
allow for easier integration of alternative energy sources.
52 | P a g e
EMP Update Goal
Increase the use of microgrid technologies and applications for DER to improve the grid’s
resiliency and reliability in the event of a major storm.
Goal Status
As a part of the State’s ongoing recovery from Superstorm Sandy, the State of New Jersey
has entered into Memoranda of Understanding (MOU) with the U.S. Department of Energy
(USDOE) to evaluate the potential to develop microgrids on two key recovery projects: a
microgrid within the northeast portion of the NJ Transit system, called NJTransitGrid, and a
microgrid within the PSE&G service area in the City of Hoboken.
To test the feasibility of these two projects, the USDOE provided funding directly to Sandia
National Laboratories to evaluate measures to improve the resiliency of the NJ Transit
energy system and the PSE&G service area in Hoboken when the grid is down.
NJTransitGrid is a first-of-its-kind electrical microgrid capable of supplying highly-reliable
power during storms, or other times when the traditional centralized grid is compromised,
and will serve as a model for other communities in the State and across the nation.
BPU worked with the New Jersey Institute of Technology (NJIT) to map potential Town
Center DER microgrids. This report mapped 24 potential Town Center DER microgrids
across the 17 municipalities in the 9 Sandy designated Counties. BPU is working with NJIT
to map the remaining 12 counties.
A Town Center DER microgrid would have a cluster of critical facilities within the
municipality that could include multifamily buildings, hospitals and local and state
government critical operations in a small radius and connected to a series of DER
technologies that can operate isolated and islanded from the grid when the power is down.
BPU continues to support the mapping of Town Center DER Microgrids and is also
evaluating the feasibility of other opportunities for microgrids.
The State also is seeking to encourage investment in resilient DER technologies through the
Energy Resilience Bank. Funded with $200 million of Sandy recovery funds, the first ERB
funding products are targeting wastewater treatment plants and hospital systems.
Recommendations
The State should continue its work with the USDOE, the utilities, local and state
governments and other strategic partners to identify, design and implement Town Center
DER microgrids to power critical facilities and services across the State.
As directed by the Board, BPU staff is in the process of finalizing a Microgrid Report with
recommendations for next steps. The Board should consider next steps to assist in reducing
barriers in the development and implementation of Town Center DER microgrids.
53 | P a g e
Create Long-Term Financing for Local Energy Resiliency Measures through an ERB and
other Financing Mechanisms
Background
After Superstorm Sandy, the United States Congress appropriated $16 billion to the U.S.
Department of Housing and Urban Development (HUD) Community Development Block
Grant-Disaster Relief (CDBG- DR) Program (reduced to approximately $15 billion after
sequestration) to assist recovery in states affected by Superstorm Sandy. To date, New
Jersey has been allocated approximately $4 billion of CDBG-DR funds for Sandy recovery.
Most of these funds are supporting housing recovery initiatives, the State’s primary focus in
recovering from Superstorm Sandy. However, $200 million of CDBG-DR funds have been
allocated to the New Jersey Energy Resilience Bank, a first-of-its-kind in the nation energy
resilience financing initiatives that seeks to make critical facilities, and by extension, the
communities they serve, more resilient by investing in DER technologies that allow the
facilities to continue to operate when the electric grid fails. The ERB’s first two funding
products focus on water and wastewater treatment facilities and hospitals. (Additional
energy resilience investments have been made through other Sandy recovery funding
streams, including the aforementioned Energy Allocation Program and Lifeline/Life Safety
Program, which are funded with FEMA Hazard Mitigation Grant Program funds.)
EMP Update Goal
Use the federal funds provided to New Jersey to improve and increase local energy resiliency
through DER microgrid systems that can operate during and after an emergency and to make
the local energy systems stronger than they were before the storm.
Goal Status
Water and wastewater infrastructure suffered an estimated $2.7 billion in direct damages
during Superstorm Sandy. Sand infiltrated and blocked a number of sewer lines, and other
lines were determined to be structurally damaged beyond repair. At the height of the storm,
94 wastewater treatment systems suffered failures or disruptions, including inadequate
treatment, broken sewer mains, and other operational issues.
The loss of electrical power rendered many water systems unable to maintain service. Even
at plants where backup generation was available, the disruption of the petroleum production
and delivery system caused generator fuel supplies to be limited.
The vast majority of New Jersey’s community water supply systems were affected: 427 of
604 community water systems experienced power loss during the event. As a direct result of
the service interruptions, 362,334 New Jersey residents were placed under a boil water
advisory. One month after Superstorm Sandy made landfall, eight drinking water systems in
Ocean County, serving approximately 10,000 households, were still subject to a boil water
advisory.23
Additionally, the health, safety and welfare of patients is threatened if hospital
23 http://www.state.nj.us/dca/announcements/pdf/CDBG-DisasterRecoveryActionPlan.pdf
54 | P a g e
systems and long-term care facilities cannot continue operations through reliable, resilient
power systems when the electric grid fails.
ERB financing options include grants and low interest loans. The eligible technologies
include combined heat and power (CHP), fuel cells, battery storage, and off-grid inverter
upgrades. ERB will not finance emergency backup generators, although backup generators
are a part of resilience , but they can be used to supplement resiliency. The current offer for
wastewater and water treatment facilities is for 100% financing of a project’s unmet funding
needs, after certain conditions are met. [For more information about the ERB visit:
http://www.njerb.com]
Additionally, the New Jersey Economic Development Authority (EDA) recently approved a
second ERB funding product that will target ERB funds to make hospital systems more
energy resilient through investment in DER technologies.
The ERB will finance the design, acquisition, construction, and installation of additional
DER projects that will improve and increase the energy resiliency at New Jersey critical
facilities.
Recommendations
In addition to financing energy resiliency measures, EDA and ERB should coordinate with
BPU to assist in achieving the Energy Master Plan’s energy efficiency and distributed
generation goals. ERB customers should also be introduced to New Jersey’s Clean Energy
Program (NJCEP). The ERB program should coordinate with the Energy Saving
Improvement Program (ESIP) and the NJCEP EE programs to address energy efficiency and
resiliency. BPU and the ERB will work to advance Town Center DER microgrids and assist
in reducing technical, regulatory and financing barriers.

55 | P a g e
V. CONCLUSION
This Update to the State’s 2011 Energy Master Plan catalogues the many successes New Jersey
has achieved over the past three years in advancing the Plan’s Five Overarching Goals and
carrying out the Plan of Action, as well as those areas where progress is ongoing and where more
work needs to be done.
Since the publication of the 2011 Energy Master Plan, the cost of energy is down for New Jersey
consumers, our state’s in-state energy generation is cleaner than ever before, and New Jersey is
on-track to meet the Renewable Energy Portfolio standard goal set for 2020. The State continues
to promote energy efficiency and conservation and maintains its strong commitment to
encourage the use of emerging technologies for transportation and power production.
This EMP Update also demonstrates the State’s ability to refocus its efforts to meet emergent
challenges, such as the increased priority that the State is placing on improving the resiliency of
our energy infrastructure to respond and recover from significant disruptions caused by severe
weather events.
Recognizing the economic and environmental importance of an affordable, reliable, adequate,
clean supply of energy to the economic prosperity and the environmental health of New Jersey,
the Administration will build on the accomplishments already realized, and will continue to
evaluate and assess the State’s energy needs and priorities in the years ahead.

56 | P a g e
NEW
JERSEY
ENERGY
MASTER
PLAN
UPDATE
Appendix
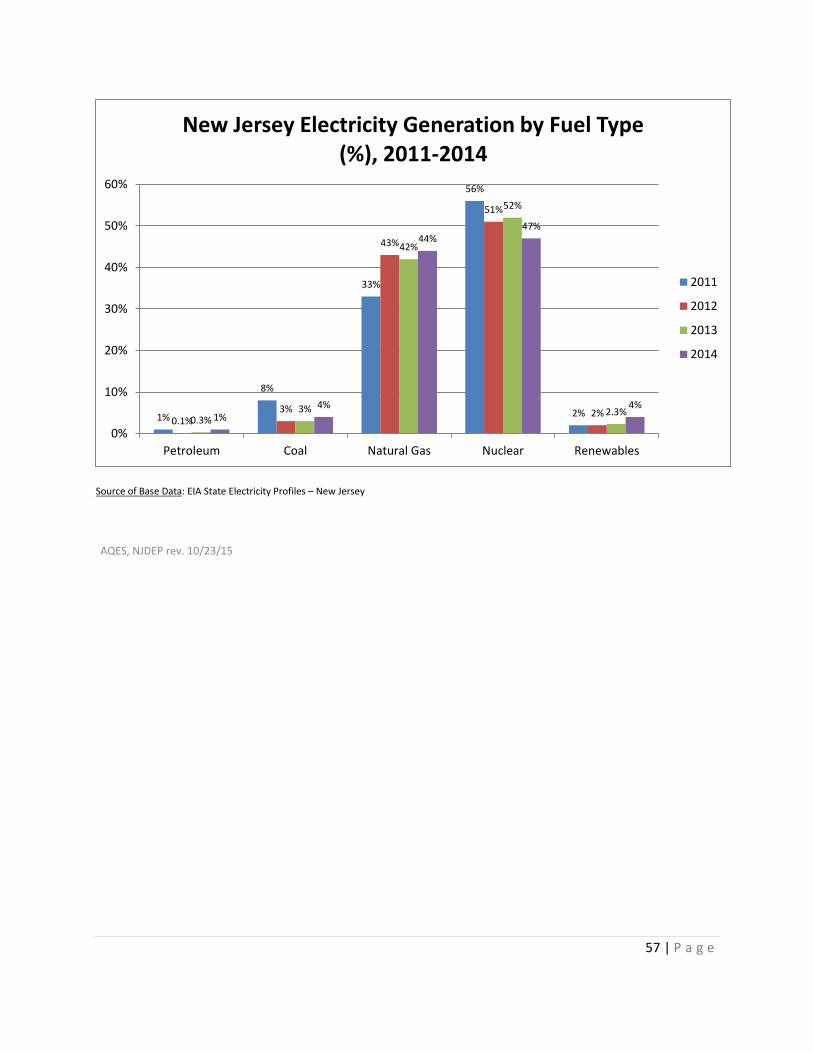
57 | P a g e
Source of Base Data: EIA State Electricity Profiles – New Jersey
1%
8%
33%
56%
2% 0.1%
3%
43%
51%
2% 0.3%
3%
42%
52%
2.3% 1%
4%
44% 47%
4%
0%
10%
20%
30%
40%
50%
60%
Petroleum Coal Natural Gas Nuclear Renewables
New Jersey Electricity Generation by Fuel Type (%), 2011-2014
2011
2012
2013
2014
AQES, NJDEP rev. 10/23/15

58 | P a g e
*(Vermont excluded; limited power sector) Source of Base Data: 2013 EIA State Historical Tables 1991-2013 (www.eia.gov/electricity/data/state ); Emission Rate calculated as: (total
emissions in Metric Tons/total generation in MWh) X 2,204.6 pounds/metric ton.
5.0
5
4.9
6
4.5
0
4.2
5
4.0
3
3.7
7
3.6
1
3.4
4
3.3
2
3.2
8
3.2
5
3.0
4
2.9
4
2.4
8
2.4
4
2.4
0
2.3
2
2.1
8
2.1
6
2.0
5
2.0
1
1.9
2
1.9
1
1.8
9
1.7
7
1.7
7
1.5
1
1.3
9
1.2
9
1.2
4
1.2
2
1.1
3
1.1
3
1.0
6
1.0
0
0.9
9
0.8
6
0.7
5
0.5
8
0.5
8
0.4
5
0.4
2
0.4
1
0.4
1
0.3
8
0.2
3
0.2
0
0.1
0
0.0
2
0.00
1.00
2.00
3.00
4.00
5.00
6.00O
H IN MI
KY HI
IA NE
MO
MS
WI
ND SD AR
WV
PA LA MD
OK
TN GA IL AL
ME
WY
TX VA
CO
MN AK KS
MT
NC
UT FL SC
NM ID
MA
DE
OR
NY
AZ
NV RI
NH
WA CT NJ
CA
State*
All Sources SO2 Emission Rate (lb/MWh), 2013
AQES, NJDEP rev. 10/23/15
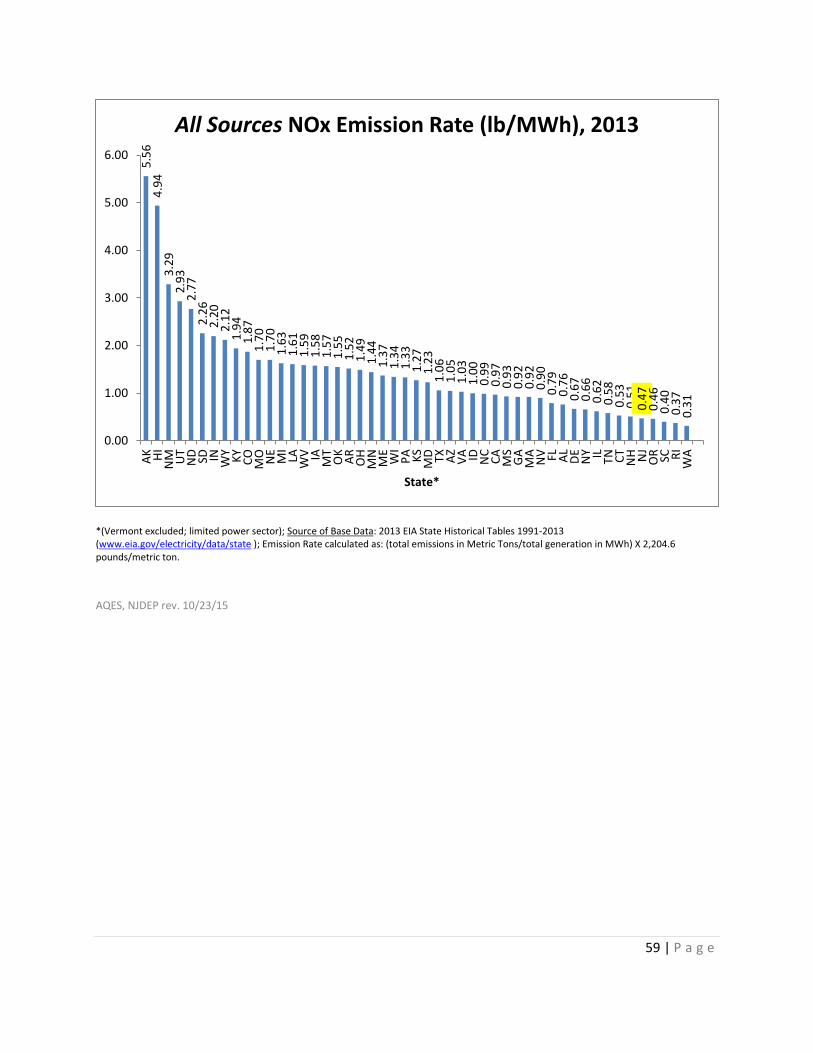
59 | P a g e
*(Vermont excluded; limited power sector); Source of Base Data: 2013 EIA State Historical Tables 1991-2013 (www.eia.gov/electricity/data/state ); Emission Rate calculated as: (total emissions in Metric Tons/total generation in MWh) X 2,204.6 pounds/metric ton.
AQES, NJDEP rev. 10/23/15
5.5
6
4.9
4
3.2
9
2.9
3
2.7
7
2.2
6
2.2
0
2.1
2
1.9
4
1.8
7
1.7
0
1.7
0
1.6
3
1.6
1
1.5
9
1.5
8
1.5
7
1.5
5
1.5
2
1.4
9
1.4
4
1.3
7
1.3
4
1.3
3
1.2
7
1.2
3
1.0
6
1.0
5
1.0
3
1.0
0
0.9
9
0.9
7
0.9
3
0.9
2
0.9
2
0.9
0
0.7
9
0.7
6
0.6
7
0.6
6
0.6
2
0.5
8
0.5
3
0.5
1
0.4
7
0.4
6
0.4
0
0.3
7
0.3
1
0.00
1.00
2.00
3.00
4.00
5.00
6.00A
K HI
NM UT
ND SD IN WY
KY
CO
MO NE
MI
LA WV IA
MT
OK
AR
OH
MN
ME
WI
PA KS
MD TX AZ
VA ID NC
CA
MS
GA
MA
NV FL AL
DE
NY IL TN CT
NH NJ
OR SC RI
WA
State*
All Sources NOx Emission Rate (lb/MWh), 2013

60 | P a g e
*(Vermont excluded; limited power sector); Source of Base Data: 2013 EIA State Historical Tables 1991-2013 (www.eia.gov/electricity/data/state ); Emission Rate calculated as: (total emissions in Metric Tons/total generation in MWh) X 2,204.6 pounds/metric ton.
AQES, NJDEP rev. 10/23/15
21
29
2
09
6
20
01
1
97
5
19
06
1
88
5
18
51
1
75
4
16
66
1
64
5
16
40
1
59
5
15
94
1
52
4
15
07
1
40
5
13
85
1
36
5
13
50
1
34
1
13
10
1
27
9
12
59
1
25
7
11
65
1
07
7
10
75
1
06
2
10
57
1
05
5
10
36
1
00
2
99
7
99
4
98
8
98
1
94
9
94
5
70
4
66
7
63
2
57
8
54
2
54
0
53
8
38
4
35
0
28
2
24
2
0
500
1000
1500
2000
2500
WY
KY
WV IN ND
MO UT
NM NE
OH
CO HI
WI
IA KS
MI
OK
AR
MT
DE
TX AK LA
MN
MD AZ FL IL PA
TN GA RI
NC
VA
MA AL
NV
MS
SD SC CA
ME
NY
CT NJ
NH
OR ID
WA
State*
All Sources CO2 Emission Rate (lb/MWh), 2013
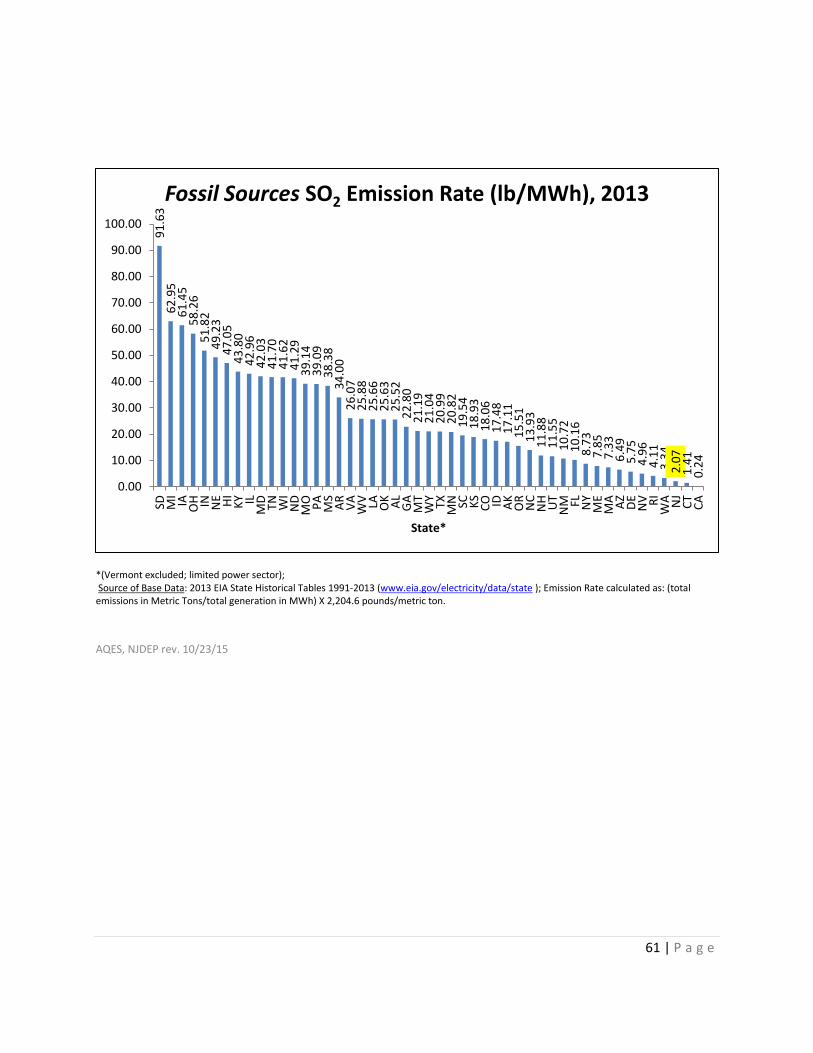
61 | P a g e
*(Vermont excluded; limited power sector); Source of Base Data: 2013 EIA State Historical Tables 1991-2013 (www.eia.gov/electricity/data/state ); Emission Rate calculated as: (total emissions in Metric Tons/total generation in MWh) X 2,204.6 pounds/metric ton.
AQES, NJDEP rev. 10/23/15
91
.63
6
2.9
5
61
.45
5
8.2
6
51
.82
4
9.2
3
47
.05
4
3.8
0
42
.96
4
2.0
3
41
.70
4
1.6
2
41
.29
3
9.1
4
39
.09
3
8.3
8
34
.00
2
6.0
7
25
.88
2
5.6
6
25
.63
2
5.5
2
22
.80
2
1.1
9
21
.04
2
0.9
9
20
.82
1
9.5
4
18
.93
1
8.0
6
17
.48
1
7.1
1
15
.51
1
3.9
3
11
.88
1
1.5
5
10
.72
1
0.1
6
8.7
3
7.8
5
7.3
3
6.4
9
5.7
5
4.9
6
4.1
1
3.3
4
2.0
7
1.4
1
0.2
4
0.00
10.00
20.00
30.00
40.00
50.00
60.00
70.00
80.00
90.00
100.00
SD MI
IA OH IN NE HI
KY IL
MD
TN WI
ND
MO PA
MS
AR
VA
WV LA OK AL
GA
MT
WY
TX MN SC KS
CO ID AK
OR
NC
NH
UT
NM FL NY
ME
MA AZ
DE
NV RI
WA NJ
CT
CA
State*
Fossil Sources SO2 Emission Rate (lb/MWh), 2013

62 | P a g e
*(Vermont excluded; limited power sector); Source of Base Data: 2013 EIA State Historical Tables 1991-2013 (www.eia.gov/electricity/data/state ); Emission Rate calculated as: (total emissions in Metric Tons/total generation in MWh) X 2,204.6 pounds/metric ton.
AQES, NJDEP rev. 10/23/15
7.1
6
.8
5.6
3
.5
3.5
3
.0
2.7
2
.5
2.4
2
.2
2.2
2
.2
2.1
2
.0
2.0
1
.9
1.9
1
.9
1.8
1
.8
1.8
1
.7
1.7
1
.6
1.6
1
.4
1.4
1
.3
1.2
1
.2
1.2
1
.2
1.2
1
.2
1.1
1
.1
1.1
1
.0
1.0
0
.9
0.9
0
.8
0.7
0
.6
0.5
0
.5
0.5
0
.4
0.3
0
1
2
3
4
5
6
7
8
AK
SD HI
NM ND
UT
MT IA
WY
CO IN NE
MN KY
PA KS
MI
MO AR LA OK
MD
WV AZ
OH
NC
WI
WA
CA ID IL TN TX VA AL
MS
NV
GA
NY
NH
OR SC FL ME
CT
DE NJ
MA RI
State*
Fossil Sources NOx Emission Rate (lb/MWh), 2013

63 | P a g e
*(Vermont excluded; limited power sector); Source of Base Data: 2013 EIA State Historical Tables 1991-2013 (www.eia.gov/electricity/data/state ); Emission Rate calculated as: (total emissions in Metric Tons/total generation in MWh) X 2,204.6 pounds/metric ton.
AQES, NJDEP rev. 10/23/15
24
76
2
41
8
23
64
2
34
2
22
97
2
26
9
22
65
2
23
2
21
83
2
17
3
21
43
2
14
1
21
21
2
11
9
20
87
2
05
7
20
07
1
95
5
19
20
1
90
4
18
96
1
86
5
18
19
1
73
8
17
08
1
69
7
16
94
1
69
0
16
66
1
65
8
15
93
1
59
2
15
71
1
54
5
14
73
1
35
5
13
00
1
29
8
12
43
1
23
1
12
28
1
16
8
11
46
1
14
6
11
20
1
02
5
10
11
1
00
1
91
2
0
500
1000
1500
2000
2500
3000IA ND
WY
MT KS
NE IL TN KY
MD
MO WI
MN SD WV IN MI
CO UT
OH
NM AR HI
SC AK
PA
OK
VA AZ
NC LA TX AL
GA
WA
DE
NH
ME FL MS ID NY
NV
OR NJ
CA RI
CT
MA
State*
Fossil Sources CO2 Emission Rate (lb/MWh), 2013

64 | P a g e
Source of Base Data: 2013 EIA State Historical Tables 1991-2013 (www.eia.gov/electricity/data/state ); Emission Rate calculated as: (total
emissions in Metric Tons/total generation in MWh) X 2,204.6 pounds/metric ton.
AQES, NJDEP rev. 10/23/15
0
200
400
600
800
1000
1200
1400
1600
1800
2000
New Jersey Power Generation - Fossil CO2 Emission Rate
2001 - 2013 (lb/MWh)
Fossil - CO2 Emission Rate (37%decrease)
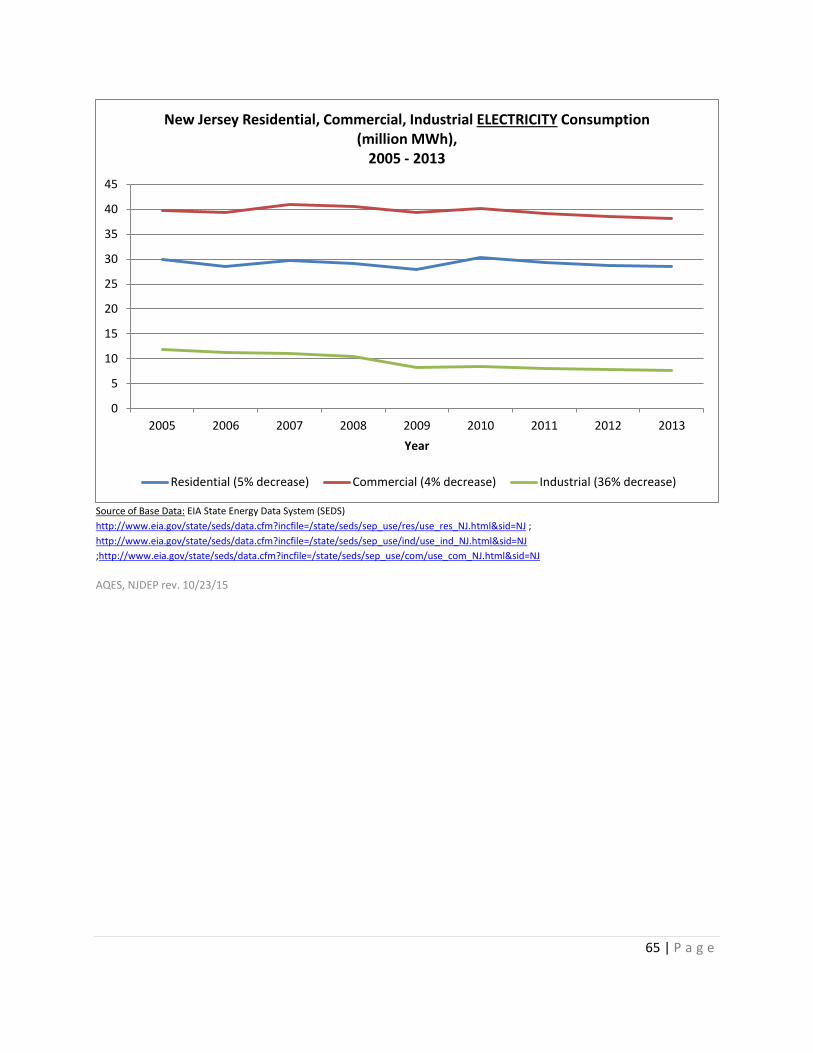
65 | P a g e
Source of Base Data: EIA State Energy Data System (SEDS)
http://www.eia.gov/state/seds/data.cfm?incfile=/state/seds/sep_use/res/use_res_NJ.html&sid=NJ ;
http://www.eia.gov/state/seds/data.cfm?incfile=/state/seds/sep_use/ind/use_ind_NJ.html&sid=NJ
;http://www.eia.gov/state/seds/data.cfm?incfile=/state/seds/sep_use/com/use_com_NJ.html&sid=NJ
AQES, NJDEP rev. 10/23/15
0
5
10
15
20
25
30
35
40
45
2005 2006 2007 2008 2009 2010 2011 2012 2013
Year
New Jersey Residential, Commercial, Industrial ELECTRICITY Consumption (million MWh),
2005 - 2013
Residential (5% decrease) Commercial (4% decrease) Industrial (36% decrease)
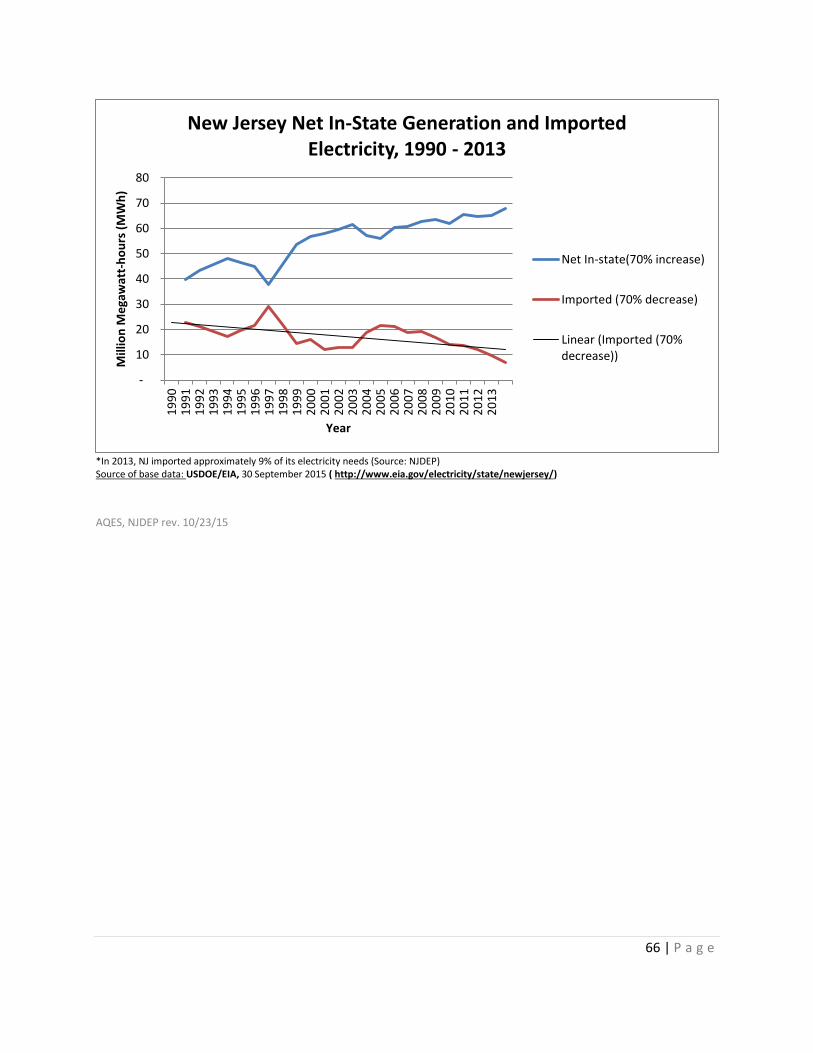
66 | P a g e
*In 2013, NJ imported approximately 9% of its electricity needs (Source: NJDEP) Source of base data: USDOE/EIA, 30 September 2015 ( http://www.eia.gov/electricity/state/newjersey/)
AQES, NJDEP rev. 10/23/15
-
10
20
30
40
50
60
70
801
99
01
99
11
99
21
99
31
99
41
99
51
99
61
99
71
99
81
99
92
00
02
00
12
00
22
00
32
00
42
00
52
00
62
00
72
00
82
00
92
01
02
01
12
01
22
01
3
Mill
ion
Me
gaw
att-
ho
urs
(M
Wh
)
Year
New Jersey Net In-State Generation and Imported Electricity, 1990 - 2013
Net In-state(70% increase)
Imported (70% decrease)
Linear (Imported (70%decrease))
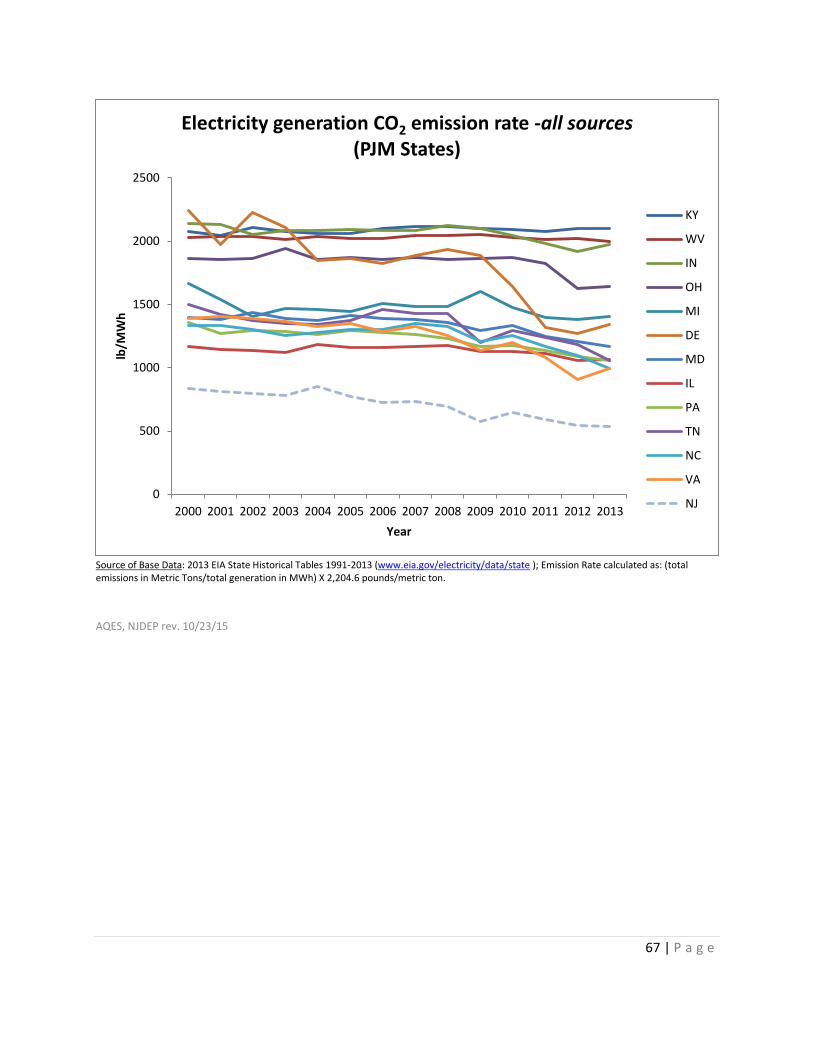
67 | P a g e
Source of Base Data: 2013 EIA State Historical Tables 1991-2013 (www.eia.gov/electricity/data/state ); Emission Rate calculated as: (total emissions in Metric Tons/total generation in MWh) X 2,204.6 pounds/metric ton.
AQES, NJDEP rev. 10/23/15
0
500
1000
1500
2000
2500
2000 2001 2002 2003 2004 2005 2006 2007 2008 2009 2010 2011 2012 2013
lb/M
Wh
Year
Electricity generation CO2 emission rate -all sources (PJM States)
KY
WV
IN
OH
MI
DE
MD
IL
PA
TN
NC
VA
NJ

68 | P a g e
Source of Base Data: 2013 EIA State Historical Tables 1991-2013 (www.eia.gov/electricity/data/state ); Emission Rate calculated as: (total emissions in Metric Tons/total generation in MWh) X 2,204.6 pounds/metric ton.
AQES, NJDEP rev. 10/23/15
0
500
1000
1500
2000
2500
3000
2000 2001 2002 2003 2004 2005 2006 2007 2008 2009 2010 2011 2012 2013
lb/M
Wh
State
Electicity generation CO2 emission rate - fossil sources (PJM States)
IL
TN
KY
MD
WV
IN
MI
OH
PA
VA
NC
DE
NJ

69 | P a g e
*(Vermont excluded; limited power sector) Source of Base Data: 2013 EIA State Historical Tables 1991-2013 (www.eia.gov/electricity/data/state ); Emission Rate calculated as: (total
emissions in Metric Tons/total generation in MWh) X 2,204.6 pounds/metric ton.
AQES, NJDEP rev. 10/23/15
0
500
1000
1500
2000
2500
20002001200220032004200520062007200820092010201120122013
lb/M
Wh
State*
Electricity generation CO2 emission rate - all sources (RGGI States*/NJ)
DE
MD
RI
MA
ME
NY
CT
NJ (non-RGGI)
NH

70 | P a g e
*(Vermont excluded; limited power sector) Source of Base Data: 2013 EIA State Historical Tables 1991-2013 (www.eia.gov/electricity/data/state ); Emission Rate calculated as: (total
emissions in Metric Tons/total generation in MWh) X 2,204.6 pounds/metric ton.
AQES, NJDEP rev. 10/23/15
0
500
1000
1500
2000
2500
20002001200220032004200520062007200820092010201120122013
lb/M
Wh
State*
Electricity generation CO2 emission rate - fossil sources (RGGI States*/NJ)
MD
DE
NH
ME
NY
NJ (non-RGGI)
RI
CT
MA

71 | P a g e
SAGE, NJDEP rev. 03/27/15
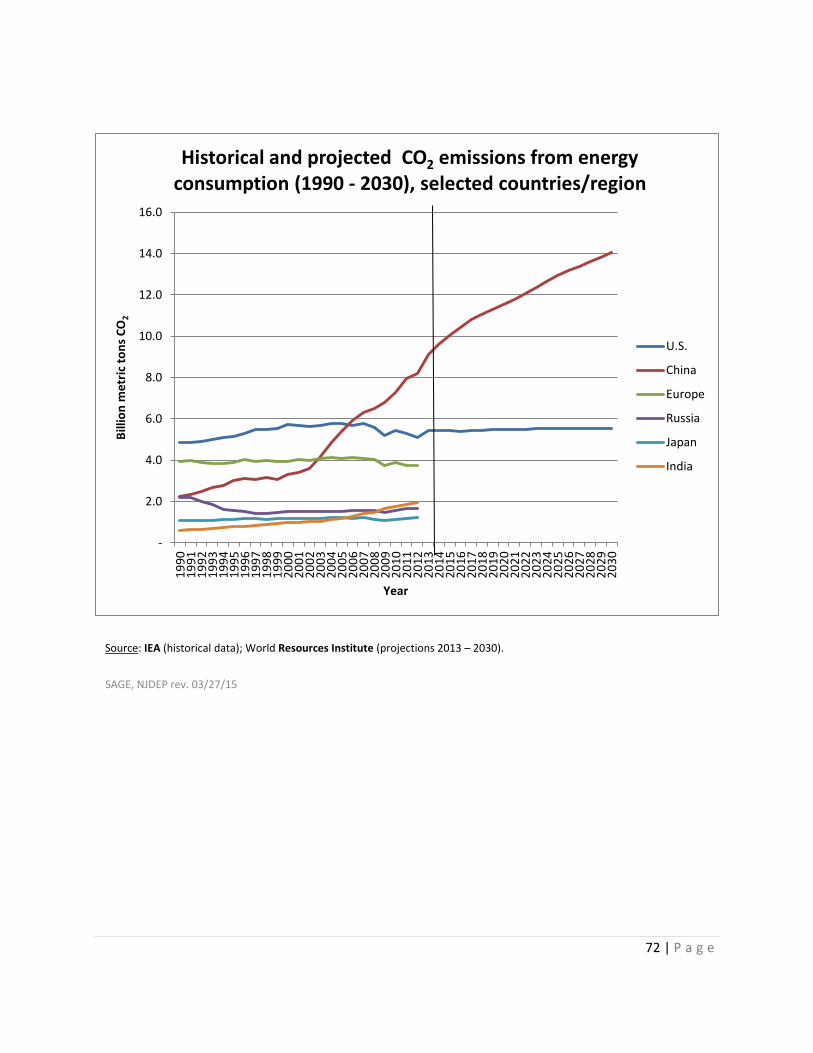
72 | P a g e
-
2.0
4.0
6.0
8.0
10.0
12.0
14.0
16.0
19
90
19
91
19
92
19
93
19
94
19
95
19
96
19
97
19
98
19
99
20
00
20
01
20
02
20
03
20
04
20
05
20
06
20
07
20
08
20
09
20
10
20
11
20
12
20
13
20
14
20
15
20
16
20
17
20
18
20
19
20
20
20
21
20
22
20
23
20
24
20
25
20
26
20
27
20
28
20
29
20
30
Bill
ion
me
tric
to
ns
CO
2
Year
Historical and projected CO2 emissions from energy consumption (1990 - 2030), selected countries/region
U.S.
China
Europe
Russia
Japan
India
Source: IEA (historical data); World Resources Institute (projections 2013 – 2030).
SAGE, NJDEP rev. 03/27/15