New Jersey 2016 Uniform Reporting System Mental Health … · Mental Health Community Services...
28
New Jersey 2016 Mental Health National Outcome Measures (NOMS): SAMHSA Uniform Reporting System Utilization Rates/Number of Consumers Served U.S. State U.S. Rate States Penetration Rate per1,000 population 7,399,821 38.85 22.73 59 Community Utilization per 1,000 population 7,166,128 36.81 22.01 59 State Hospital Utilization per 1,000 population 134,301 0.39 0.41 54 Other Psychiatric Inpatient Utilization per 1,000 population 392,410 1.70 1.53 38 Adult Employment Status U.S. State U.S. Rate States Employed (Percent in Labor Force)* 838,510 43.2% 50.1% 58 Employed (percent with Employment Data)** 838,510 26.8% 24.5% 58 Adult Consumer Survey Measures State U.S. Rate States Positive About Outcome 92.7% 75.7% 50 Child/Family Consumer Survey Measures State U.S. Rate States Positive About Outcome 51.6% 73.5% 47 Readmission Rates:(Civil "non-Forensic" clients) U.S. State U.S. Rate States State Hospital Readmissions: 30 Days 7,715 6.1% 8.8% 50 State Hospital Readmissions: 180 Days 17,365 17.9% 19.7% 51 State Hospital Readmissions: 30 Days: Adults 7,260 6.1% 9.2% 49 State Hospital Readmissions: 180 Days: Adults 16,200 17.9% 20.4% 50 State Hospital Readmissions: 30 Days: Children 393 0.0% 5.0% 18 State Hospital Readmissions: 180 Days: Children 1,027 0.0% 13.1% 20 Living Situation U.S. State U.S. Rate States Private Residence 4,074,919 85.8% 82.5% 58 Homeless/Shelter 191,204 2.6% 3.9% 53 Jail/Correctional Facility 85,835 0.5% 1.7% 53 Adult EBP Services U.S. State U.S. Rate States Supported Housing 86,206 4.9% 3.1% 35 Supported Employment 64,987 1.3% 2.1% 43 Assertive Community Treatment 68,820 1.9% 2.1% 40 Family Psychoeducation 31,676 2.7% 1.9% 15 Dual Diagnosis Treatment 204,574 - 10.5% 26 Illness Self Management 295,788 4.0% 19.0% 21 Medications Management 467,273 - 32.0% 19 Child/Adolescent EBP Services U.S. State U.S. Rate States Therapeutic Foster Care 10,730 6.2% 1.5% 19 Multisystemic Therapy 28,138 2.5% 3.6% 19 Functional Family Therapy 26,027 4.6% 6.9% 13 Change in Social Connectedness State U.S. Rate States Adult Improved Social Connectedness 94.6% 74.4% 50 Child/Family Improved Social Connectedness 71.4% 86.4% 44 *Denominator is the sum of consumers employed and unemployed. **Denominator is the sum of consumers employed, unemployed, and not in labor force. 2016 SAMHSA Uniform Reporting System (URS) Output Tables Page 1 of 28
-
Upload
duongkhanh -
Category
Documents
-
view
216 -
download
0
Transcript of New Jersey 2016 Uniform Reporting System Mental Health … · Mental Health Community Services...

New Jersey 2016 Mental Health National Outcome Measures (NOMS): SAMHSA Uniform Reporting System
Utilization Rates/Number of Consumers Served U.S. State U.S. Rate States Penetration Rate per1,000 population 7,399,821 38.85 22.73 59
Community Utilization per 1,000 population 7,166,128 36.81 22.01 59
State Hospital Utilization per 1,000 population 134,301 0.39 0.41 54
Other Psychiatric Inpatient Utilization per 1,000 population 392,410 1.70 1.53 38
Adult Employment Status U.S. State U.S. Rate States Employed (Percent in Labor Force)* 838,510 43.2% 50.1% 58
Employed (percent with Employment Data)** 838,510 26.8% 24.5% 58
Adult Consumer Survey Measures State U.S. Rate States Positive About Outcome 92.7% 75.7% 50
Child/Family Consumer Survey Measures State U.S. Rate States Positive About Outcome 51.6% 73.5% 47
Readmission Rates:(Civil "non-Forensic" clients) U.S. State U.S. Rate States State Hospital Readmissions: 30 Days 7,715 6.1% 8.8% 50
State Hospital Readmissions: 180 Days 17,365 17.9% 19.7% 51
State Hospital Readmissions: 30 Days: Adults 7,260 6.1% 9.2% 49
State Hospital Readmissions: 180 Days: Adults 16,200 17.9% 20.4% 50
State Hospital Readmissions: 30 Days: Children 393 0.0% 5.0% 18
State Hospital Readmissions: 180 Days: Children 1,027 0.0% 13.1% 20
Living Situation U.S. State U.S. Rate States Private Residence 4,074,919 85.8% 82.5% 58
Homeless/Shelter 191,204 2.6% 3.9% 53
Jail/Correctional Facility 85,835 0.5% 1.7% 53
Adult EBP Services U.S. State U.S. Rate States Supported Housing 86,206 4.9% 3.1% 35
Supported Employment 64,987 1.3% 2.1% 43
Assertive Community Treatment 68,820 1.9% 2.1% 40
Family Psychoeducation 31,676 2.7% 1.9% 15
Dual Diagnosis Treatment 204,574 - 10.5% 26
Illness Self Management 295,788 4.0% 19.0% 21
Medications Management 467,273 - 32.0% 19
Child/Adolescent EBP Services U.S. State U.S. Rate States Therapeutic Foster Care 10,730 6.2% 1.5% 19
Multisystemic Therapy 28,138 2.5% 3.6% 19
Functional Family Therapy 26,027 4.6% 6.9% 13
Change in Social Connectedness State U.S. Rate States Adult Improved Social Connectedness 94.6% 74.4% 50
Child/Family Improved Social Connectedness 71.4% 86.4% 44
*Denominator is the sum of consumers employed and unemployed. **Denominator is the sum of consumers employed, unemployed, and not in labor force.
2016 SAMHSA Uniform Reporting System (URS) Output Tables Page 1 of 28

SAMHSA Uniform Reporting System - 2016 State Mental Health Measures
STATE: New Jersey Utilization State Number State Rate U.S. U.S. Rate States Penetration Rate per 1,000 population 347,980 38.85 7,399,821 22.73 59 Community Utilization per 1,000 population 329,730 36.81 7,166,128 22.01 59 State Hospital Utilization per 1,000 population 3,495 0.39 134,301 0.41 54 Medicaid Funding Status 114,189 39% 4,575,093 70% 56 Employment Status (percent employed) 75,873 27% 838,510 24% 58 State Hospital Adult Admissions 2,064 0.59 101,635 0.83 52 Community Adult Admissions 28,658 0.09 9,890,419 2.31 50 Percent Adults with SMI and Children with SED 136,565 39% 4,979,257 67% 59
Utilization State Rate U.S. Rate States State Hospital LOS Discharged Adult patients (Median) 98 Days 77 Days 50 State Hospital LOS for Adult Resident patients in facility <1 year (Median) 71 Days 71 Days 50 Percent of Client who meet Federal SMI definition 39% 71% 56 Adults with Co-occurring MH/SA Disorders 23% 27% 56 Children with Co-occurring MH/SA Disorders 3% 6% 51
Adult Consumer Survey Measures State Rate U.S. Rate States Access to Services 99% 87% 50 Quality/Appropriateness of Services 97% 90% 50 Outcome from Services 93% 76% 50 Participation in Treatment Planning 100% 85% 50 General Satisfaction with Care 99% 90% 50
Child/Family Consumer Survey Measures State Rate U.S. Rate States Access to Services 73% 86% 47 General Satisfaction with Care 64% 89% 48 Outcome from Services 52% 73% 47 Participation in Treatment Planning 78% 91% 47 Cultural Sensitivity of Providers 81% 95% 47
Consumer Living Situations State Number State Rate U.S. U.S. Rate States Private Residence 259,212 85.8% 4,074,919 82.5% 58 Jail/Correctional Facility 1,404 0.5% 85,835 1.7% 53 Homeless or Shelter 7,761 2.6% 191,204 3.9% 53
Hospital Readmissions State Number State Rate U.S. U.S. Rate States State Hospital Readmissions: 30 Days 113 6.1% 7,715 8.8% 50 State Hospital Readmissions: 180 Days 332 17.9% 17,365 19.7% 51 Readmission to any psychiatric hospital: 30 Days - - 24,829 13.1% 23
State Mental Health Finance (FY2015) State Number State Rate U.S. U.S. Rate States SMHA Expenditures for Community MH * $1,362,959,000 72.0% $28,514,735,678 75.5% 50 SMHA Revenues from State Sources ** $1,020,017,000 54.6% $14,822,947,003 39.3% 50 Total SMHA Expenditures $1,893,329,000 - $37,767,897,721 - 50
Adult Evidence-Based Practices State Number State Rate U.S. U.S. Rate States Assertive Community Treatment 2,485 1.9% 68,820 2.1% 40 Supported Housing 6,280 4.9% 86,206 3.1% 35 Supported Employment 1,710 1.3% 64,987 2.1% 43 Family Psychoeducation 3,411 2.7% 31,676 1.9% 15 Integrated Dual Diagnosis Treatment - - 204,574 10.5% 26 Illness Self-Management and Recovery 5,076 4.0% 295,788 19.0% 21 Medications Management - - 467,273 32.0% 19
Child Evidence Based Practices State Number State Rate U.S. U.S. Rate States Therapeutic Foster Care 494 6.2% 10,730 1.5% 19 Multisystemic Therapy 201 2.5% 28,138 3.6% 19 Functional Family Therapy 367 4.6% 26,027 6.9% 13
Outcome State Number State Rate U.S. U.S. Rate States Adult Criminal Justice Contacts 71 7.4% 24,254 3.7% 35 Juvenile Justice Contacts 9 2.3% 4,730 2.5% 34 School Attendance (Improved ) 88 33.5% 10,645 33.5% 24 * Includes Other 24 -Hour expenditures for state hospitals. ** Revenues for state hospitals and community MH
2016 SAMHSA Uniform Reporting System (URS) Output Tables Page 2 of 28

Mental Health Community Services Block Grant: 2016 State Summary Report
New Jersey
State URS Contact Person
Donna Migliorino
222 South Warren Street 3rd floor Trenton, NJ 08625
6097770669
State Revenue Expenditure Data Amount FY 2015 Mental Health Block Grant Revenues $11,423,000 FY 2015 SMHA Community MH Expenditures $1,362,959,000 FY 2015 Per Capita Community MH Expenditures $152.30 FY 2015 Community Percent of Total SMHA Spending 71.99% FY 2015 Total SMHA Mental Health Expenditure $1,893,329,000 FY 2015 Per Capita Total SMHA Mental Health Expenditures $211.57
Statewide Mental Health Agency Data*
Measure Number of Clients Utilization Rate Per 1,000 Population Total Clients Served by SMHA System 347,980 38.8 Clients Served in Community Settings 329,730 36.8 Clients Served in State Hospitals 3,495 0.4
Gender Percent Female 53.7% Male 46.1% Not Available 0.2%
Age Percent 0 to 12 1.9% 13 to 17 3.7% 18 to 20 3.0% 21 to 24 5.2% 25 to 44 30.1% 45 to 64 38.4% 65 to 74 9.5% 75 and over 7.7% Not Available 0.5%
Race/Ethnicity Percent American Indian or Alaska Native 1.0% Asian 1.4% Black or African American 18.9% Native Hawaiian or Other Pacific Islander -White 54.2% Hispanic or Latino 15.4% More Than One Race -Not Available 9.1%
Living Situation (with Known Status) Percent Private Residence 85.8% Foster Home 0.7% Residential Care 5.0% Crisis Residence -Residential Treatment Center 0.2% Institutional Setting 1.8% Jail (Correctional Facility) 0.5% Homeless (Shelter) 2.6% Other 3.4% Not Available -
Employment With Known Status (Adults) Percent Employed 26.8% Unemployed 35.2% Not In Labor Force 38.1%
Medicaid Funding Status of Consumers Percent Medicaid Only 31.0% Non-Medicaid 60.6% Both Medicaid and Other Funds 8.3%
Consumer Perception of Care: (Adults) Percent Access to Services 98.6% Quality/Appropriateness of Services 96.9% Outcome from Services 92.7% Participation in Treatment Planning 99.6% Overall Satisfaction with Care 98.6%
Consumer Perception of Care: (Children/Adolescents) Percent Access to Services 72.9% Overall Satisfaction with Care 63.9% Outcome from Services 51.6% Participation in Treatment Planning 78.4% Cultural Sensitivity of Providers 80.6%
Implementation of Evidence-Based Practices Percent Assertive Community Treatment 1.9% Supported Housing 4.9% Supported Employment 1.3% Family Psychoeducation 2.7% Integrated Dual Diagnosis Treatment -Illness Self-Management and Recovery 4.0% Medications Management -Therapeutic Foster Care 6.2% Multisystemic Therapy 2.5% Functional Family Therapy 4.6%
Outcome Measures Developmental Percent Adults Arrested this Year 7.4% Youth Arrested this Year 2.3% Improved School Attendance 33.5%
Hospital Readmissions (Civil Status Patients) Percent State Hospital Readmissions: 30 Days 6.1% State Hospital Readmissions: 180 Days 17.9% Readmission to any psychiatric hospital: 30 Days -
* Based on 2016 URS data provided by US States and Territories per annual reporting guidelines.
The Community Mental Health Block Grant is administered by the Center for Mental Health Services within the Substance Abuse and Mental Health Services Administration of the US Department of Health and Human Services
2016 SAMHSA Uniform Reporting System (URS) Output Tables Page 3 of 28

Access Domain: Demographic Characteristics of Persons Served by the State Mental Health Authority, FY 2016
New Jersey
Demographics
Total Served Penetration Rates
(per 1,000 population) States
Reporting State US
n % n % State Northeast US Total 347,980 100.0% 7,399,821 100.0% 38.8 34.3 22.7 59
0-12 6,577 1.9% 1,139,960 15.4% 4.6 30.9 21.6 58
13-17 12,703 3.7% 891,065 12.0% 21.8 60.7 42.6 59
18-20 10,481 3.0% 332,993 4.5% 31.8 35.9 25.9 59
21-24 18,253 5.2% 431,906 5.8% 39.4 35.1 23.5 59
25-44 104,715 30.1% 2,284,707 30.9% 45.2 38.4 27.0 59
45-64 133,620 38.4% 1,961,198 26.5% 53.4 36.3 23.3 59
65-74 32,987 9.5% 244,447 3.3% 43.8 18.5 8.9 59
75 and over 26,871 7.7% 106,393 1.4% 45.5 13.1 5.3 57
Age Not Available 1,773 0.5% 7,152 0.1% - - - 21
Female 186,755 53.7% 3,842,490 51.9% 40.7 35.0 23.2 59
Male 160,504 46.1% 3,546,582 47.9% 36.7 33.5 22.1 59
Gender Not Available 721 0.2% 10,749 0.1% - - - 38
American Indian/Alaskan Native 3,490 1.0% 95,255 1.3% 64.9 28.2 23.7 53
Asian 4,929 1.4% 98,807 1.3% 5.7 7.5 5.5 56
Black/African American 65,942 18.9% 1,398,629 18.9% 49.6 52.7 32.8 53
Native Hawaiian/Pacific Islander - - 19,225 0.3% - 42.0 25.6 54
White 188,438 54.2% 4,555,965 61.6% 29.0 26.4 18.4 56
Hispanic or Latino Race 53,513 15.4% 66,894 0.9% 30.4 - 3.2 13
Multi-Racial - - 175,604 2.4% - 25.8 22.5 53
Race Not Available 31,668 9.1% 989,442 13.4% - - - 53
Hispanic or Latino Ethnicity 53,513 15.4% 1,023,429 14.5% 30.4 41.5 18.2 55
Not Hispanic or Latino Ethnicity 285,368 82.0% 5,268,997 74.8% 39.7 31.6 20.4 57
Ethnicity Not Available 9,099 2.6% 755,352 10.7% - - - 50
Note:
Are Client Counts Unduplicated? Unduplicated Number of States with Unduplicated Counts 43
This table uses data from URS Table 2a, Table 2b and from the US Census Bureau. All denominators use US Census data from 2015
US totals are calculated uniquely for each data element based on only those states who reported clients served.
Regional groupings are based on SAMHSA's Block Grant Regions.
State Notes: Table 2a Age None Gender None Race None Overall None Table 2b Age None Gender None Race None Overall None
2016 SAMHSA Uniform Reporting System (URS) Output Tables Page 4 of 28
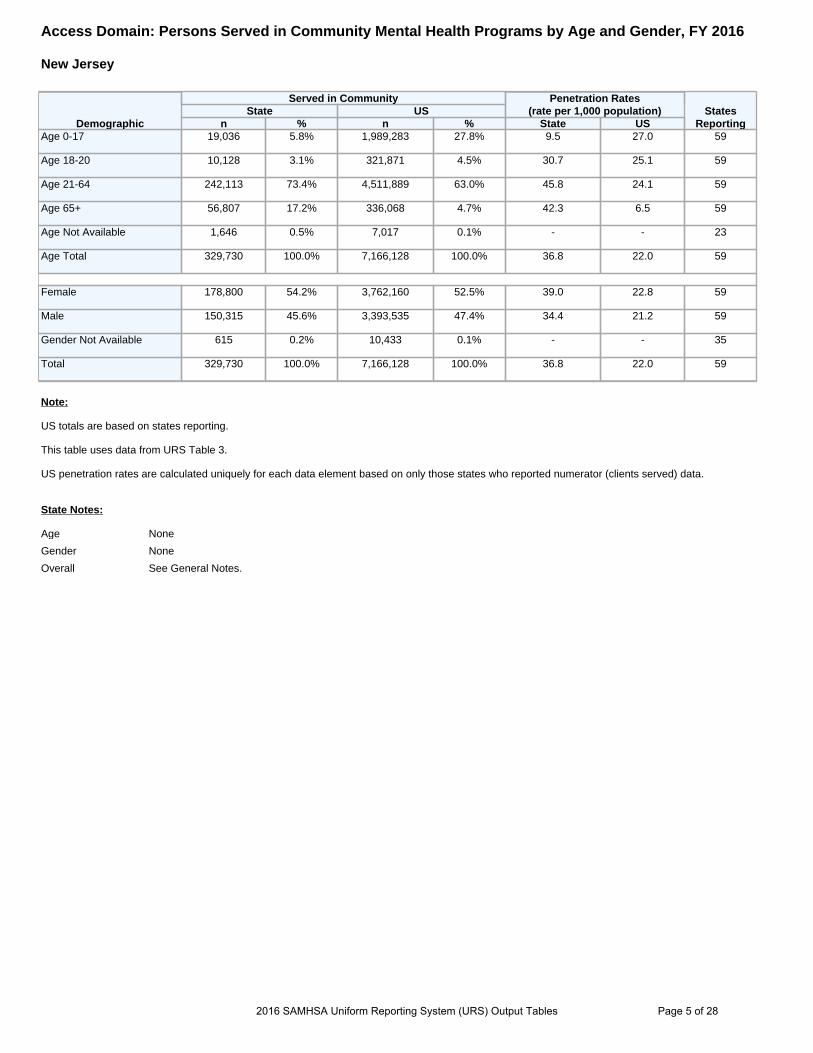
Access Domain: Persons Served in Community Mental Health Programs by Age and Gender, FY 2016
New Jersey
Demographic
Served in Community Penetration Rates (rate per 1,000 population) States
Reporting State US
n % n % State US Age 0-17 19,036 5.8% 1,989,283 27.8% 9.5 27.0 59
Age 18-20 10,128 3.1% 321,871 4.5% 30.7 25.1 59
Age 21-64 242,113 73.4% 4,511,889 63.0% 45.8 24.1 59
Age 65+ 56,807 17.2% 336,068 4.7% 42.3 6.5 59
Age Not Available 1,646 0.5% 7,017 0.1% - - 23
Age Total 329,730 100.0% 7,166,128 100.0% 36.8 22.0 59
Female 178,800 54.2% 3,762,160 52.5% 39.0 22.8 59
Male 150,315 45.6% 3,393,535 47.4% 34.4 21.2 59
Gender Not Available 615 0.2% 10,433 0.1% - - 35
Total 329,730 100.0% 7,166,128 100.0% 36.8 22.0 59
Note:
US totals are based on states reporting.
This table uses data from URS Table 3.
US penetration rates are calculated uniquely for each data element based on only those states who reported numerator (clients served) data.
State Notes:
Age None
Gender None
Overall See General Notes.
2016 SAMHSA Uniform Reporting System (URS) Output Tables Page 5 of 28
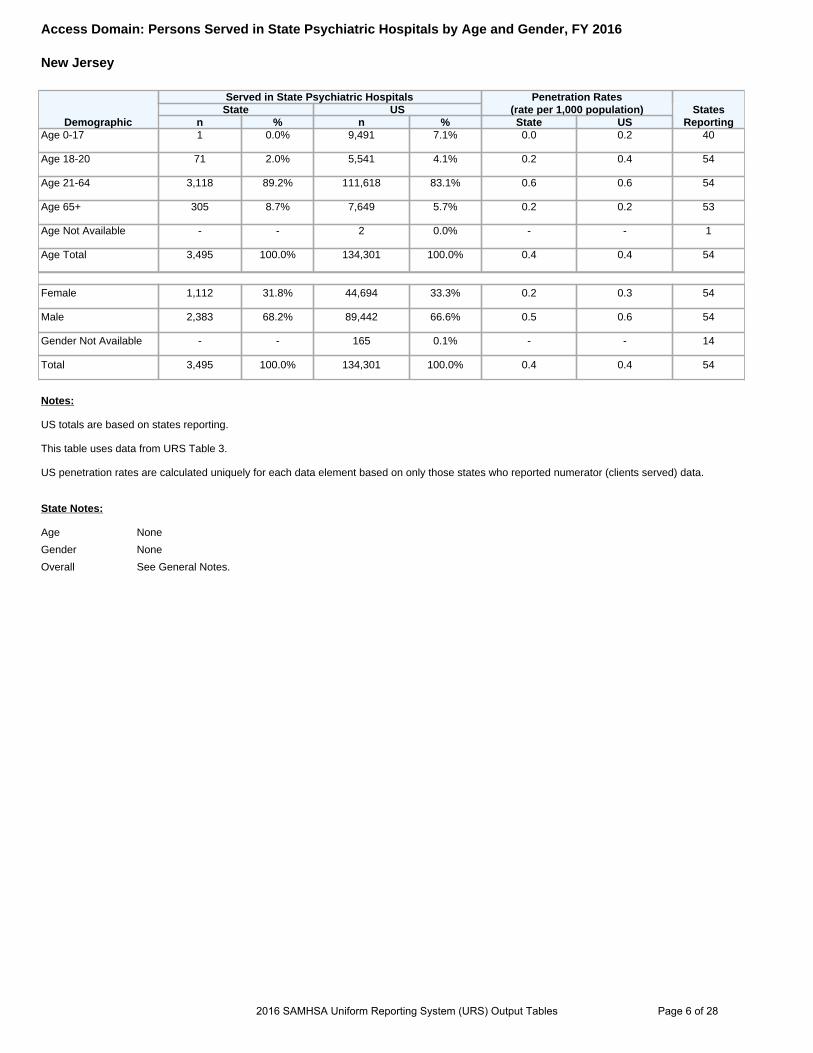
Access Domain: Persons Served in State Psychiatric Hospitals by Age and Gender, FY 2016
New Jersey
Demographic
Served in State Psychiatric Hospitals Penetration Rates (rate per 1,000 population) States
Reporting State US
n % n % State US Age 0-17 1 0.0% 9,491 7.1% 0.0 0.2 40
Age 18-20 71 2.0% 5,541 4.1% 0.2 0.4 54
Age 21-64 3,118 89.2% 111,618 83.1% 0.6 0.6 54
Age 65+ 305 8.7% 7,649 5.7% 0.2 0.2 53
Age Not Available - - 2 0.0% - - 1
Age Total 3,495 100.0% 134,301 100.0% 0.4 0.4 54
Female 1,112 31.8% 44,694 33.3% 0.2 0.3 54
Male 2,383 68.2% 89,442 66.6% 0.5 0.6 54
Gender Not Available - - 165 0.1% - - 14
Total 3,495 100.0% 134,301 100.0% 0.4 0.4 54
Notes:
US totals are based on states reporting.
This table uses data from URS Table 3.
US penetration rates are calculated uniquely for each data element based on only those states who reported numerator (clients served) data.
State Notes:
Age None
Gender None
Overall See General Notes.
2016 SAMHSA Uniform Reporting System (URS) Output Tables Page 6 of 28

Access Domain: Demographic Characteristics of Adults with SMI and Children with SED Served by the State Mental Health Authority, FY 2016 New Jersey
Demographics
Total Served Penetration Rates
(per 1,000 population) States
Reporting State US
n % n % State Northeast US Total 136,565 100.0% 4,979,257 100.0% 15.2 19.8 15.3 59
0-12 2,735 2.0% 769,252 15.4% 1.9 17.8 14.6 56
13-17 5,230 3.8% 639,492 12.8% 9.0 35.9 30.6 58
18-20 3,828 2.8% 205,480 4.1% 11.6 18.9 16.0 57
21-64 98,312 72.0% 3,143,936 63.1% 18.6 21.6 16.8 59
65-74 13,058 9.6% 162,995 3.3% 17.3 10.7 5.9 57
75 and over 12,700 9.3% 56,810 1.1% 21.5 6.1 3.1 56
Age Not Available 702 0.5% 1,292 0.0% - - - 15
Female 69,751 51.1% 2,568,128 51.6% 15.2 19.3 15.5 59
Male 66,596 48.8% 2,407,025 48.3% 15.2 20.3 15.0 59
Gender Not Available 218 0.2% 4,104 0.1% - - - 33
American Indian/Alaskan Native 1,210 0.9% 59,621 1.2% 22.5 12.1 14.9 53
Asian 1,840 1.3% 70,332 1.4% 2.1 4.6 3.9 55
Black/African American 30,256 22.2% 993,826 20.0% 22.7 32.2 23.3 53
Native Hawaiian/Pacific Islander - - 13,171 0.3% - 28.0 17.3 53
White 68,836 50.4% 3,017,387 60.6% 10.6 14.8 12.2 55
Hispanic or Latino Race 23,589 17.3% 31,915 0.6% 13.4 - 0.6 11
Multi-Racial - - 129,446 2.6% - 17.2 15.7 52
Race Not Available 10,834 7.9% 663,559 13.3% - - - 52
Hispanic or Latino Ethnicity 23,589 17.3% 738,467 15.7% 13.4 26.4 13.0 54
Not Hispanic or Latino Ethnicity 108,540 79.5% 3,508,996 74.5% 15.1 18.0 13.3 57
Ethnicity Not Available 4,436 3.2% 464,666 9.9% - - - 47
Note: This table uses data from URS Table 14a, Table 14b and from the US Census Bureau. All denominators use US Census data from 2015
US totals are calculated uniquely for each data element based on only those states who reported clients served.
Regional groupings are based on SAMHSA's Block Grant Regions.
State Notes:
Table 14a Age None Gender None Race None Overall None Table 14b Age None Gender None Race None Overall None
2016 SAMHSA Uniform Reporting System (URS) Output Tables Page 7 of 28
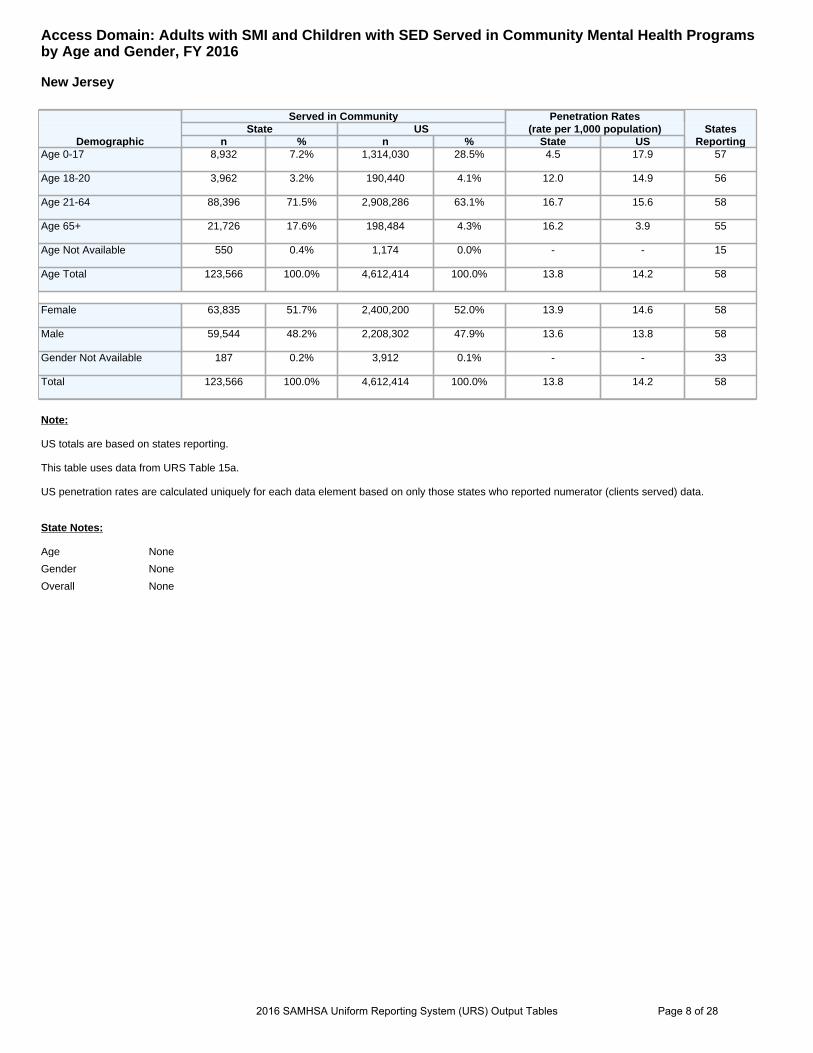
Access Domain: Adults with SMI and Children with SED Served in Community Mental Health Programs by Age and Gender, FY 2016
New Jersey
Demographic
Served in Community Penetration Rates (rate per 1,000 population) States
Reporting State US
n % n % State US Age 0-17 8,932 7.2% 1,314,030 28.5% 4.5 17.9 57
Age 18-20 3,962 3.2% 190,440 4.1% 12.0 14.9 56
Age 21-64 88,396 71.5% 2,908,286 63.1% 16.7 15.6 58
Age 65+ 21,726 17.6% 198,484 4.3% 16.2 3.9 55
Age Not Available 550 0.4% 1,174 0.0% - - 15
Age Total 123,566 100.0% 4,612,414 100.0% 13.8 14.2 58
Female 63,835 51.7% 2,400,200 52.0% 13.9 14.6 58
Male 59,544 48.2% 2,208,302 47.9% 13.6 13.8 58
Gender Not Available 187 0.2% 3,912 0.1% - - 33
Total 123,566 100.0% 4,612,414 100.0% 13.8 14.2 58
Note:
US totals are based on states reporting.
This table uses data from URS Table 15a.
US penetration rates are calculated uniquely for each data element based on only those states who reported numerator (clients served) data.
State Notes:
Age None
Gender None
Overall None
2016 SAMHSA Uniform Reporting System (URS) Output Tables Page 8 of 28
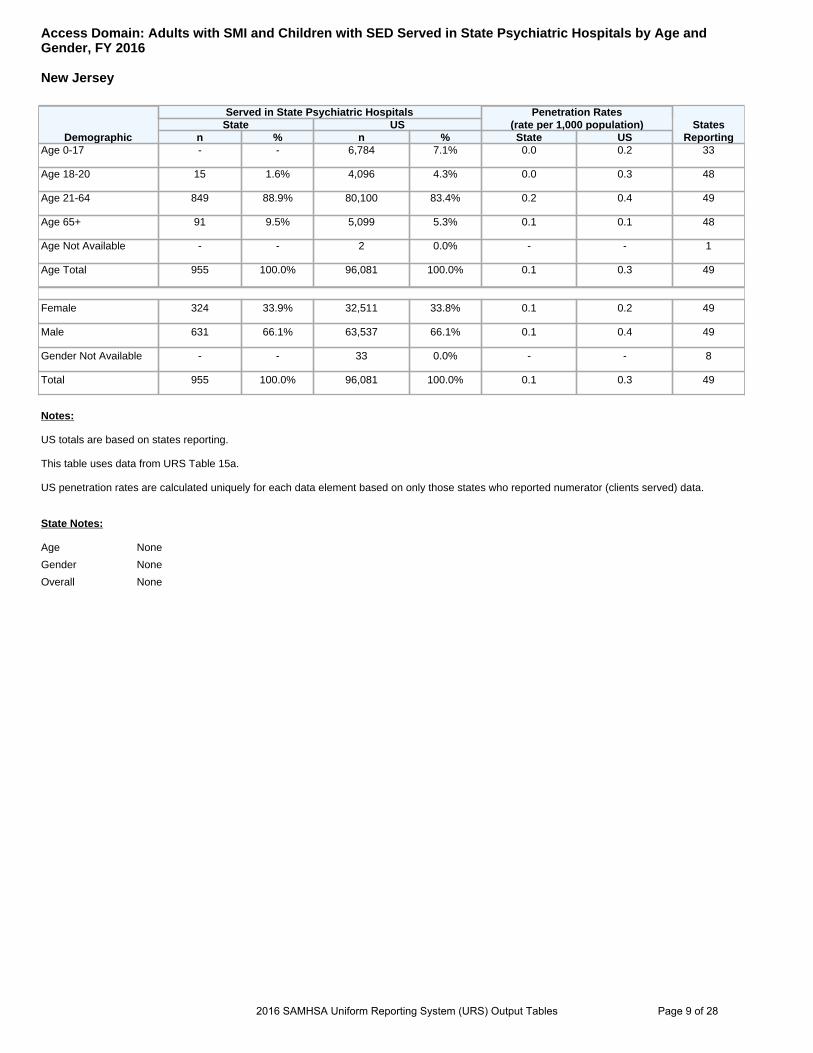
Access Domain: Adults with SMI and Children with SED Served in State Psychiatric Hospitals by Age and Gender, FY 2016
New Jersey
Demographic
Served in State Psychiatric Hospitals Penetration Rates (rate per 1,000 population) States
Reporting State US
n % n % State US Age 0-17 - - 6,784 7.1% 0.0 0.2 33
Age 18-20 15 1.6% 4,096 4.3% 0.0 0.3 48
Age 21-64 849 88.9% 80,100 83.4% 0.2 0.4 49
Age 65+ 91 9.5% 5,099 5.3% 0.1 0.1 48
Age Not Available - - 2 0.0% - - 1
Age Total 955 100.0% 96,081 100.0% 0.1 0.3 49
Female 324 33.9% 32,511 33.8% 0.1 0.2 49
Male 631 66.1% 63,537 66.1% 0.1 0.4 49
Gender Not Available - - 33 0.0% - - 8
Total 955 100.0% 96,081 100.0% 0.1 0.3 49
Notes:
US totals are based on states reporting.
This table uses data from URS Table 15a.
US penetration rates are calculated uniquely for each data element based on only those states who reported numerator (clients served) data.
State Notes:
Age None
Gender None
Overall None
2016 SAMHSA Uniform Reporting System (URS) Output Tables Page 9 of 28

Appropriateness Domain: Percent of Adults and Children Served Who Meet the Federal Definition for SMI/SED and Percent of Adults and Children Served Who Have Co-Occurring MH/AOD Disorders, FY 2016
New Jersey
Adults and Children who meet the Federal Definition of SMI/SED State US Average US Median States
Reporting Percent of Adults served through the SMHA who meet the Federal definition for SMI 39.1% 70.6% 71.0% 56
Percent of Children served through the SMHA who meet the Federal definition for SED 41.3% 70.9% 71.5% 56
Co-occurring MH and Substance Abuse Consumers State US Average US Median States
Reporting Percent of Adults served through the SMHA who had a co-occurring MH and AOD disorder 22.9% 26.9% 22.0% 56
Percent of Children served through the SMHA who had a co-occurring MH and AOD disorder 3.0% 5.9% 3.0% 55
Percent of Adults served through the SMHA who met the Federal definitions of SMI who also have a substance abuse diagnosis 28.7% 25.1% 20.0% 53
Percent of Children served through the SMHA who met the Federal definitions of SED who also have a substance abuse diagnosis 4.1% 7.9% 3.0% 52
Note
This table uses data from URS Table 12.
State Notes None
2016 SAMHSA Uniform Reporting System (URS) Output Tables Page 10 of 28
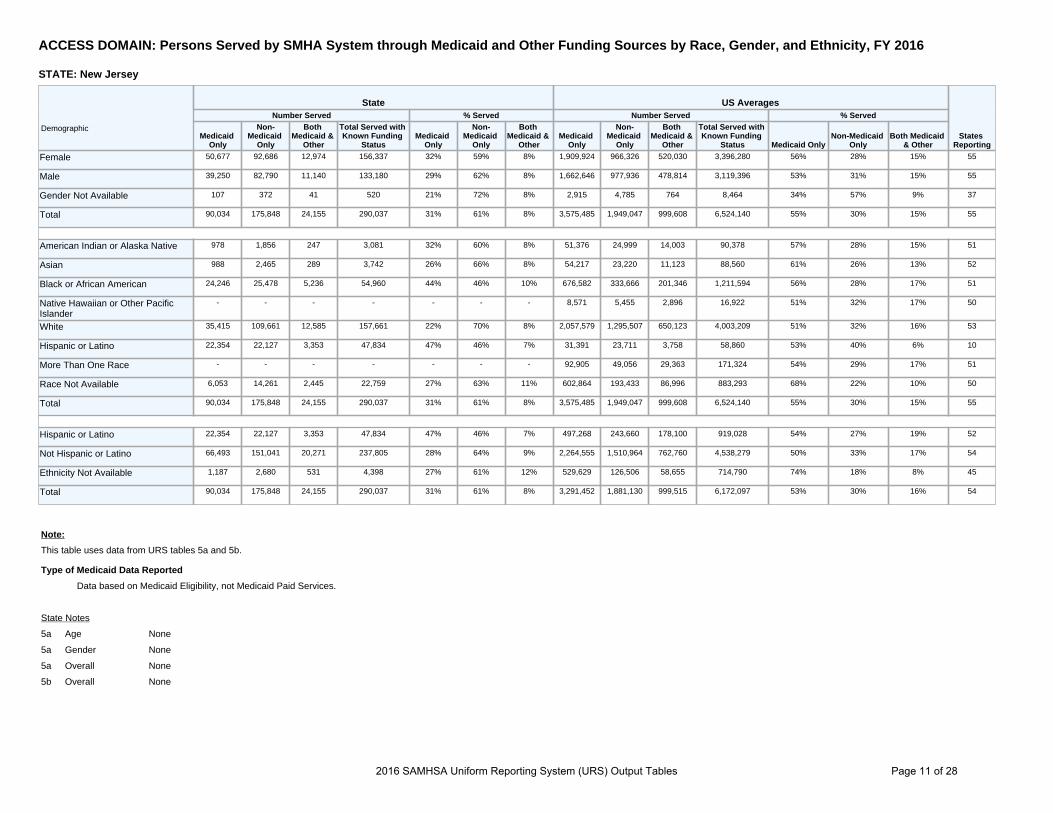
ACCESS DOMAIN: Persons Served by SMHA System through Medicaid and Other Funding Sources by Race, Gender, and Ethnicity, FY 2016
STATE: New Jersey
Demographic
State US Averages
States Reporting
Number Served % Served Number Served % Served
Medicaid Only
Non-Medicaid
Only
Both Medicaid &
Other
Total Served with Known Funding
Status Medicaid
Only
Non-Medicaid
Only
Both Medicaid &
Other Medicaid
Only
Non-Medicaid
Only
Both Medicaid &
Other
Total Served with Known Funding
Status Medicaid Only Non-Medicaid
Only Both Medicaid
& Other
Female 50,677 92,686 12,974 156,337 32% 59% 8% 1,909,924 966,326 520,030 3,396,280 56% 28% 15% 55
Male 39,250 82,790 11,140 133,180 29% 62% 8% 1,662,646 977,936 478,814 3,119,396 53% 31% 15% 55
Gender Not Available 107 372 41 520 21% 72% 8% 2,915 4,785 764 8,464 34% 57% 9% 37
Total 90,034 175,848 24,155 290,037 31% 61% 8% 3,575,485 1,949,047 999,608 6,524,140 55% 30% 15% 55
American Indian or Alaska Native 978 1,856 247 3,081 32% 60% 8% 51,376 24,999 14,003 90,378 57% 28% 15% 51
Asian 988 2,465 289 3,742 26% 66% 8% 54,217 23,220 11,123 88,560 61% 26% 13% 52
Black or African American 24,246 25,478 5,236 54,960 44% 46% 10% 676,582 333,666 201,346 1,211,594 56% 28% 17% 51
Native Hawaiian or Other Pacific Islander
- - - - - - - 8,571 5,455 2,896 16,922 51% 32% 17% 50
White 35,415 109,661 12,585 157,661 22% 70% 8% 2,057,579 1,295,507 650,123 4,003,209 51% 32% 16% 53
Hispanic or Latino 22,354 22,127 3,353 47,834 47% 46% 7% 31,391 23,711 3,758 58,860 53% 40% 6% 10
More Than One Race - - - - - - - 92,905 49,056 29,363 171,324 54% 29% 17% 51
Race Not Available 6,053 14,261 2,445 22,759 27% 63% 11% 602,864 193,433 86,996 883,293 68% 22% 10% 50
Total 90,034 175,848 24,155 290,037 31% 61% 8% 3,575,485 1,949,047 999,608 6,524,140 55% 30% 15% 55
Hispanic or Latino 22,354 22,127 3,353 47,834 47% 46% 7% 497,268 243,660 178,100 919,028 54% 27% 19% 52
Not Hispanic or Latino 66,493 151,041 20,271 237,805 28% 64% 9% 2,264,555 1,510,964 762,760 4,538,279 50% 33% 17% 54
Ethnicity Not Available 1,187 2,680 531 4,398 27% 61% 12% 529,629 126,506 58,655 714,790 74% 18% 8% 45
Total 90,034 175,848 24,155 290,037 31% 61% 8% 3,291,452 1,881,130 999,515 6,172,097 53% 30% 16% 54
Note:
This table uses data from URS tables 5a and 5b.
Type of Medicaid Data Reported
Data based on Medicaid Eligibility, not Medicaid Paid Services.
State Notes
5a Age None
5a Gender None
5a Overall None
5b Overall None
2016 SAMHSA Uniform Reporting System (URS) Output Tables Page 11 of 28
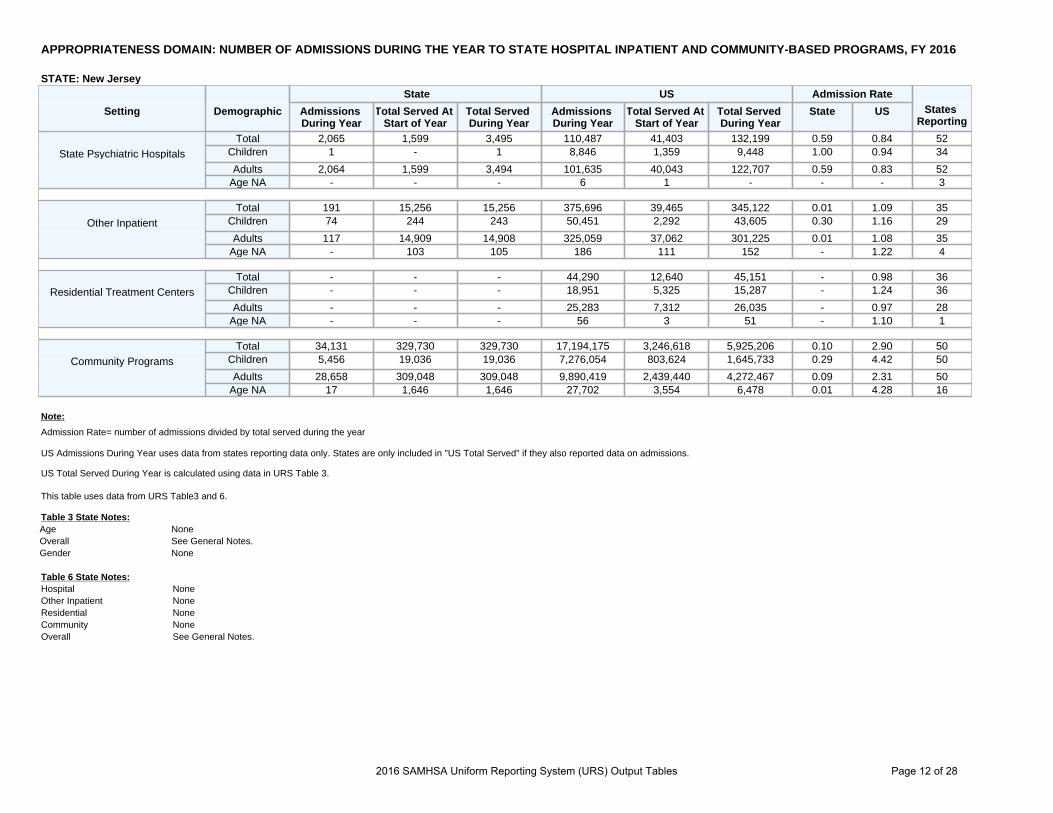
APPROPRIATENESS DOMAIN: NUMBER OF ADMISSIONS DURING THE YEAR TO STATE HOSPITAL INPATIENT AND COMMUNITY-BASED PROGRAMS, FY 2016
STATE: New Jersey
Setting Demographic
State US Admission Rate States
Reporting Admissions During Year
Total Served At Start of Year
Total Served During Year
Admissions During Year
Total Served At Start of Year
Total Served During Year
State US
State Psychiatric Hospitals Total 2,065 1,599 3,495 110,487 41,403 132,199 0.59 0.84 52
Children 1 - 1 8,846 1,359 9,448 1.00 0.94 34
Adults 2,064 1,599 3,494 101,635 40,043 122,707 0.59 0.83 52 Age NA - - - 6 1 - - - 3
Other Inpatient Total 191 15,256 15,256 375,696 39,465 345,122 0.01 1.09 35
Children 74 244 243 50,451 2,292 43,605 0.30 1.16 29
Adults 117 14,909 14,908 325,059 37,062 301,225 0.01 1.08 35 Age NA - 103 105 186 111 152 - 1.22 4
Residential Treatment Centers Total - - - 44,290 12,640 45,151 - 0.98 36
Children - - - 18,951 5,325 15,287 - 1.24 36
Adults - - - 25,283 7,312 26,035 - 0.97 28 Age NA - - - 56 3 51 - 1.10 1
Community Programs Total 34,131 329,730 329,730 17,194,175 3,246,618 5,925,206 0.10 2.90 50
Children 5,456 19,036 19,036 7,276,054 803,624 1,645,733 0.29 4.42 50
Adults 28,658 309,048 309,048 9,890,419 2,439,440 4,272,467 0.09 2.31 50 Age NA 17 1,646 1,646 27,702 3,554 6,478 0.01 4.28 16
Note:
Admission Rate= number of admissions divided by total served during the year
US Admissions During Year uses data from states reporting data only. States are only included in "US Total Served" if they also reported data on admissions.
US Total Served During Year is calculated using data in URS Table 3.
This table uses data from URS Table3 and 6.
Table 3 State Notes: Age None Overall See General Notes. Gender None
Table 6 State Notes: Hospital None Other Inpatient None Residential None Community None Overall See General Notes.
2016 SAMHSA Uniform Reporting System (URS) Output Tables Page 12 of 28

APPROPRIATENESS DOMAIN: Length of Stays in State Psychiatric Hospitals, Other Psychiatric Inpatient and Residential Treatment Centers for Children Settings, FY 2016
STATE: New Jersey
Setting Demographic
State US
Length of Stay (Days) Length of Stay (Days)
Discharged Clients
Resident Clients in Facility 1 year
or less
Resident Clients in Facility more
than 1 year
Discharged Clients
Resident Clients in Facility 1 year
or less
Resident Clients in Facility more
than 1 year States
ReportingAverage Median Average Median Average Median Average Median Average Median Average Median
State Hospitals
All - - - - - - 180 60 105 79 1,692 1,074 15
Children 34 34 34 34 - - 78 65 70 61 539 555 27
Adults 310 98 100 71 1,269 674 242 77 95 71 1,579 1,057 51
Age NA - - - - - - 88 92 6 6 - - 1
Other Inpatient
All - - - - - - 38 13 47 36 922 758 6
Children 21 9 21 9 - - 17 7 31 25 602 590 20
Adults 152 41 62 36 1,078 759 28 12 40 30 894 715 30
Age NA - - - - - - 13 9 95 111 - - 2
Residential Treatment Centers
All - - - - - - 168 117 142 146 615 548 5
Children - - - - - - 185 156 137 128 622 660 27
Adults - - - - - - 251 207 115 117 1,213 1,069 17
Age NA - - - - - - 13 10 59 8 541 541 1
Note:
Resident clients are clients who were receiving services in inpatient settings at the end of the reporting period.
This table uses data from URS Table 6.
Table 6 State Notes:
Hospital None
Other Inpatient None
Residential None
Community None
Overall See General Notes.
2016 SAMHSA Uniform Reporting System (URS) Output Tables Page 13 of 28

Appropriateness Domain: Evidence-Based Practices Reported by SMHAs, FY 2016
New Jersey
Adult EBP Services
State US Penetration Rate: % of Consumers Receiving EBP/Estimated SMI
Measuring Fidelity
States ReportingEBP N SMI N EBP N SMI N State US Average State US
Supported Housing 6,280 127,898 86,206 3,487,105 4.9% 3.1% No 7 35 Supported Employment 1,710 127,898 64,987 3,487,105 1.3% 2.1% No 18 43 Assertive Community Treatment 2,485 127,898 68,820 3,487,105 1.9% 2.1% Yes 26 40 Family Psychoeducation 3,411 127,898 31,676 3,487,105 2.7% 1.9% No 2 15 Dual Diagnosis Treatment - 204,574 3,487,105 - 10.5% - 10 26 Illness Self Management 5,076 127,898 295,788 3,487,105 4.0% 19.0% Yes 5 21 Medication Management - 467,273 3,487,105 - 32.0% - 1 19
Child/Adolescent EBP Services
State US Penetration Rate: % of Consumers Receiving EBP/Estimated SED
Measuring Fidelity
States ReportingEBP N SED N EBP N SED N State US Average State US
Therapeutic Foster Care 494 7,965 10,730 1,244,995 6.2% 1.5% No 4 19 Multi-Systemic Therapy 201 7,965 28,138 1,244,995 2.5% 3.6% Yes 9 19 Family Functional Therapy 367 7,965 26,027 1,244,995 4.6% 6.9% Yes 4 13
Note:
US totals are based on states reporting.
This table uses data from URS Tables 16 and 17.
US averages are calculated uniquely for each data element based on only those states who reported numerator (clients served) data.
State Notes:
Table 16: See General Notes. Table 17: See General Notes.
2016 SAMHSA Uniform Reporting System (URS) Output Tables Page 14 of 28
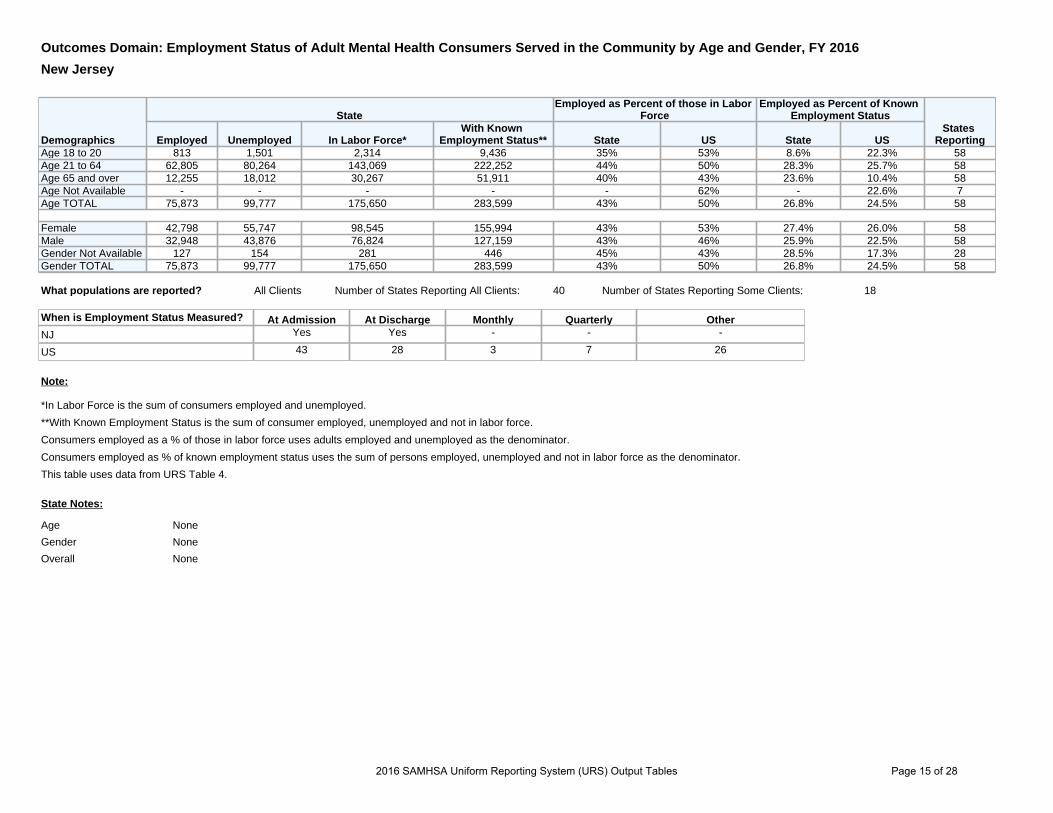
Outcomes Domain: Employment Status of Adult Mental Health Consumers Served in the Community by Age and Gender, FY 2016
New Jersey
Demographics
State Employed as Percent of those in Labor
Force Employed as Percent of Known
Employment Status States
ReportingEmployed Unemployed In Labor Force* With Known
Employment Status** State US State US Age 18 to 20 813 1,501 2,314 9,436 35% 53% 8.6% 22.3% 58 Age 21 to 64 62,805 80,264 143,069 222,252 44% 50% 28.3% 25.7% 58 Age 65 and over 12,255 18,012 30,267 51,911 40% 43% 23.6% 10.4% 58 Age Not Available - - - - - 62% - 22.6% 7 Age TOTAL 75,873 99,777 175,650 283,599 43% 50% 26.8% 24.5% 58
Female 42,798 55,747 98,545 155,994 43% 53% 27.4% 26.0% 58 Male 32,948 43,876 76,824 127,159 43% 46% 25.9% 22.5% 58 Gender Not Available 127 154 281 446 45% 43% 28.5% 17.3% 28 Gender TOTAL 75,873 99,777 175,650 283,599 43% 50% 26.8% 24.5% 58
What populations are reported? All Clients Number of States Reporting All Clients: 40 Number of States Reporting Some Clients: 18
When is Employment Status Measured? At Admission At Discharge Monthly Quarterly Other NJ Yes Yes - - -
US 43 28 3 7 26
Note:
*In Labor Force is the sum of consumers employed and unemployed.
**With Known Employment Status is the sum of consumer employed, unemployed and not in labor force.
Consumers employed as a % of those in labor force uses adults employed and unemployed as the denominator.
Consumers employed as % of known employment status uses the sum of persons employed, unemployed and not in labor force as the denominator.
This table uses data from URS Table 4.
State Notes:
Age None
Gender None
Overall None
2016 SAMHSA Uniform Reporting System (URS) Output Tables Page 15 of 28

Outcomes Domain: Employment Status of Adult Mental Health Consumers Served in the Community by Diagnosis, FY 2016
New Jersey
Diagnosis
State Employed as a % of Labor Force
Employed as % of Known Employment Status
% of Consumers with Dx
States ReportingEmployed Unemployed In Labor Force*
With Known Employment
Status** State US State US State US
Schizophrenia and Related Disorders 1,817 13,368 15,185 26,605 12.0% 31.2% 6.8% 7.2% 9.4% 11.3% 51
Bipolar and Mood Disorders 20,442 34,118 54,560 80,080 37.5% 47.6% 25.5% 17.2% 28.2% 39.5% 52
Other Psychoses 546 1,716 2,262 3,596 24.1% 31.3% 15.2% 8.5% 1.3% 2.7% 49
All other Diagnoses 36,510 29,563 66,073 110,237 55.3% 54.9% 33.1% 18.8% 38.9% 31.8% 52
No Diagnosis and Deferred Diagnosis 16,558 21,012 37,570 63,081 44.1% 63.8% 26.2% 25.1% 22.2% 14.7% 46
TOTAL 75,873 99,777 175,650 283,599 43.2% 51.1% 26.8% 17.5% 100.0% 100.0% 52
Note:
*In Labor Force is the sum of consumers employed and unemployed.
**With Known Employment Status is the sum of consumer employed, unemployed and not in labor force.
Consumers employed as a % of those in labor force uses adults employed and unemployed as the denominator.
Consumers employed as % of known employment status uses the sum of persons employed, unemployed and not in labor force as the denominator.
This table uses data for URS Table 4a.
State Notes:
None
2016 SAMHSA Uniform Reporting System (URS) Output Tables Page 16 of 28
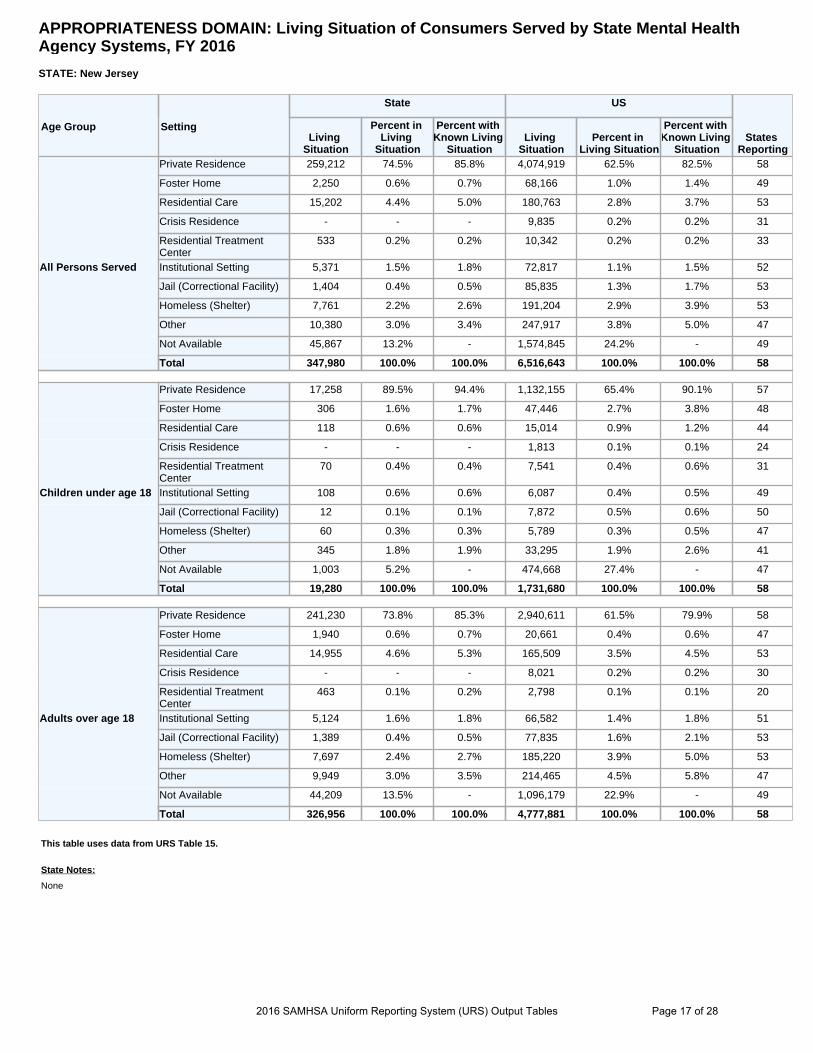
APPROPRIATENESS DOMAIN: Living Situation of Consumers Served by State Mental Health Agency Systems, FY 2016
STATE: New Jersey
Age Group Setting
State US
States Reporting
Living Situation
Percent in Living
Situation
Percent with Known Living
Situation Living
Situation Percent in
Living Situation
Percent with Known Living
Situation
All Persons Served
Private Residence 259,212 74.5% 85.8% 4,074,919 62.5% 82.5% 58
Foster Home 2,250 0.6% 0.7% 68,166 1.0% 1.4% 49
Residential Care 15,202 4.4% 5.0% 180,763 2.8% 3.7% 53
Crisis Residence - - - 9,835 0.2% 0.2% 31
Residential Treatment Center
533 0.2% 0.2% 10,342 0.2% 0.2% 33
Institutional Setting 5,371 1.5% 1.8% 72,817 1.1% 1.5% 52
Jail (Correctional Facility) 1,404 0.4% 0.5% 85,835 1.3% 1.7% 53
Homeless (Shelter) 7,761 2.2% 2.6% 191,204 2.9% 3.9% 53
Other 10,380 3.0% 3.4% 247,917 3.8% 5.0% 47
Not Available 45,867 13.2% - 1,574,845 24.2% - 49
Total 347,980 100.0% 100.0% 6,516,643 100.0% 100.0% 58
Children under age 18
Private Residence 17,258 89.5% 94.4% 1,132,155 65.4% 90.1% 57
Foster Home 306 1.6% 1.7% 47,446 2.7% 3.8% 48
Residential Care 118 0.6% 0.6% 15,014 0.9% 1.2% 44
Crisis Residence - - - 1,813 0.1% 0.1% 24
Residential Treatment Center
70 0.4% 0.4% 7,541 0.4% 0.6% 31
Institutional Setting 108 0.6% 0.6% 6,087 0.4% 0.5% 49
Jail (Correctional Facility) 12 0.1% 0.1% 7,872 0.5% 0.6% 50
Homeless (Shelter) 60 0.3% 0.3% 5,789 0.3% 0.5% 47
Other 345 1.8% 1.9% 33,295 1.9% 2.6% 41
Not Available 1,003 5.2% - 474,668 27.4% - 47
Total 19,280 100.0% 100.0% 1,731,680 100.0% 100.0% 58
Adults over age 18
Private Residence 241,230 73.8% 85.3% 2,940,611 61.5% 79.9% 58
Foster Home 1,940 0.6% 0.7% 20,661 0.4% 0.6% 47
Residential Care 14,955 4.6% 5.3% 165,509 3.5% 4.5% 53
Crisis Residence - - - 8,021 0.2% 0.2% 30
Residential Treatment Center
463 0.1% 0.2% 2,798 0.1% 0.1% 20
Institutional Setting 5,124 1.6% 1.8% 66,582 1.4% 1.8% 51
Jail (Correctional Facility) 1,389 0.4% 0.5% 77,835 1.6% 2.1% 53
Homeless (Shelter) 7,697 2.4% 2.7% 185,220 3.9% 5.0% 53
Other 9,949 3.0% 3.5% 214,465 4.5% 5.8% 47
Not Available 44,209 13.5% - 1,096,179 22.9% - 49
Total 326,956 100.0% 100.0% 4,777,881 100.0% 100.0% 58
This table uses data from URS Table 15.
State Notes:
None
2016 SAMHSA Uniform Reporting System (URS) Output Tables Page 17 of 28

APPROPRIATENESS DOMAIN: Persons Who were Homeless by Age, Gender, Race, and Ethnicity, FY 2016
STATE: New Jersey
Demographic
Homeless or Living in Shelters Percent of Total with Known Living Situation
States
Reporting
State US State US
N % N % % %
Age 0 to 17 60 0.8% 5,789 3.0% 0.3% 0.5% 47
Age 18 to 64 6,801 87.6% 180,635 94.5% 2.9% 5.3% 53
Age 65+ 896 11.5% 4,585 2.4% 1.9% 1.8% 50
Age Not Available 4 0.1% 195 0.1% 0.4% 6.3% 8
Age Total 7,761 100.0% 191,204 100.0% 2.6% 3.9% 53
Female 3,034 39.1% 74,423 38.9% 1.9% 2.9% 51
Male 4,714 60.7% 116,536 60.9% 3.4% 4.9% 53
Gender Not Available 13 0.2% 245 0.1% 2.5% 4.9% 21
Gender Total 7,761 100.0% 191,204 100.0% 2.6% 3.9% 53
American Indian or Alaska Native 109 1.4% 3,368 1.8% 3.9% 4.8% 46
Asian 52 0.7% 1,845 1.0% 1.3% 2.6% 46
Black or African American 2,692 34.7% 56,428 29.5% 4.5% 5.7% 50
Native Hawaiian or Other Pacific Islander - - 701 0.4% - 4.7% 39
White 3,590 46.3% 99,486 52.0% 2.2% 3.3% 49
Hispanic or Latino 782 10.1% 2,193 1.1% 1.6% 2.6% 11
More Than One Race - - 11,619 6.1% - 4.1% 44
Race Not Available 536 6.9% 15,564 8.1% 2.1% 4.1% 43
Race Total 7,761 100.0% 191,204 100.0% 2.6% 3.9% 53
Hispanic or Latino 6,835 88.1% 34,797 18.2% 2.8% 3.4% 48
Not Hispanic or Latino 782 10.1% 141,780 74.2% 1.6% 3.9% 52
Not Available 144 1.9% 14,627 7.6% 3.3% 4.8% 43
Ethnicity Total 7,761 100.0% 191,204 100.0% 2.6% 3.9% 53
Note:
US totals are based on states reporting.
This table uses data from URS Table 15.
US totals are calculated uniquely for each data element based on only those states who reported numerator (clients served) data.
State Notes:
None
2016 SAMHSA Uniform Reporting System (URS) Output Tables Page 18 of 28

OUTCOMES DOMAIN: Consumer Survey Results, FY 2016
CONSUMER SURVEY RESULTS, FY 2016
STATE: New Jersey
Indicators Children: State Children: U.S. Average
States Reporting
Adults: State Adults: U.S. Average
States Reporting
Reporting Positively About Access 72.9% 85.2% 47 98.6% 85.6% 50
Reporting Positively About Quality and Appropriateness
96.9% 88.2% 50
Reporting Positively About Outcomes 51.6% 73.5% 47 92.7% 68.5% 50
Reporting on Participation in Treatment Planning
78.4% 90.3% 47 99.6% 81.7% 50
Family Members Reporting High Cultural Sensitivity of Staff
80.6% 94.8% 47
Reporting positively about General Satisfaction with Services
63.9% 88.5% 48 98.6% 88.3% 50
Note: U.S. Average Children & Adult rates are calculated only for states that used a version of the MHSIP Consumer Survey
This table uses data from URS Table 11. Children/Family State U.S.
Type of Survey Used YSS-F YSS-F=39
Type of Adult Consumer Survey Used 28-Item MHSIP Other MHSIP Other Survey state Yes - -
U.S. 23 24 3
Sample Size & Response Rate Children: State Children: U.S. States Reporting
Adults: State Adults: U.S. Average
States Reporting
Response Rate - 40.7% 38 17.9% 41.2% 40
Number of Surveys Attempted (send out) - 178,843 38 7,141 246,834 40
Number of Surveys Contacts Made - 131,494 35 7,141 175,587 37
Complete Surveys 459 70,121 45 1,277 136,253 47
Populations covered in survey Children: State Children: U.S. Adults: State Adults: U.S.
All Consumers - 2 - 2
Sample Yes 44 Yes 48
Sample Approach Children: State Children: U.S. Adults: State Adults: U.S.
Random Sample Yes 10 - 8
Stratified Sample - 13 Yes 16
Convenience Sample - 20 - 22
Other Sample - 3 - 5
Who is Sampled? Children: State Children: U.S. Adults: State Adults: U.S.
Current Clients - 47 Yes 48
Former Clients - 15 - 17
Populations included in sample: (e.g., all adults, only adults with SMI, etc.)
Children: State Children: U.S. Adults: State Adults: U.S.
All Children or Adults Served - 28 Yes 29
SMI Adults or SED Children - 22 - 22
Persons Covered by Medicaid - 13 - 14
Other - 6 All adult consumers of community-based, non-acute
services.
8
State Notes: None
2016 SAMHSA Uniform Reporting System (URS) Output Tables Page 19 of 28

OUTCOMES DOMAIN: Consumer Survey Results, by Race/Ethnicity FY 2016 STATE: New Jersey
Race/Ethnicity
Adult Consumer Survey Indicators: Reporting Positively About...
States Access Quality & Appropriateness Outcomes Participation In Tx Planning General Satisfaction Social Connectedness Improved Functioning
State US Average State US Average State US Average State US Average State US Average State US Average State US Average
Total 99% 86% 97% 90% 93% 72% 100% 83% 99% 89% 95% 71% 95% 72% 40
American Indian or Alaska Native 100% 83% 100% 86% 100% 70% 100% 79% 100% 86% 100% 70% 80% 70% 36
Asian 96% 86% 91% 88% 96% 75% 100% 81% 100% 89% 91% 73% 100% 73% 35
Black or African American 99% 87% 97% 89% 94% 74% 99% 83% 98% 89% 94% 74% 95% 75% 36 Native Hawaiian or Other Pacific Islander 100% 86% 100% 86% 100% 80% 100% 78% 100% 85% 100% 77% 100% 76% 26
White 98% 86% 97% 90% 93% 72% 100% 84% 99% 89% 96% 71% 96% 70% 36
Hispanic or Latino 99% 89% 99% 92% 93% 76% 100% 87% 99% 92% 92% 76% 95% 74% 34
More Than One Race 100% 82% 100% 87% 85% 70% 97% 79% 100% 87% 97% 66% 91% 67% 28
Not Available 98% 86% 96% 90% 91% 74% 99% 83% 98% 89% 92% 71% 92% 72% 36
Race/Ethnicity
Family of Children Survey Indicators: Reporting Positively About...
States Access
General Satisfaction with Services Outcomes Participation In Tx Planning
Cultural Sensitivity of Staff Social Connectedness Improved Functioning
State US Average State US Average State US Average State US Average State US Average State US Average State US Average
Total 74% 87% 63% 87% 52% 70% 79% 89% 82% 95% - 87% - 71% 37
American Indian or Alaska Native 90% 83% 70% 85% 60% 68% 90% 86% 70% 92% - 88% - 68% 31
Asian 100% 84% 67% 88% 53% 73% 87% 89% 100% 94% - 86% - 77% 26
Black or African American 66% 87% 59% 87% 48% 66% 72% 89% 85% 94% - 87% - 67% 32 Native Hawaiian or Other Pacific Islander 100% 83% 100% 86% 100% 71% 100% 90% 100% 92% - 85% - 71% 21
White 73% 86% 64% 86% 50% 70% 80% 90% 79% 95% - 87% - 70% 32
Hispanic or Latino 75% 89% 65% 89% 50% 74% 79% 90% 84% 96% - 89% - 75% 31
More Than One Race 72% 84% 56% 86% 44% 67% 80% 88% 84% 94% - 86% - 70% 23
Not Available 89% 87% 64% 87% 64% 74% 86% 88% 86% 95% - 87% - 76% 32
Notes:
This table uses data from URS Table 11a.
State Notes:
The Child/Adolescent Family Survey Results are provided by the Children's System of Care, of the NJ Department of Children and Families, which is administratively separate from the SMHA (NJ DHS, Division of Mental Health & Addiction Services). See General Notes.
2016 SAMHSA Uniform Reporting System (URS) Output Tables Page 20 of 28

Outcomes Domain: Change in Social Connectedness and Functioning, FY 2016
New Jersey
Indicators
Children Adults
State US Average US Median States
Reporting State US Average US Median States
Reporting Percent Reporting Improved Social Connectedness from Services 71.4% 86.4% 84.5% 44 94.6% 74.4% 69.4% 50
Percent Reporting Improved Functioning from Services 52.5% 73.4% 64.6% 44 95.1% 73.8% 69.5% 49
Note:
This table uses data from URS Table 9.
US State Averages and Medians are calculated only with states which used the recommended Social Connectedness and Functioning questions.
Adult Social Connectedness and Functioning Measures State US Did you use the recommended new Social Connectedness Questions? Yes 47
Did you use the recommended new Functioning Domain Questions? Yes 46
Did you collect these as part of your MHSIP Adult Consumer Survey? Yes 47
Children/Family Social Connectedness and Functioning Measures State US Did you use the recommended new Social Connectedness Questions? Yes 43
Did you use the recommended new Functioning Domain Questions? Yes 43
Did you collect these as part of your YSS-F Survey? Yes 42
State Notes:
None
2016 SAMHSA Uniform Reporting System (URS) Output Tables Page 21 of 28

OUTCOMES DOMAIN: Civil (Non Forensic) & Forensic Patients Readmission within 30 Days by Age, Gender, and Race, FY 2016
STATE: New Jersey
Demographic
Readmissions within 30 days to state psychiatric hospitals: "Civil" (Non-Forensic) Patients
Readmissions within 30 days to state psychiatric hospitals: Forensic Patients
State US State US
Readmissions N
Discharges N
% Readmissions N
Discharges N
% States Reporting
Readmissions N
Discharges N
% Readmissions N
Discharges N
% States Reporting
Age 0 to 12 0 - - 98 1,876 5.2% 10 0 - - - 25 - 0
Age 13 to 17 0 - - 295 5,946 5.0% 18 0 - - 16 594 2.7% 4
Age 18 to 20 0 51 0.0% 366 4,516 8.1% 29 0 2 0.0% 33 874 3.8% 12
Age 21 to 64 111 1,650 6.7% 6,688 71,284 9.4% 47 2 149 1.3% 703 21,619 3.3% 38
Age 65 to 74 2 131 1.5% 174 2,707 6.4% 30 0 3 0.0% 32 684 4.7% 15
Age 75 and over 0 21 0.0% 32 789 4.1% 11 0 1 0.0% 5 153 3.3% 5
Age Not Available 0 - - 62 926 6.7% 1 0 - - 13 186 7.0% 1
Age Total 113 1,853 6.1% 7,715 88,044 8.8% 50 2 155 1.3% 802 24,135 3.3% 41
Female 39 659 5.9% 2,988 36,173 8.3% 49 0 16 0.0% 194 4,928 3.9% 29
Male 74 1,194 6.2% 4,725 51,821 9.1% 46 2 139 1.4% 608 19,183 3.2% 38
Gender Not Available 0 - - 2 50 4.0% 1 0 - - - 24 - 0
Gender Total 113 1,853 6.1% 7,715 88,044 8.8% 50 2 155 1.3% 802 24,135 3.3% 41
American Indian or Alaska Native 0 5 0.0% 210 1,838 11.4% 16 0 1 0.0% 10 292 3.4% 9
Asian 1 54 1.9% 85 1,116 7.6% 20 0 4 0.0% 12 462 2.6% 6
Black or African American 47 586 8.0% 1,878 19,967 9.4% 41 2 82 2.4% 283 8,944 3.2% 26
Native Hawaiian or Other Pacific Islander 0 4 0.0% 56 417 13.4% 5 0 - - - 129 - 0
White 64 1,174 5.5% 4,918 57,753 8.5% 47 0 64 0.0% 407 11,440 3.6% 34
Hispanic or Latino 0 21 0.0% 52 545 9.5% 7 0 3 0.0% 23 1,000 2.3% 4
More Than One Race 0 - - 141 1,934 7.3% 22 0 - - 27 580 4.7% 9
Race Not Available 1 9 11.1% 375 4,474 8.4% 25 0 1 0.0% 40 1,288 3.1% 12
Race Total 113 1,853 6.1% 7,715 88,044 8.8% 50 2 155 1.3% 802 24,135 3.3% 41
Hispanic or Latino 0 21 0.0% 689 8,616 8.0% 28 0 3 0.0% 90 3,373 2.7% 16
Not Hispanic or Latino 113 1,832 6.2% 5,161 60,743 8.5% 44 2 152 1.3% 613 17,891 3.4% 32
Not Available 0 - - 1,865 18,685 10.0% 26 0 - - 99 2,871 3.4% 13
Ethnicity Total 113 1,853 6.1% 7,715 88,044 8.8% 50 2 155 1.3% 802 24,135 3.3% 41
Forensics included in "non forensic" data? No
Note: US totals are based on states reporting. This table uses data from URS Tables 20a and 20b.
State Notes:
None
2016 SAMHSA Uniform Reporting System (URS) Output Tables Page 22 of 28
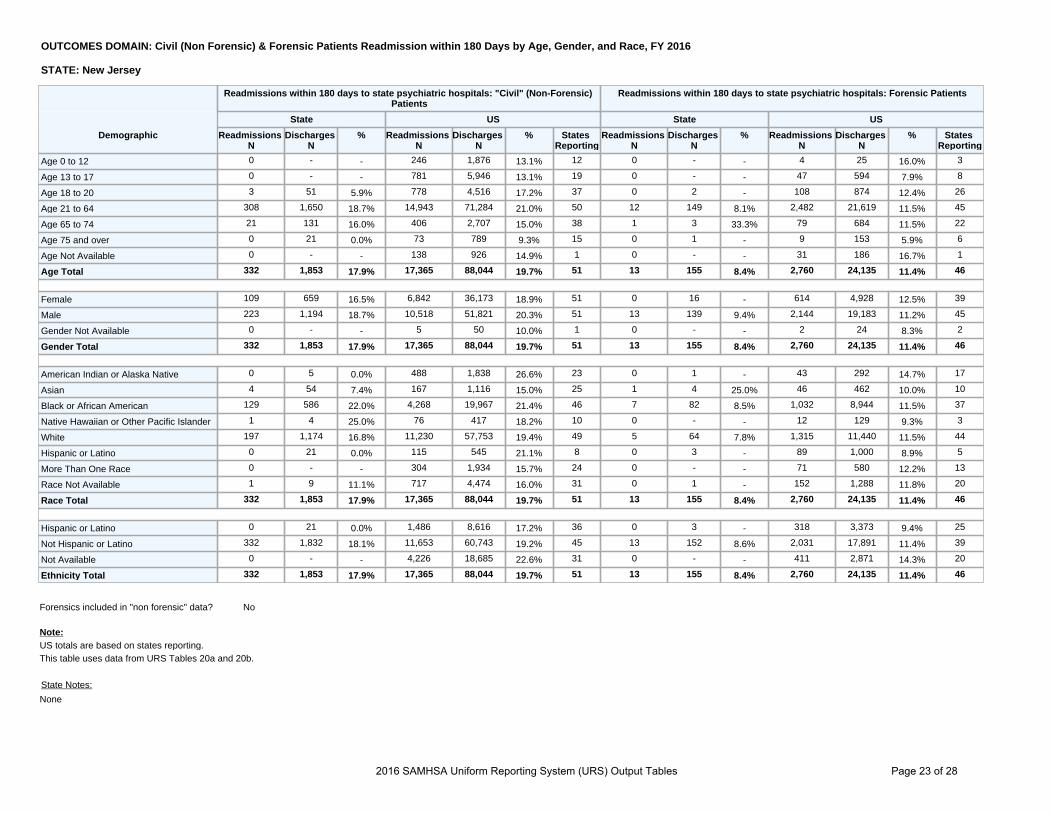
OUTCOMES DOMAIN: Civil (Non Forensic) & Forensic Patients Readmission within 180 Days by Age, Gender, and Race, FY 2016
STATE: New Jersey
Demographic
Readmissions within 180 days to state psychiatric hospitals: "Civil" (Non-Forensic) Patients
Readmissions within 180 days to state psychiatric hospitals: Forensic Patients
State US State US
Readmissions N
Discharges N
% Readmissions N
Discharges N
% States Reporting
Readmissions N
Discharges N
% Readmissions N
Discharges N
% States Reporting
Age 0 to 12 0 - - 246 1,876 13.1% 12 0 - - 4 25 16.0% 3
Age 13 to 17 0 - - 781 5,946 13.1% 19 0 - - 47 594 7.9% 8
Age 18 to 20 3 51 5.9% 778 4,516 17.2% 37 0 2 - 108 874 12.4% 26
Age 21 to 64 308 1,650 18.7% 14,943 71,284 21.0% 50 12 149 8.1% 2,482 21,619 11.5% 45
Age 65 to 74 21 131 16.0% 406 2,707 15.0% 38 1 3 33.3% 79 684 11.5% 22
Age 75 and over 0 21 0.0% 73 789 9.3% 15 0 1 - 9 153 5.9% 6
Age Not Available 0 - - 138 926 14.9% 1 0 - - 31 186 16.7% 1
Age Total 332 1,853 17.9% 17,365 88,044 19.7% 51 13 155 8.4% 2,760 24,135 11.4% 46
Female 109 659 16.5% 6,842 36,173 18.9% 51 0 16 - 614 4,928 12.5% 39
Male 223 1,194 18.7% 10,518 51,821 20.3% 51 13 139 9.4% 2,144 19,183 11.2% 45
Gender Not Available 0 - - 5 50 10.0% 1 0 - - 2 24 8.3% 2
Gender Total 332 1,853 17.9% 17,365 88,044 19.7% 51 13 155 8.4% 2,760 24,135 11.4% 46
American Indian or Alaska Native 0 5 0.0% 488 1,838 26.6% 23 0 1 - 43 292 14.7% 17
Asian 4 54 7.4% 167 1,116 15.0% 25 1 4 25.0% 46 462 10.0% 10
Black or African American 129 586 22.0% 4,268 19,967 21.4% 46 7 82 8.5% 1,032 8,944 11.5% 37
Native Hawaiian or Other Pacific Islander 1 4 25.0% 76 417 18.2% 10 0 - - 12 129 9.3% 3
White 197 1,174 16.8% 11,230 57,753 19.4% 49 5 64 7.8% 1,315 11,440 11.5% 44
Hispanic or Latino 0 21 0.0% 115 545 21.1% 8 0 3 - 89 1,000 8.9% 5
More Than One Race 0 - - 304 1,934 15.7% 24 0 - - 71 580 12.2% 13
Race Not Available 1 9 11.1% 717 4,474 16.0% 31 0 1 - 152 1,288 11.8% 20
Race Total 332 1,853 17.9% 17,365 88,044 19.7% 51 13 155 8.4% 2,760 24,135 11.4% 46
Hispanic or Latino 0 21 0.0% 1,486 8,616 17.2% 36 0 3 - 318 3,373 9.4% 25
Not Hispanic or Latino 332 1,832 18.1% 11,653 60,743 19.2% 45 13 152 8.6% 2,031 17,891 11.4% 39
Not Available 0 - - 4,226 18,685 22.6% 31 0 - - 411 2,871 14.3% 20
Ethnicity Total 332 1,853 17.9% 17,365 88,044 19.7% 51 13 155 8.4% 2,760 24,135 11.4% 46
Forensics included in "non forensic" data? No
Note: US totals are based on states reporting. This table uses data from URS Tables 20a and 20b.
State Notes:
None
2016 SAMHSA Uniform Reporting System (URS) Output Tables Page 23 of 28

Structure Domain: Federal Mental Health Block Grant Expenditures for Non-Direct Service Activities, FY 2016
New Jersey
Service Non-Direct Block Grant Expenditures % Total US % Total
Technical Assistance Activities - - 30.1%
Planning Council $15,260 98.2% 4.3%
Administration $281 1.8% 25.8%
Data Collection/Reporting - - 9.4%
Other Activities - - 30.4%
Total $15,541 100.0% 100.0%
Note: This table use data from URS Table 8.
State Notes:
See General Notes.
2016 SAMHSA Uniform Reporting System (URS) Output Tables Page 24 of 28

STRUCTURE DOMAIN: State Mental Health Agency Controlled Expenditures for Mental Health, FY 2015
STATE New Jersey
Expenditures: State Percent of Total Expenditures: State
Expenditures: U.S. Percent of Total Expenditures: U.S.
State Hospitals-Inpatient $504,663,000 27% $8,340,684,868 22%
Other 24-Hour Care $644,302,000 34% $6,326,751,257 17%
Ambulatory/Community $718,657,000 38% $22,187,984,421 59%
Total $1,893,329,000 - $37,767,897,721 -
Note:
Other 24-Hour Care includes state psychiatric hospital and community based other 24-hour as well as community based inpatient expenditures.
Ambulatory/Community includes expenditures for less than 24-hour care services provided at state psychiatric hospitals. It excludes community based other-24 hour and community based inpatient expenditures.
Total also includes additional SMHA Expenditures for research, training, administration, and other central and regional office expenditures.
Data from NRI's Funding Sources and Expenditures of State Mental Health Agencies, FY 2015 reports - Table 18 "SMHA-Controlled Expenditures for Mental Health Services."
U.S. totals are based on 50 states reporting.
More information on the State Mental Health Agency's Revenues & Expenditures as well as State Footnotes can be found on the NRI website: http://www.nri-incdata.org/
2016 SAMHSA Uniform Reporting System (URS) Output Tables Page 25 of 28

Note:
STRUCTURE DOMAIN: State Mental Health Agency Controlled Revenues by Funding Sources, FY 2015
STATE New Jersey
Funding Source Ambulatory/Community State Hospital
State Revenues Percent Total
(State) Percent Total (US) State Revenues Percent Total
(State) Percent Total (US)
Medicaid $558,492,000 41.0% 62.1% $19,536,000 3.9% 14.3%
Community MH Block Grant $11,393,000 0.8% 1.3% - - -
Other SAMHSA $2,171,000 0.2% 0.5% - - -
other Federal(non-SAMHSA) $30,309,000 2.2% 1.3% $16,340,000 3.2% 3.6%
State $602,716,000 44.2% 28.0% $417,301,000 82.7% 76.4%
Other $78,131,000 5.7% 4.3% $2,053,000 0.4% 4.6%
Total $1,362,959,000 100.0% 100.0% $504,663,000 100.0% 100.0%
Note:
Data from NRI's Funding Sources and Expenditures of State Mental Health Agencies, FY 2015 reports - State Mental Health Agency Controlled Expenditures and Revenus, Table 24, 25, and 26.
This table does not show Revenues for state central office including Research, Training, and Administration expenses.
More information on the State Mental Health Agency's Revenues & Expenditures as well as State Footnotes can be found on the NRI website: http://www.nri-incdata.org/
2016 SAMHSA Uniform Reporting System (URS) Output Tables Page 26 of 28
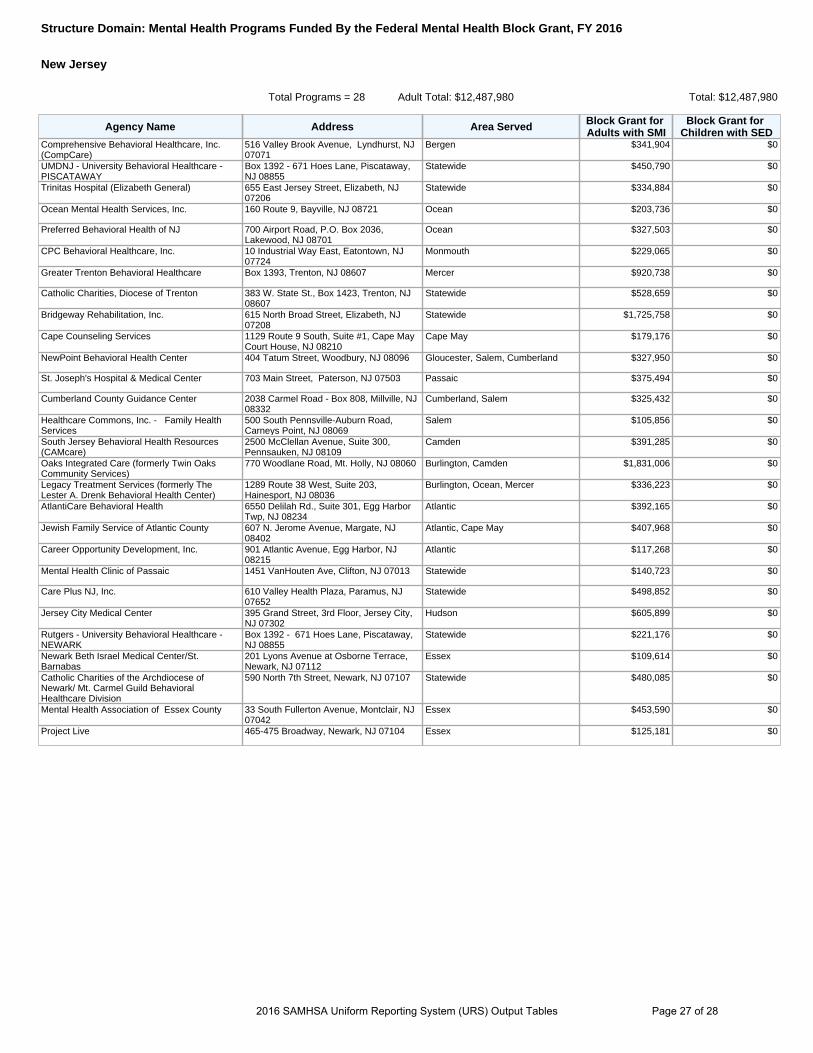
Structure Domain: Mental Health Programs Funded By the Federal Mental Health Block Grant, FY 2016
New Jersey
Total Programs = 28 Adult Total: $12,487,980 Total: $12,487,980
Agency Name Address Area Served Block Grant for Adults with SMI
Block Grant for Children with SED
Comprehensive Behavioral Healthcare, Inc. (CompCare)
516 Valley Brook Avenue, Lyndhurst, NJ 07071
Bergen $341,904 $0
UMDNJ - University Behavioral Healthcare -PISCATAWAY
Box 1392 - 671 Hoes Lane, Piscataway, NJ 08855
Statewide $450,790 $0
Trinitas Hospital (Elizabeth General) 655 East Jersey Street, Elizabeth, NJ 07206
Statewide $334,884 $0
Ocean Mental Health Services, Inc. 160 Route 9, Bayville, NJ 08721 Ocean $203,736 $0
Preferred Behavioral Health of NJ 700 Airport Road, P.O. Box 2036, Lakewood, NJ 08701
Ocean $327,503 $0
CPC Behavioral Healthcare, Inc. 10 Industrial Way East, Eatontown, NJ 07724
Monmouth $229,065 $0
Greater Trenton Behavioral Healthcare Box 1393, Trenton, NJ 08607 Mercer $920,738 $0
Catholic Charities, Diocese of Trenton 383 W. State St., Box 1423, Trenton, NJ 08607
Statewide $528,659 $0
Bridgeway Rehabilitation, Inc. 615 North Broad Street, Elizabeth, NJ 07208
Statewide $1,725,758 $0
Cape Counseling Services 1129 Route 9 South, Suite #1, Cape May Court House, NJ 08210
Cape May $179,176 $0
NewPoint Behavioral Health Center 404 Tatum Street, Woodbury, NJ 08096 Gloucester, Salem, Cumberland $327,950 $0
St. Joseph's Hospital & Medical Center 703 Main Street, Paterson, NJ 07503 Passaic $375,494 $0
Cumberland County Guidance Center 2038 Carmel Road - Box 808, Millville, NJ 08332
Cumberland, Salem $325,432 $0
Healthcare Commons, Inc. - Family Health Services
500 South Pennsville-Auburn Road, Carneys Point, NJ 08069
Salem $105,856 $0
South Jersey Behavioral Health Resources (CAMcare)
2500 McClellan Avenue, Suite 300, Pennsauken, NJ 08109
Camden $391,285 $0
Oaks Integrated Care (formerly Twin Oaks Community Services)
770 Woodlane Road, Mt. Holly, NJ 08060 Burlington, Camden $1,831,006 $0
Legacy Treatment Services (formerly The Lester A. Drenk Behavioral Health Center)
1289 Route 38 West, Suite 203, Hainesport, NJ 08036
Burlington, Ocean, Mercer $336,223 $0
AtlantiCare Behavioral Health 6550 Delilah Rd., Suite 301, Egg Harbor Twp, NJ 08234
Atlantic $392,165 $0
Jewish Family Service of Atlantic County 607 N. Jerome Avenue, Margate, NJ 08402
Atlantic, Cape May $407,968 $0
Career Opportunity Development, Inc. 901 Atlantic Avenue, Egg Harbor, NJ 08215
Atlantic $117,268 $0
Mental Health Clinic of Passaic 1451 VanHouten Ave, Clifton, NJ 07013 Statewide $140,723 $0
Care Plus NJ, Inc. 610 Valley Health Plaza, Paramus, NJ 07652
Statewide $498,852 $0
Jersey City Medical Center 395 Grand Street, 3rd Floor, Jersey City, NJ 07302
Hudson $605,899 $0
Rutgers - University Behavioral Healthcare -NEWARK
Box 1392 - 671 Hoes Lane, Piscataway, NJ 08855
Statewide $221,176 $0
Newark Beth Israel Medical Center/St. Barnabas
201 Lyons Avenue at Osborne Terrace, Newark, NJ 07112
Essex $109,614 $0
Catholic Charities of the Archdiocese of Newark/ Mt. Carmel Guild Behavioral Healthcare Division
590 North 7th Street, Newark, NJ 07107 Statewide $480,085 $0
Mental Health Association of Essex County 33 South Fullerton Avenue, Montclair, NJ 07042
Essex $453,590 $0
Project Live 465-475 Broadway, Newark, NJ 07104 Essex $125,181 $0
2016 SAMHSA Uniform Reporting System (URS) Output Tables Page 27 of 28
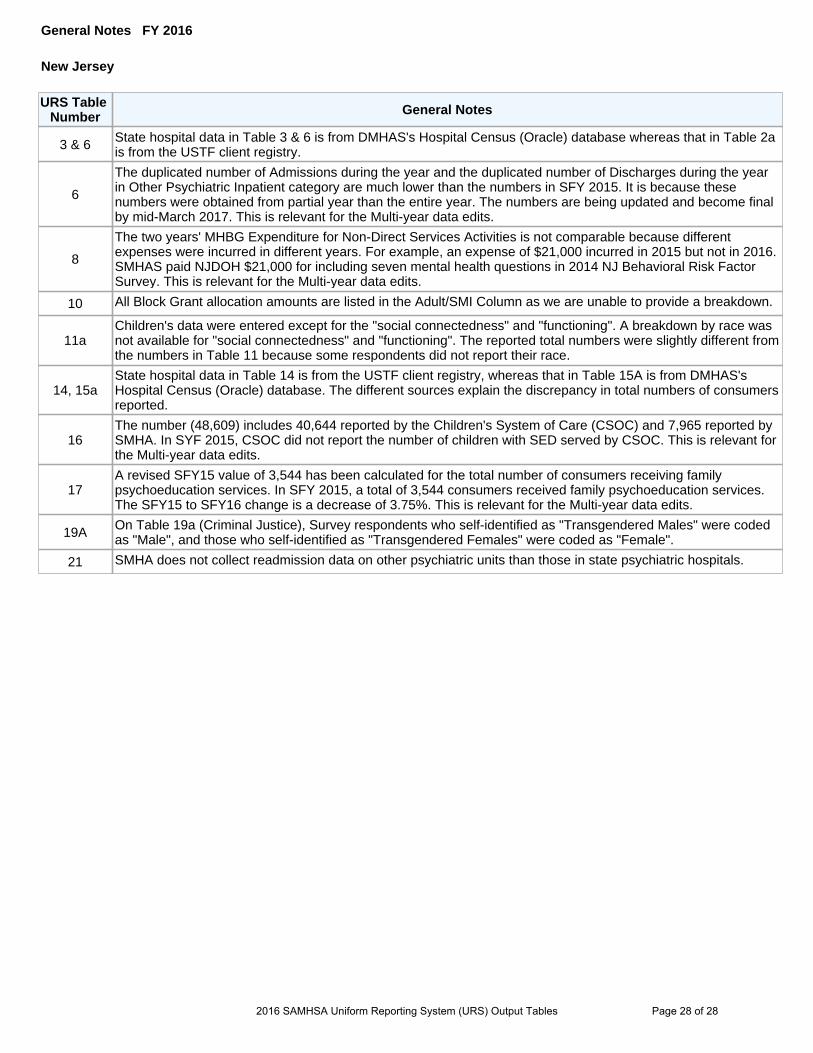
General Notes FY 2016
New Jersey
URS Table Number General Notes
3 & 6 State hospital data in Table 3 & 6 is from DMHAS's Hospital Census (Oracle) database whereas that in Table 2a is from the USTF client registry.
6
The duplicated number of Admissions during the year and the duplicated number of Discharges during the year in Other Psychiatric Inpatient category are much lower than the numbers in SFY 2015. It is because these numbers were obtained from partial year than the entire year. The numbers are being updated and become final by mid-March 2017. This is relevant for the Multi-year data edits.
8
The two years' MHBG Expenditure for Non-Direct Services Activities is not comparable because different expenses were incurred in different years. For example, an expense of $21,000 incurred in 2015 but not in 2016. SMHAS paid NJDOH $21,000 for including seven mental health questions in 2014 NJ Behavioral Risk Factor Survey. This is relevant for the Multi-year data edits.
10 All Block Grant allocation amounts are listed in the Adult/SMI Column as we are unable to provide a breakdown.
11a Children's data were entered except for the "social connectedness" and "functioning". A breakdown by race was not available for "social connectedness" and "functioning". The reported total numbers were slightly different from the numbers in Table 11 because some respondents did not report their race.
14, 15a State hospital data in Table 14 is from the USTF client registry, whereas that in Table 15A is from DMHAS's Hospital Census (Oracle) database. The different sources explain the discrepancy in total numbers of consumers reported.
16 The number (48,609) includes 40,644 reported by the Children's System of Care (CSOC) and 7,965 reported by SMHA. In SYF 2015, CSOC did not report the number of children with SED served by CSOC. This is relevant for the Multi-year data edits.
17 A revised SFY15 value of 3,544 has been calculated for the total number of consumers receiving family psychoeducation services. In SFY 2015, a total of 3,544 consumers received family psychoeducation services. The SFY15 to SFY16 change is a decrease of 3.75%. This is relevant for the Multi-year data edits.
19A On Table 19a (Criminal Justice), Survey respondents who self-identified as "Transgendered Males" were coded as "Male", and those who self-identified as "Transgendered Females" were coded as "Female".
21 SMHA does not collect readmission data on other psychiatric units than those in state psychiatric hospitals.
2016 SAMHSA Uniform Reporting System (URS) Output Tables Page 28 of 28