Climate Data Records (CDR) and Essential Climate Variables (ECV)
10 New Insights inClimate Science2019
Title: 10 New Insights in Climate Science 2019
Produced by: Future Earth and the Earth League
Layout and graphics: Jerker Lokrantz/Azote
Printed on recycled, FSC-certified paper.
Please cite this report as: Pihl, E., Martin, M.A., Blome, T., Hebden, S., Jarzebski, M.P., Lambino, R.A., Köhler, C., Canadell, J.G., Ebi, K.L., Edenhofer, O., Gaffney, O., Rockström, J., Roy, J., Srivastava, L., Payne, D.R., Adler, C., Watts, S., Jacobsson, L., Sonntag, S., 10 New Insights in Climate Science 2019, Future Earth & The Earth League, Stockholm, 2019
G LOBA L C A R BONp r o j e c t
Future Earth Health Knowledge-Action Network

3
Content
Introduction 4
1. The world is not on track 5
2. Climate change is faster and stronger than expected 8
3. Climate change leaves no mountain summit behind 11
4. Forests are under threat, with global consequences 14
5. Weather extremes – a “new normal” in 2019 17
6. Biodiversity – threatened guardian of earth’s resilience 20
7. Climate change threatens food security and the health of hundreds of millions 22
8. Most vulnerable and poor hardest hit by climate change 24
9. Equity and equality pivotal to successful climate change mitigation and adaptation 26
10. Time may have come for social tipping points on climate action 28
References 31
Credits 37

4
Introduction
The world continues to emit greenhouse gases while our planet’s climate is changing faster than ever.
This document will let science speak. Many different scientific assessments and new research findings have revealed the uncomfortable result that many risks with global warming may have been underestimated and that our planetary machinery is, if anything, changing more rapidly than projected. In 2019, the Intergovernmental Panel on Climate Change alone published two landmark reports: on “Climate Change and Land” and “The Ocean and Cryosphere in a Changing Climate”. The world’s leading climate science organizations have joined forces to provide a scientific synthesis, “United in Science”, summarizing among other findings the gap between decarbonization commitments and a carbonizing reality. Thousands of recent scientific publications are available, shedding light on (de)carbonization, accelerated changes in the physical state of the climate system, the importance and the precarious situation of the biosphere, and the aggravating impacts these will have on human societies.
Simultaneously, over the last few years there have been a growing number of climate-related initiatives that are being implemented across all economic sectors over various timescales and regional scales.
As these spread and replicate, social systems could pass a threshold – so-called social tipping points – after which changes rapidly accelerate. Although the science around social tipping points is still nascent, but rapidly evolving, this report will also highlight the phenomena around climate-induced social movements that are growing in frequency and scale. There is rich evidence of social movements, with clearly defined objectives, bringing about transformational changes throughout history. Such movements have invariably placed the spotlight on issues of fairness and equity, which researchers now increasingly highlight as pivotal in making successful climate policies.
This document intends to take up the latest and most essential scientific findings published in an extraordinary year – the climate science year in review.

5
The world is not on track1
The current levels of fossil fuel use and infrastructure paint a worrying picture for successfully achieving the agreed climate targets. Oil and natural gas use is increasing rapidly (1.4% and 2% per annum)1. Total global CO2 emissions from the combustion of fossil fuels and land-use change have increased about 1% per annum over recent years2. The UN “Environment Emissions Gap Report 2018” finds the gap between countries’ unconditional nationally determined contributions (NDCs) in 2030 to have widened to 15 Gt (billion tonnes) per year of CO2 compared to the 2°C target and 32 Gt per year compared to the 1.5°C target3. In comparison, total anthropogenic CO2 emissions are currently 41 Gt².
Coal power may be bucking the trend. Global use of coal reached a peak in 2013, decreased slowly afterwards and had some modest growth again over the past two years1. The EU has roughly halved its coal use since 19904 and the United States and Canada report a 40% decline since 2005¹. However, decreases in coal use in North America and the EU are to a large degree outweighed by investments in developing and transitioning economies. In addition, certain sectors are showing strong emission growth. Global aviation emissions have increased by 35% in
5 years – 70% faster than anticipated by the UN-industry agency ICAO5. The International Maritime Organization also predicts large increases in shipping emissions, on average by 29% to 2030 and 95% to 2050 across all future socio-economic scenarios6. Despite growing awareness of climate change, consumer preferences for heavier vehicles (SUVs) has led to their doubling of the market share in a decade. SUVs are heavier than other private vehicles and often with diesel engines, consuming more fuel despite progress in energy efficiency and being responsible for higher air pollution than equivalent gasoline engines. SUVs were the second most important cause for increased global emissions in the energy sector (after power) between 2010 and 20187.
Existing infrastructure such as power plants, industries, and roads cause carbon emissions throughout their lifetimes. Building new fossil-based infrastructure today locks the world into further “committed emissions” for many decades to come. If existing infrastructure is operated throughout its full life cycle as done historically, it will emit 660 Gt (range 230–1500 Gt), equivalent to 18 years of current fossil CO2 emissions⁹. Proposed power plants would add another 190 (40–430) Gt CO2. Together, existing
Key new insights
▪ Greenhouse gas emissions continue to increase and the gap between current trends and agreed climate targets has widened
▪ Existing and proposed energy infrastructure commits us to 850 billion tonnes of carbon dioxide emissions if operated during its full life cycle, twice the budget available for stabilizing the climate at 1.5°C above pre-industrial level
▪ The use of coal has slowed down and is declining in many countries. There is increasing financial divestment from fossil fuels, but the overall size of the fossil-fuel industry continues to increase with robust growth in the oil and natural gas sectors.
▪ In order to achieve ambitious climate targets Carbon Dioxide Removal (CDR) in some form is likely needed but comes with great risk and costs and shouldn’t be viewed as a substitute for mitigation
Despite increasing drivers of reduced emissions, such as growth in green energy, institutions divesting from fossil fuels, and some countries phasing out coal power, the fossil industry is still growing and global leaders aren’t yet committing to the necessary emissions cuts. We are not on track to reach the Paris Agreement.

6
and proposed energy infrastructure represent committed emissions of 850 Gt CO2, about twice as much as the carbon budget for the 1.5°C target (420–580 Gt from January 2018)9,10. Worldwide, there are currently 1,200 coal plants in various stages of planning and construction8. Avoiding high future emissions requires lowered utilization rates as well as early retirements or retrofits of power plants and industries. Renewable energy now produces 26% of global electricity and with continued rapid expansion, planned or existing fossil production could be substituted11. The installed capacity of solar and wind power has grown 58-fold between 2010–201812.
Avoiding investments today that become a lock-in to fossil infrastructure would save both emissions and stranded assets. A shift in investments from fossil fuels to renewable energy could be underway. More than 100 globally significant financial institutions have developed formal restriction policies for investment in coal mining and/or coal-fired power plants since 201311. Investments in renewable power and fuels in 2018 totalled USD 305 billion, the corporate sourcing of renewables have doubled since
the year before and capacity additions were higher than net additions of fossil power12.
However, investments continue to flow to coal power, oil, and gas extraction. Since the Paris Agreement was adopted (2016–2018), 33 global banks have invested USD 1.9 trillion in fossil fuel companies14. OPEC is assuming that oil demand will continue
Capacity of coal power plants that are operating, proposed or cancelled8.
Committed emissions from fossil fuel infrastructure compared to pathways to 1.5°C (IPCC SR1.5 P1) and 2°C (RCP2.6). The committed emissions exclude some of the current CO2 sources, such as land-use change and the calcination process in cement manufacturing. Therefore, the 1.5°C and 2°C scenarios start at higher levels. Based on Tong et al, Nature, 20199 and Grubler et al, Nature Energy, 201824

7
to increase and that satisfying this demand would require upstream investments (in extraction, refineries, etc.) of USD 11 trillion up to 204015. Four of the top five investors in fossil fuels are US based14. When it comes to coal power, four of the top five investors are Chinese banks14.
In the absence of strong emissions reduction, removal of CO2 from the atmosphere and safely locking it away has become a requirement to avoid exceeding 1.5°C global warming. According to the IPCC Special Report on Climate Change and Land, the greatest potential for Carbon Dioxide Removal (CDR) is in nature-based methods (afforestation, reforestation, and soil carbon sequestration in croplands and grasslands) and bioenergy with carbon capture and storage (BECCS)16. However, such solutions will require substantial investment, they could take up significant areas of land, and are likely to negatively affect biodiversity and freshwater availability17,18. Model-based decarbonization pathways suggest that, globally, conversion of up to 7 million sq km – 12 times the area of France – to forest area by 2100 is needed to limit warming to 1.5°C or 2°C16.
Beyond nature-based methods, CDR still requires significant upscaling and innovation. Among emerging new technologies, Direct Air Capture with Carbon Storage (DACCS) has gained increasing attention. With this technology, CO2 is absorbed directly from the air and then stored in geological reservoirs. The first commercial direct CO2 air capture system came online in 201819. The benefits of DACCS include not needing significant amounts of land. A major drawback is the high energy consumption, drawing down 30 Gt/yr (73% of current CO2 emissions) is estimated to require more heat than half of today’s primary energy consumption and more than half of the electricity that the world produces today20. There are also other risks,
including the feasibility and pollutant implications of manufacturing the absorbing chemicals at large-scale as well as the need for sequestration and transport infrastructure, and risks associated with relying on technology that’s still in early development20. Direct Air Capture could also be associated with utilization of the captured CO2 to replace products that would otherwise be based on fossil carbon. Ahead of Direct Air Capture, the first priority for carbon capture and storage/utilization should be major CO2 point sources, such as cement factories, pulp and paper mills, and waste incinerators21.
BECCS, DACCS, and similar options require safe underground storage. The solution being implemented at the largest industrial scale today, sub-seabed storage, faces technological, economic, social, and political barriers22. Extensive CDR deployment in the future is unlikely without substantial work to minimize the barriers23. While some level of CDR is likely to be needed to achieve the most ambitious climate targets, it comes with great challenges. There are some scenarios showing that reliance on CDR, beyond nature-based methods, could still be avoided if there was strong and immediate mitigation24,25.

8
Climate change is faster and stronger than expected2
Observations of key climatic variables show a persistent warming trend for the Global Mean Surface Temperature (GMST), with signs of accelerating change, e.g., for sea-level rise1,2. An analysis of GMST, conducted by the World Meteorological Organization (WMO) and in comparison to pre-industrial (1850–1900) levels, reveals that the last few years are the warmest five-year period on record, and with 2015, 2016, 2017, and 2018 being the four warmest individual years1,2. Future warming could be faster and a global temperature rise of 1.5°C above pre-industrial levels could be reached sooner than the central projection in the IPCC special report on “Global Warming of 1.5°C” (in the year 2030 instead of 2040)3.
The ocean has taken up roughly 90% of the additional heat in the climate system4,5; since the IPCC “Fifth Assessment Report” (AR5), confidence in these findings on ocean heat uptake has grown6. This has consequences for the physical, chemical, and biological properties of the oceans, e.g., thermal expansion and thus sea-level rise, higher temperatures of near-surface waters, enhanced stratification, weakened circulation, and changes in oxygen content6,7. Marine heatwaves, for instance, have doubled in frequency as satellite observations reveal, affecting sensitive ecosystems such as coral reefs, as well as seagrass meadows and kelp forests. Marine heatwaves have also become longer lasting, more intense, and extensive8,9.
Scientific agreement has significantly grown that anthropogenic climate change is the dominant reason for the observed rates of sea-level rise since 197010,11,12,13,14. Consequences of the rising sea level are an increase in extreme wave heights, as observed in satellite observations from 1985–20188,15, and extreme sea-level events; both will significantly increase in future according to modelling studies6,10,16.
New analysis of model projections with high-emission scenarios for the end of the 21st century show substantially increased rates of sea-level rise when compared with those reported in the AR56,17. Analogous to that, recent literature investigated the temporal behaviour of sea-level rise, confirming that it will continue to rise for centuries, even when greenhouse gas emissions are curbed down6,17. If the Paris Agreement targets are achieved and strong mitigation measures are implemented, sea-level rise is projected to reach approximately 30–60 cm by
Key new insights
▪ Observations show signs of continuing warming
▪ Sea-level rise is accelerating
▪ Relatively stable components of the earth system show signs of accelerated degradation, such as Greenland and Antarctic ice sheets
▪ Further impacts especially on ice sheets and, consequently, on sea-level rise, have probably been underestimated in the IPCC “Fifth Assessment Report”
The mean global sea level has risen at an increasing rate, from 1.4 mm per year during the period 1901–1990, to 2.1 mm per year during the period 1970–2015, and to 3.6 mm per year during the period 2005–201510. The most recent decade (2009–2018) experienced a sea-level rise of 4.6±0.15 mm per year2.

9
2100, while under a high-emission scenario sea-level rise could amount to 60–110 cm, when looking at the “likely” range according to the IPCC nomenclature10. However, considering the less likely, upper bounds of future sea-level rise projections, these numbers almost double by 210017.
Projections show that what are considered extreme sea-level events that rarely occur under today’s climate, e.g., statistically every 100 years, will be much more common by the end of the 21st century along the global coastlines under all Representative Concentration Pathway (RCP) scenarios10,18. Many coasts on low latitudes and many megacities on all continents will experience such events annually alraedy around the year 205010,16,19. Low-lying countries will face similar risks, which is even more critical for many of these states due to the geographic lack of options to retreat. Fast and ambitious mitigation is vital especially for those areas, since low-emission scenarios will clearly dampen the rates of sea-level rise and the increase in extreme sea-level events10,20.
The main causes for the current rising sea level, as mentioned, relate to thermal expansion and mass loss through melting of glaciers and ice sheets, the latter process having gained dominance over thermal expansion10,17. The increased rate of sea-level rise is attributable to enhanced melting rates from inland ice, namely from the Greenland and West-Antarctic ice sheets10. Recent work based on satellite data shows that mass loss from Antarctica accelerated over the past 25 years21,22. Relevant processes include melting of the ice-sheet margins from below through warm ocean currents23. These are driven by atmospheric circulation patterns, the frequency and prevalence of which influences the melting conditions at the ice margins23,24. While the process is generally understood, it has been shown that anthropogenic climate change is a plausible major contributor to altered wind conditions during the past decades. A trend has emerged, starting in the 1920s, towards circulation patterns that lead to an acceleration of ice loss from the Antarctic continent24. Model simulations project this trend to continue, including consequences for the melting of the ice margins24.
There is an ongoing debate whether hypothesized destabilization processes of the Antarctic outlet glaciers will occur in the near future. These could lead to severe, abrupt ice loss from ice-sheet margins and would thereby critically accelerate sea-level
rise6,17,25. The melting and thinning rates of the Antarctic ice sheet observed to date are at the upper end of the projected range published in AR5. Since then, process understanding and representation in models as well as observational records have substantially improved. However, the related dynamics are still a major source of uncertainty in projections of the future response of the Antarctic ice sheets to climate change, and, hence, of sea-level rise6,25. Consensus among experts has grown that these regions are more sensitive to global warming and less stable than previously thought, and that AR5 estimates were too low. This refers especially to the high end of likely sea-level rise projections, which were estimated substantially lower in the former reports6,10,17. It is recommended to take into account the increased numbers for projected future sea-level rise for high-emission scenarios in decision-making as an orientation for upper bounds6,10,17.
New research on Greenland’s ice sheet and its response to global warming used satellite and model data for the years 2003–2016. Observations highlight the importance of oceanic forcing on mass loss, through melting the outlet glaciers at their margins, analogous to what is observed in Antarctica. Further, in addition to warmer seas degrading the Greenland ice sheet, atmospheric forcing can significantly enhance glacier melt. If atmospheric warming continues unabated, Greenland will continue to develop as a major contributor to global sea-level rise26.
As the large ice sheets influence sea-level rise, near-surface lowland permafrost can influence climate at a global scale, since additional outgassing of greenhouse gases further enhances temperature rise. Lowland permafrost holds approximately double the amount of carbon than the atmosphere, a potential source for both CO2 and CH4 (methane, the second most potent greenhouse gas after water vapour) when frozen organic material thaws and decomposes. The largest permafrost areas are situated in Arctic and sub-Arctic regions, where warming rates are more than double the global average due to Arctic amplification27, which is projected to persist in future25. It is uncertain whether the related positive feedback is happening and permafrost areas are already a source of CO2 and/or CH425. However, it is projected that near-surface permafrost in the Arctic will mostly disappear under a high-emission scenario, which would lead to the release of tens to hundreds of billions of tonnes of CO2, leading to amplified warming – the permafrost-carbon feedback25.
Projections of effects from warming and degrading

10
permafrost are based on models that include the gradual degradation of permafrost due to the background warming of near-surface air temperatures. However, pulse events play an important role as they disturb the local heat balance, thereby fostering near-surface permafrost to rapidly warm and/or thaw. Such factors include wildfires, erosion on river banks and coasts, and fast formation of lakes as a response to melting ice bodies and soil subsidence28. To date, many global climate models lack these processes as well as schemes that dynamically simulate the permafrost-carbon feedback. Both permafrost degradation and possible resulting carbon emissions are probably underestimated6.
New research on Arctic greening shows that additional plant growth is not sufficient to significantly mitigate or offset outgassing of greenhouse gases from these areas. Although growing season lengthens and temperatures rise, growing conditions remain difficult for plants due to temperature and water stress. This is projected to persist in future29,30.
Regarding greenhouse gas concentrations, not only are concentrations of CO2 on the rise, atmospheric concentrations of CH4 have resumed their growth since 2007 and doubled in growth since 201431. Methane concentrations are now at a record high of 257% of pre-industrial levels1. Sharp cuts in methane concentrations are needed to achieve the Paris goals. The reason for the acceleration since 2014 is strongly debated, but observations of stronger emissions across the southern tropics suggest wetlands drove part of the growth in response to the warm El Niño phases of the Southern Oscillation; isotope measurements of the gas support this view32. The sensitivity of methane emissions from wetlands during high-temperature periods suggests a future potential climate feedback associated with rising temperatures, which would be impossible to prevent whilst temperatures continue to rise. Other likely co-drivers from the emissions increase since 2007 include increased emissions from agriculture in the tropics and fossil-fuel use at mid-latitudes in the northern hemisphere33. These emissions could be reduced by changing livestock diets and through better systems for detecting and stopping methane leaks in oil and gas infrastructure.
Palaeo (prehistoric) studies show how contemporary
warming cannot be explained with natural forcings and variability alone, but only if the human factor is taken into account34. An investigation of the climate history of the past 3 million years shows that glacial-interglacial cycles of the earth were steered by the planet’s orbital parameters in combination with the atmospheric CO2 content. While this is nothing new in principle, the results once again show that earth’s climate is very sensitive to atmospheric CO2 concentration35.
Searching for prehistoric climates that could serve as analogues for future climate, an analysis has been done of temperature and concomitant CO2 contents of the past 50 million years36. Following the study, the Pliocene and Eocene climates are most plausible analogues for the coming 250 years. For both high- and low-emission pathways, climatic conditions similar to those of the mid-Pliocene will become most likely for many regions on earth by the middle of this century. While these would stabilize thereafter under a mitigation scenario, large areas of the earth would develop an Eocene-like climate by the 21st and 22nd centuries, if a “business-as-usual” scenario is applied. Global mean temperatures were 2–4°C warmer than pre-industrial levels during the mid-Pliocene, and more than 10°C warmer in the early Eocene. The upper bound for global sea-level rise for a climate similar to the mid-Pliocene is 25 m, which would occur over very long timescales10.
The pace of contemporary rise in greenhouse gas concentrations is unprecedented in the climate history over the past 66 million years37. Current rates of greenhouse gas emissions from human activities are substantially larger than during the strong warming that marks the early Eocene. In consequence, the rise of global mean temperatures and the changes in affected earth system components such as sea-level rise and the shift of climatic zones poses an unprecedented challenge to the speed of evolution of the biosphere, as well as to human adaptation capacity.

11
Climate change leaves no mountain summit behind3
Mountains are at the forefront of climate change impact. Considerable changes to the cryosphere (glaciers, permafrost, snow, and ice) are recorded worldwide with cascading effects on water availability in both the mountain catchment and the lowlands. Globally, glacier mass in mountain regions, excluding the Arctic and Antarctic, declined by 123±24 Gt (billion tonnes) per year from 2006–2015. This is about 500 kg per m2 of glacier, or like shaving off 0.5 m from the glaciers each year1. There has been a particularly large average mass loss observed in the southern Andes, Caucasus and Central Europe (over 850 kg per m2 and per year). The smallest losses, but with high local variability, are seen in High Mountain Asia (150±110 kg per m2 and per year)1. Permafrost, which in high mountain regions covers an area ranging from 3.6 to 5.2 million km2 (roughly equivalent to the size of the EU) is being affected by an increase in temperature throughout the European Alps, Scandinavia, Canada, and Asia1. The number of days of snow cover has declined in nearly all regions, and decreases are particularly striking at lower elevations1. Further large-scale deglaciation can be expected under both high- and moderate-emission scenarios1,2,3.
Observed and projected glacier, snow, and permafrost decline will continue to impact the frequency, magnitude, and location of most related natural hazards in mountains, including landslides and rockfalls, with exposure of people and infrastructure leading to increases in disaster risks1,6.
Consequences of climate-related changes in snow and glaciers on the amount and seasonality of water runoff are already observed in snow-dominated and glacier-fed river basins, and are also predicted to continue into the future1,4. The average winter snow melt runoff is projected to increase, and spring water runoff peaks to occur earlier1. The average annual runoff from glaciers in most mountain regions are expected to reach a peak followed by a decline by the end of the 21st century1. These projected trends are particularly concerning, given that ~1.4 billion people (23% of the world’s lowland population) are projected to depend on runoff contributions from mountains by mid-21st century under a middle-of-the-road scenario5. Many of the world’s biggest or fastest growing cities, such as Dar es Salaam with an expected 13 million citizens in 2035, are particularly at risk as they depend on nearby mountains for their drinking water. Risks are magnified by likely alterations in precipitation patterns or increased frequencies and magnitudes of droughts7.
Changes in climate also affect mountain ecosystems and their biodiversity at an accelerating pace. Findings from long-term ecological monitoring8,9,10 and large-scale assessments6,11 are consistent: climate change has resulted in unprecedented redistributions and losses of habitats and species along altitudinal gradients and increases the vulnerability of mountain ecosystems to additional stressors such as invasive species12. Assessments and predictions unanimously speak to rapid and irreversible changes in mountain biodiversity and
Key new insights
▪ Diminishing glaciers, snow, ice, and permafrost are observed in mountains. Mountain glaciers are on average estimated to have lost roughly half a tonne of mass per square meter – about 0.5 m in thickness – per year in 2006–2015.
▪ Changes to glaciers, snow, and ice in mountains influence water availability in the mountain catchments and the lowlands, possibly affecting billions of people
▪ Climate change irreversibly affects mountain ecosystems and their biodiversity, reducing the area of biodiversity hotspots, causing species to go extinct, and compromising the capacity of mountains to provide key ecosystem services
▪ Adaptation to climate change is possible but its effectiveness is severely constrained under high-emission scenarios.

12Bondo landslides in Switzerland, 2017. Melting glaciers and thawing permafrost create new hazards and increase the risk of disaster losses. Image credit: Marco Giacometti/Mountain Research Initiative

13
ecosystems – with estimated losses in the area of individual biodiversity hotspots across the Hindu Kush Himalaya of >70%6 – and to the imminent extinction of numerous species, including many endemic ones13,14.
Beyond biodiversity, climate change – alone or in combination with other drivers such as land-use change15 – affects mountain ecosystems in their functions and in the services they deliver, such as food, forest products, tourism, and not least the provision of clean water to half of humanity16,17. Rising temperatures can disrupt traditional crop productions, such as coffee in the Jimma area of Ethiopia under a business-as-usual scenario18. To increase resilience under climate change, conserving the large variety and genetic diversity of traditional crops and cultivars used in subsistence farming systems in mountains, notably in the Hindu Kush Himalaya6, is particularly important.
Together with gradual and abrupt changes in governance and socio-economic activities, climate change is a key driver of change in mountain social-ecological systems19. Observed and projected climate change translate to numerous impacts to human societies living in and dependent on mountains, with negative impacts on livelihood options and supporting sectors such as agriculture, pastoralism,
tourism, and energy1. A key opportunity to lessen impacts and support biodiversity is to encourage diversity in livelihood options for mountain communities under conditions of global change20, recognizing that indigenous and local knowledge in mountain regions play a key role in conservation and management21. Multi-purpose and integrated water management approaches across multiple scales can be effective at addressing impacts and leveraging opportunities from climate-related changes to the cryosphere and water resources in mountains4. However, global mitigation and adaptation measures in mountain regions are a prerequisite to sustainable mountain development, and depend on urgent and ambitious actions to provide the supporting conditions for their effective implementation4.
Projected regional glacier mass evolution between 2015 and 2100 relative to each region’s glacier mass in 2015 (100%) based on three Representative Concentration Pathways emission scenarios. Adapted from IPCC SR Oceans and Cryosphere, 2019.

14
Forests are under threat, with global consequences4
Forests are foundational pillars of land ecosystems, human sustenance, and cultures. Loss of forests is not only detrimental for the livelihood of people, but also for over half of all globally known terrestrial plant and animal species inhabiting these regions1, alongside serious consequences for both the local and global climate. Forests contain approximately 80% of the terrestrial biomass2 and act as a major CO2 sink, taking up 11.6 Gt CO2 per year3, which is equal to one third of global CO2 emissions from fossil fuels4. Removal of ~50% forests in a tropical region can increase the local average temperature by
around 1°C5. Thus, threats to forests have local as well as global consequences for human livelihoods and well-being, and the entire biosphere.
Loss of forest and associated carbon release persists into the 21st centuryDeforestation along with other anthropogenic land-use changes accounts for 13% of the global anthropogenic CO2 emissions4, becoming one of the major causes of climate change3,4. Of the forest loss in the period 2005–2013, 62% could be attributed
Key new insights
▪ The world’s forests are a major CO2 sink, absorbing about 30% of anthropogenic CO2 emissions
▪ Anthropogenic forest fires driven by land-use alternation have been reducing major CO2 sinks
▪ Climate change globally amplifies wild forest fires
▪ CO2 emissions increase forest photosynthesis capacity to a certain degree, but temperature increases cause tree mortality and reduce overall carbon storage capacity
▪ Fighting deforestation and encouraging reforestation, along with sustainable forest management and other natural climate solutions are important and cost-effective options for reduced net emissions
Map of observed fire emissions 1999-2014 showing where fire is increasing (orange) or decreasing (blue). Adapted from Arora and Melton, Nature Communication, 2018. (CC BY 2.0)

15
to expanding commercial cropland, pastures and tree plantations6. A significant fraction of emissions related to deforestation in 2010–2014 was driven by international trade (29–39%)6. While the southern hemisphere is facing the most severe deforestation, the northern hemisphere is increasing its tree cover7. This phenomenon could be partially attributed to displacing commercial land use from the north to the south6.
Anthropogenic forest fires driven by land-use alternations are a threat to forests in Africa, Latin America, and Asia. In Africa, prolonged fires occur widely in the sub-Saharan region8. Most of this comes from large-scale changes to land-use in western Ethiopia and western tropical Africa9. In 2019, there was an observed increase in the number of fires in the Amazon region compared to 2018, alarming the international community, but the number of fires and associated emissions were in fact close to the long-
term average10. The most devastating and largest fires in the Amazon region were observed in the early 2000s, driven by massive clearing for agriculture and cattle grazing11. In South East Asia, higher fire frequencies can be found for Myanmar, Thailand, Cambodia, Indonesia, and Laos11. In Indonesia, haze caused by fires ignited for clearing forest for palm oil plantations poses a substantial human health threat12.
In recent years, there has also been observed regional increase in wild forest fires such as in Western US and Alaska, Canada, Russia, and Australia as a result of prolonged droughts8,13. The combined effect of natural and anthropogenic fires to the Amazon and wild fires of boreal forests means we could be losing a major carbon sink14. Significant increases in the number, magnitude and duration of fires occur in cycles. For instance, the El Niño events that regularly change southern hemisphere circulation
Ethiopia, a tree-planting champion, managed to plant 350 million trees in a single day29.
Bhutan preserves 60% of its land under forest cover and more than 51% of the country is protected, the largest percentage of any Asian country30.
Spotlight: Ethiopia and Bhutan
Photo: Antonio Morales García (CC BY-SA 2.0)
Photo: ILRI/Apollo Habtamu (CC BY-NC-SA 2.0)
16
magnify wild and anthropogenic fires. The impact of the 2015–2016 El Niño on the terrestrial carbon cycle was a lowered net uptake of CO2, mainly by drying natural forests15. The net CO2 emissions from tropical Africa are estimated at 5.4 and 6 Gt per year for the years 2015 and 2016, respectively9. This corresponds to about one-tenth of total global greenhouse gas emissions. But on a global scale, long-term observations for the 1960–2009 period suggest general reduction in CO2 emissions from fires due to fire suppression, and landscape fragmentation reduced land carbon uptake by 0.48 Gt CO2 per year, corresponding to ~19% of the global land carbon uptake16.
Climate change impacts forests and their carbon sink capacityIn the face of climate change, forests show an altered capacity to serve as carbon sinks compared to pre-industrial climate conditions. For example, trees grow faster when “fertilized” by higher CO2 concentrations thus increasing photosystems and CO2 absorption from the atmosphere. However, the lifetime of trees may be shortened, meaning that the long-term sequestration effect is also affected17. Interdependence between higher stem productivity, faster tree turnover and shorter carbon residence time also limits carbon storage18. “Fertilizing” by CO2 has another limitation: there is a shortage of phosphorus in natural ecosystems that will inhibit tree growth despite more CO2 being available in the atmosphere19.
A significant intensification of the hydrological cycle of the Amazon has been seen with strongly increased precipitation and river runoff during the wet
season and decreasing rainfall during dry season20. Increasing incidences of prolonged droughts have increased the occurrence of Amazon wildfires. This process is driven by a decrease in oceanic moisture inflow that triggers vegetation-atmosphere feedbacks, in turn decreasing cloud formation and rainfall21. Climate change and particularly maximum temperatures and air moisture are estimated to intensify wildfires22, and globally fires are persisting for longer due to droughts8,13.
Climate change can also reduce photosynthesis, intensify evaporation, and increase tree mortality in response to widespread drought23. Prolonged drought and heat above 29.5°C have been shown to strongly increase tree mortality24,25. Many pine tree populations in Central Europe and Northern America are declining due to drought and associated vulnerability to bark beetles26,27.
Potential of restoration and protection of natural forests as a climate solutionAt the current level of CO2 atmospheric concentrations, the fertilization effect is still giving positive carbon uptake, so stimulating forest growth can be considered a climate change mitigation measure16. Reforestation, stopping deforestation, and sustainable forest management, together with other natural climate solutions are viable and cost-effective options that could close the gap in emissions reductions required by 2030 under the Paris Agreement28.

17
Weather extremes – a “new normal” in 20195
Record-breaking extreme weather and climate events have continued to dominate the headlines in 2019, drawing public attention to the role played by anthropogenic climate change. The public outcry has been accompanied by an increasingly comprehensive and robust scientific literature attributing the increase in frequency and intensity of events – such as unprecedented wildfires in Siberia and the Amazon region and record monthly global temperatures – to climate change. The impact of such events goes beyond mere record setting and environmental damage. The material and human costs are especially high when vulnerable communities are affected.
Attribution science, estimating how much more severe an extreme event has been due to climate change, has come a long way in the past decade1. Throughout 2019, scientists have sought to understand extreme events related to heat, drought, floods and cascades of events. Here we explore some in more detail.
Around the globeGlobally, most land regions are experiencing increases in persistent rainfall extremes, which last several days2. In every region, however, the situation is special. For example, while a strong influence of El Niño conditions on torrential rainfall on the southern edge of the Atacama Desert has been observed in the past, model simulations suggest
total annual rainfall there could fall by 15–30% in the 21st century and intensify storms3. On the other side of the globe, in Mongolia, extremes are influenced by the El Niño-Southern Oscillation in the Pacific as well, but here extreme precipitation has slightly decreased between 1960–2017, while warm extremes significantly increased, especially during the night4. Typical characteristics of any region, however, are not necessarily set in stone. For example, the “drought in the north – floods in the south” pattern in China, which is a natural feature that has been observed to increase due to climate change in the past, has shifted in recent years (more droughts in the south, more extreme precipitation in the north), accompanied by severe economic losses5.
The duration of extreme events is strongly correlated to their impact. For example, hurricane stalling (when storms grind to a slow crawl or halt), as increasingly observed along the North American coast, is associated with stronger rainfalls. The cause for this particular increase, however, may lie in natural variability6. Impactful extremes can also be overlooked when focusing at daily mean values: hourly rainfall extremes – typically thunderstorms – can have strong impacts, like urban flooding or landslides. The strength of hourly rainfall extremes has been observed to increase in Australia, lies above the range of natural variability, and is around twice as high as expected from scaling considerations involving temperature rise and higher moisture content in the air7. This is also the case for daily
Key new insights
▪ Some extreme weather continues to become more likely and more severe
▪ Increasing number of extreme events are region-specific
▪ Europe has seen a particularly strong increase in heat extremes
▪ The duration of extreme weather events is anticipated to increase in a 2°C world
▪ Synchronous extremes are risky in a globally connected world
▪ Societies often don’t have time to fully recover from extreme events before another one hits
▪ Ambitious mitigation can curb risks but with 1.5°C warming, regionally dangerous levels will be reached
18
rainfall extremes in the French Mediterranean: the mean intensity is estimated to have increased by 22% over the 1961–2015 period, which is about one to three times higher than what one would assume from thermal scaling considerations8.
Persistent heatwavesAlthough this year’s record-breaking heatwaves in Europe still await full scientific analysis, it seems clear that they came with deleterious implications for human health. Heatwaves with a similar frequency would have likely been around 4°C cooler a century ago. Europe has seen a strong increase in heat extremes, to a larger extent than predicted by climate models. Possible reasons include soil moisture feedbacks and jet-stream dynamics, not yet sufficiently well represented in climate models9.
The jet stream – a fast-moving band of air 11 km up in the atmosphere – is increasingly showing signs of unusual behaviour, probably due to Arctic warming. This is affecting weather in the northern hemisphere, for example, leading to hot air from Africa reaching France and Germany and resulting in temperatures as high as almost 46°C in France in June 2019. The connection between the northern ocean, sea ice, and temperatures in the Arctic10,11 has been at the centre of a number of northern hemisphere extreme weather events in summer 201812, like heatwaves and rainfall extremes. The associated wave pattern in the atmosphere has been occurring more often in recent decades, but the attribution to global warming is still a field of active research.
Multi-model analyses suggest that in a 2°C world, the duration of extremes will severely increase – for instance, the persistence of events that are both warm and dry in eastern North America could increase by 20%13. Weather extremes in the far north could accelerate permafrost thaw14,15 and wildfires16, causing further releases of greenhouse gases and thereby contributing to “positive” feedback loops of global warming17.
Compound, cascading, and connected eventsIncreasingly, societies will have to adapt to compound and cascading events18,19. Compound events (from a combination of different climate drivers and hazards) can amplify the risk of severe impacts significantly20. In California, a combination of extreme heat and dryness amplifies wildfire risk affecting air pollution and food production: climate change has doubled the probability of years that are both warm and dry in the same location (relative to the 1961–1990 baseline)21. Cascading events do not leave enough time for societies to recover before the next event happens.
There is increasing scientific evidence that extreme events – just like known, large-scale phenomena such as the El Niño-Southern Oscillation – can be connected across continents12. New methods based on network analysis and advanced statistical methods may help in predicting these events in the future22,23.
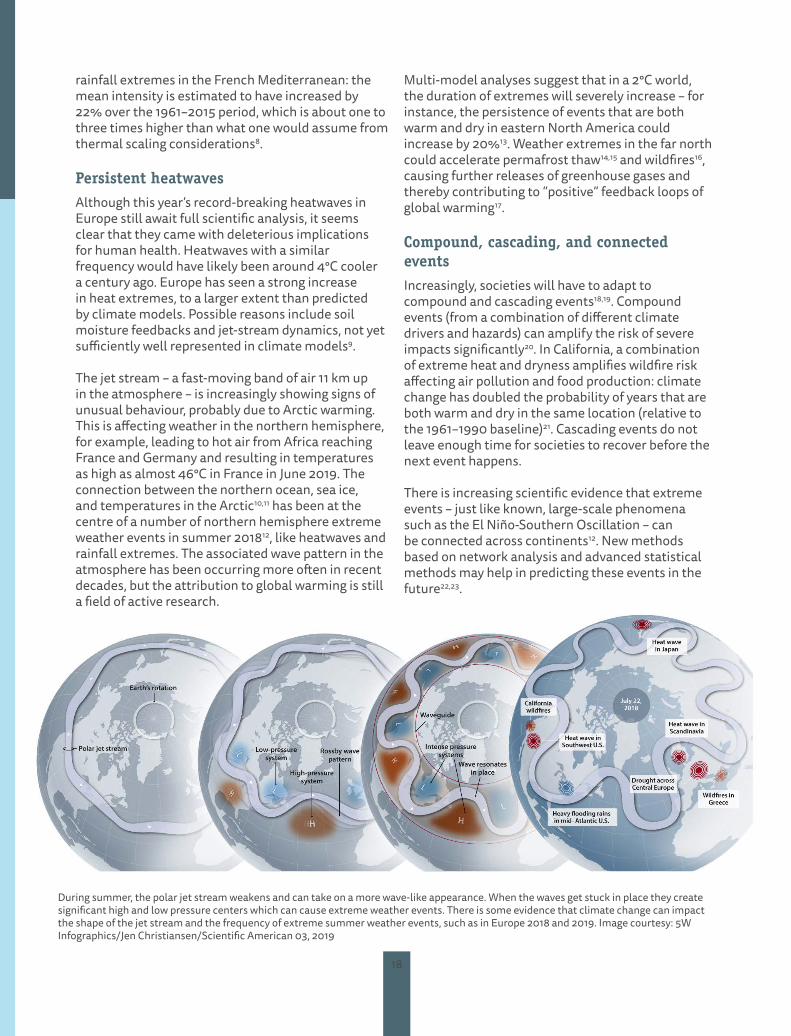
During summer, the polar jet stream weakens and can take on a more wave-like appearance. When the waves get stuck in place they create significant high and low pressure centers which can cause extreme weather events. There is some evidence that climate change can impact the shape of the jet stream and the frequency of extreme summer weather events, such as in Europe 2018 and 2019. Image courtesy: 5W Infographics/Jen Christiansen/Scientific American 03, 2019
19
Looking to the futureClimate change is forcing us to reconsider the notion of an extreme event. What was once considered unlikely or rare (both in terms of the intensity and frequency) is becoming part of a “new normal”. This fundamental shift in our climate system has reached levels now being felt by societies across the globe. Whether in the form of the hottest summer, longest drought, or largest wildfire on record, repetitive record breaking is becoming a feature of popular discourse around climate change. The impacts of these extremes are furthermore being felt by societies in myriad forms, including increased food prices due to crop failures, health impacts of the outbreak of water-borne diseases or heatwaves, or direct property damage from storms. Even when pursuing policies that are considered to be consistent with the 1.5°C aim, there will be increased risks of some regional extremes reaching dangerous levels for ecosystems and societies over the coming decades26.
Spotlight: OceansExtreme heat is not just a phenomenon experienced on land. Knowledge of ocean heatwaves is expanding. Climate change is increasing the severity of ocean heatwaves, with temperature anomalies of almost 7°C recorded in some places24. Since 1982, the number of days experiencing marine heatwaves has doubled. If global average temperature reaches 1.5°C, the number of days is expected to increase by a factor of 16. This jumps to a factor of 23 for a 2°C rise25. Today, 87% of marine heatwaves are attributable to human-induced warming, with this ratio increasing to nearly 100% under any global warming scenario exceeding 2°C26. Ocean heatwaves are killing coral reefs and reducing fish harvests. More research is required to better understand the coexistence of risk factors, such as heat, ocean acidification, and deoxygenation, in order to devise better adaptive strategies.

20
Biodiversity – threatened guardian of earth’s resilience
6
Climate change threatens biodiversity globally, on land as in the ocean. At the same time, biodiversity is a key feature of stable ecosystems, providing – among many other services to humanity – carbon stocks and sinks (absorbing about a quarter of human emissions) and thereby guarding the earth system’s resilience against the disruption from anthropogenic carbon emissions1,2,3. Therefore, it is urgent to put a halt to ecosystem degradation.
Terrestrial biodiversityThe response of terrestrial biodiversity to climate change will heavily depend on how soon we can halt global warming. Even at 1–2°C global warming, terrestrial ecosystems could lose 14% of their current local species on average, with those species losing 35% of their suitable habitat4. For a temperature increase beyond 3°C, entire taxonomic groups will not be able to respond and adapt. Current business as usual, leading us to a 4°C+ world, would result in one-third of local species disappearing, with their suitable climate area reduced by more than half4.
Both land-use change and shifts in climate conditions weaken the resilience of natural ecosystems individually, but also because these pressures interact5. For example, the combination of land-use change and climate change can explain more than half of the observed biodiversity shifts on Mount Kilimanjaro, while seen individually they account for only about one-third6.
The establishment of protected areas, a common strategy to preserve biodiversity, requires adjustments in a changing climate, because natural ecosystems, especially in temperate and northern high-latitude biomes, are expected to experience pressures that potentially force them to migrate into anthropogenically changed areas7. Transboundary agreements therefore need to complement national solutions, based on coordinated monitoring of
Key insights
▪ Terrestrial biodiversity is suffering from climate shifts, with 14% local species loss on average predicted already at 1–2°C warming – to more than one-third in a business-as-usual scenario
▪ Coral reefs – marine biodiversity hotspots – are at high risk of extinction, due to ocean acidification, warming, heatwaves, and other anthropogenic pressures. At 2°C warming, at least 99% of coral reefs will disappear together with their ecosystem services, which sustain over 0.5 billion people at present
▪ Rising water temperatures increase the risk of decreasing fish populations due to changes in marine food webs. In freshwater ecosystems, fish die-offs may double by 2050 and increase fourfold towards the end of the century due to extreme summer temperatures
▪ Natural climate solutions are an essential contribution to mitigation, but nowhere near enough to ensure climate stability
Average loss of local species in ecosystems on land at different levels of global warming. Based on systematic review by Nunez et al, Climatic Change, 20194.

21
species within an ecosystem perspective8. At the same time, protected lands (and waters) face an uncertain future. For example, industrial-scale resource extraction and development9 in the United States and many Amazonian countries has downgraded protection levels or downsized designated areas.
Marine and freshwater ecosystems Coral reefs – marine biodiversity hotspots – are particularly vulnerable to ocean warming and acidification. Even if global warming is limited to 1.5°C, reef ecosystems are projected to decline by a further 70–90%2. At 2°C warming, coral reefs will almost completely disappear, shrinking to around 1% of their original extent2. Marine heatwaves trigger mass bleaching and mortality if cumulative heat exposure exceeds the critical thresholds for different groups of species10,11. Ocean acidification is another major factor leading to coral mortality1. The degradation of coral reefs threatens ecosystem services that sustain the livelihoods of more than 500 million people1.
Marine heatwaves and ocean warming are also ultimate causes of regime shifts in kelp forest ecosystems12. Rising water temperatures will affect marine food webs through species-specific effects on life cycle events. Contrasting shifts in the predator and prey populations lead to a temporal mismatch in food demand and supply, potentially causing fish population to decline by mid-century in higher latitudes. This effect is likely to be less pronounced in the temperate zone13.
Rising temperatures also render freshwater ecosystems more vulnerable to catastrophic ecological events. Fish die-offs under summer heat extremes may double by 2050 in temperate lakes of the northern hemisphere and increase more than fourfold by late century, with the effect being particularly pronounced on lower latitudes14.
Natural climate solutionsThe threats to biodiversity and healthy populations are all the more alarming as these are key elements for the earth system’s resilience – they enhance the stability of ecosystems in the face of disruptive or gradual changes. Ecosystems regulate the local climate and some play host to huge carbon stocks and sinks.
Natural climate solutions based on carbon storage or stockage in forests, wetlands, and grasslands have for some time been important in the debate on climate mitigation15. Whilst the quantification of their potential remains contentious16, there is general agreement that they are an essential part of a comprehensive mitigation portfolio, highlighting the central role of the ecosphere within the earth system. However, even with the highest estimates of their potential as carbon sinks, decarbonization of the economy remains an unavoidable imperative17.

22
Climate change threatens food security and the health of hundreds of millions
7
Climate change reduces agricultural yieldsClimate change is already affecting food production by reducing agricultural yields, especially in the tropics. Already more than 820 million people have insufficient food2. Poorer food availability affects human health by increasing the incidence of stunting – reduced growth and development. These are risks that are most acute for low- and middle-income countries dependent on rain-fed agriculture1.
Climate change reduces food’s nutritional qualityThe food security impacts of climate change go beyond risks to food’s availability. Increasing concentrations of CO2 in the atmosphere, which drives climate change, will also reduce the nutritional quality of major cereal crops, exacerbating food security challenges over the coming decades.
Research indicates that undernutrition will be the greatest health risk of increasing CO2 concentrations and climate change1. Micronutrient deficiencies already cause a large burden of disease globally, with 1.5 billion people deficient in iron, zinc, and other micronutrients2; 45% of mortality in children under five is attributable to undernutrition3.
Micronutrient deficiencies adversely affect a wide range of health outcomes, particularly affecting maternal and child health and with possible adverse impacts on cognitive development, metabolism,
and an increased risk of obesity and diabetes; these impacts can affect health and welfare throughout life. Over the coming decades, these impacts could worsen, as higher concentrations of CO2 directly affect plants. The global availability of protein is projected to fall by 4.1%, iron by 2.8%, and zinc by 2.5% at CO2 concentrations expected by 20504,5. Multiple rice varieties show large declines in most B vitamins at CO2 concentrations expected later this century, but not for vitamin E6. As rice underpins the diets of so many of the world’s poorest people in low-income countries, this could affect the nutrient status of 600 million people6.
Research indicates that by 2050, the global availability of protein could fall by 19.5%, iron by 14.4%, and zinc by 14.6%. This accounts for the effect of increasing concentrations of CO2 on nutrient content, as well as reductions in productivity due to climate change, alongside projected improvements in technology, market responses, and shifts in diets, crop production, food prices, and income8. Other research indicates the impact of increasing concentrations of CO2 on human nutrition would primarily affect people in South East Asia and sub-Saharan African countries9. The public health intervention of providing vitamin supplements could partly avert the disease burden. The health risks are amplified when considering the impact of reduced forage quality on livestock, which are already protein-stressed, with reduced weight-gain. Adaptation responses could include enriching grassland forage with nitrogen fertilizer or promoting nitrogen-fixing species10.
Key new insights
▪ Undernutrition will be the greatest health risk of climate change with declining agricultural productivity, particularly in drylands in Africa and high mountain regions of Asia and South America
▪ Increasing concentrations of CO2 will reduce the nutritional quality of most cereal crops, with hundreds of millions of people in South East Asian and sub-Saharan African countries worst affected
▪ The combined effects of climate change and the rise in CO2 concentrations are projected to result in a 20% reduction in the global availability of protein by 2050
▪ Global fish stocks are set to further decline with climate change, with an additional 10% of the global population facing micronutrient deficiencies as a result
23
Productivity decline to hit some regions harder than othersWhile at high latitudes warmer temperatures are improving yields in some crops, at lower latitudes yields are declining due to the combination of warming and dryness, changes in precipitation patterns, and greater frequency of extreme events, such as floods and droughts, causing crop failure. Droughts are the most destructive climate-related extremes, causing more than 80% of agricultural loss and damage across all agricultural sectors2. By 2050, drylands in Africa and the high mountain regions of Asia and South America could be particularly badly affected. For example, declines in productivity of up to 46% are projected for rangelands in western Africa under a business-as-usual emissions scenario, with substantial risks for 180 million people dependent on livestock farming7. The risks to food access will increase with additional warming: in South East Asia, per capita crop production is projected to decline by one-third at 1.5–2°C warming, with more substantial reductions in yield predicted above 2°C7. Interacting pressure for water supplies during droughts, for example from the energy sector, could restrict its availability for crop irrigation, highlighting the importance of developing less water-intensive power generation in water-stressed regions14.
Marine food supplies to significantly declineClimate change is an additional pressure on already declining stocks of fish and shellfish, important sources of human dietary protein and nutrients. A comprehensive assessment combining climate and ecosystem models found that under a business-as-usual emissions scenario, the total weight of marine animals – including fish, invertebrates, and marine mammals – could decline by 17% by the end of
the century11. The strongest declines are projected for temperate to tropical regions. Other research warns that 10% of people could face micronutrient deficiencies driven by fish declines over the coming decades. The impact of declining fisheries will hit some places harder than others: low-latitude nations where human nutrition is most dependent on wild fish would see the combined consequences of climate change, population pressure, and weak fisheries governance leading to the worst impacts on human health12.
Loss and damage set to worsenClimate change also will increase loss and damage throughout the food system, for example due to contamination of crops before or after harvest by moulds and fungi. The IPCC special report on “Climate Change and Land” warns that mould-related mycotoxins – which survive food processing and pose a serious threat to human and livestock health, with impacts ranging from acute poisoning to immune deficiency and cancer – are expected to increase with rising temperatures and increased frequency of extreme events7. Up to three times more mycotoxin contamination of wheat is projected for north-west Europe in the coming decades. The health impacts of mycotoxins are most severe in Africa13.
To buffer the combined impacts of climate change and rising concentrations of CO2 on food’s quality and availability, the Food and Agriculture Organization of the United Nations calls for increased equitable distribution and innovation in food production, and the continued development of low-input and low-impact aquaculture2. The challenges to public health due to decreased micronutrient content of crops could be partly addressed by plant breeding. New interventions are needed to address declines in protein and B vitamins.
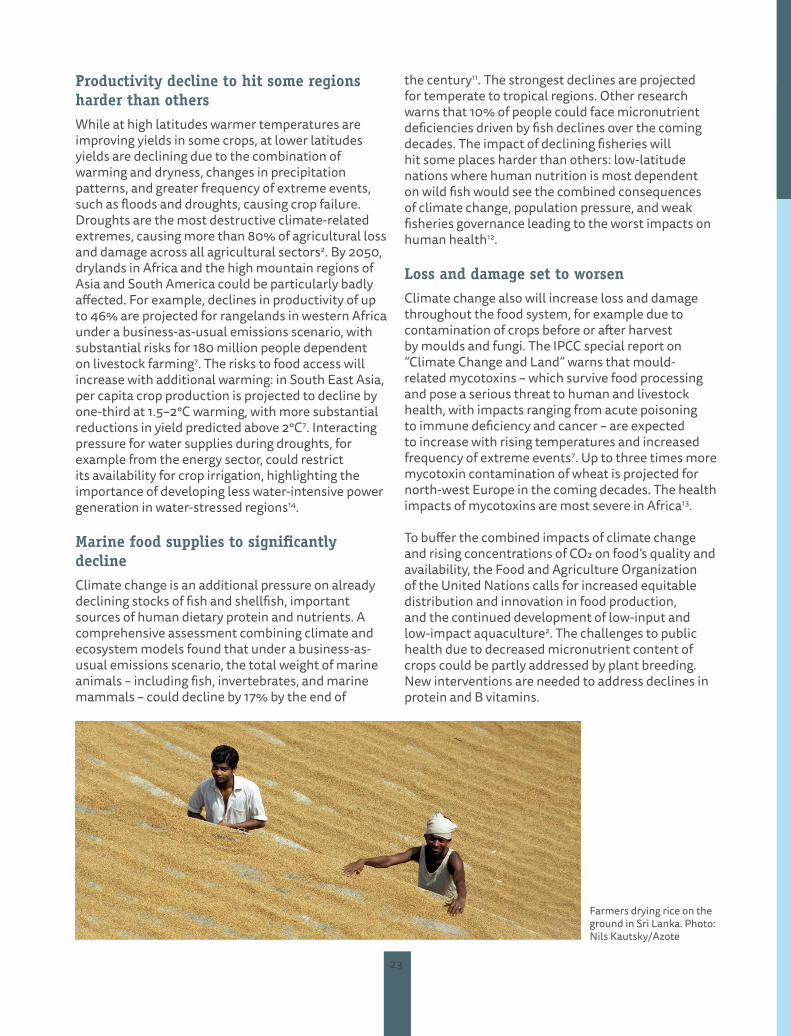
Farmers drying rice on the ground in Sri Lanka. Photo: Nils Kautsky/Azote
24
Most vulnerable and poor hardest hit by climate change
8
Climate change strikes hardest at the poor and marginalized. While all of us will be affected by climate change, the poor are more vulnerable to drought, flooding1, high temperatures2, and other natural disasters with low capacity to adapt. They are also more vulnerable when disaster hits – they lose a far greater proportion of their savings or resources compared to the rich. Poor people also receive less post-disaster support from external agents and do not have social and financial safety nets3.
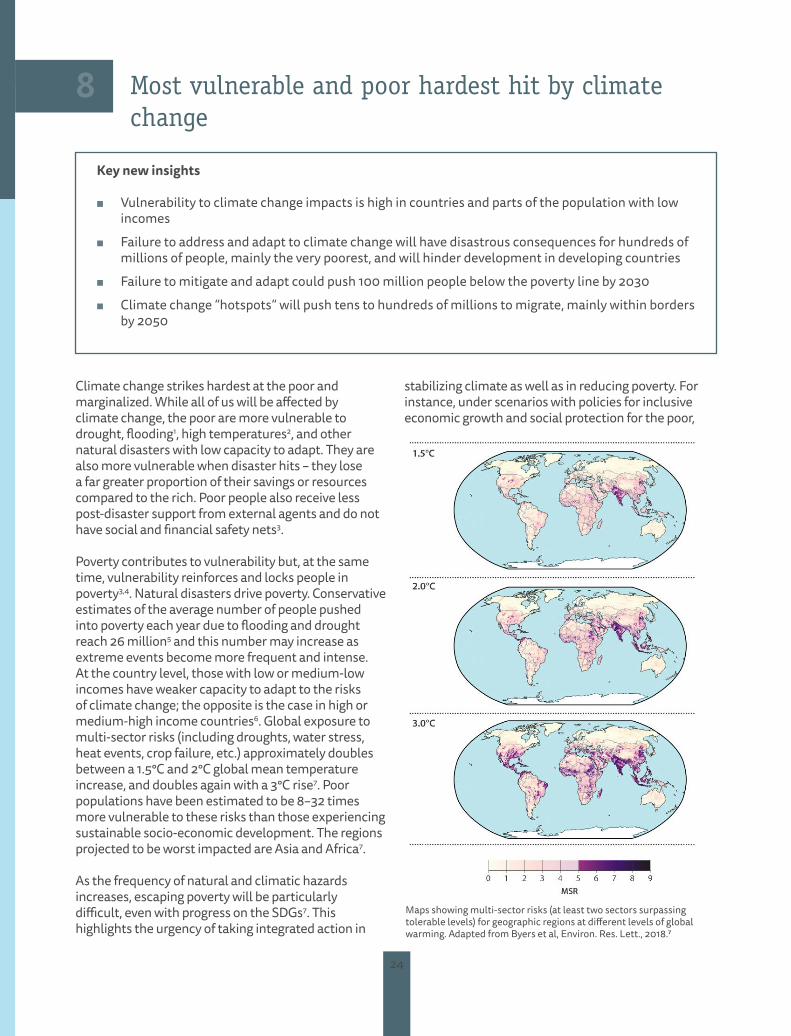
Poverty contributes to vulnerability but, at the same time, vulnerability reinforces and locks people in poverty3,4. Natural disasters drive poverty. Conservative estimates of the average number of people pushed into poverty each year due to flooding and drought reach 26 million5 and this number may increase as extreme events become more frequent and intense. At the country level, those with low or medium-low incomes have weaker capacity to adapt to the risks of climate change; the opposite is the case in high or medium-high income countries6. Global exposure to multi-sector risks (including droughts, water stress, heat events, crop failure, etc.) approximately doubles between a 1.5°C and 2°C global mean temperature increase, and doubles again with a 3°C rise7. Poor populations have been estimated to be 8–32 times more vulnerable to these risks than those experiencing sustainable socio-economic development. The regions projected to be worst impacted are Asia and Africa7.
As the frequency of natural and climatic hazards increases, escaping poverty will be particularly difficult, even with progress on the SDGs7. This highlights the urgency of taking integrated action in
stabilizing climate as well as in reducing poverty. For instance, under scenarios with policies for inclusive economic growth and social protection for the poor,
Key new insights
▪ Vulnerability to climate change impacts is high in countries and parts of the population with low incomes
▪ Failure to address and adapt to climate change will have disastrous consequences for hundreds of millions of people, mainly the very poorest, and will hinder development in developing countries
▪ Failure to mitigate and adapt could push 100 million people below the poverty line by 2030
▪ Climate change “hotspots” will push tens to hundreds of millions to migrate, mainly within borders by 2050
Maps showing multi-sector risks (at least two sectors surpassing tolerable levels) for geographic regions at different levels of global warming. Adapted from Byers et al, Environ. Res. Lett., 2018.7
25
climate change impacts on poverty may be mitigated at least until 2030. However, without adaptation and management of climate change, an estimated 100 million could be pushed below the poverty line by 20308. By 2050, lack of proper adaptation could depress growth in agricultural yields by 30%, increase the number of people lacking sufficient water by 1.4 billion, and force hundreds of millions from their homes in coastal cities9. All these impacts could lead to serious setbacks for the internationally agreed objective of eradicating extreme poverty8.
For vulnerable communities, an additional challenge is forced displacement when homes become uninhabitable or livelihoods are lost. In addition to sudden mass migration due to extreme weather events, slower and progressive climate risks such as drought, soil erosion, and sea-level rise are projected to induce more migration from low-lying coastal zones, small island developing states, and less favourable agricultural areas over the next century. Forced migration is expected to happen much sooner10. In 2018, weather-related disasters triggered new in-country displacements of 16.1 million people, mostly from East Asia, South Asia, and the Pacific11.
The latest research employing more accurate coastal elevation data, indicates that the size of the global coastline exposed to sea-level rise is triple than previously predicted12. Most at risk of inundation are in eight Asian countries: China, Bangladesh, India, Vietnam, Indonesia, Philippines, Thailand, and Japan; and larger proportions of these populations will be threatened with displacement due to inundation12.More people live in cities, and coastal cities are denser.
Cities are recognized as both a locus of problems and a home to positive steps to address climate change13. Resilience planning in cities requires addressing social equity issues, including power, politics, and justice14,15,16. It is suggested that failure to do so is likely to lead to 3 billion people, mostly in the global south, living in slums by 205013 versus about 1 billion today17. These are communities with limited governance and unzoned lands that are exposed to climate-related hazards such as floods. Poor housing and basic services amplify the risks for individuals and households. Enabling these communities to adapt to climate change is a priority13.
Projecting the future number of people who could be displaced is challenging given the multiple drivers for migration and the difficulty of disentangling motives. A new modeling attempt focused on sub-Saharan Africa, South Asia, and Latin America, estimates from 31
million up to as many as 143 million people (about 2.8% of the population) may need to migrate within their own countries by 2050 due to climate change18. The worst effects could be avoided if concerted action is taken to reduce emissions and support development18.
While migration is an important adaptation strategy, displacement brings with it a myriad of social, political, and humanitarian issues. A heavy burden is placed on receiving destinations, especially those that lack the resources to manage large-scale displacements10. Surrounding areas such as urban and urban fringes need to be ready to provide infrastructure, resources, and social support systems for migrants. Climate change is considered to be a threat multiplier, intensifying existing conflict where resources are scarce19. Therefore ways to mitigate security threats and conflicts should be anticipated. Policymakers can prepare by ensuring flexible social protection services and including migrants in planning and decision-making.
A global Task Force on Displacement was established by the UN for the purpose of identifying integrated approaches to avert, minimize, and address climate-related displacement issues20. Legal and political implications for in-migrants also need to be considered as they seek to be integrated into the receiving destinations. The Global Compact for Safe, Orderly, and Regular Migration21, formally endorsed at the UN conference in Morocco in 2018, is an initial step in providing protection measures for climate change migrants.
There is an urgency in immediately increasing action on mitigation and adaptation. Low carbon development pathways that offer co-benefits for the poor should be prioritized. Adaptation will help avoid larger economic losses due to recovery or rebuilding. Effective adaptation could generate positive economic returns between 2–10 times the investments9. A global investment in adaptation of USD 1.8 trillion in five areas from 2020–2030 could generate USD 7.1 trillion in net benefits9. Significant climate finance should be directed to adaptation in vulnerable areas and populations. There are many adaptation measures and policy responses that can be considered such as government funding for planned retreat or relocation of communities to safer ground, policies for assisting rural-urban or inter-island migration, and ecosystem-based disaster risk reduction22. Interventions should prioritize those that suffer the most23. What is important is to ensure that the social and environmental benefits of adaptation will accrue to the most vulnerable and the poorest of the poor.

26
Equity and equality pivotal to successful climate change mitigation and adaptation
9
Achieving the Paris Goal of staying well below 2°C of global warming requires sets of aggressive and diverse policies. Among these, important measures are fiscal reforms, such as removing fossil-fuel subsidies while putting a price on carbon. Fossil-fuel subsidies, which effectively lead to a negative carbon price, are still common practice and disproportionately benefit richer households. Fossil-fuel subsidies are estimated to be 3.5 times larger than the financing required to meet the SDGs for basic social protection, universal health, and education1.
However, the success of climate policy depends on social acceptance. A growing body of literature shows perceived fairness, trust in the government, policy effectiveness, and how revenues are used, to be crucial factors for new policies to be accepted2,3,4. Mitigation policies that are not articulated appropriately and not accompanied by measures for social equality could trigger events like the Yellow Vest protests in France3,5, the recent unrest in Ecuador that was stoked by increased oil prices (not directly linked to mitigation policies), or potentially
Key new insights
▪ Success and failure of climate policies highlight the importance of addressing social issues
▪ Social justice is an important factor for societal resilience in the face of climate change, vital for both local and global cooperation to facilitate mitigation and adaptation
Miners and residents of the miners zone of Asturias demonstrate in Langreo, Spain, against close-downs and financial cuts in the carbon sector. Through agreements with unions and compensation schemes, Spain have been able to shut down most coal mines. (Photo: Matthibcn)
27
populist politics. Justice and fairness in mitigation is essential to avoid “my country or my planet” conflicts6.
Socially sensitive fiscal reforms incorporate solutions to three key issues: the equitable distribution of costs, avoiding carbon “leakage” to places with lax policy, and public support. In theory, implementing compensation measures can address a problem with emission trading and other carbon pricing schemes: that they are either accepted but too low to be effective, or high enough to be effective but not accepted by the public3.
When considering perceived fairness and efficiency of policies, policymakers must be sensitive to the political context they are in. For instance, voters oriented towards the political left may be in opposition to compensation measures if they are framed as tax cuts4, and the acceptance for carbon taxes may be higher if revenues are used for environmental projects rather than compensation schemes1,4.
Without due consideration of social issues, rolling out low carbon urban development policies has the potential to increase inequality7. Policymakers should also consider intergenerational equity. Given the high risks and large uncertainties in the climate system response and the high costs of delaying action, carbon prices should begin at high levels to force strong mitigation in the near term rather than pushing risks and costs to coming generations8.
Social justice and equity is not just something to consider for mitigation policies to be effective, but important for adaptation and building resilience to the impacts of climate change. High inequality has been identified as a contributing factor when resource depletion has driven civilizations to collapse in the past, and threatens the ability of our current civilization to survive climate change and other environmental changes9. Climate change effects on natural hazards can increase inequality10, whereas from a fairness perspective adaptation should reduce it11, hence it is likely that across-the-board national public support for adaptation may be elusive.
Adaptation processes often become unequal negotiations between local government and communities: the outcomes of those negotiations often depend on the influence of the communities concerned, their ability to pay12, as well as the local government’s appetite and capacity to engage. Social justice and equality requires the adaptation processes to be inclusive, (not just “informed”13), the communities concerned having agency14 and equality before the law12. A conversation on what to do needs to start early and involve the community from the beginning15, and the engagement has to be deep and an evolving process. Measuring the success of adaptation programs should be done in the most vulnerable part of the population, not through average statistics11.
28
Time may have come for social tipping points on climate action
10
Global emissions are still rising and the world is not on track towards the necessary reductions. As shown in Insight 1, drivers for reduced emissions, such as growth of renewable energy, change in public opinion, policy regimes, and consumer habits are clearly not strong enough to counter drivers of increased emissions, even after decades of climate awareness. Should drivers for reduced emissions continue growing at a linear pace, it would be impossible to stay within the carbon budgets for a likely chance of a stable climate. However, the massive civil climate-related protests we currently observe may be bringing the world closer to expected thresholds of “tipping” the global socio-economic system towards a decarbonizing state1,2. Public opinion polls indicate that an increasing number of citizens in various countries are seriously concerned about climate change3.
Tipping-like phenomena refers to movements that reach a point where the rate of change accelerates in
non-linear and exponential rates. Such phenomena can be observed in both natural and socio-economic systems; change is rarely linear. Historical examples of small interventions leading to large effects include, for example, the slave trade ban that initiated the global slavery abolition movement in the 19th century4,5, the feminist movement that led to women achieving voting rights in the majority of countries in the 20th century6, and the introduction of subsidies in the EU agricultural policy that dramatically changed the food production system in Europe7. There are key socio-economic subsystems, where critical interventions have the potential to lead to crossing a tipping point at which the global socio-economic system would be decarbonizing in a non-linear way. These interventions include revealing moral implications of fossil fuels, divesting fossil-fuel assets, subsidizing renewable energy generation, strengthening climate education and engagement, and disclosing information on greenhouse gas emissions. Activating multiple tipping interventions
Key new insights
▪ Public opinion polls indicate that an increasing number of citizens in various countries are seriously concerned about climate change
▪ Historic evidence shows that 21–25% of a population needed to change their behaviour to enact significant system-level changes
▪ Deep and long-term transformations driven by a great diversity of actors are needed to meet the Paris Agreement and the SDGs
▪ Recent massive civil protests are getting close to the thresholds where we could expect “tipping” of some socio-economic systems
Time is running out. Climate reality shows it, science states it, and students and protesters around the globe express it with their strikes – acting now is the only possible solution to solve the climate crisis. The Paris Agreement and the Sustainable Development Goals (SDGs) can only be achieved with a worldwide transformation towards decarbonization. This insight refers to the civil movement for urgent action that is growing with increasing evidence of the risks involved with global climate change, and when it can be expected to make an impact.

29
increases the chances to reach the goal3. Nonetheless, social changes should be accompanied by changed policy measures to push systemic tipping.
There are empirical examples showing that in the social, economic, and technology realms small shares of population or users can change the dominant behavioural or norm patterns. Historical studies show that only 3.5% of the population is needed to be engaged in nonviolent resistance, even to topple brutal dictatorship8. In Germany, almost 1.5 million people participated in the Climate Strike on September 20. This is only 1.9% of the population, but never before have so many people demonstrated for better climate policy in this country. Research shows that the fraction of a population needed to adopt alternative behaviour to create system-level change is in a range between 21% (smallest successful minority) and 25% (the largest unsuccessful minority)9. Studies also show that civil resistance is more successful when using nonviolent than violent methods8,9.
Climate activism is a modern form of civil engagement that mobilizes many young people in activism, these often involve their own parents, which in turn participate in political processes. An analysis of the Fridays for Future (FFF) movement – an international, non-party, independent and decentral, organized, climate-strike movement, realizing climate change as the biggest threat to the human civilization – states that many of the members believe that their protests will cause change and that changing their own behaviour and consumption is relevant to fight climate change10. As consumption behaviour and households are responsible for 72% of greenhouse gas emissions, these are in theory important keys for reaching the Paris Agreement, shaping future emission pathways11. However, policy measures need to accompany behavioural change.
In the context of behavioural and normative change, more research is needed on what can unleash the needed behavioural changes and which lifestyle changes have the potential to spread exponentially
Protesters with signs demand that action be taken to address climate change. Millions of people around the world are taking part in the climate strikes to demand urgent action on the emergency (Photo: Rrodrickbeiler).

30
and at scale when supported by specific policy measures. Changes in the social norm system should not be underrated since they can have a strong influence on changes in policy, law, and governance. Environmental movements like FFF struggling to tip the social scale towards swift and concerted climate action, can be considered to be the consequence of a successful climate education that has become more present in school curriculums today than 20 years ago1,13. This illustrates that there is increasing understanding of climate change risks in at least some societal spheres.
Both the Paris Agreement and the UN Sustainable Development Goals (SDGs) require deep and long-term transformations that involve complementary actions by governments, business, social and natural sciences, and civil society. Transformations are the moments in history when the meta choices – the “choices about the choices” – are made and in which agents get involved in the collective process of designing the new institutional system. However, there are also examples of social movements initiated by supposed marginalized groups who can have a strong voice if they act collectively13. It is important to recognize the different dimensions of human agency. Individuals who act only as consumers are unlikely to change the system rules. The recognition of the strategic and political agency of individuals acting as citizens and members of societal groups is necessary in a democratic transformation process13.
Solving the climate crisis can be a chance for world leaders to join forces with citizen groups and grassroots organizations and work together to achieve a more just and equitable future14. By achieving change in six key areas – energy transformation, education, digital revolution, sustainable food, land agriculture, and oceans – the physical, biological, human, and managed systems of our planet can be sustainably maintained. The
six SDG transformations are necessary to achieve SDGs like (1) education, gender, and inequality; (2) health, well-being, and demography; (3) energy decarbonization and sustainable industry; (4) sustainable food, land, water, and oceans; (5) sustainable cities and communities; and (6) digital revolution for sustainable development. Each of these six transformations describes a major change in the organization of societal, political, and economic activities that transform resource use, institutions, technologies, and social relations to achieve key SDG outcomes15. Those transformations are needed to reach the Paris Agreement and the SDGs – they have the ultimate goal of enhancing human prosperity and reducing inequalities. The expansion of sustainability science is also necessary to guide the societal transformations that are needed to reach the SDGs. Integrated efforts of researchers, decision makers, policy specialists and civil society are required to design pathways for the transformations that lead to Paris and the SDGs.

31
References
Insight 11. Jackson, R. B. et al., ‘Global energy growth is outpacing
decarbonization’, Environ. Res. Lett, vol. 13, no. 12, 2018.2. Le Quéré, C. et al., ‘Global Carbon Budget 2018’. Earth Syst. Sci.
Data, Vol 10, pp. 2141–2194, 2018.3. Luderer, G. et al., ‘The Emission Gap’, in UNEP ‘Emissions Gap
Report 2018’, 2018, pp. 16–22.4. Global Carbon Project, ‘Global Carbon Atlas’, http://
globalcarbonatlas.org/en/CO2-emissions (accessed 31 October 2019).
5. Graver, B., K. Zhang and D. Rutherford, ‘CO2 emissions from commercial aviation, 2018’, The International Council on Clean Transportation, 2019.
6. International Maritime Organization, ‘Third IMO Greenhouse Gas Study 2014’, 2015, http://www.imo.org/en/OurWork/Environment/PollutionPrevention/AirPollution/Pages/Greenhouse-Gas-Studies-2014.aspx (accessed November 2019).
7. Cozzi, L., ‘Commentary: Growing preference for SUVs challenges emissions reductions in passenger car market’, IEA, 2019, https://www.iea.org/newsroom/news/2019/october/growing-preference-for-suvs-challenges-emissions-reductions-in-passenger-car-mark.html (accessed November 2019).
8. Global Energy Monitor, ‘Global Coal Plant Tracker’, https://endcoal.org/tracker (accessed 15 November 2019).
9. Tong, D. et al., ‘Committed emissions from existing energy infrastructure jeopardize 1.5°C climate target’, Nature, vol. 572, 2019, pp. 373–377.
10. Rogelj, J. et al., ‘Mitigation pathways compatible with 1.5°C in the context of sustainable development’, in IPCC ‘Global warming of 1.5 °C’, Masson-Delmotte, V. et al. (eds.), 2018.
11. IEEFA, ‘Over 100 Global Financial Institutions Are Exiting Coal, With More to Come’, 2019, http://ieefa.org/wp-content/uploads/2019/02/IEEFA-Report_100-and-counting_Coal-Exit_Feb-2019.pdf.
12. REN21, ‘Renewables 2019 Global Status Report’, chapter 1, 2019, https://www.ren21.net/gsr-2019/chapters/chapter_01/chapter_01/ (accessed 12 November 2019).
13. IRENA, ‘Statistics Time Series’, International Renewable Energy Agency, 2019, http://resourceirena.irena.org/gateway/dashboard/ (accessed 12 November 2019).
14. [Bloomberg data compiled by] Rainforest Action Network et al., ‘Banking on Climate Change: Fossil Fuel Finance Report Card 2019’, 2019, https://www.ran.org/wp-content/uploads/2019/03/Banking_on_Climate_Change_2019_vFINAL1.pdf (accessed November 2019).
15. OPEC, ‘2018 World Oil Outlook’, 2018.16. Arneth A. et al., Summary for Policymakers, in ‘Climate Change and
Land’, Intergovernmental Panel on Climate Change (IPCC), 201917. Turner, A. J. et al., ‘Interpreting contemporary trends in atmospheric
methane’, PNAS, vol. 116, no. 8, 2019, pp. 2805-2813.18. Heck, V. et al., ‘Biomass-based negative emissions difficult to
reconcile with planetary boundaries’, Nat. Clim. Change, vol. 8, no. 2, 2018, pp. 151–155.
19. Strefler, J. et al., ‘Towards net zero – Carbon dioxide removal and utilisation’, Energy Transition Hub, 2019.
20. Realmonte, G. et al., ‘An inter-model assessment of the role of direct air capture in deep mitigation pathways’, Nat. Commun., vol. 10, no. 3277, 2019.
21. Breyer, C. et al., ‘Direct Air Capture of CO2: A key technology for ambitious climate change mitigation’, Joule, vol. 3, no. 9, 2019, pp. 2053–2057.
22. Smith, P., et al., ‘Biophysical and economic limits to negative CO2 emissions, Nat. Clim. Change, vol. 6, 2016, pp. 42–50.
23. Hoegh-Guldberg. O., et al., ‘The Ocean as a Solution to Climate Change: Five Opportunities for Action’, World Resources Institute, 2019.
24. Grubler, A. et al., ‘A low energy demand scenario for meeting the 1.5° C target and sustainable development goals without negative emission technologies’. Nature Energy, vol. 3, 2018, pp. 515–527.
25. Van Vuuren, D. P. et al., ‘Alternative pathways to the 1.5° C target reduce the need for negative emission technologies’. Nat. Clim. Change, vol. 8, no. 5, 2018.
Insight 21. Kennedy, J. et al., ‘WMO Statement on the State of the Global
Climate in 2018’, World Meteorological Organization, no. 1233, 2019.2. WMO et al., ‘United In Science: High-level synthesis report of latest
climate science information convened by the Science Advisory Group of the UN Climate Action Summit 2019’, 2019.
3. Xu, Y., Ramanathan, V. and Victor, D. G., 'Global warming will happen faster than we think', Nature, vol. 564, no. 7734, 2018, pp. 30–32.
4. Bindoff, N. L.et al.‚ ‘Detection and Attribution of Climate Change: from Global to Regional’, in Stocker, T. F. et al. (eds.)‚ Climate Change 2013: The Physical Science Basis, Cambridge University Press, Cambridge, United Kingdom and New York, NY, USA.
5. Rhein, M. et al., ‘Observations: Ocean’, in Stocker, T. F. et al. (eds.)‚ Climate Change 2013: The Physical Science Basis, Cambridge University Press, Cambridge, United Kingdom and New York, NY, USA.
6. Chapter 1 In: IPCC, ‘Summary for Policymakers’, in Pörtner, H.-O. et al. (eds.) ‘The Ocean and Cryosphere in a Changing Climate’, 2019.
7. Oschlies, A. et al., ‘Drivers and mechanisms of ocean deoxygenation’, Nat. Geosci., vol. 11, no. 7, 2018.
8. Chapter 6 In: IPCC, ‘Summary for Policymakers’, in Pörtner, H.-O. et al. (eds.) ‘The Ocean and Cryosphere in a Changing Climate’, 2019.
9. Frölicher, T. L., and C. Laufkötter, ‘Emerging risks from marine heat waves’, Nat. Commun., vol. 9, no. 650, 2018.
10. Chapter 4 In: IPCC, ‘Summary for Policymakers’, in Pörtner, H.-O. et al. (eds.) ‘The Ocean and Cryosphere in a Changing Climate’, 2019.
11. Becker, M., M. Karpytchev and S. Lennartz-Sassinek, ‘Long-term sea level trends: Natural or anthropogenic?’, Geophys. Res. Lett., vol. 41, no. 15, 2014.
12. Dangendorf, S. et al., ‘Detecting anthropogenic footprints in sea level rise’, Nat. Commun., vol. 6, no. 7849, 2015.
13. Slangen, A. et al., ‘Anthropogenic forcing dominates global mean sea-level rise since 1970’, Nat. Clim. Change, vol. 6, no. 7, 2016, pp. 701–705.
14. Parkes, D. and B. Marzeion, ‘Twentieth-century contribution to sea-level rise from uncharted glaciers’, Nature, vol. 563, no. 7732, 2018.
15. Young, I. R. and A. Ribal, ‘Multiplatform evaluation of global trends in wind speed and wave height’, Science, vol. 364, no. 6440, 2019, pp. 548-552.
16. Rasmussen, D. J. et al., ‘Extreme sea level implications of 1.5 °C, 2.0 °C, and 2.5 °C temperature stabilization targets in the 21st and 22nd centuries’, Environ. Res. Lett., vol. 13, no. 034040, 2018.
17. Bamber, J. L. et al., ‘Ice sheet contributions to future sea-level rise from structured expert judgment’, PNAS, vol. 116, no. 23, 2019, pp. 11195-11200.

32
18. Vousdoukas, M. I. et al., ‘Understanding epistemic uncertainty in large-scale coastal flood risk assessment for present and future climates’, Nat. Hazards Earth Sys. Sci., vol.18, no. 8, 2018, pp. 2127–2142.
19. Garner, A. J. et al., ‘Impact of climate change on New York City’s coastal flood hazard: Increasing flood heights from the preindustrial to 2300 CE’, PNAS, vol. 114, no. 45, 2017, pp. 11861–11866.
20. Hoegh-Guldberg, O. et al., ‘Impacts of 1.5ºC Global Warming on Natural and Human Systems’, in Masson-Delmotte, V. et al. (eds.), ‘Global warming of 1.5 °C’, IPCC, 2018.
21. Slater, T. and A. Shepherd, ‘Antarctic ice losses tracking high’, Nat. Clim. Change, vol. 8, 2018, pp. 1025–1026.
22. Shepherd, A. et al., ‘Trends in Antarctic Ice Sheet Elevation and Mass’, Geophys. Res. Lett., vol. 46, no. 14, 2019, pp. 8174–8183.
23. Rignot, E. et al., ‘Four decades of Antarctic Ice Sheet mass balance from 1979–2017’. PNAS, January, vol. 116, no. 4, 2019, pp. 1095–1103.
24. Holland, P. R. et al., ‘West Antarctic ice loss influenced by internal climate variability and anthropogenic forcing’, Nat. Geosci., vol. 12, no. 9, 2019, pp. 718–724.
25. Chapter 3 In: IPCC, ‘Summary for Policymakers’, in Pörtner, H.-O. et al. (eds.) ‘The Ocean and Cryosphere in a Changing Climate’, 2019.
26. Bevis, M. et al., ‘Accelerating changes in ice mass within Greenland, and the ice sheet’s sensitivity to atmospheric forcing’, vol. 116, no. 6, 2019, pp. 1934–1939.
27. Notz, D. and J. Stroeve, ‘Observed Arctic sea-ice loss directly follows anthropogenic CO2 emission’, Science, vol. 354, no. 6313, 2016, pp. 717–750.
28. AMAP, ‘Snow, Water, Ice and Permafrost in the Arctic (SWIPA) 2017’, 2017.
29. Richter-Menge, J., M. O. Jeffries and E. Osborne (eds.), ‘The Arctic’, in ‘State of the Climate in 2017’, BAMS, vol. 99, no. 8, 2017, pp. 141–165.
30. Treharne, R. et al., ‘Arctic Browning: Impacts of Extreme Climatic Events on Heathland Ecosystem CO2 Fluxes’, Global Change Biology, vol. 25, no. 6, 2019.
31. Fletcher, S. E. M. and H. Schaefer, ‘Rising methane: A new climate challenge’, Science, vol. 364, no. 6444, 2013, p. 932–933.
32. Nisbet, E. G. et al., ‘Very strong atmospheric methane growth in the 4 years 2014–2017: Implications for the Paris Agreement’, Glob. Biogeochem. Cycles, vol. 33, no. 3, 2019, pp. 318–342.
33. Saunois, M. et al., ‘The Global Methane Budget 2000–2017’, Earth Syst. Sci. Data, in review, 2019.
34. Neukom, R. et al., ‘No evidence for globally coherent warm and cold periods over the preindustrial Common Era’. Nature, vol. 571, no. 7766, 2019, pp. 550–554.
35. Willeit, M. et al., 'Mid-Pleistocene transition in glacial cycles explained by declining CO2 and regolith removal'. Science Advances, vol. 5, no. 4, 2019, p. eaav7337.
36. Burke, K.D. et al., ‘Pliocene and Eocene provide best analogs for near-future climates’, PNAS, vol. 115, no. 52, 2018, pp. 13288-13293.
37. Zeebe, R. E., A. Ridgwell and J. C. Zachos, ‘Anthropogenic carbon release rate unprecedented during the past 66 million years’, Nat. Geosci., vol. 9, no. 4, 2016, pp. 325–329.
Insight 31. IPCC, ‘Chapter 2: High Mountain Areas’, in Pörtner, H.-O. et al. (eds.),
‘The Ocean and Cryosphere in a Changing Climate’, 2019.2. Zekollari, H., M. Huss and D. Farinotti, ‘Modelling the future
evolution of glaciers in the European Alps under the EURO-CORDEX RCM ensemble’, The Cryosphere, vol. 13, 2019, pp. 1125–1146.
3. SMD4GC, ‘Mountain Glaciers: Vanishing Sources of Water and Life’, in #VanishingGlaciers evidence-based communications campaign by the Sustainable Mountain Development for Global Change Program, 2019, http://www.mountainresearchinitiative.org/index.php/activities/communication-campaigns/vanishingglaciers, (accessed November 2019).
4. IPCC, ‘Summary for Policymakers’, in Pörtner, H.-O. et al. (eds.), ‘The Ocean and Cryosphere in a Changing Climate’, 2019.
5. Viviroli, D. et al., ‘Increasing dependence of lowland population on mountain water resources’, EarthArXiv, 2019.
6. Wester, P. et al. (eds.), The Hindu Kush Himalaya Assessment – Mountains, Climate Change, Sustainability and People, Springer, 2019.
7. Encalada, A. C. et al., ‘A global perspective on tropical montane rivers’. Science, vol. 365, no. 6458, 2019, pp. 1124–1129.
8. Steinbauer, M. J. et al., ‘Accelerated increase in plant species richness on mountain summits is linked to warming’, Nature, vol. 556, no. 7700, 2018, pp. 231–234.
9. Petriccione, B. and A. Bricca, ‘Thirty years of ecological research at the Gran Sasso d’Italia LTER site: Climate change in action’. Nat. Conserv., vol. 34, 2019, pp. 9–39.
10. Winkler, D. et al., ‘Responses of alpine plant communities to climate warming’, in Ecosystem Consequences of Soil Warming, Academic Press, 2019, pp. 297–346.
11. IPBES, ‘The regional assessment report on biodiversity and ecosystem services for Africa’, Archer, E. et al. (eds.), 2018.
12. Shrestha, U. B. and B. B. Shrestha, ‘Climate change amplifies plant invasion hotspots in Nepal’, Diversity and Distributions, vol. 25, no. 10, 2019, pp. 1599–1612.
13. Kidane, Y., M. J. Steinbauer and C. Beierkuhnlein, ‘Dead end for endemic plant species? A biodiversity hotspot under pressure’. Glob Ecol. Conserv., vol. 19, 2019, p. e00670.
14. Rumpf, S. B. et al., ‘Extinction debts and colonization credits of non-forest plants in the European Alps’. Nat. Commun., vol. 10, no. 4293, 2019.
15. Peters, M. K. et al., ‘Climate–land-use interactions shape tropical mountain biodiversity and ecosystem functions’, Nature, vol. 568, no. 7750, 2019, pp. 1–5.
16. Grêt-Regamey, A., S. Brunner and F. Kienast, ‘Mountain Ecosystem Services: Who Cares?’, Mt Res Dev, vol. 32, no. S1, 2012, pp. S23–S34.
17. Martín-López, B. et al., ‘Nature’s contributions to people in mountains: A review’. PLOS ONE, vol. 14, no. 6, 2019, p. e0217847.
18. Capitani, C. et al., ‘Views from two mountains: Exploring climate change impacts on traditional farming communities of eastern Africa highlands through participatory scenarios’, Sustain. Sci., vol. 14, no. 1, 2019, pp. 191-203.
19. Klein, J. A. et al., ‘Catalyzing transformations to sustainability in the world's mountains’, Earth's Future, vol. 7, 2019, pp. 547–557.
20. Grêt-Regamey, A., S. H. Huber and R. Huber, ‘Actors’ diversity and the resilience of social-ecological systems to global change’, Nat. Sustain., vol. 2, 2019, pp. 290–297.
21. IPBES, ‘Assessing progress towards meeting major international objectives related to nature and nature’s contributions to people’, in Brondizio, E. S et al. (eds.), ‘Global Assessment Report on Biodiversity and Ecosystem Services’, 2019.
Insight 41. IPBES, ‘Summary for Policymakers of the Global Assessment
Report on Biodiversity and Ecosystem Services’, Díaz, S. et al. (eds.), 2019.
2. FAO, ‘The State of the World’s Forests 2018: Forest pathways to sustainable development’, 2018.
3. Le Quéré, C. et al., ‘Global Carbon Budget 2018’, Earth Syst. Sci. Data, vol. 10, 2018, pp. 2141–2194.

33
4. Arneth A. et al., Summary for Policymakers, in ‘Climate Change and Land’, Intergovernmental Panel on Climate Change (IPCC), 2019
5. Prevedello, J.A., Winck, G.R., Weber, M.M., Nichols, E., Sinervo, B., ‘Impacts of forestation and deforestation on local temperature across the globe’, PLoS ONE 14(3): e0213368, 2019.
6. Pendrill, F. et al., ‘Agricultural and forestry trade drives large share of tropical deforestation emissions’, Glob. Environ. Change, vol. 56, 2019, pp. 1–10.
7. Ciais, P. et al., ‘Five decades of northern land carbon uptake revealed by the interhemispheric CO2 gradient’. Nature, vol. 568, no. 7751, 2019, pp. 221–225.
8. Andela, N. et al,. ‘The Global Fire Atlas of individual fire size, duration, speed and direction’, Earth Syst. Sci. Data, vol. 11, no. 2, 2019, pp. 529–552.
9. Palmer, P. I. et al., ‘Net carbon emissions from African biosphere dominate pan-tropical atmospheric CO2 signal’, Nat. Commun., vol. 10, no. 3344, 2019, pp. 1–9.
10. Global Fire Emissions Database, 2019, Fire Forecast Amazon Region, https://www.globalfiredata.org/forecast.html (accessed 1 October 2019).
11. Vadrevu, K.P. et al., ‘Trends in Vegetation fires in South and Southeast Asian Countries’. Sci. Rep., vol. 9, no. 7422, 2019.
12. Tan-Soo, J.-S. and S. K. Pattanayak, ‘Seeking natural capital projects: Forest fires, haze, and early-life exposure in Indonesia’, PNAS, vol. 116, no. 12, 2019, pp. 5239–5245.
13. Song, X.P. et al., ‘Global land change from 1982 to 2016’, Nature, vol. 560, 2018, pp. 639–643.
14. Pan, Y. et al., ‘A Large and Persistent Carbon Sink in the World’s Forests’, Science, vol. 333, no. 6045, 2011, pp. 988–993.
15. Bastos, A. et al., ‘Impact of the 2015/2016 El Nin terrestrial carbon cycle constrained by bottom-up and top-down approaches’, Phil. Trans. R. Soc., vol. 373, no. 20170304, 2018.
16. Arora, V.K. and J. R. Melton, ‘Reduction in global area burned and wildfire emissions since 1930s enhances carbon uptake by land’, Nat. Commun., vol. 9, no. 1326, 2018.
17. Körner, C., ‘A matter of tree longevity’, Science, vol. 355, no. 6330, 2017, p. 1141.
18. Büntgen, U. et al., ‘Limited capacity of tree growth to mitigate the global greenhouse effect under predicted warming’, Nat. Commun., vol. 10, no. 2171, 2019.
19. Fleischer, K. et al., ‘Amazon forest response to CO2 fertilization dependent on plant phosphorus acquisition’, Nat. Geosci., vol. 12, no. 9, 2019, pp. 736–741.
20. Gloor, M. et al., ‘ Intensification of the Amazon hydrological cycle over the last two decades’, Geophys. Res. Lett., vol. 40, 2013, pp. 1729–1733.
21. Zemp, D.C. et al., ‘Self-amplified Amazon forest loss due to vegetation-atmosphere feedbacks’, Nat. Commun., vol. 8, no. 14681, 2017.
22. Forkel, M. et al., ‘Emergent relationships with respect to burned area in global satellite observations and fire-enabled vegetation models’, Biogeosciences, vol. 16, 2019, pp. 57–76.
23. Allen, C., D. D. Breshears and N. G. McDowell, ‘On underestimation of global vulnerability to tree mortality and forest die-off from hotter drought in the Anthropocene’, Ecosphere, vol. 6(8), no. 129, 2015, pp. 1–55.
24. Gloor, E., ‘The fate of Amazonia’, Nat. Clim. Chang., vol. 9, 2019, pp. 355–356.
25. Aleixo, I. et al., ‘Amazonian rainforest tree mortality driven by climate and functional traits’, Nat. Clim. Change, vol. 9, no. 5, 2019, pp. 384–388.
26. Biedermann, P. H. W. et al., ‘Bark Beetle Population Dynamics in the Anthropocene’, Challenges and Solutions, vol. 34, no. 10, 2019, pp. 914–924.
27. Mezei, P. et al., ‘Potential Solar Radiation as a Driver for Bark Beetle Infestation on a Landscape’, Forests, vol. 10, no. 7, 2019, p. 604.
28. Griscom, B. W. et al., ‘Natural climate solutions’, PNAS, vol. 114, no. 44 2017, pp. 11645–11650.
29. Karasz, P., ‘Ethiopia Says It Planted Over 350 Million Trees in a Day, a Record’, The New York Times, 2019, July 30, https://www.nytimes.com/2019/07/30/world/africa/ethiopia-tree-planting-deforestation.html (accessed November 2019).
30. WWF, ‘Bhutan: Committed to Conservation’, 2019, https://www.worldwildlife.org/projects/bhutan-committed-to-conservation (accessed November 2019).
Insight 51. Herring S. C. et al., ‘Explaining extreme events of 2017 from a
climate perspective’. BAMS, vol. 100, no. 1, 2019.2. Du, H. et al., ‘Precipitation From Persistent Extremes is Increasing
in Most Regions and Globally’. Geophys. Res. Lett., vol. 46, no. 11, 2019, pp. 6041–6049.
3. Ortega, C. et al., ‘Extreme ENSO-driven torrential rainfalls at the southern edge of the Atacama Desert during the Late Holocene and their projection into the 21th (sic) century’, Glob. and Planet. Change, vol. 175, 2019, pp. 226–237.
4. Tong, S., et al., ‘Spatial and temporal variability in extreme temperature and precipitation events in Inner Mongolia (China) during 1960–2017’, Sci. Total Environ., vol. 649, 2019, pp. 75–89.
5. Chou, J. et al., ‘Regional temporal and spatial trends in drought and flood disasters in China and assessment of economic losses in recent years’, Sustainability, vol. 11, no. 1, 2019, pp. 1–17.
6. Hall, T. M. and J. P. Kossin, ‘Hurricane stalling along the North American coast and implications for rainfall’, Clim. Atmos. Sci., vol. 2, no.17, 2019, pp. 1–9.
7. Guerreiro, S. B. et al., ‘Detection of continental-scale intensification of hourly rainfall extremes’, Nat. Clim. Change, vol. 8, 2018, pp. 803–807.
8. Ribes, A. et al., ‘Observed increase in extreme daily rainfall in the French Mediterranean’, Clim. Dyn., vol. 52, no. 11, 2019, pp. 1095–1114.
9. Mitchell, D. et al., ‘The day the 2003 European heatwave record was broken’. Lancet Planet. Health, vol. 3, 2019, pp. e290–e292.
10. Petoukhov, V. et al., ‘Quasiresonant amplification of planetary waves and recent Northern Hemisphere weather extremes’, PNAS, vol. 110, no. 14, 2013, pp. 5336–5341.
11. Coumou, D. et al., ‘The influence of Arctic amplification on mid-latitude summer circulation’. Nat. Commun., vol. 9, no. 1, 2018, pp. 1–12.
12. Kornhuber, K. et al., ‘Extreme weather events in early summer 2018 connected by a recurrent hemispheric wave-7 pattern’, Environ. Res. Lett., vol. 14, no. 5, 2019, p. 054002.
13. Pfleiderer, P. et al., ‘Summer weather becomes more persistent in in a 2 ̊C World’, Nat. Clim. Change, vol. 9, no. 9, 2019, pp. 1–6.
14. Farquharson, L. M. et al., ‘Climate Change Drives Widespread and Rapid Thermokarst Development in Very Cold Permafrost in the Canadian High Arctic’, Geophys. Res. Lett., vol. 46, 2019, pp. 6681–6689.
15. Biskaborn, B. K. et al., ‘Permafrost is warming at a global scale’, Nat. Commun., vol. 10, no. 264, 2019, pp. 1–11.
16. Petoukhov, V. et al., ‘Alberta wildfire 2016: Apt contribution from anomalous planetary wave dynamics’, Sci. Rep., vol. 8, no. 12375, 2018, pp. 1–10.
17. Steffen, W. et al., ‘Trajectories of the Earth System in the Anthropocene’, PNAS, vol. 115, no. 33, 2018, pp. 8252–8259.
18. Depietri, Y., K. Dahal and T. McPhearson, ‘Multi-hazard risks in New York City’, Nat. Hazards Earth Syst. Sci., vol. 18, 2018, pp. 3363–3381.
34
19. Howarth, C. et al., ‘Improving resilience to hot weather in the UK: The role of communication, behaviour and social insights in policy interventions’, Environ. Sci, Policy, vol. 94, 2019, pp. 258–261.
20. Zscheischler, J. et al., ‘Future climate risk from compound events. Nat. Clim. Change, vol. 8, 2018, pp. 469–477.
21. Sarhadi, A. et al., ‘Multidimensional risk in a nonstationary climate: Joint probability of increasingly severe warm and dry conditions’, Sci. Adv., vol. 4, no. 11, 2018, p. eaau3487.
22. Kretschmer, M., J. Runge and D. Coumou, ‘Early prediction of extreme stratospheric polar vortex states based on causal precursors’, Geophys. Res. Lett., vol. 44, no. 16, 2017, pp. 8592–8600.
23. Boers, N. et al., ‘Complex networks reveal global pattern of extreme-rainfall teleconnections’, Nature, vol. 566, no. 7744, 2019, pp. 373–377.
24. Frölicher, T. L. and C. Laufkötter, ‘Emerging risks from marine heat waves’, Nat. Commun., vol. 9, no. 650, 2018.
25. Frölicher, T. L. et al., ‘Marine heatwaves under global warming’, Nature, vol. 560, no. 7718, 2018.
26. Seneviratne, S. I. et al., ‘The many possible climates from the Paris Agreement’s aim of 1.5 °c warming’, Nature, vol. 558, no. 7708, 2018, pp. 41–49.
Insight 61. IPBES, ‘Global Assessment Report on Biodiversity and Ecosystem
Services’, 2019.2. IPCC, ‘Summary for Policymakers’, in Pörtner, H.-O. et al. (eds.), ‘The
Ocean and Cryosphere in a Changing Climate’, 2019.3. Arneth A. et al., Summary for Policymakers, In: ‘Climate Change and
Land’, Intergovernmental Panel on Climate Change (IPCC), 2019.4. Nunez, S. et al., ‘Assessing the impacts of climate change on
biodiversity: is below 2 °C enough?’, Climatic Change, vol. 154, no. 3–4, 2019, pp. 351–365.
5. He, X. et al., ‘The Effects of Interaction between Climate Change and Land-Use/Cover Change on Biodiversity-Related Ecosystem Services’, Global challenges, vol. 3, no. 9, 2019.
6. Peters, M. K. et al. ‘Climate-Land-Use Interactions Shape Tropical Mountain Biodiversity and Ecosystem Functions’, Nature, vol. 568, no. 7750, 2019, pp. 88–92.
7. Hoffmann, S., S. D. H. Irl and C. Beierkuhnlein, ‘Predicted climate shifts within terrestrial protected areas worldwide’, Nat. Comm., vol. 10, no. 4787, 2019.
8. Scheffers, B. R. and G. Pecl, ‘Persecuting, protecting or ignoring biodiversity under climate change’, Nat. Clim. Chang., vol. 9, 2019, pp. 581–586.
9. Kroner R. E. G. et al., ‘The uncertain future of protected lands and waters’, Science, vol. 364, no. 6443, 2019, pp. 881–886.
10. Leggat, W. P. et al., ‘Rapid Coral Decay Is Associated with Marine Heatwave Mortality Events on Reefs’, Curr. Biol., vol. 29, no. 16, 2019, pp. 2723–2730.
11. Hughes, T. P. et al., ‘Global warming transforms coral reef assemblages’, Nature, vol. 556, no. 7701, 2018, pp. 492–496.
12. Rogers-Bennett, L. and C. A. Catton, ‘Marine heat wave and multiple stressors tip bull kelp forest to sea urchin barrens’, Sci. Rep., vol. 9, no. 15050, 2019.
13. Durant, J. M. et al., ‘Contrasting effects of rising temperatures on trophic interactions in marine ecosystems’, Sci. Rep., vol. 9, no. 15213, 2019.
14. Till, A. et al., ‘Fish die-offs are concurrent with thermal extremes in north temperate lakes’. Nat. Clim. Change, vol. 9, pp. 637–641.
15. Griscom B. W. et al. ‘Natural climate solutions’, PNAS, vol. 114, no. 44, 2017, pp. 11645–11650.
16. Griscom B. W. et al.‚ ‘We need both natural and energy solutions to stabilize our climate.’ Glob. Change Biol., vol. 25, no. 6, 2019, pp. 1889–1890.
17. Anderson C. M. et al., ‘Natural climate solutions are not enough.’ Science, vol. 363, no. 6430, 2019, pp. 933–934.
Insight 71. Ebi, K. L. and I. Loladze, ‘Elevated atmospheric CO2 concentrations
and climate change will affect our food’s quality and quantity’, Lancet Planet. Health, vol. 3, no. 7, 2019, pp. e283–e284.
2. FAO et al., ‘The state of food security and nutrition in the world: Building climate resilience for food security and nutrition’, 2018.
3. Golden, C. D. et al., ‘Fall in fish catch threatens human nutrition’. Nature, vol. 534, no. 7607, 2016, pp. 317–320.
4. Loladze, I., ‘Hidden shift of the ionome of plants exposed to elevated CO2 depletes minerals at the base of human nutrition’, eLife, vol. 3, 2014, p. e02245.
5. Myers, S. S. et al., ‘Increasing CO2 threatens human nutrition’, Nature, vol. 510, no. 7503, 2014, pp. 139–142.
6. Zhu, C. et al., ‘Carbon dioxide (CO2) levels this century will alter the protein, micronutrients, and vitamin content of rice grains with potential health consequences for the poorest rice-dependent countries’, Sci. Adv., vol. 4, no. 5, 2018, p. eaaq1012.
7. Arneth A. et al., Summary for Policymakers, in ‘Climate Change and Land’, Intergovernmental Panel on Climate Change (IPCC), 2019
8. Beach, R. H. et al., ‘Combining the effects of increased atmospheric carbon dioxide on protein, iron, and zinc availability and projected climate change on global diets: a modelling study’, Lancet Planet. Health, vol. 3, no. 7, 2019, pp. e307-e317.
9. Weyant, C. et al., ‘Anticipated burden and mitigation of carbon-dioxide-induced nutritional deficiencies and related diseases: a simulation modeling study’, PLOS Med., vol. 15, no. 7, 2018, p. e1002586.
10. Craine, J. M., A. Elmore and J. P. Angerer, ‘Long-term declines in nutritional quality for North American cattle’, Environ. Res. Lett., vol. 12, 2017, p. 044019.
11. Lotze, H. K. et al., ‘Global ensemble projections reveal trophic amplification of ocean biomass declines with climate change’, PNAS, vol. 116, no. 26, 2019, pp. 12907–12912.
12. Golden, C. D. et al., ‘Nutrition: Fall in fish catch threatens human health’, Nature, vol. 534, no. 7607, 2016, pp. 317–320.
13. Gbashi, S. et al., ‘The Socio-Economic Impact of Mycotoxin Contamination in Africa’, in Mycotoxins: Impact and Management Strategies, Patrick Berka Njobeh and Francois Stepman (eds.), IntechOpen, 2018.
14. Zhou, X. et al., ‘An integrated assessment of climate-affected long-term water availability and its impacts on energy security in the Ganges sub-basins’, APN Science Bulletin, vol. 9, no. 1, 2019.
Insight 81. Winsemius, H. C. et al., ‘Disaster risk, climate change, and poverty:
assessing the global exposure of poor people to floods and droughts’, Environ. Dev. Econ., vol. 23, no. 3, 2018, pp. 328–348.
2. Park, J. et al., ‘Households and heat stress: estimating the distributional consequences of climate change’, Environ. Dev. Econ., vol. 23, no. 3, 2018, pp. 349–368.
3. Hallegatte, S., M. Fay and E. B. Barbier, ‘Poverty and climate change: introduction’, Environ. Dev. Econ., vol. 23, no. 3, 2018, pp. 217–233.
4. Barbier, E. and J. Hochard, ‘The Impacts of Climate Change on the Poor in Disadvantaged Regions’, Rev. Environ. Econ. Pol., vol. 12, no. 1, 2018, pp. 26–47.

35
5. Hallegatte, S. et al., ‘Unbreakable: Building the Resilience of the Poor in the Face of Natural Disasters’, Climate Change and Development Series, World Bank, 2017.
6. Notre Dame Global Adaptation Initiative, ND-GAIN Country Index, https://gain.nd.edu/our-work/country-index/rankings/ (accessed 16 September 2019).
7. Byers, E. et al., ‘Global exposure and vulnerability to multi-sector development and climate change hotspots’, Environ. Res. Lett., vol 13. no. 5, 2018.
8. Hallegatte, S. et al., Shock Waves: Managing the Impacts of Climate Change on Poverty, Climate Change and Development Series, World Bank, 2016.
9. Global Commission on Adaptation, ‘Adapt Now: A Global Call for Leadership on Climate Resilience 2019’, https://gca.org/global-commission-on-adaptation/report (accessed October 2019).
10. Suárez-Orozco, M. (ed.), Humanitarianism and Mass Migration: Confronting the World Crisis, 1st ed., University of California Press, 2019.
11. IDMC, ‘GRID 2019: Global Report on Internal Displacement’, http://www.internal-displacement.org/sites/default/files/publications/documents/2019-IDMC-GRID.pdf (accessed October 2019).
12. Kulp, S. A. and B. H. Strauss, ‘New elevation data triples estimates of global vulnerability to sea level rise and coastal flooding’, Nat. Commun., vol. 10, no. 4844, 2019.
13. Bai, X. et al., ‘Six research priorities for cities and climate change’, Nature, vol. 555, no. 7694, 2018, pp. 23–25.
14. Meerow, S. et al., ‘Social equity in urban resilience planning’, Local Environment, vol. 24, no. 9, 2019.
15. Shi, L. et al., ‘Roadmap towards justice in urban climate adaptation research’, Nat. Clim. Change, vol. 6, 2016, pp. 131–137.
16. Anguelovski, I. et al., ‘Equity Impacts of Urban Land Use Planning for Climate Adaptation: Critical Perspectives from the Global North and South’, Journal of Planning Education and Research, vol. 36, no. 3, 2016, pp. 333–348.
17. UN, ‘The Sustainable Development Goals Report 2019’, 2019. https://unstats.un.org/sdgs/report/2019/ (accessed November 2019).
18. Rigaud, K. K. et al., ‘Groundswell: Preparing for Internal Climate Migration’, World Bank, 2018.
19. Climate Change recognized as a 'threat multiplier', UN Security Council debates its impact on peace, UN News, 25 January 2019. Accessed from https://news.un.org/en/story/2019/01/1031322
20. UNFCCC, ‘Report of the Task Force on Displacement’, 2018, https://unfccc.int/sites/default/files/resource/2018_TFD_report_17_Sep.pdf (accessed November 2019).
21. IOM, ‘The Global Compact for Safe, Orderly and Regular Migration’, 2018, https://www.iom.int/global-compact-migration (accessed November 2019).
22. Prabhakar, S. V. R. K., H. Scheyvens and Y. Takahashi, ‘Ecosystem-based Approaches in G20 Countries: Current Status and Priority Actions for Scaling Up’, IGES Discussion Paper, 2019.
23. Pelling, M. and M. Garschagen, ‘Put equity first in climate adaptation’, Nature, vol. 569, no. 7756, 2019, pp. 327–329.
Insight 91. UNDESA, ‘Accelerating SDG7 achievement: Policy briefs in support
of the first SDG7 review at the UN high-level political forum 2018’, 2018, https://sustainabledevelopment.un.org/content/documents/18041SDG7_Policy_Brief.pdf (accessed 31 October 2019).
2. Maestre-Andrés, S. et al, ‘Perceived fairness and public acceptability of carbon pricing: a review of the literature’, Climate Policy, vol. 19, no. 9, 2019, pp. 1186–1204.
3. Kirchner, M., J. Schmidt and S. Wehrle, ‘Exploiting Synergy of Carbon Pricing and other Policy Instruments for Deep Decarbonization’, Joule, vol. 3, no. 4, 2019, pp. 891–893.
4. Jagers, S. C., J. Martinsson and S. Matti, ‘The impact of compensatory measures on public support for carbon taxation: an experimental study in Sweden’, Climate Policy, vol. 19, no. 2, 2018, pp. 147–160.
5. Douenne, T. and A. Fabre, ‘Can We Reconcile French People with the Carbon Tax? Disentangling Beliefs from Preferences’, FAERE working paper, 2019.
6. Devine-Wright, P., J. Price and Z. Leviston, ‘My country or my planet? Exploring the influence of multiple place attachments and ideological beliefs upon climate change attitudes and opinions’, Glob. Environ. Change, vol. 30, 2015.
7. Bouzarovski, S., J. Frankowski and S. Tirado Herrero, ‘Low-Carbon Gentrification: When Climate Change Encounters Residential Displacement’, Int. J. Urban Reg. Res., vol. 42, no. 5, 2018.
8. Daniel, K. D., R. B. Litterman and G. Wagner, ‘Declining CO2 price paths’, PNAS, vol. 116, no. 42, 2019, pp. 20886–20891.
9. Motesharrei, S., J. Rivas and E. Kalnay, ‘Human and nature dynamics (HANDY): Modeling inequality and use of resources in the collapse or sustainability of societies’, Ecol. Econ., vol. 101, 2014, pp. 90–102.
10. Reckien, D. et al., ‘Climate change, equity and the Sustainable Development Goals: an urban perspective’, Environment and Urbanization, vol. 29, no. 1, 2017, pp. 159–182.
11. Pelling, M. and M. Garschagen, ‘Put equity first in climate adaptation’, Nature, vol. 569, no. 7756, 2019, pp. 327–329.
12. Ellis, E., ‘How should the risks of sea-level rise be shared?’, The Deep South, National Science Challenges, University of Otago, 2018.
13. IAP2, ‘IAP2’s Public Participation Spectrum’, http://ncdd.org/rc/wp-content/uploads/IAP2_Spectrum-768x569.png (accessed 31 October 2019).
14. Simon, K., G. Diprose and A. C. Thomas, ‘Community-led initiatives for climate adaptation and mitigation’, Kōtuitui: New Zealand Journal of Social Sciences Online, 2019.
15. New Zealand Productivity Commission, ‘Local government funding and financing: Draft report’, 2019, https://www.productivity.govt.nz/assets/Documents/faacf52aab/ProdCom_Draft-report_Local-government-funding-and-financing.pdf (accessed November 2019).
Insight 101. Hagedorn, G. et al., ‘Concerns of Young Protesters Are Justified’,
Science, vol. 364, no. 6436, 2019, pp. 139–140.2. Farmer, J. D. et al., ‘Sensitive Intervention Points in the Post-Carbon
Transition’, Science, vol. 364, no. 6436, 2019, pp. 132–134.3. Otto, I. M. et al., ‘Social tipping dynamics for stabilizing Earth’s
climate by 2050’, Geophys. Res. Abstracts, vol. 21, 2019, p. 18785.4. Nuttall, W., ‘Slaves to oil’. EPRG 0921, 2009, http://www.eprg.group.
cam.ac.uk/wp-content/uploads/2009/08/binder11.pdf (accessed 25 October 2019).
5. Simpson, P. and C. Hill, ‘Leadership, Spirituality and Complexity: Wilberforce and the Abolition of the Slave Trade’, in James, K. T. and J. Collins (eds.), Leadership Perspectives, Palgrave Macmillan UK, 2008, pp. 29–42.
6. Beck, E. L. et al., ‘The Women's Suffrage Movement’, Journal of Community Practice, vol. 11, no. 3, 2003, pp. 13–33.
7. Schmid, E., F. Sinabell and M. F. Hofreither, ‘Phasing out of environmentally harmful subsidies: Consequences of the 2003 CAP reform’, Ecol. Econ., vol. 60, 2007, pp. 596–604.
8. Chenoweth, E. and M. J. Stephan, Why Civil Resistance Works: The Strategic Logic of Nonviolent Conflict, Columbia University Press, 2012.
9. Centola, D. et al., ‘Experimental Evidence for Tipping Points in Social Convention’, Science, vol. 360, no. 6393, 2018, pp. 1116–1119.

36
10. Sommer, M. et al., ‘Fridays for Future. Profil, Entstehung und Perspektiven der Protestbewegung in Deutschland’, ipb working paper series, 2/2019.
11. Dubois, G. et al., ‘It Starts at Home? Climate Policies Targeting Household Consumption and Behavioral Decisions Are Key to Low-Carbon Futures’, Energy Research & Social Science, vol. 52, 2019, pp. 144–158.
12. Moser, S. C. and L. Dilling, ‘Toward the social tipping point: creating a climate for change’, in Moser S. C. and L. Dilling (eds.), Creating a Climate for Change: Communicating Climate Change and Facilitating Social Change, Cambridge University Press, 2007, pp. 491–516.
13. Otto, I. M. et al., ‘Human Agency in the Anthropocene’, Ecol. Econ., vol. 106463, 2019.
14. Otto, I.M. et al., ‘Social vulnerability to climate change: A review of concepts and evidence’, Reg. Environ. Change, vol. 17, no. 6, 2017.
15. Sachs, J. D. et al., ‘Six Transformations to Achieve the Sustainable Development Goals’, Nat. Sustain., vol. 2, 2019, pp. 805–814.

37
CreditsFuture Earth and The Earth League would like to thank the members of the editorial board, the corresponding and contributing authors, reviewers, and the secretariats for their contributions. The report was made with support from the Potsdam Institute for Climate Impact Research (PIK), Future Earth Health Knowledge-Action Network, Global Carbon Project (GCP), Global Mountain Biodiversity Assessment (GMBA) and Mountain Research Initiative (MRI).
Authors (besides those affiliated to Future Earth, The Earth League, and PIK) and reviewers have contributed to the report in their individual capacities. Their affiliations are only mentioned for identification purposes.
Editorial board
Corresponding author
Contributing authors
• Dr Josep Canadell, executive director, Global Carbon Project
• Prof. Kristie Ebi, director, Center for Health and the Global Environment (CHanGE), Rohm & Haas Endowed Professor in Public Health Sciences, University of Washington
• Prof. Dr Ottmar Edenhofer, director of the Mercator Research Institute on Global Commons and Climate Change, director of the Potsdam Institute for Climate Impact Research, professor at Technische Universität Berlin, and The Earth League
• Owen Gaffney, director of International media and strategy, Stockholm Resilience Centre
• Dr Erik Pihl, Future Earth
• Dr Carolina Adler, Mountain Research Initiative (MRI)
• Dr Tanja Blome, The Earth League• Prof. Kristie Ebi, University of Washington• Dr Sophie Hebden, European Space Agency
(ESA)/Future Earth• Lisa Jacobson, Future Earth• Dr Marcin P. Jarzebski, Future Earth• Claudia Köhler, Potsdam Institute for Climate
Impact Research• Dr Ria A. Lambino, Regional Centre for Future
Earth in Asia/Research Institute for Humanity & Nature
• Prof. Dr Johan Rockström, director of the Potsdam Institute for Climate Impact Research, co-chair of Future Earth Advisory Committee, and co-chair of The Earth League
• Prof. Joyashree Roy, Bangabandhu Chair Professor, Asian Institute of Technology
• Prof. Leena Srivastava, Deputy Director General for Science at the International Institute for Applied Systems Analysis, co-chair of Future Earth Advisory Committee, and The Earth League
• Dr Maria A. Martin, Potsdam Institute for Climate Impact Research
• Dr Davnah Payne, Global Mountain Biodiversity Assessment (GMBA)
• Dr Sebastian Sonntag, The Earth League• Prof. Simon Watts, Brighton Observatory of
Environment and Economics, and National University of Singapore
38
Reviewers
• Dr Carolina Adler, Mountain Research Initiative (MRI)
• Md. Arfanuzzaman, Food and Agriculture Organization of the United Nations
• Prof. Xuemei Bai, Australian National University• Prof. Govindasamy Bala, Indian Institute of
Science• Dr Ana Bastos, Ludwig-Maximilians University• Dr Aliyu Barau, Bayero University Kano• Dr Annette Bolton, Institute of Environmental
Science and Research Ltd (ESR)• Dr P. Ciais, Laboratoire des Sciences du Climat et
de l’Environnement• Prof. Dr. Felix Creutzig, Mercator Research
Institute on Global Commons and Climate Change, and Technical University Berlin
• Dr Alessandra Conversi, National Research Council of Italy (CNR)
• Dr Alex Godoy-Faúndez, CiSGER, Universidad del Desarrollo
• Ingo Fetzer, Stockholm Resilience Centre and Bolin Center for Climate Research
• Dr Gabriel Filippelli, Indiana University• Dr Mayra E. Gavito, Universidad Nacional
Autónoma de México• Dr Mukesh Gupta, Asian University for Women• Prof. Sir Brian Hoskins, Grantham Institute for
Climate Change, The Earth League• Dr Mercy Ijenyo, Dalhousie University• Dr Michela Izzo, Guakía Ambiente• Prof. Samuel Jaccard, University of Bern• Prof. Daniela Jacob, Climate Service Center
Germany (GERICS), Helmholtz-Zentrum Geesthacht, and The Earth League
• Dr Joni Jupesta, Sinarmas Agribusiness and Food• Dr Aino Kulonen, Mountain Research Initiative
(MRI)• Dr Sigrid Kusch-Brandt, University of Padua • Prof. Tim Lenton, Global Systems Institute,
University of Exeter, The Earth League • Prof. Sebastian Leuzinger, Auckland University of
Technology• Dr Brantley Liddle, Energy Studies Institute,
National University Singapore
• Dr Michelle Lim, Adelaide Law School, University of Adelaide
• Prof. Shaun Lovejoy, McGill University• Prof. Wolfgang Lucht, Potsdam Institute for
Climate Impact Research, Humboldt University Berlin
• Dr Pamela McElwee, Rutgers University• Dr Lisa A. Miller, Institute of Ocean Sciences at
Fisheries and Oceans Canada• Dr Mostafa M. Naser, Edith Cowan University
(ECU)• Dr Karachepone N. Ninan, Centre for Economics,
Environment and Society• Dr Martin Obermaier, GOPA and ECO• Dr Yuko Ogawa Onishi, Regional Centre for
Future Earth in Asia/Research Institute for Humanity and Nature
• Dr Geir Ottersen, Institute of Marine Research (in Norway)
• Dr Davnah Payne, Global Mountain Biodiversity Assessment (GMBA)
• Dr Colin Quinn, United States Agency for International Development (USAID)
• Prof. Veerabhadran Ramanathan, University of California at San Diego, and The Earth League
• Prof. Thomas Reuter, University of Melbourne, and World Academy of Arts and Science
• Prof. Peter Schlosser, Global Futures Laboratory, ASU, and co-chair of The Earth League
• Dr. Jane Singer, Kyoto University• Prof. Kazuhiko Takeuchi, Institute for Global
Environmental Strategies, The Earth League• Dr Pedro Henrique Campello Torres, Institute of
Energy and Environment, University of São Paulo• Dr Chadia Wannous, Towards A Safer World
Network, and Future Earth One Health project• Prof. Simon Watts, Brighton Observatory of
Environment and Economics, and National University of Singapore
• Dr Charlie Wilson, Tyndall Centre for Climate Change Research
• Dr Ibouraïma Yabi: LACEEDE, DGAT, and Univ. of Abomey-Calavi
• Dr Anna M. Zivian, Ocean Conservancy/Ocean KAN Development Team

G LOBA L C A R BONp r o j e c t
Future Earth Health Knowledge-Action Network
Future Earth is governed by the International Science Council (ISC), Belmont Forum of funding agencies, the United Nations Educational, Scientific, and Cultural Organization (UNESCO), the United Nations Environment Programme (UNEP), the United Nations University (UNU), the World Meteorological Organization, and the Science and Technology in Society (STS) forum.