New Horizon - NADO · New Horizon: Comprehensive ... Keith Kahnt, White City Council Joe Kormanik,...
44
Education, Entrepreneurship & Environment in the Flint Hills New Horizon: Comprehensive Economic Development Strategy Flint Hills Economic Development District Photo by Brad Mangas bradmangasphoto.com
Transcript of New Horizon - NADO · New Horizon: Comprehensive ... Keith Kahnt, White City Council Joe Kormanik,...

Education, Entrepreneurship & Environment in the Flint Hills
New Horizon:
Comprehensive Economic Development StrategyFlint Hills Economic Development District
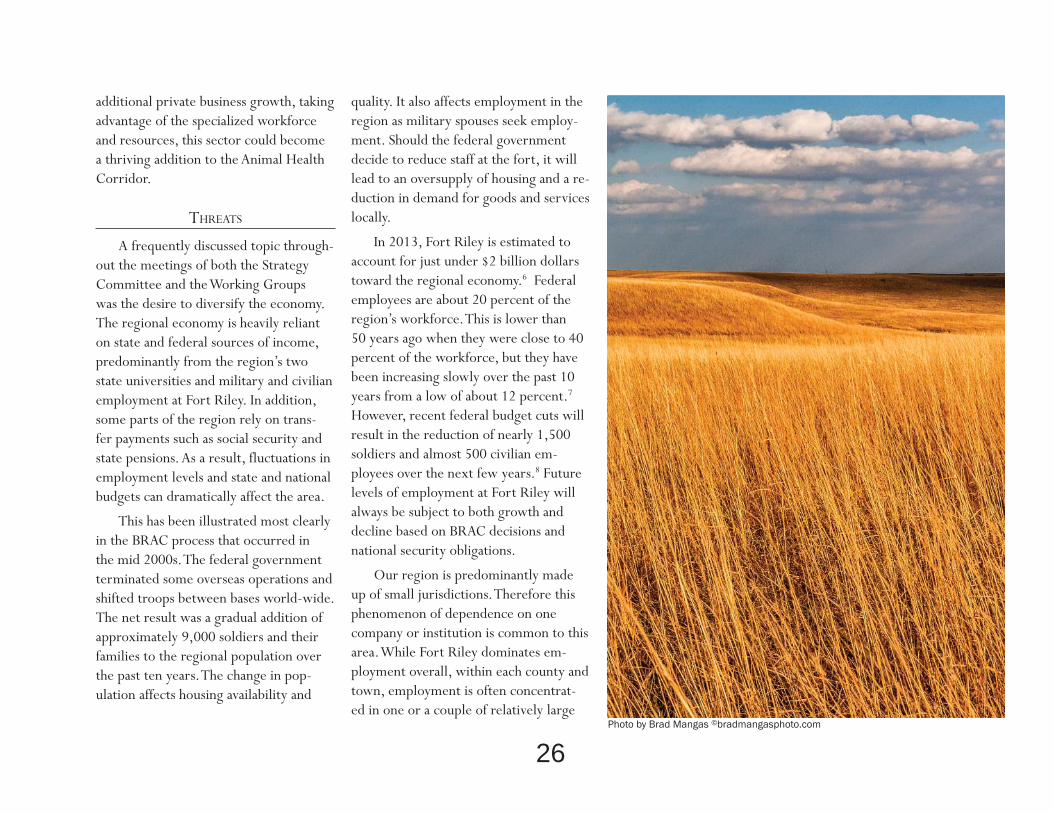
Photo by Brad Mangas bradmangasphoto.com
FLINT HILLS REGIONAL COUNCIL BOARD
Cecil Aska, Mayor, Junction CityDonna Baer, Randolph City CouncilBen Bennett, Geary County Commissioner /
FHRC PresidentBoyd Bennett, Abilene City CouncilRobert Boyd, Riley County CommissionerDan Deiter, Alma City CouncilVic Enns, Wamego City Council / At-Large Member of
FHRC Executive CommitteeHoney Grant, Grandview Plaza City Council /
FHRC TreasurerStan Hartwich, Pottawatomie County Commissioner /
FHRC SecretaryVernon Hay, Chair, Morris County /
FHRC Past-PresidentRick Jankovich, Manhattan City Council / At-Large
Member of FHRC Executive CommitteeGalen Johnson, Mayor, Dwight City Mike Johnson, Mayor, LeonardvilleKeith Kahnt, White City CouncilJoe Kormanik, Alta Vista City CouncilMarySue Roller, Woodbine City CouncilDebi Schwerdtfeger, Council Grove City CouncilDavid Shover, II, City of Riley / FHRC Vice-PresidentJimmy Thatcher, Mayor, Clay CenterPhil Weishaar, Mayor, Chapman
Advisory MembersJohn Armbrust, Governor’s Military Council Jackie Hartman, Kansas State University Linda S. Hoeffner, Fort Riley, Department of the Army
FLINT HILLS ECONOMIC DEVELOPMENT DISTRICT
Bruce McMillan, Chair, Architect, Manhattan
Geary CountyCecil Aska, Mayor, Junction CityBen Bennett, County CommissionerKate Watson, retired, Junction CitySusan Jagerson, Economic Development Specialist, Junction
City Chamber of Commerce
Morris CountyDebbie Adcock, Executive Director, Council Grove/Morris
County Chamber of Commerce and TourismC. Kay Hutchinson, Executive Director, Greater Morris
County Economic Development, Council GroveAngela Schwerdtfeger, Public Relations, Tri-County
Telephone, Council GroveMiki White-Bowman, Vice President, Farmers & Drovers
Bank, Council Grove
Pottawatomie CountyBob Cole, Director, County Economic DevelopmentScott Kohl, Director, Wamego Center-Highland Community
College
Riley CountyDeb Rodenbaugh-Schaub & Jo Brunner, Directors, Kansas
Workforce Center, Manhattan/Junction CityJohn Pagen, Director, Manhattan Economic DevelopmentLisa A. Sisley, Principal, New Boston Creative Group
Wabaunsee CountyAbby Amick, Executive Director, Wabaunsee County
Economic Development Bob Bennett, Farmer & Rancher, Alta VistaBud Hund, District 1 Economic Development Commission
Chase CountySuzan Barnes, Owner, Grand Central Hotel, Cottonwood
Falls Charles Rayl, Attorney, Cottonwood Falls
Lyon CountyDave Emig, AIA, Emig and Associates, ArchitectsCasey Woods, Executive Director, Emporia Main Street
Program
Fort RileyJohn Seitz, Military Affairs Director, Junction City
Kansas State UniversityBarbara Anderson, College of Human Ecology
Emporia State UniversityJim Hoy, Department of English
Thanks to community members who participated in the Working Groups and who commented on the Draft CEDS.
StaffWilliam J. Clark, Executive Director
Jeff Adams, Regional Planner; Gary Stith, Assistant PlannerConsultant
Katherine Nesse, PhD, Kansas State UniversityPhotos
Brad Mangas
Flint Hills Regional Council885 Marshall Loop, Fort Riley, Kansas 66442855-785-FHRC • www.flinthillsregion.org
Citizen Strategy Committee Members
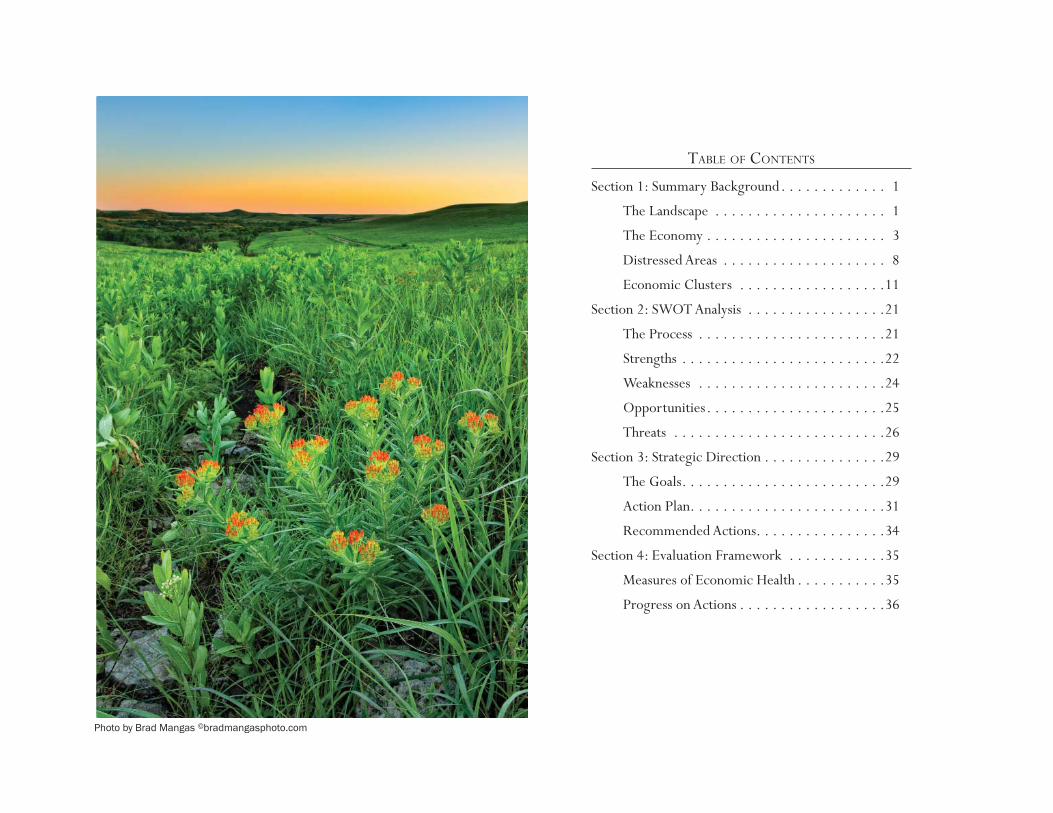
TABLE OF CONTENTS
Section 1: Summary Background . . . . . . . . . . . . . 1
The Landscape . . . . . . . . . . . . . . . . . . . . . 1
The Economy . . . . . . . . . . . . . . . . . . . . . . 3
Distressed Areas . . . . . . . . . . . . . . . . . . . . 8
Economic Clusters . . . . . . . . . . . . . . . . . .11
Section 2: SWOT Analysis . . . . . . . . . . . . . . . . .21
The Process . . . . . . . . . . . . . . . . . . . . . . .21
Strengths . . . . . . . . . . . . . . . . . . . . . . . . .22
Weaknesses . . . . . . . . . . . . . . . . . . . . . . .24
Opportunities . . . . . . . . . . . . . . . . . . . . . .25
Threats . . . . . . . . . . . . . . . . . . . . . . . . . .26
Section 3: Strategic Direction . . . . . . . . . . . . . . .29
The Goals . . . . . . . . . . . . . . . . . . . . . . . . .29
Action Plan . . . . . . . . . . . . . . . . . . . . . . . .31
Recommended Actions. . . . . . . . . . . . . . . .34
Section 4: Evaluation Framework . . . . . . . . . . . .35
Measures of Economic Health . . . . . . . . . . .35
Progress on Actions . . . . . . . . . . . . . . . . . .36
Photo by Brad Mangas bradmangasphoto.com
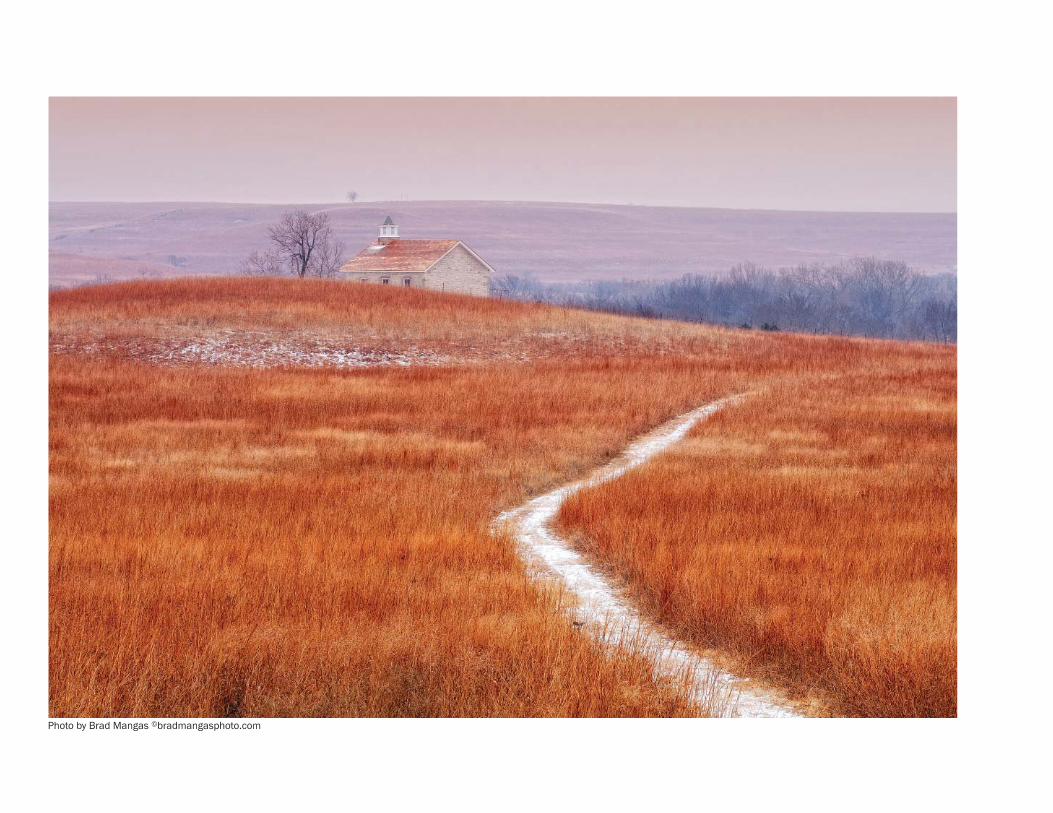
Photo by Brad Mangas bradmangasphoto.com
The people of the Flint Hills rec-ognize that to accomplish anything within these rocky swells we must work together. Matching strength with vulnerability, our collaboration assists us in overcoming the diversity that marks this area. We benefit from the presence of venerable institutions but we aim to diversify by promoting entrepreneurship and supporting small businesses.
Industries. Three industries have been central to this region since its settlement and continue to be the drivers of our economy:
• Beef Cattle• Education• Military
Beef cattle are the primary indus-try in Chase, Morris, and Wabaunsee counties. The grassy hills continue to be ideal grazing grounds for cattle.
The Education sector is dominat-ed by Kansas State University (Man-hattan) and Emporia State University (Emporia). They have drawn institu-tions to the area and inspired excel-lence in other areas of education.
The military cluster is rooted in Fort Riley, north of Junction City. The fort is one of the main economic
engines for the Flint Hills, with an economic impact upwards of $2 bil-lion per year. The fort is also the larg-est employer in the state of Kansas.
With such a large impact coming from government and quasi-gov-ernmental organizations, economic diversification is necessary for the future of the region. We are building on four new industries in the region:
• Tourism• Retirement Destination• Manufacturing• High-Tech Agriculture
These emerging industries connect with our existing strengths: agriculture and our nationally signif-icant history draw tourists; retirees are attracted by the opportunities created through the presence of local institutions and the quality of life; manufacturing is diversifying and
developing new niches, and high-tech agriculture is developing around the construction of the National Bio and Agro-Defense Facility at Kansas State University.
Distressed Areas. Based on population change, median income and housing affordability, we have identified areas of distress in the region. The rural parts of the re-gion are also experiencing an aging population that may soon lead to depopulation as residents need to move closer to services. Additionally, our growing urban areas face housing affordability issues.
Action Plan. Our primary strengths include the natural en-vironment, our social connections and our intellectual knowledge. The most significant threats we face are: the region’s dependence on external
institutions, particularly public sector employment in urban areas and So-cial Security in rural areas; the aging and decline in population in the rural parts of the region; and the growing urban-rural divide.
In our tradition of collaboration, we plan to reduce these threats by building upon our strengths. We pro-pose nine actions over the course of the coming five years that will move us toward accomplishing our vision for the region:
• Create regional branding• Create a marketing strategy• Identify workforce training
needs• Initiate a Tallgrass Entrepre-
neurship education curriculum• Expand transportation options
in our region• Streamline the business attrac-
tion and retention process• Create a Welcome Center• Create a site selection tool• Establish Flint Hills High Five
We have much to do. We know these goals are not possible without the enthusiasm, support and aid of many people and organizations. To move forward, our overriding action must be to collaborate.
Executive SummaryA highly educated populace,
working in an evolving, knowledge-based economy, living in the rich heritage of the
Flint Hills ecosystem.
THE LANDSCAPE
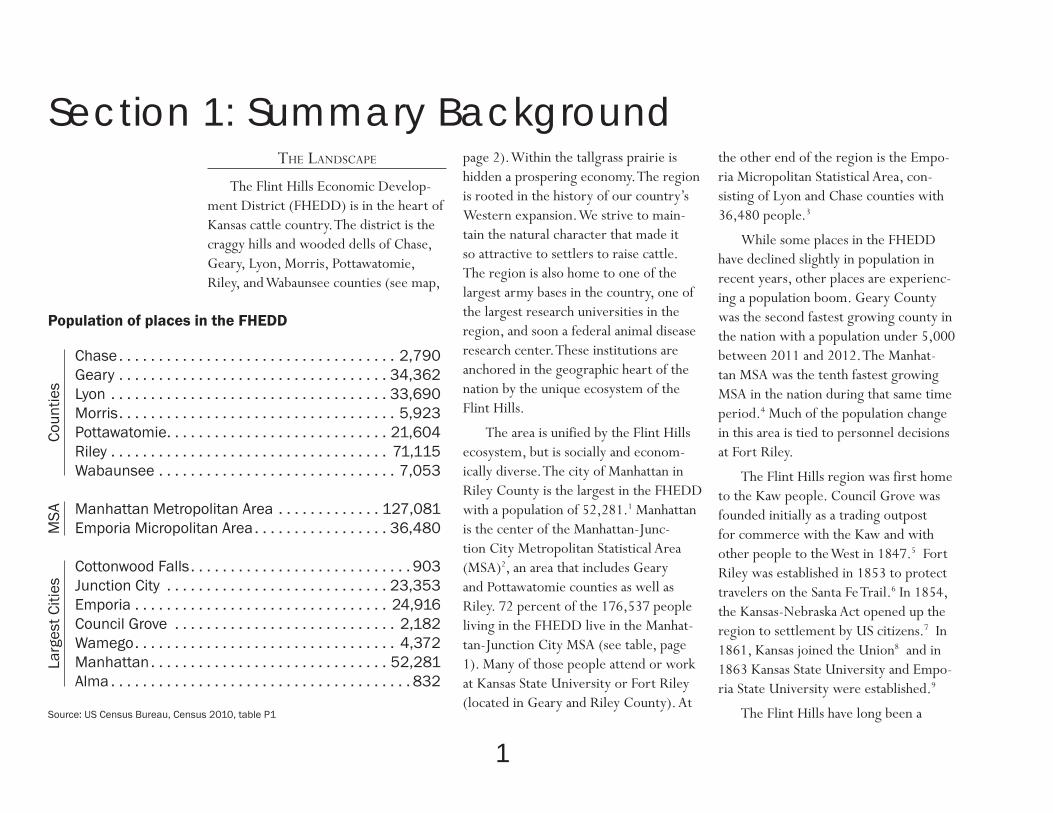
The Flint Hills Economic Develop-ment District (FHEDD) is in the heart of Kansas cattle country. The district is the craggy hills and wooded dells of Chase, Geary, Lyon, Morris, Pottawatomie, Riley, and Wabaunsee counties (see map,
page 2). Within the tallgrass prairie is hidden a prospering economy. The region is rooted in the history of our country’s Western expansion. We strive to main-tain the natural character that made it so attractive to settlers to raise cattle. The region is also home to one of the largest army bases in the country, one of the largest research universities in the region, and soon a federal animal disease research center. These institutions are anchored in the geographic heart of the nation by the unique ecosystem of the Flint Hills.
The area is unified by the Flint Hills ecosystem, but is socially and econom-ically diverse. The city of Manhattan in Riley County is the largest in the FHEDD with a population of 52,281.1 Manhattan is the center of the Manhattan-Junc-tion City Metropolitan Statistical Area (MSA)2, an area that includes Geary and Pottawatomie counties as well as Riley. 72 percent of the 176,537 people living in the FHEDD live in the Manhat-tan-Junction City MSA (see table, page 1). Many of those people attend or work at Kansas State University or Fort Riley (located in Geary and Riley County). At
the other end of the region is the Empo-ria Micropolitan Statistical Area, con-sisting of Lyon and Chase counties with 36,480 people.3
While some places in the FHEDD have declined slightly in population in recent years, other places are experienc-ing a population boom. Geary County was the second fastest growing county in the nation with a population under 5,000 between 2011 and 2012. The Manhat-tan MSA was the tenth fastest growing MSA in the nation during that same time period.4 Much of the population change in this area is tied to personnel decisions at Fort Riley.
The Flint Hills region was first home to the Kaw people. Council Grove was founded initially as a trading outpost for commerce with the Kaw and with other people to the West in 1847.5 Fort Riley was established in 1853 to protect travelers on the Santa Fe Trail.6 In 1854, the Kansas-Nebraska Act opened up the region to settlement by US citizens.7 In 1861, Kansas joined the Union8 and in 1863 Kansas State University and Empo-ria State University were established.9
The Flint Hills have long been a
Section 1: Summary Background
1
Population of places in the FHEDD
Chase . . . . . . . . . . . . . . . . . . . . . . . . . . . . . . . . . . . 2,790Geary . . . . . . . . . . . . . . . . . . . . . . . . . . . . . . . . . . 34,362Lyon . . . . . . . . . . . . . . . . . . . . . . . . . . . . . . . . . . . 33,690Morris. . . . . . . . . . . . . . . . . . . . . . . . . . . . . . . . . . . 5,923Pottawatomie. . . . . . . . . . . . . . . . . . . . . . . . . . . . 21,604Riley . . . . . . . . . . . . . . . . . . . . . . . . . . . . . . . . . . . 71,115Wabaunsee . . . . . . . . . . . . . . . . . . . . . . . . . . . . . . 7,053
Manhattan Metropolitan Area . . . . . . . . . . . . . 127,081Emporia Micropolitan Area . . . . . . . . . . . . . . . . . 36,480
Cottonwood Falls . . . . . . . . . . . . . . . . . . . . . . . . . . . . 903Junction City . . . . . . . . . . . . . . . . . . . . . . . . . . . . 23,353Emporia . . . . . . . . . . . . . . . . . . . . . . . . . . . . . . . . 24,916Council Grove . . . . . . . . . . . . . . . . . . . . . . . . . . . . 2,182Wamego. . . . . . . . . . . . . . . . . . . . . . . . . . . . . . . . . 4,372Manhattan . . . . . . . . . . . . . . . . . . . . . . . . . . . . . . 52,281Alma . . . . . . . . . . . . . . . . . . . . . . . . . . . . . . . . . . . . . . 832
Source: US Census Bureau, Census 2010, table P1
Coun
ties
Larg
est C
ities
MSA
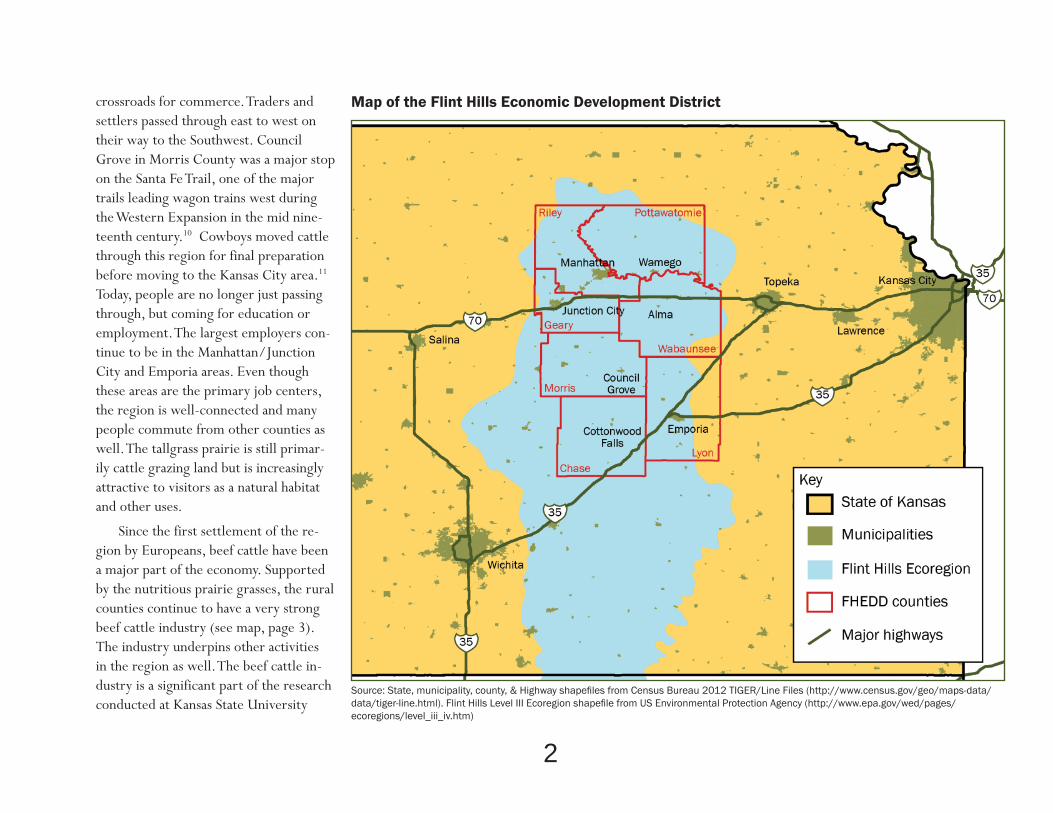
crossroads for commerce. Traders and settlers passed through east to west on their way to the Southwest. Council Grove in Morris County was a major stop on the Santa Fe Trail, one of the major trails leading wagon trains west during the Western Expansion in the mid nine-teenth century.10 Cowboys moved cattle through this region for final preparation before moving to the Kansas City area.11 Today, people are no longer just passing through, but coming for education or employment. The largest employers con-tinue to be in the Manhattan/Junction City and Emporia areas. Even though these areas are the primary job centers, the region is well-connected and many people commute from other counties as well. The tallgrass prairie is still primar-ily cattle grazing land but is increasingly attractive to visitors as a natural habitat and other uses.
Since the first settlement of the re-gion by Europeans, beef cattle have been a major part of the economy. Supported by the nutritious prairie grasses, the rural counties continue to have a very strong beef cattle industry (see map, page 3). The industry underpins other activities in the region as well. The beef cattle in-dustry is a significant part of the research conducted at Kansas State University
2
Source: State, municipality, county, & Highway shapefi les from Census Bureau 2012 TIGER/Line Files (http://www.census.gov/geo/maps-data/data/tiger-line.html). Flint Hills Level III Ecoregion shapefi le from US Environmental Protection Agency (http://www.epa.gov/wed/pages/ecoregions/level_iii_iv.htm)
Map of the Flint Hills Economic Development District
and is one of the reasons that the federal government chose to move the National Bio and Agro-Defense Facility (NBAF) to the area.
The FHEDD is served by the Flint Hills Regional Council (FHRC), a volun-tary association of local governments in Kansas. These governments are a part of the Flint Hills Ecosystem that extends the length of Kansas and covers 17 counties in the state and 2 counties in Oklahoma. The Flint Hills Ecosystem was delineat-ed by the US Environmental Protection Agency.12
THE ECONOMY
The counties have historically been unified by the economic activity of the area: by the trade and travel associated with the Santa Fe Trail and by the move-ment of the cattle and cowboys from Tex-as to Kansas City. This regional heritage has helped the region work cooperatively in many different capacities. Some of the most successful collaborations are the FHRC, regional emergency manage-ment planning, and the Tallgrass Legacy Alliance.
This regional awareness is heightened by the mobility of FHEDD residents. Many people commute between coun-
ties for work and some commute from places outside the 7-county FHEDD. In addition to commuting, many residents are temporary. They have come here for an education or for military service. The impact of the area extends far beyond the borders of the FHEDD as graduates and veterans move away after their education and service and service is completed.
While regionally aware, not all places in the area experience the same social and economic circumstances. The entire region is dependent on the federal and state governments either for employment or for transfer payments. While unified by a desire to diversify the economy, the experience of a place relying on Social Security payments is much different than a place relying on the employment of soldiers. This highlights the second contradiction, that of age: the difference in the demographics of rural and urban residents is striking.
The three primary industries, cattle, military and higher education, dominate the local economies within the area. While they are interdependent, the needs of the three sectors often differ and may at times conflict. Every place in the region has a different combination of the three which affects priorities and oppor-tunities.
Regional Cooperation. The FHRC, an organization central to many regional efforts in the Flint Hills, was
3
Regional Cooperation
Flint Hills Regional Council
Flint Hills Metropolitan Planning Organization
Flint Hills Tourism Coalition
Governor’s Flint Hills Working Group
Fort Riley Emergency Management Planning
Tallgrass Legacy Alliance
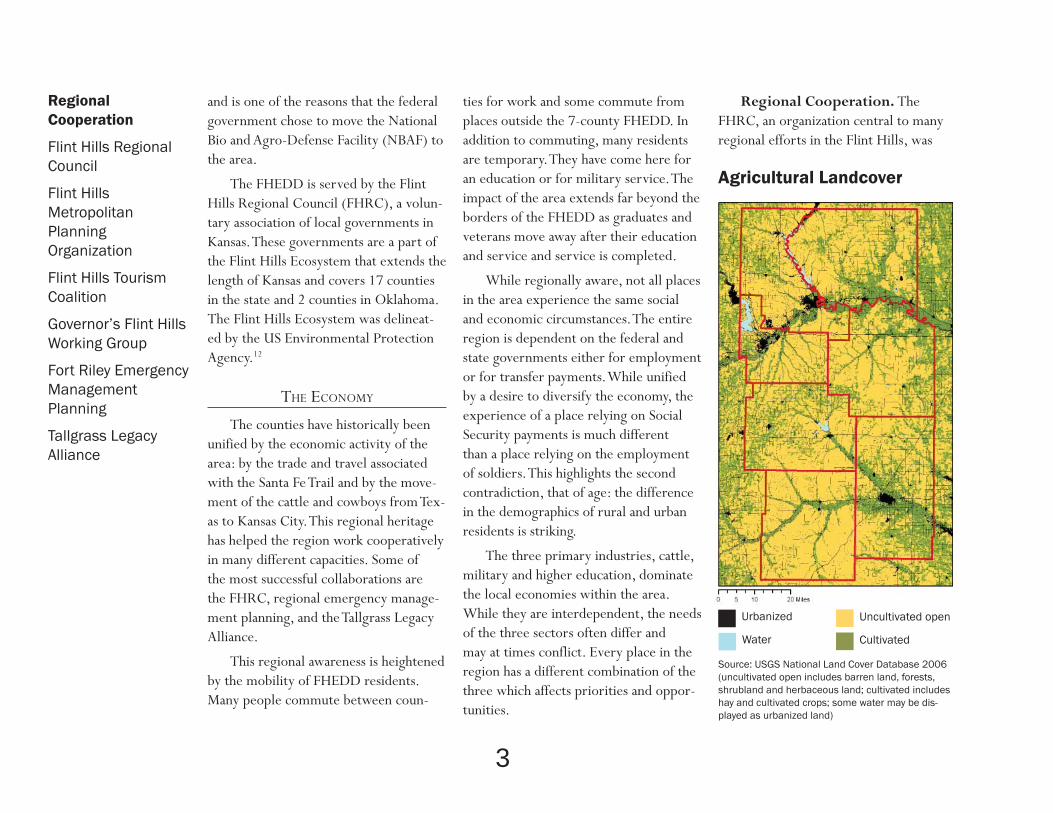
Agricultural Landcover
Urbanized Uncultivated open
CultivatedWater
Source: USGS National Land Cover Database 2006 (uncultivated open includes barren land, forests, shrubland and herbaceous land; cultivated includes hay and cultivated crops; some water may be dis-played as urbanized land)
formed in 2010 and has come to include 17 municipalities, 6 counties and 3 re-gional institutions. The Regional Council is not identical to the FHEDD (Wabaun-see County is not currently members of the Regional Council), but there is substantial overlap in membership. The participating governments recognize an advantage to sharing technical resources, partnering on community development initiatives and consulting on long range planning. The council was instrumental in bringing the counties to the table to form the FHEDD and organized the planning process. This kind of regional cooperation helps each individual local government plan for the future in a more holistic and interconnected way.
Regional cooperation can also be
found in the recently formed Flint Hills Metropolitan Planning Organization, which handles transportation planning for a large portion of the Geary County, Riley County and Pottawatomie County Metropolitan Statistical Area. It can also be found in organizations as diverse as the Flint Hills Tourism Coalition and the Governor’s Flint Hills Work Group.
The regional interdependence is also reflected in the emergency management planning headed by Fort Riley. Disasters, both natural and man-made, rarely con-fine themselves to political boundaries. Fort Riley has taken the lead in organiz-ing disaster response for the region. They regularly carry out simulations to prac-tice responses to different disasters and to identify areas for future improvement
and cooperation.13 Two recent exercise scenarios were a helicopter crash fol-lowed by a wildfire outbreak on the prai-rie and a tornado touchdown in Junction City and Ogden/Camp Funston. Fort Riley emergency managers coordinated with almost 20 organizations in the Flint Hills to carry out hands-on exercises.14
The Tallgrass Prairie National Preserve and the Konza Prairie Biolog-ical Station are central to the vitality of the region. Serving as educational and tourist destinations, these institutions bridge many of the gaps between private and public concerns that can serve as a template for growth in the region. The Nature Conservancy’s Tallgrass Lega-cy Alliance, serves as a partnership to protect the rich tallgrass legacy, through
4
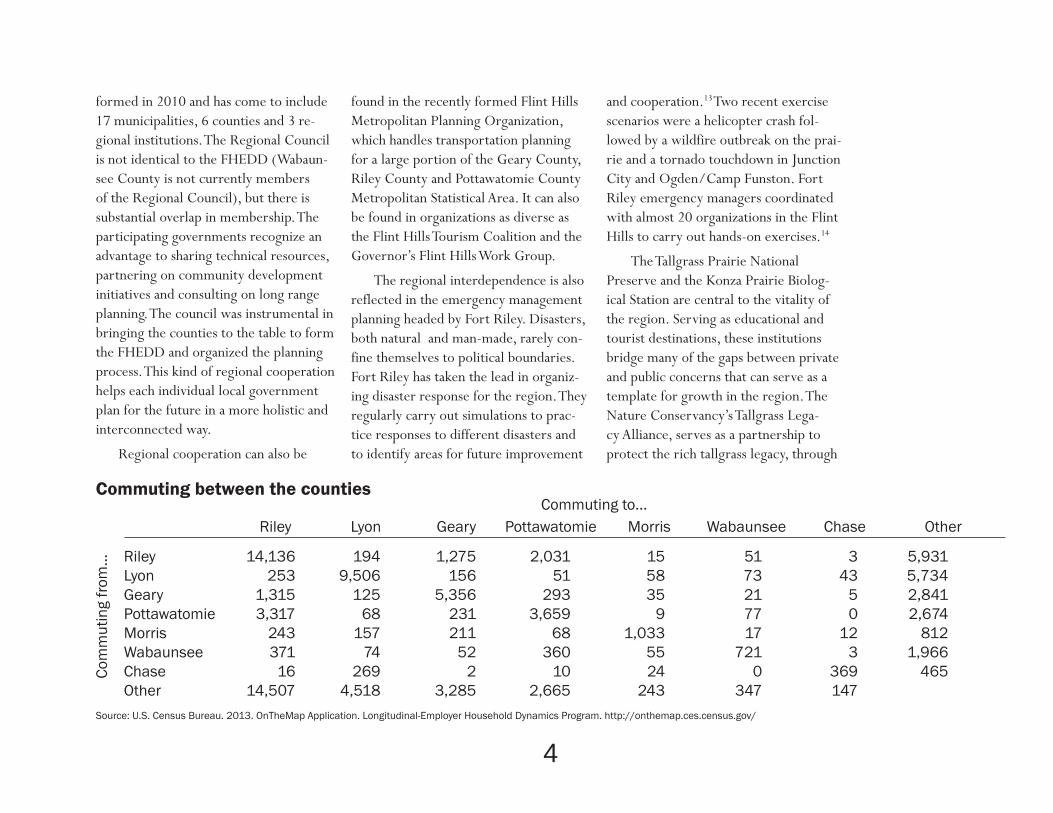
Riley Lyon Geary Pottawatomie Morris Wabaunsee Chase Other
Riley 14,136 194 1,275 2,031 15 51 3 5,931Lyon 253 9,506 156 51 58 73 43 5,734Geary 1,315 125 5,356 293 35 21 5 2,841Pottawatomie 3,317 68 231 3,659 9 77 0 2,674Morris 243 157 211 68 1,033 17 12 812Wabaunsee 371 74 52 360 55 721 3 1,966Chase 16 269 2 10 24 0 369 465Other 14,507 4,518 3,285 2,665 243 347 147
Com
mut
ing
from
...
Commuting to...Commuting between the counties
Source: U.S. Census Bureau. 2013. OnTheMap Application. Longitudinal-Employer Household Dynamics Program. http://onthemap.ces.census.gov/
a unique public-private partnership, bridging private property and cattle industry concern, with state and feder-al agencies and the commitment of the non-profit sector. These partnerships hold the promise of new educational, recreational, agricultural and economic synergies, which can lead to places like the Flint Hills Discovery Center and the Flint Hills Nature Trail and to economic initiatives, such as, From the Land of Kansas trademark program. The Flint Hills Economic Development District’s success will depend upon respecting the functioning economic heritage of the region, while bringing new, targeted approaches to leveraging the region’s rich natural, agricultural, manufacturing and cultural legacy.
Regional Mobility. The regional awareness is perhaps driven by the mobil-ity within the region. Residents often do not live, work, or play in the same city or even the same county. In 2010, 38 per-cent of workers commuted over 25 miles (one-way) to work.15 This is up from 26 percent in 2002.16 The FHEDD work-force is also not confined to the 7-county area. Over a third of the workforce lives outside the FHEDD region.17 (see table, page 4)
Skills are imported, exported,
trained and refined across these politi-cal boundaries. Approximately 30,000 students attend institutions of higher education in the region.18 Many of those students come here specifically for the education. Others take advantage of the region’s educational prowess to upgrade their skills. In addition to students com-ing and going, Fort Riley employs about 18,000 highly trained soldiers.19 Soldiers and students bring experiences and knowledge from around the globe. Some
remain in the area while others take a little piece of the Flint Hills with them as they move on to other destinations.
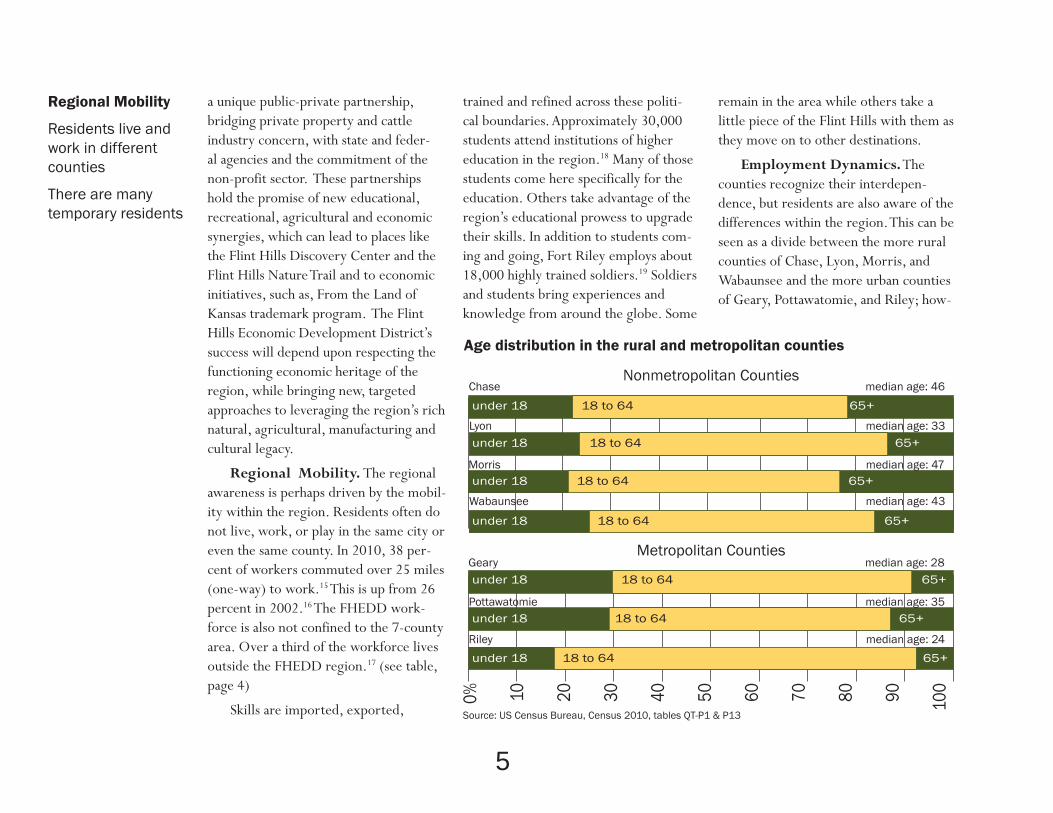
Employment Dynamics. The counties recognize their interdepen-dence, but residents are also aware of the differences within the region. This can be seen as a divide between the more rural counties of Chase, Lyon, Morris, and Wabaunsee and the more urban counties of Geary, Pottawatomie, and Riley; how-
5
Regional Mobility
Residents live and work in different counties
There are many temporary residents
Chase median age: 46
Geary median age: 28
Lyon median age: 33
Morris median age: 47
Pottawatomie median age: 35
Riley median age: 24
Wabaunsee median age: 43
Metropolitan Counties
Nonmetropolitan Counties
0% 10 20 30 40 50 60 70 80 90 100
Age distribution in the rural and metropolitan counties
under 18 18 to 64 65+
under 18 18 to 64 65+
under 18 18 to 64 65+
under 18 18 to 64 65+
under 18 18 to 64 65+
under 18 18 to 64 65+
under 18 18 to 64 65+
Source: US Census Bureau, Census 2010, tables QT-P1 & P13
6
Employment Dynamics
Urban/rural age differences
Rural population decline
High government employment
Food Manufacturing decline
Western terminus of Animal Health Corridor
Productivity changing
ever, this is a simplistic division. Many of the University-related phenomena pres-ent in Riley County are also present, at a smaller scale, in Lyon County. Likewise, Eastern Pottawatomie County has more in common with Wabaunsee County than Riley County even though Pottawatomie is considered a metropolitan county. While the region is unified in many ways the differing economic situations, mix of industries and demographics means that policy and programs that are beneficial for one part of the region may not have the same impact in another part. We out-line here the most impactful differences.
One of the most apparent differences between the rural and urban areas of the region is the demographics. The median age of the population in specific parts of Junction City, Manhattan and Emporia is 20.20 By contrast, the median age of the population in Chase County is 46 years old and older in Morris and parts of rural Riley and Wabaunsee counties.21 This age difference can affect many aspects of life in the region, but especially the potential for economic development. In places with a young median age, the residents lack capital and experience for entrepre-neurship. In the older areas, residents may not have the desire to take new risks as they approach retirement. Both
ends of the spectrum may be planning to move: to improve employment and marriage chances if they are younger and for recreational and health opportunities if they are older.
The age structure is related to the economy in other ways as well. As agriculture becomes increasingly mecha-nized, there is need for fewer employees. The dwindling employment prospects in the major industries in the rural counties is part of what drives young adults to the urban areas of the region and to other parts of the state and country. In the urban areas of the counties, the younger
population is largely associated with one of the region’s universities and Fort Riley. For many young adults, their tenure at these institutions is limited. When they graduate or are discharged they have a valuable set of skills that they can apply for new opportunities. If they do not find employment locally, they can be drawn away from the region.
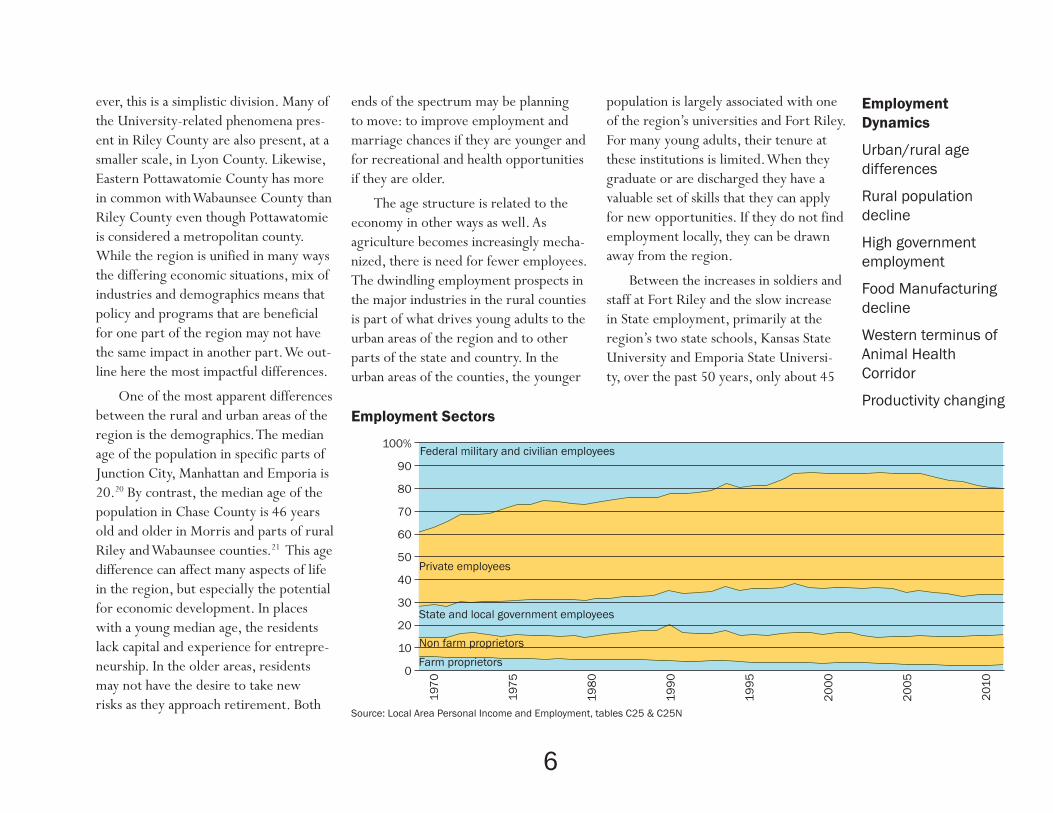
Between the increases in soldiers and staff at Fort Riley and the slow increase in State employment, primarily at the region’s two state schools, Kansas State University and Emporia State Universi-ty, over the past 50 years, only about 45
197
0
197
5
198
0
199
0
199
5
20
00
20
05
201
0
100%
90
80
70
60
50
40
30
20
10
0Farm proprietors
Non farm proprietors
State and local government employees
Private employees
Federal military and civilian employees
Source: Local Area Personal Income and Employment, tables C25 & C25N
Employment Sectors
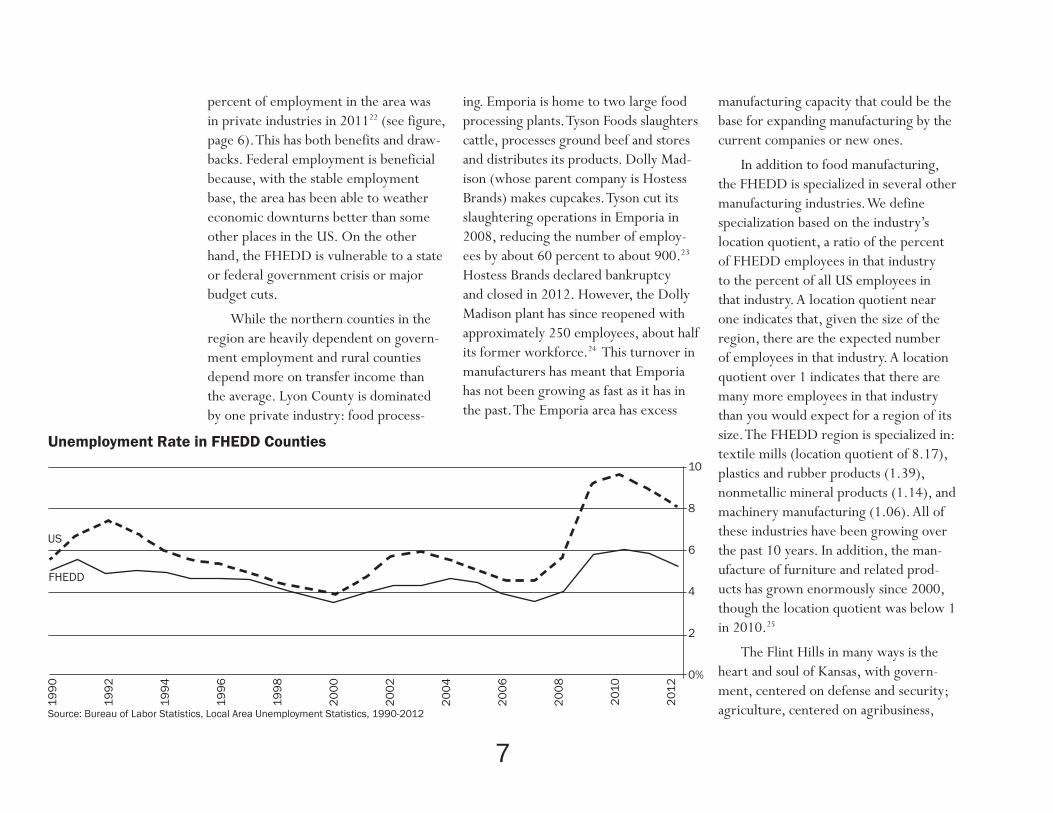
percent of employment in the area was in private industries in 201122 (see figure, page 6). This has both benefits and draw-backs. Federal employment is beneficial because, with the stable employment base, the area has been able to weather economic downturns better than some other places in the US. On the other hand, the FHEDD is vulnerable to a state or federal government crisis or major budget cuts.
While the northern counties in the region are heavily dependent on govern-ment employment and rural counties depend more on transfer income than the average. Lyon County is dominated by one private industry: food process-
ing. Emporia is home to two large food processing plants. Tyson Foods slaughters cattle, processes ground beef and stores and distributes its products. Dolly Mad-ison (whose parent company is Hostess Brands) makes cupcakes. Tyson cut its slaughtering operations in Emporia in 2008, reducing the number of employ-ees by about 60 percent to about 900.23 Hostess Brands declared bankruptcy and closed in 2012. However, the Dolly Madison plant has since reopened with approximately 250 employees, about half its former workforce.24 This turnover in manufacturers has meant that Emporia has not been growing as fast as it has in the past. The Emporia area has excess
manufacturing capacity that could be the base for expanding manufacturing by the current companies or new ones.
In addition to food manufacturing, the FHEDD is specialized in several other manufacturing industries. We define specialization based on the industry’s location quotient, a ratio of the percent of FHEDD employees in that industry to the percent of all US employees in that industry. A location quotient near one indicates that, given the size of the region, there are the expected number of employees in that industry. A location quotient over 1 indicates that there are many more employees in that industry than you would expect for a region of its size. The FHEDD region is specialized in: textile mills (location quotient of 8.17), plastics and rubber products (1.39), nonmetallic mineral products (1.14), and machinery manufacturing (1.06). All of these industries have been growing over the past 10 years. In addition, the man-ufacture of furniture and related prod-ucts has grown enormously since 2000, though the location quotient was below 1 in 2010.25
The Flint Hills in many ways is the heart and soul of Kansas, with govern-ment, centered on defense and security; agriculture, centered on agribusiness,
7
US
10
8
6
4
2
0%
199
0
199
2
1994
199
6
199
8
20
00
20
02
20
04
20
06
20
08
201
0
201
2
Unemployment Rate in FHEDD Counties
FHEDD
Source: Bureau of Labor Statistics, Local Area Unemployment Statistics, 1990-2012

food processing and technology; and higher education, forming the major core of industry clusters. NBAF is perhaps the most anticipated research facility in the nation. The announcement in 2009 that the federal government would move the Animal Disease Center from Plum Island, New York to Manhattan, Kansas brought huge excitement and expectations for our region and the state of Kansas. NBAF is expected to employ approximately 326 workers, paid approximately $77,000 per year in salaries and benefits, with an average annual operating budget starting at nearly $45 million dollars, and increas-ing 3 percent per annum. The direct and indirect impacts of the facility to the region and the state for the first 25 years are estimated at over $5 billion dollars.26
Just the announcement of the move has had a measurable impact on the region. The Kansas Department of Agriculture announced in 2013 that it will relocate from Topeka to Manhattan.27 These two institutions, along with the research centers at Kansas State University will create an impressive Western anchor to the Kansas City Animal Health Corridor that begins in Columbia, Missouri. The businesses along this Corridor account for nearly 32 percent of total sales in the $19 billion global animal health market
and employ more than 20,000 trained employees.28
Productivity is the amount of goods and services produced per employee. Across the state of Kansas, industries that we specialize in have increased productiv-ity since 1997 (just before the dot-com boom). We are highly specialized in state and federal government (location quo-tients of 6.71 and 1.79, respectively)29 and government productivity is growing steadily.30 Our region is specialized in mining as well (1.32). We only employed 184 people in the industry in 2010,31 but the industry productivity increased dra-matically between 1997 and 2011.32 We remain specialized in food manufacturing (2.47) which is also steadily increasing its productivity. Rail transportation (1.64) and utilities (1.58) are increasing in pro-ductivity.33
Other industries have seen declin-ing productivity over that time period. Among them are many of the manufac-turing industries that the FHEDD spe-cializes in, including nonmetallic mineral product manufacturing and textile and textile product mills.34 This means that it takes more employees to produce the same value of goods today than in 1997. There are many reasons that may ac-count for this including a move to more
customized or limited production scale. However, efforts to produce more goods and services per employee across all industries will result in a greater overall gain for the region.
We benefit from the employment base of state and federal jobs by con-sistently having an unemployment rate below the national rate (see chart, page 7). However, we have many opportu-nities to diversify the economy in the
8
Most Distressed
Emporia Area
Southern Junction City
Population Change
Decline
0 to 500
501 to 1500
1501 to 2500
No dataSource: Map, US Census Bureau 2012 TIGER/Line shapefi le; data US Census Bureau Census 2000, table P001, Census 2010, table P1.

coming years. The growth of manufactur-ing is one of those areas. We are training and employing highly skilled people in the region. The challenge is to ensure an equitable distribution of employment and income across the region.
DISTRESSED AREAS
As mentioned in the previous sec-tion, not all of the places in the FHEDD experience the same social and economic
9
Home Rental AffordabilityHome Ownership Affordability
20
.1 to
40
.3 %
15.1
to 2
0.0
%
12
.6 to
15
.0 %
7.4
to 1
2.5
%
No
data
Kan
sas
Inde
x: 1
2.5
%
Source: Map, US Census Bureau 2012 TIGER/Line shapefi le; data US Census Bureau Census 2000, table P001, Census 2010, table P1.
Source: Map, US Census Bureau 2012 TIGER/Line shapefi le; data US Census Bureau American Commu-nity Survey 2006-2011, table B19013.
Affordability is expressed as a ratio of home cost to income. Ownership affordability it is the ratio of median home value to median household in-come. Rental affordability is the ratio of median contract rent to 1/12 me-dian household income or rent as the percent of a monthly pay cheque.
4.1
to 8
.4
3.1
to 4
.0
2.6
to 3
.0
0.3
to 2
.5
No
data
Kan
sas
Inde
x: 2
.5
Median Household Income
$15,448 to $35,000
$35,001 to $50,594
$50,595 to $60,000
$60,001 to $70,865
No data
Kansas Median Income: $50,594
Source: Map, US Census Bureau 2012 TIGER/Line shapefi le; data US Census Bureau American Community Survey 2006-2011, table B19013.
conditions. Income is not evenly dis-tributed around the region. Some parts benefit from very high incomes while others struggle to manage with very low incomes. While all of the region is more affordable than the US as a whole, some areas are more expensive, relative to income. Finally, many local governments depend on a growing tax base to cover their obligations for infrastructure and other commitments. However, some parts of the region have seen a steady or declining population over the past decade. The combination of these three factors results in some parts of the region ranging from moderately distressed to very distressed.
To demonstrate the range of experi-ence across the region, we are displaying it at the census tract level. This means that some counties will have a lot of detail because they have a large popula-tion while others have very little detail because they have a small population. The census tracts should not be thought of as strong boundaries, but as a way to indicate generally what is happening at a sub-county level.
The southern section of the region and the center of all three major towns have at least one indicator of distress. The Emporia area and southern Junction City
show signs of distress in all three areas.
Population growth is clearly occur-ring primarily along the I-70 corridor. Population is holding steady or declining in the southern half of the region (see map, page 8). The decline is especial-ly precipitous in the rural parts of the region.35
Median income is highest in the northwest quadrant of the area and is above the median income in Kansas in
much of the rural areas in the north and east of the FHEDD region (see map, page 9). The urban parts of the region, howev-er have some of the lowest income levels. Manhattan, Junction City and Emporia are where areas of the lowest median incomes are located.
We considered two different mea-sures of housing affordability: cost of ownership and cost of rental housing (see maps, page 9). Both measures show
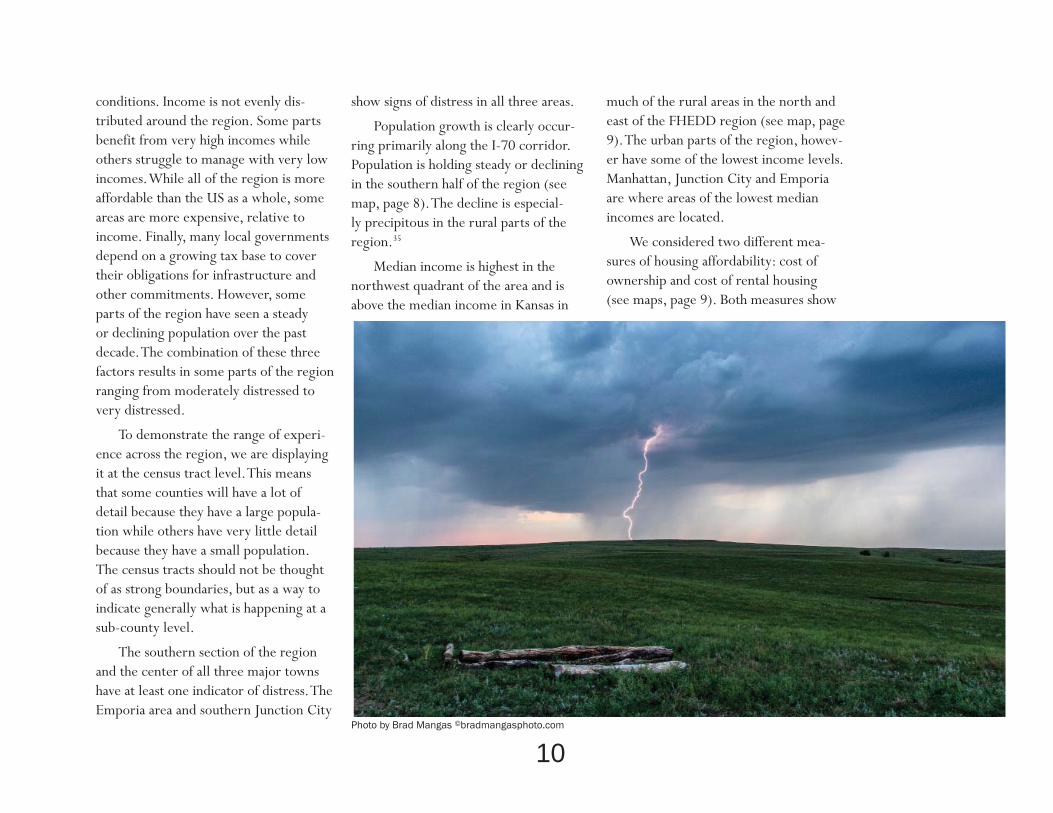
10Photo by Brad Mangas bradmangasphoto.com
housing to be least affordable in the urban areas. However, much of the most populated parts of region are less afford-able than Kansas as a whole.
There are other factors that can contribute to distress such as the cost and availability of transportation options, the unemployment rate and the growth and decline of large employers. When these other indicators occur in a healthy, growing part of the region, it is relatively easy for the place to absorb the negative implications. When they occur in a dis-tressed area, it is increasingly difficult to
manage the implications.
ECONOMIC CLUSTERS
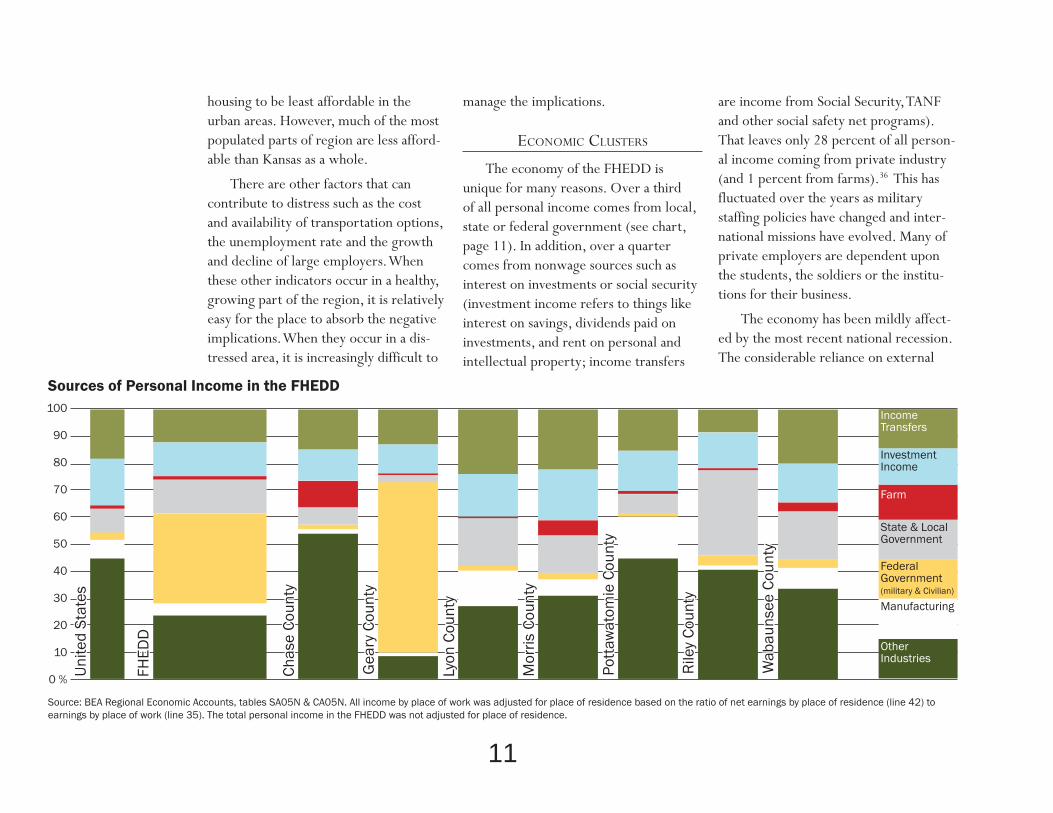
The economy of the FHEDD is unique for many reasons. Over a third of all personal income comes from local, state or federal government (see chart, page 11). In addition, over a quarter comes from nonwage sources such as interest on investments or social security (investment income refers to things like interest on savings, dividends paid on investments, and rent on personal and intellectual property; income transfers
are income from Social Security, TANF and other social safety net programs). That leaves only 28 percent of all person-al income coming from private industry (and 1 percent from farms).36 This has fluctuated over the years as military staffing policies have changed and inter-national missions have evolved. Many of private employers are dependent upon the students, the soldiers or the institu-tions for their business.
The economy has been mildly affect-ed by the most recent national recession. The considerable reliance on external
11
Other Industries
Manufacturing
Federal Government (military & Civilian)
State & LocalGovernment
Farm
Investment Income
Income Transfers
100
90
80
70
60
50
40
30
20
10
0 % Uni
ted
Stat
esU
nite
d St
ates
FHED
DFH
EDD
Chas
e Co
unty
Chas
e Co
unty
Gea
ry C
ount
yG
eary
Cou
nty
Lyon
Cou
nty
Lyon
Cou
nty
Mor
ris C
ount
yM
orris
Cou
nty
Pott
awat
omie
Cou
nty
Pott
awat
omie
Cou
nty
Rile
y Co
unty
Rile
y Co
unty
Wab
auns
ee C
ount
yW
abau
nsee
Cou
nty
Source: BEA Regional Economic Accounts, tables SA05N & CA05N. All income by place of work was adjusted for place of residence based on the ratio of net earnings by place of residence (line 42) to earnings by place of work (line 35). The total personal income in the FHEDD was not adjusted for place of residence.
Sources of Personal Income in the FHEDD

money has meant that the economy has remained quite steady. Historically, the region maintains a lower unemployment rate than the nation. The downside of this reliance is that the region has little con-trol over the institutions and businesses that contribute to the economy. There is a strong desire to build on the strengths of the region and diversify the industries in the area. In 2012 we lost 10 percent of public sector jobs in the region and 3.5 percent of overall employment.37 With a more diverse economy, changes in mili-tary and university policies and employ-ment would not have such a large impact on the region’s economy.
There are many complementary industries that have begun to develop in parts of the region that could be further encouraged. The three primary industries in the area, Military, Higher Education, and Beef Cattle, in combination with our natural habitat and significant history can contribute to the growth of four other industries. The growing industries we have identified are Manufacturing, Re-tirement, Tourism and High-Tech Agri-culture. This diversification will help the region weather the fluctuations in state and federal funding, staffing and enroll-ment levels or recruitment.
The Military Cluster is as old as the re-gion. Fort Riley was originally a military outpost to protect migrants traveling to the West.38 It is now home to the First Infantry Division, also called “The Big Red One.” The base spans Riley and Geary Counties and soldiers and their families live on base in the two counties as well as in the surrounding towns across the entire region.
In 1969, 39 percent of employees in the FHEDD were employed by the Federal government either as soldiers or as civilian workers. This declined to a low of 13 percent in 2002 and has since climbed back up to 21 percent.39 The federal government is not quite as dominant as it once was, but it is still by far the largest employer in the 7-county area. The changes in international mis-sions and training priorities of the nation affect the staffing levels far more than any regional factors. The move of the Big Red One from Germany to Fort Riley around 2006 was the cause of the most recent change in employment levels.40 While the region cannot control the national securi-ty needs of the nation, it can continue to work with the military to anticipate and plan for changes in those levels.
The cluster is not confined to Fort Riley. Many businesses contract with the
Fort to provide construction work, edu-cation, health care and other services and supplies. In 2012, Fort Riley estimated its direct economic impact was $1.9 billion, $1.3 billion of which was payroll.41
The cluster’s impact is not solely through employment and commerce. The military recruits educated people and trains them well. In the FHEDD, 96 per-cent of veterans are high school graduates (compared to 90 percent of nonveterans in the FHEDD).42 Some soldiers serve until retirement, but many more serve four to eight years and are honorably discharged. These discharged soldiers are highly skilled and could potentially contribute greatly to the local economy. Of those who retire from Fort Riley, around 40 percent choose to stay in Kansas, many in the Flint Hills region.43 Their skills and experience are assets to the community.
The Higher Education Cluster is an-chored by two state universities, Kansas State University and Emporia State Uni-versity. Both schools have long histories in the region. In addition to these two schools, the region hosts two private colleges, St. Mary’s Academy and College and Manhattan Christian College as well
12
Flint Hills Economic Development District Clusters
Established Clusters
Military
Higher Education
Beef Cattle
Growth Clusters
Retirement
Manufacturing
Tourism
High Tech Agriculture
as a branch of Southwestern College at Fort Riley. Two technical colleges re-side in the region: Flint Hills Technical College and Manhattan Area Technical College. Three community colleges have branch campuses here: Barton Com-munity College (at Fort Riley), Cloud County Community College (in Junction City) and Highland Community College (in Wamego).
Higher education contributes to the economy in several ways. First, employ-ment by state and local governments accounted for 20,433 jobs, or 17 percent
of the jobs in the seven-county area.44 Most of these employees are university or school district employees. Second, the universities in the FHEDD enroll approx-imately 30,000 students every fall.45 This increase in the population adds a con-sumption market that requires relatively few public services.
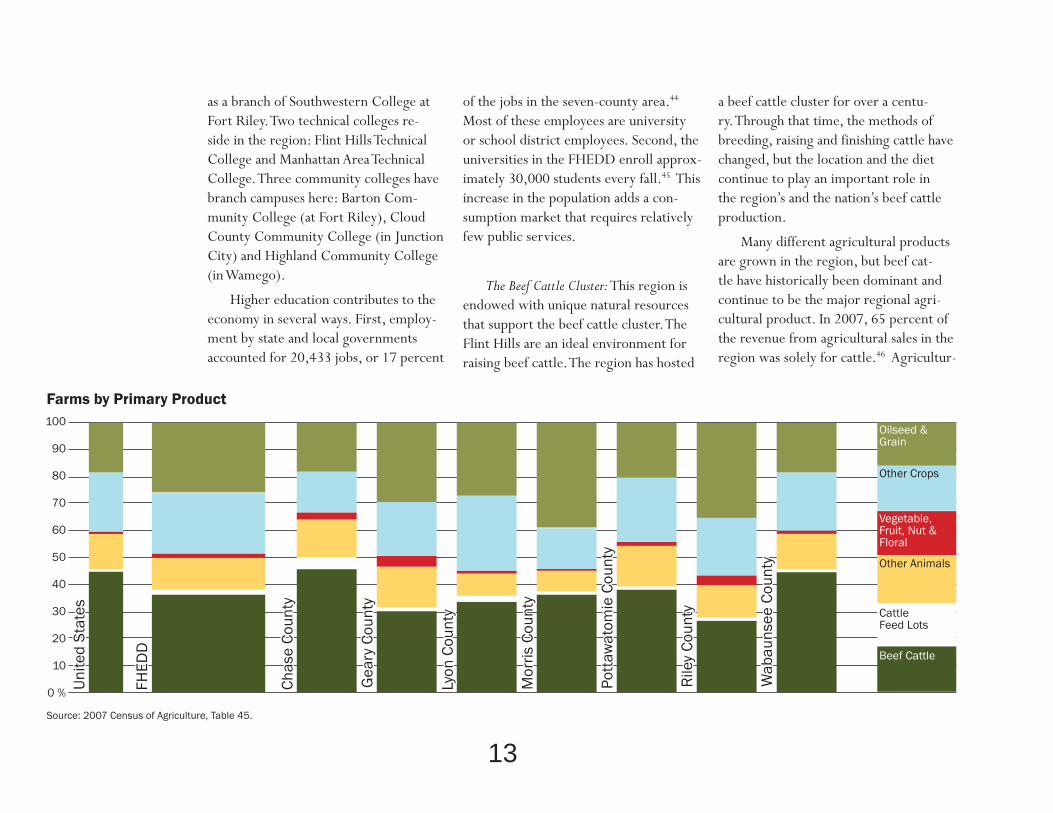
The Beef Cattle Cluster: This region is endowed with unique natural resources that support the beef cattle cluster. The Flint Hills are an ideal environment for raising beef cattle. The region has hosted
a beef cattle cluster for over a centu-ry. Through that time, the methods of breeding, raising and finishing cattle have changed, but the location and the diet continue to play an important role in the region’s and the nation’s beef cattle production.
Many different agricultural products are grown in the region, but beef cat-tle have historically been dominant and continue to be the major regional agri-cultural product. In 2007, 65 percent of the revenue from agricultural sales in the region was solely for cattle.46 Agricultur-
13
Beef Cattle
Cattle Feed Lots
Other Animals
Vegetable, Fruit, Nut & Floral
Other Crops
Oilseed & Grain
100
90
80
70
60
50
40
30
20
10
0 % Uni
ted
Stat
esU
nite
d St
ates
FHED
DFH
EDD
Chas
e Co
unty
Chas
e Co
unty
Gea
ry C
ount
yG
eary
Cou
nty
Lyon
Cou
nty
Lyon
Cou
nty
Mor
ris C
ount
yM
orris
Cou
nty
Pott
awat
omie
Cou
nty
Pott
awat
omie
Cou
nty
Rile
y Co
unty
Rile
y Co
unty
Wab
auns
ee C
ount
yW
abau
nsee
Cou
nty
Source: 2007 Census of Agriculture, Table 45.
Farms by Primary Product
al sales for beef varied between 25 and 90 percent of all agricultural sales among the seven counties. The industry also dominates land use in the counties: 50 percent of the land is permanent range-land.47 In addition, a portion of cropland is annually rotated to range uses.
Like the other industries, the cat-tle industry is not distributed evenly throughout the FHEDD. Chase County is highly concentrated in the Beef in-dustry with 90 percent of agricultural sales coming from cattle and calves and 75 percent of its farmland dedicated rangeland. In Geary County, on the other hand, only 25 percent of agricultural sales are for cattle and calves and 50 per-cent of the land is dedicated rangeland.48
These three clusters have the po-tential to contribute to building new economic engines that might fuel a more
diverse infrastructure. The higher educa-tion institutions can offer entertainment and recreation options that have spillover effects. The three clusters can attract peo-ple from a wider region to the area and they contribute to the attractiveness of the area as a retirement destination. The beef cattle cluster can also contribute to the tourism cluster. People are becoming increasingly interested in the source of their food and the environment where it grew. Linking people to ranches is one way to both encourage the growth of the tourism sector and foster niches with-in the beef cattle industry. The military cluster produces highly skilled employees who often leave the military after four to eight years of service, looking for work in other fields. Many of the skills veterans have are transferable to skilled manu-facturing, an industry that is growing in
the region. Establishing more productive links between employers and veterans can be mutually beneficial for both the manufacturing sector and transitioning military personnel to civilian employ-ment.
The Retirement Cluster is partially a result of the aging of the baby boom generation. Though retirement is not a traditional industry, the population in this life-stage is an essential sector that has been strong in the region because of the many services that benefit retirees. Two industries that are contributors to the quality of life for this population are the University and the health system.
Many retirees feel a strong connec-tion to their Alma Mater and enjoy living close to the institution they so closely identify with. The Manhattan area was
14
Woo
d Pr
oduc
ts
2
Text
ile P
rodu
cts
3
Elec
tric
al E
quip
men
t 4
Tran
spor
tatio
n 6
Equi
pmen
t
Mis
cella
neou
s 6
Mac
hine
ry
12
Fabr
icat
ed M
etal
15
Prod
ucts
Food
19
Bev
erag
e &
Tob
acco
3
Com
pute
rs &
Ele
ctro
nics
3
Chem
ical
s 5
Furn
iture
& R
elat
ed
6
Plas
tics
and
Rub
ber
8
Non
met
alic
min
eral
13
Prod
ucts
Prin
ting
& R
elat
ed
17Su
ppor
t Act
iviti
es
Source: County Business Patterns, 2011.
Manufacturing Establishments by Primary Product
one of the top 5 places to retire young as rated by Forbes.com.49 As people retire, they begin to draw down their assets, adding money to the economy without adding output. Not only do retirees contribute economically, but with a more flexible schedule they often contribute socially to the community through volun-teering, mentoring and engaging in the civic discourse.
The size of the population over 65 has grown in size by 24 percent over the past 50 years.50 It has grown at the
same pace as the population as a whole, remaining about 10 percent of the total population. The first baby boomers were eligible for retirement in 2010. We antic-ipate the over 65 population will begin to grow faster than the population as a whole making up a larger percent of the population in the coming years.
This growth has implications for the economy. Retirees draw income from nonwage sources more than people of working age. Some nonwage income is “transfer” income such as Social Security
and some nonwage income is “invest-ment” income such as the returns to a 401K. Region-wide, the percent of personal income from nonwage sources is similar to the national average. How-ever, some of the counties in the region rely more on this income than others. As this segment of the population grows, the income structure could change as well.
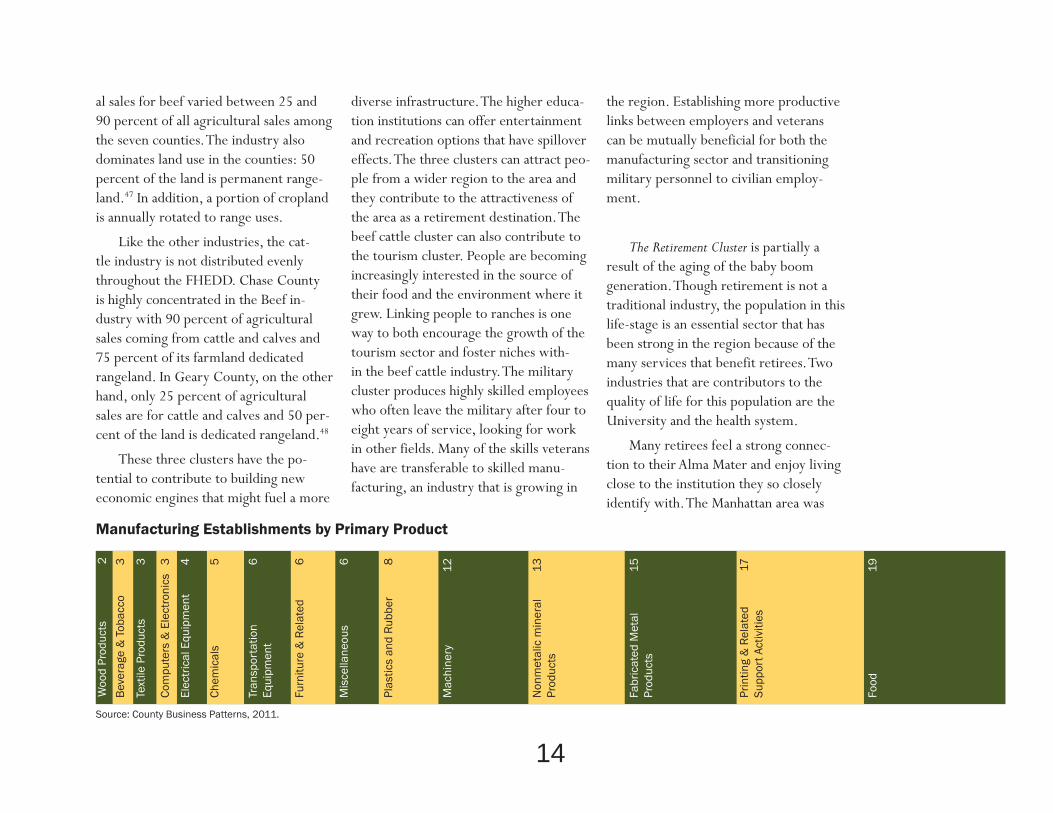
The Manufacturing Cluster is re-emerg-ing as a more refined and specialized niche. In fact, all manufacturing sectors in the FHEDD have experienced growth over the past 10 years except food manufacturing.51 Manufacturing indus-tries have the potential to benefit from a well-trained workforce of veterans and an integrated K-12 and technical col-lege system. The largest manufacturing industries in the FHEDD, besides food processing are machinery, plastics and rubber, and fabricated metal product manufacturing (see chart, page 14). These three industries along with 11 other manufacturing sectors have approx-imately 2,800 employees, about the same as are employed in food manufacturing in 2011.52 As these industries continue to grow, they could offer a significant portion of skilled jobs in the FHEDD and offset the decline in food manufactur-
15
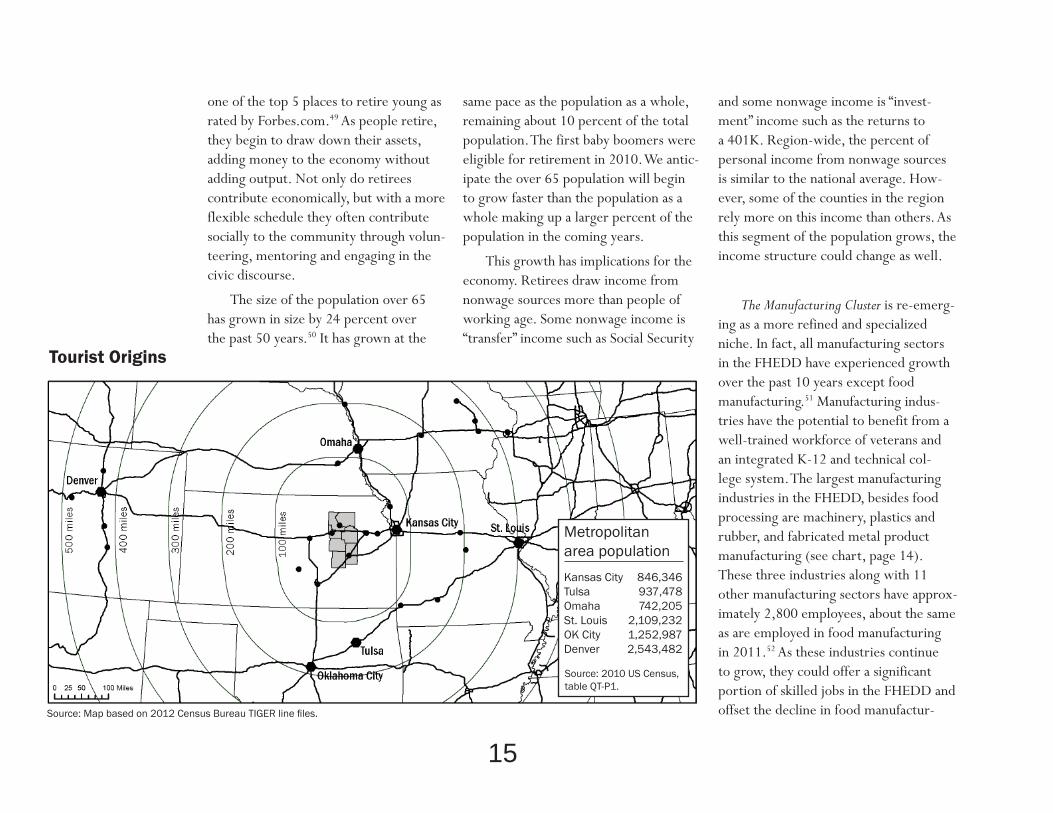
Tourist Origins
Source: Map based on 2012 Census Bureau TIGER line fi les.
Metropolitan area population
Kansas City 846,346Tulsa 937,478Omaha 742,205St. Louis 2,109,232OK City 1,252,987Denver 2,543,482
Source: 2010 US Census, table QT-P1.

ing, especially in the Emporia area. The contraction in food processing means that there is excess capital capacity for manufacturing. While the equipment is not the same for beef slaughtering as it is for machinery manufacturing, the two industries do share a need for transpor-tation links and large facilities. There is an opportunity to turn the decline of one segment of the industry into the further expansion of growing segments.
The Tourism Cluster is in the incubation period. It has only been developed in pockets within the region. Places such as Council Grove have built upon its rich history. Council Grove was the last stop on the Santa Fe Trail to gather provisions for the long trek to New Mexico. How-ever, the entire region played a role in the Western Expansion of our nation. Because Fort Riley has been established since the settlement of the region, it holds many keys to understanding this period in history. As home to the larg-est infantry division, the fort is also a guardian of much of our nation’s military history.
The later cattle drives enrich the region with firsthand tales of the cow-boys that have become the icons of the
nation. People disinterested in personal histories may be interested in the unique and beautiful natural history of the Flint Hills. The newly constructed Flint Hills Discovery Center has capitalized on this resource demonstrating how the tallgrass prairie continues to shape the culture of the people that inhabit this area. Oth-er potential visitors may be drawn by a desire to better understand the sources of their food through the growing agri-tour-ism industry. The development of Kansas wineries is already generating local tour-ism. This area is rich in food production and there is room for agri-tourism to
grow.
The natural beauty of the Flint Hills is a significant attraction. The unique ecosystem of the tallgrass prairie and rolling hills have a quiet, subtle splendor. The region’s sweeping horizons and car-pets of wildflowers captivate artists and enchant visitors. There are two major reservoirs, Milford Lake and Tuttle Creek Lake, and over 20 state fishing lakes and community lakes providing opportuni-ties for fishing, swimming, and boating. Plentiful wildlife in the Flint Hills attracts birders, hunters, and photographers
16
High Tech Agriculture builds on our re-gional cattle culture, linking research and development at the two universities, in-stitutions, in the An-imal Health Corridor and, in the future, at NBAF.
Photo by Brad Mangas bradmangasphoto.com
17
The region is geographically well-suited for tourism. Most parts of the region are two to three hours driving from Kansas City and three to five from Omaha and Lincoln (see map, page 15). Interstate 70, a major East-West freeway connecting Pennsylvania to Utah through Indianapolis, St. Louis, Kansas City, and Denver, is strategically and logistically key to the many markets that connect the nation’s commerce. Interstate 35, one of the largest non-coastal North-South freeways, connects Minneapolis-St. Paul to Dallas-Fort Worth though Des Moines, Kansas City and Oklahoma City. In addition, the FHEDD has a commercial airport located between Manhattan and Junction City with direct service to Chi-cago, Dallas, and Phoenix. The FHEDD region played a key role in the devel-opment of our nation and still retains the history in the towns throughout the 7-county region.
The High Tech Agriculture Cluster is an agglomeration of institutions and busi-nesses that we anticipate will develop. The move of NBAF from New York State to Kansas State University in combination with the existing agricultural research being conducted there will create a labor pool specialized in agricultural research.
It is an area that other, private employers could benefit from and contribute to. The region is located at the westernmost terminus of the Animal Health Corri-dor, that stretches through Kansas City to Columbia, Missouri. The corridor is home to the North American or global headquarters of over 70 global leaders in the animal health industry.
Currently there are approximately 591 people employed in scientific occu-pations within the FHEDD.49 The univer-sities in the region graduate students in scientific fields with bachelors, masters and doctoral degrees. The addition of NBAF will contribute to developing this cluster. While NBAF is located in Man-hattan, there is the potential that this cluster could expand towards Emporia as well, especially since Emporia State University has a strong emphasis in agronomy. The cluster will thrive as pri-vate companies are founded or choose to grow in the region.
REFERENCES
1 2010 Census, table P1.
2 The Manhattan-Junction City MSA was created in 2008. It had been two micro-politan areas: Manhattan Micropolitan Area and Junction City Micropolitan Area. When Manhattan exceeded the population threshold of 50,000 peo-ple and because a metropolitan area, Junction City was incorporated into the MSA. It is now often referred to as the Manhattan MSA. We use both terms interchangeably in this document.
3 2010 Census, table P1.
4 US Census Bureau (2013). Oil and Gas Boom Driving Population Growth in the Great Plains, Census Bureau Estimates Show. Press Release (March 14), avail-able online at http://www.census.gov/newsroom/releases/archives/popula-tion/cb13-46.html
5 G.A. Hoots (2011). Flint Hills Charles-ton, S.C.: Arcasia Publishing. (p.45).
6 Frank H. Gille, ed. 2000. Encyclopedia of Kansas, 3rd Edition. Vol. 1. St Clair Shores, Mich.: Somerset Publishers Inc., p. 228.
7 An Act to Organize the Territories of Nebraska and Kansas, 1854; Record Group 11; General Records of the Unit-ed State Government; National Archives. Accessed at http://www.ourdocu-ments.gov.
8 See note 5, p. 1.
18
9 See note 5, pp. 173 & 228.
10 M. Snider (1975). Council Grove: Birth-place of the Santa Fe Trail. In J. Morris (Ed.), The Flint Hills of Kansas (pp. 38-39). Manhattan, Kan.: Kansas State University.
11 A. Niles-Beattie (1996). Pioneers of the Flint Hills: From Earliest Times to 1900 (pp. 9-12). Hillsboro, Kan.: Hearth Publishing, Inc.
12 Level III Ecoregions of the Continental United States. (2003, May). Nation-al Health and Environmental Effects Research Laboratory. US Environmental Protection Agency, Washington DC. Accessed October 22, 2013 at http://pubs.usgs.gov/tm/04/c03/virtual_CD/useco.pdf.
13 Pamela Redford (2012, July 6). Fort Riley proves readiness for emergencies. Press Release #7184 from Fort Riley, Kansas.
14 Fort Riley Kansas HSEEP Full Scale Exercise Planning Summary. (2012). (Available from Directorate of Plans, Training, Mobilization, and Security, Plans & Protection, Fort Riley, KS 66442)
15 U.S. Census Bureau. 2013. OnTheMap Application. Longitudinal-Employer Household Dynamics Program. http://onthemap.ces.census.gov/
16 See note 15.
17 See note 15.
18 Kansas State University fall 2012 enroll-
ment: 24,378 (source: K-State Media Guide – Enrollment Numbers. http://www.k-state.edu/media/mediaguide/enrollment.html Updated Oct. 21, 2013. Accessed Oct. 22, 2013.) and Em-poria State University’s fall enrollment: 5,867 (source: Successful recruitment efforts seen in Fall 2012 enrollment numbers. 2012, Sept. 27. Press release from Emporia State University avail-able at http://www.emporia.edu/news/09/27/2012/successful-recruit-ment-efforts-seen-in-fall-2012-enroll-ment-numbers/?, Accessed Oct. 22, 2013.
19 Plans, Analysis and Integration Office (2012). Economic Impact Summary: 1 Oct 11 - 30 Sep 12, DSN 856-2022 Distrib-uted by Fort Riley Public Affairs Office.
20 Census 2010, table P13.
21 Census 2010, table P13.
22 Bureau of Economic Analysis. Local Area Personal Income and Employment, table C25N.
23 Bobbi Mlynar. (2008). Tyson will elimi-nate slaughter in Emporia. The Emporia Gazette, posted online January 25, 2008, 12:00 am. Accessed September 27, 2013 at http://www.emporiagazette.com/news/article_756ab55c-ec36-5ef4-a5c6-01f7fb28f0b4.html
23 Associated Press. (2013). Hostess Bak-ery To Reopen This Summer, Hire 250 After Bankruptcy Cost More Than 500 Jobs. Huffington Post, published online
April 26, 2013 11:20am EDT, accessed September 27, 2013. http://www.huffingtonpost.com/2013/04/26/hostess-reopen-kansas-bakery-250-jobs_n_3161597.html
24 Location quotients are calculated through the proprietary program, Eco-nomic Modeling Specialists Internation-al, LLC, (EMSI). When there are missing data points, and such, EMSI estimates them using its own algorithms. Estimates are subject to varying degrees of error. FHRC’s data, reports, forecasts, and ser-vices may differ from actual outcomes and are provided as is, without warranty for a particular purpose or project.
25 Impact DataSource. (2012, January 11). A report of the Economic Impact of the National Bio and Agro-Defense Facility in Manhattan, Kansas. Austin, TX. pp.84.
26 Scott Rothschild (2013, April 28). Kansas Department of Agriculture pre-paring for move to Manhattan. Lawrence Journal-World.
27 Superior Workforce. (2013). Accessed November 13, 2013 at http://www.kcanimalhealth.com/index.php/ben-efits-of-the-corridor/superior-work-force/
28 See note 24.
29 Bureau of Economic Analysis. Regional Economic Accounts, GDP by State and Personal Income & Employment, table C25N (1997 & 2011). Productivity is calculated by dividing GDP by employ-

19
ment for each industry. GDP was adjust-ed for inflation using the BEA’s Inflation Calculator (http://www.bls.gov/data/inflation_calculator.htm)
30 See note 24.
31 For location quotient source, see note 24. For productivity source, see note 28.
32 See note 29.
33 Census 2000, table P001 & Census 2010, table P1.
34 US Bureau of Economic Analysis. Local Area Personal Income and Employment, Table CA04.
35 See note 10.
36 US Bureau of Economic Analysis, Local Area Personal Income and Employment, Tables CA25 and CA25N.
37 Sauter, Michael B., Thomas C. Frohlich and Alexander E.M. Hess. (2013, De-cember 15). Cities adding and losing the most jobs, USA Today. Accessed online December 19, 2013 at http://www.usatoday.com/story/manoey/busi-ness/2013/12/15/cities-adding-losing-most-jobs/4009031.
38 The History of the 1st Infantry Division. (2013). Accessed November 13, 2013 at http://www.riley.army.mil/bigredone/history.aspx
39 Local Area Personal Income and Em-ployment, tables C25 & C25N.
40 Plans, Analysis and Integration Office, Fort Riley (2013). Economic Impact Summary: 1 OCT 11 - 30 Sep 12. Fort
Riley, KS: US Army Garrison Office, Public Affairs Office. 30p.
41 See note 40.
42 2006-2011 ACS, table B21003. The margin of error is approximately 7.5 percentage points for the veteran popu-lation and 3.2 percentage points for the nonveteran population.
43 Fort Riley. 2013. ACAP Exit Survey for Retirees and Nonretirees, PowerPoint.
44 US Bureau of Economic Analysis, Local Area Personal Income and Employment, Table CA25N.
45 See note 18.
46 2007 Census of Agriculture, table 2. The statistics were very similar for 2002.
47 2007 Census of Agriculture, table 2.
48 2007 Census of Agriculture, table 2.
49 Forbes.com. (2010). #3 Manhattan KS, posted April 14, 6:00 am EST, accessed September 29, 2013 at http://www.forbes.com/lists/2010/5/business-plac-es-10_Manhattan-KS_KSMan.html
50 US Census Bureau, Census 2010, table P1. US Census Bureau, Census 1970, table 16.
51 Employment is calculated through the proprietary program, Economic Modeling Specialists International, LLC, (EMSI). When there are missing data points, EMSI estimates them using its own algorithms. Estimates are subject to varying degrees of error. FHRC’s data, reports, forecasts, and services
may differ from actual outcomes and are provided as is, without warranty for a particular purpose or project.
52 Estimated from County Business Pat-terns 2011.
53 2007-2011 American Community Sur-vey 5-year Estimates, table C24010, Sex by occupation for the civilian employed population 16 years and over. This is only people in “Life, physical, and social science occupations” and does not in-clude health care, computer science, or engineering occupations.
20Photo by Brad Mangas bradmangasphoto.com
21
THE PROCESS
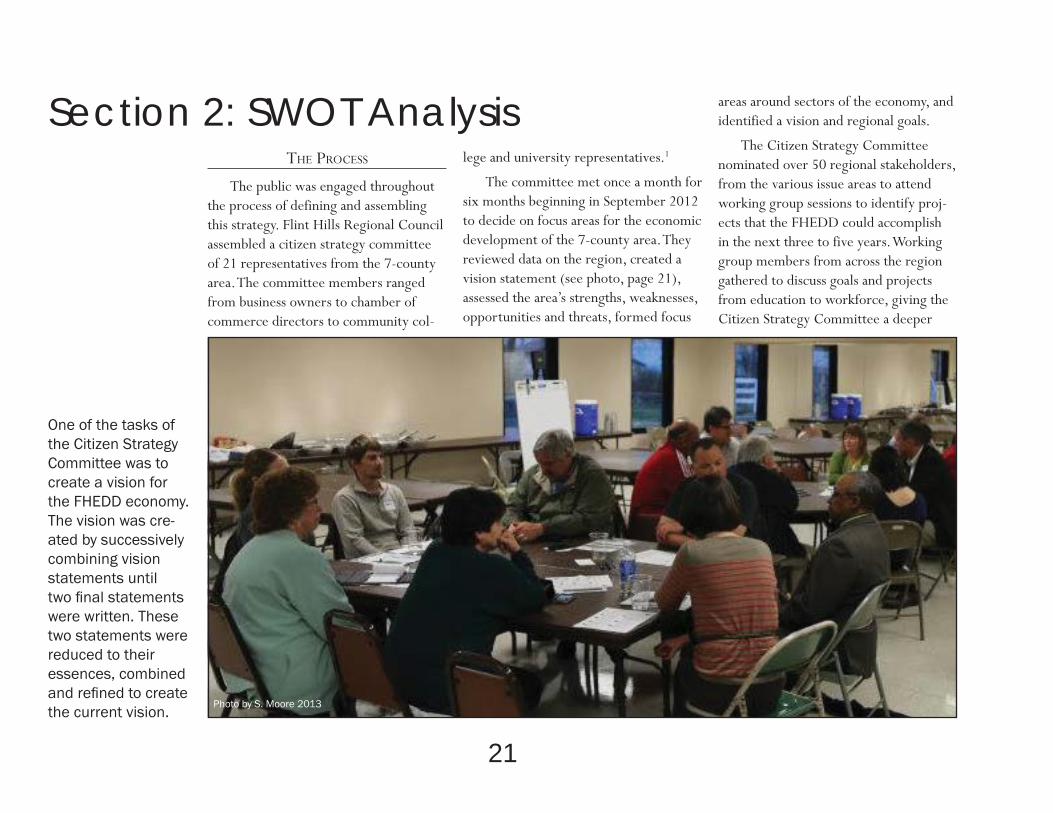
The public was engaged throughout the process of defining and assembling this strategy. Flint Hills Regional Council assembled a citizen strategy committee of 21 representatives from the 7-county area. The committee members ranged from business owners to chamber of commerce directors to community col-
lege and university representatives.1
The committee met once a month for six months beginning in September 2012 to decide on focus areas for the economic development of the 7-county area. They reviewed data on the region, created a vision statement (see photo, page 21), assessed the area’s strengths, weaknesses, opportunities and threats, formed focus
areas around sectors of the economy, and identified a vision and regional goals.
The Citizen Strategy Committee nominated over 50 regional stakeholders, from the various issue areas to attend working group sessions to identify proj-ects that the FHEDD could accomplish in the next three to five years. Working group members from across the region gathered to discuss goals and projects from education to workforce, giving the Citizen Strategy Committee a deeper
Section 2: SWOT Analysis
Photo by S. Moore 2013
One of the tasks of the Citizen Strategy Committee was to create a vision for the FHEDD economy. The vision was cre-ated by successively combining vision statements until two fi nal statements were written. These two statements were reduced to their essences, combined and refi ned to create the current vision.

22
understanding of area concerns.2
The working groups met three times over the course of two months, analyz-ing the assets and challenges of the area. They found commonalities between the many focus areas that the Citizen Strategy Committee formed and proposed proj-ects which would enhance the economy of the region on a variety of fronts.
The assessment of the area’s strengths, weaknesses, opportunities and threats (SWOT) is primarily derived from three sources. First, in the third and fourth Citizen Strategy Committee meetings a SWOT exercise was com-pleted. Second, the SWOT was sent to a randomized list of businesses, pulled proportionately from chambers of com-merce databases. Finally, the survey was also available online on the Flint Hills Regional Council website. 72 surveys were filled out either via mail, online or in meetings by people across the region. This initial SWOT analysis led to the for-mation of 9 working group topics:
The Working Groups were formed around these nine topics. One of the first
exercises each working group complet-ed was a SWOT assessment specific to that topic. The following discussion of the strengths, weaknesses, opportunities and threats is based on the cumulative work of the Citizen Strategy Committee, Working Groups and the general public.
STRENGTHS
The Strategy Committee identified the existing wealth in the region in the seven different types of capital: individ-ual, intellectual, natural, built, social, political and financial. The terminology allows us to group tangible and intangi-ble community needs together and see
• Workforce• Agriculture• Bio-agro defense• Manufacturing
• Tourism• Amenities• Education• Branding• Government
PoliticalPoliticalFinancialBuiltNaturalNaturalIntellectualSocialIndividual
Chas
e
Gea
ry
Lyon
Mor
ris
Pott
awat
omie
Rile
y
Ove
rall100
90
80
70
60
50
40
30
20
10
0 %
Strategy Committee Identifi cation of Strengths by County
The perceived strength of the FHEDD in the seven areas. The size of the bar represents the aggregation of the survey responses. Survey respondents were able to choose up to 5 areas strength or identify one area up to 5 times if that area was 5 times as strong as other areas.
Overall includes responses that did not identify a county of resi-dence.
23
where our assets are and where we can improve. Individual capitol refers to the work ethic, abilities and spirit of the pop-ulation. Intellectual capitol is the level of education and intellectual resources of community members. Natural capi-tol refers to the environment and built capitol to the buildings and infrastructure that make up our cities and towns. Social capitol is the connections we maintain with each other and our ability to work as a group. Political capitol is the influ-ence our region has in state and national politics. Finally, financial capitol is the public and private financial resources at the disposal of individuals, businesses and
institutions in the region.
The committee clearly identified the environment, or natural capitol, as the greatest strength of the region. Survey respondents were asked to select up to 5 strengths and almost all of them selected natural capitol as one of the strengths (see chart, page 22). In addition to natu-ral capitol, the committee identified in-tellectual and social capital as strengths of our Flint Hills communities. When small groups discussed the region’s top three forms of capital, inevitably it was these three, natural, intellectual and social that echoed the SWOT work and the earli-er discussions of the Committee. Our
historic main streets and ‘hard working Kansans’ are viewed as assets and most felt built and individual capital were also very valuable to the region.
There is little doubt why the natural environment is one of our strengths. The Flint Hills is one of the few prairie envi-ronments that has resisted large-scale ag-riculture. Because much of the land is too rocky to produce corn, soybeans, wheat and other row crops, much of it has been maintained as pasture, an environment very similar to what it was 200 years ago, before private land ownership.
Individual landowners have been good stewards of the environment managing their land for cattle grazing and other agricultural activities. Focus-ing solely on maintaining, studying and interpreting the prairie ecosystem, the region is fortunate to have the Tallgrass Prairie National Preserve, the Konza Prairie Biological Station, and the Flint Hills Discovery Center. In addition, the region has the two largest reservoirs, Tuttle Creek and Milford, which not only provide flood control for the region, but also provide camping, hiking, boating and other outdoor recreation opportunities as well.
The foundations of the intellectual
Strengths
Natural environment
Intellectual resources
Social cohesion
Individualism
Built environment
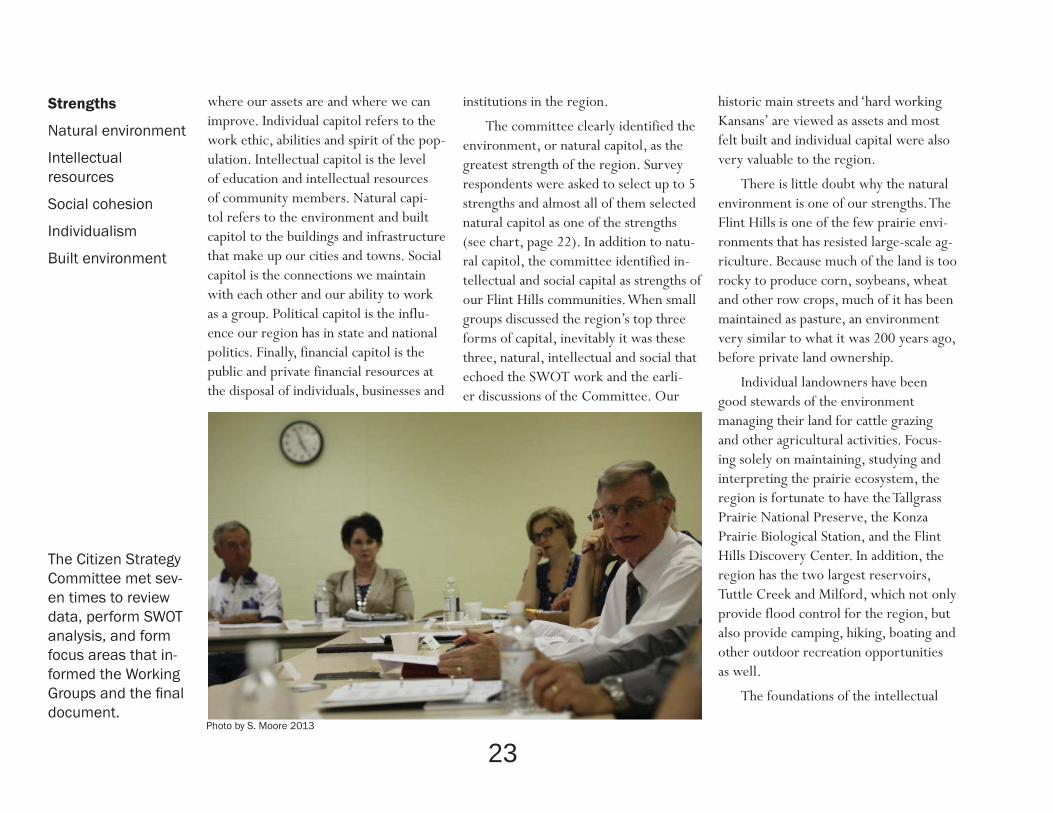
The Citizen Strategy Committee met sev-en times to review data, perform SWOT analysis, and form focus areas that in-formed the Working Groups and the fi nal document.
Photo by S. Moore 2013

24
and social capital of the region are in its institutions. The Flint Hills is fortu-nate to have the resources of Fort Riley, Kansas State University, and Emporia State University, as well as several other institutions that contribute to the intel-lectual and social life of the region. The area’s community and technical colleges, the K-12 education systems, several ex-cellent museums, a symphony, and many philanthropic and civic organizations contribute to maintaining our regional social network.
The presence of major state and federal institutions brings to the region more resources than might otherwise be here. For example, the emergency management planning and response team benefits from the leadership and skill of personnel at Fort Riley. Kansas State University is a catalyst for national enter-tainment acts and sports events with the sizable student population.
There are many benefits to living in the Flint Hills. The primary strength is the natural environment, underpinning our economy in many ways and contrib-uting to a high quality of life. The inter-connectedness of the people who live here is also a benefit we experience daily.
WEAKNESSES
Just as the SWOT work showed the strengths of our natural resources, our educational system and the many groups and organizations invested in the Flint Hills, the SWOT also highlighted our weaknesses. Political and financial capital were allocated the least proportion of the $10 share in the Citizen Strategy Com-mittee exercise. Leadership, government and tax base are also seen as weaknesses or threats to the region. One thing that the SWOT analysis did not demonstrate is the lack of awareness by most residents of our natural assets.
The political weakness was echoed in many of the working group meetings. Many people were concerned that the state government did not recognize the value of the Flint Hills for tourism and agriculture. Other groups felt that local politicians did not value education, the arts or recreational opportunities. They saw these assets as instrumental in draw-ing and keeping a skilled labor force.
Financial capital is the wealth of a region. Places with residents of high wealth often have higher rates of chari-table giving locally and both higher tax revenue and higher spending on ser-vices. Calculating wealth at a local level
is difficult because wealth consists of everything from the value of a home to securities and retirement savings. Howev-er, there are some indications of the level of private wealth in the FHEDD. Often, income is used in place of wealth. The per capita income of the region varies between $29,493 and $51,481. All the counties except Riley and Chase were below the US average of $41,560 per capita.3
Another indication of wealth is personal income from investments. Investment income is not the value of the homes, securities, and retirement savings, but the income generated by them. In 2011, the total personal income from investments was about 13 percent of all personal income, about the same as the nation as a whole.4 This indicates that while this is not a strength of the region, our weakness in financial capital may not be as severe as perceived.
We perpetually encounter Flint Hills residents who do not recognize how special this area of the country is. Only 4 percent of the tallgrass prairie remains and 75 percent of it is in the Flint Hills region.5 We are the guardians of a nation-al treasure yet many people fail to realize it. We view our natural environment as a strength yet paired with that is the weak-
Weaknesses
State-level political infl uence
Financial resources
Regional low-self esteem

25
ness that many people who live here do not know about it.
OPPORTUNITIES
There are many opportunities identified by the Strategy Committee and Working Groups. Many of those opportunities are about connecting our region to other places in the US, linking rural to urban parts of the region and bringing industries together to develop new or niche industries. While tourism plays a central part of the economy of some places in the FHEDD, there is the potential to expand tourism in many ways. In some ways this is related to the new prospects opened by the gradual movement of the baby boom generation into retirement. An additional opportuni-ty is to leverage the excess manufacturing capacity left by a declining food manu-facturing industry to boost other forms of manufacturing in the region. Finally, there is room for expansion in animal health industries with the location of the NBAF research center in the region.
There are many assets in the region that could be developed to encourage tourism. Agri-tourism is a growing trend as people look for ways to be more connected to the production of their
food. There is a growing wine industry in Kansas that has helped encourage local tourism. Kansas was a wine-producing state before prohibition in the late 19th Century. In addition, U-pick farms and other interactive farm experiences are popular here. There is an opportunity to expand on these experiences in order to highlight the agriculture of this region.
There are opportunities to experi-ence the prairie in other ways as well. Camping and hiking are already popular at state parks and could be further pro-moted. Understanding the ecosystem of the Flint Hills through first hand expe-riences on the prairie will not only be enjoyable, but will give people a greater desire to protect it.
The region’s role has been significant in our nation’s history; our region was one of the primary gateways to the West. As the south and west were settled by Europeans, this region contributed to the development of a national icon: the cowboy. Hollywood popularized cow-boys with intricately carved boots and fringed shirts, but Kansas is still home to the working cowboy with dirty brown boots and worn jeans. Our history is still so recent that the visitor can still find the flavor of the original settlements and activities.
The beauty of the region, modern health care resources, and cultural and sporting events at Kansas State University and Emporia State University are some of the things that attract retirees to the area. As the baby boom generation moves into retirement, there is an opportuni-ty to expand the institutions, activities and resources that appeal to people in their retirement. Undoubtedly the baby boom generation will redefine what it means to be retired. The responsiveness of our region to their needs could help the region expand in a new way. Some of the resources would appeal to tourists as well. Other activities, such as cultur-al opportunities would blend well with university goals.
The decline in the food manufactur-ing industry has created excess capacity in places like Emporia. However, while food manufacturing is declining, other types of manufacturing are growing. And there is plenty of room to grow.
Manufacturing is not the only in-dustry with room and opportunity for growth in the region. The seven counties are already well represented in the animal health industry. The location of NBAF in the region will contribute to the growth of that sector and bring additional exper-tise to the region. If we can encourage
Opportunities
Tourism attractions
Manufacturing capacity
Animal Health Corridor
Threats
Dependence on a small number of employers
Public sector employ-ment
Aging population
Growing urban/rural divide
26
additional private business growth, taking advantage of the specialized workforce and resources, this sector could become a thriving addition to the Animal Health Corridor.
THREATS
A frequently discussed topic through-out the meetings of both the Strategy Committee and the Working Groups was the desire to diversify the economy. The regional economy is heavily reliant on state and federal sources of income, predominantly from the region’s two state universities and military and civilian employment at Fort Riley. In addition, some parts of the region rely on trans-fer payments such as social security and state pensions. As a result, fluctuations in employment levels and state and national budgets can dramatically affect the area.
This has been illustrated most clearly in the BRAC process that occurred in the mid 2000s. The federal government terminated some overseas operations and shifted troops between bases world-wide. The net result was a gradual addition of approximately 9,000 soldiers and their families to the regional population over the past ten years. The change in pop-ulation affects housing availability and
quality. It also affects employment in the region as military spouses seek employ-ment. Should the federal government decide to reduce staff at the fort, it will lead to an oversupply of housing and a re-duction in demand for goods and services locally.
In 2013, Fort Riley is estimated to account for just under $2 billion dollars toward the regional economy.6 Federal employees are about 20 percent of the region’s workforce. This is lower than 50 years ago when they were close to 40 percent of the workforce, but they have been increasing slowly over the past 10 years from a low of about 12 percent.7
However, recent federal budget cuts will result in the reduction of nearly 1,500 soldiers and almost 500 civilian em-ployees over the next few years.8 Future levels of employment at Fort Riley will always be subject to both growth and decline based on BRAC decisions and national security obligations.
Our region is predominantly made up of small jurisdictions. Therefore this phenomenon of dependence on one company or institution is common to this area. While Fort Riley dominates em-ployment overall, within each county and town, employment is often concentrat-ed in one or a couple of relatively large
Photo by Brad Mangas bradmangasphoto.com

establishments. When a sizable portion of the workforce is employed by one entity, the problems that the institution faces become the problems of the community. Any downturn in the business can lead to a downturn in the local economy. Lyon County continues to suffer the repercus-sions of the halving of the workforce by two of the largest employers in Emporia over the course of about 5 years.
Another threat is a growing divide between urban and rural populations. This is most clearly illustrated by the me-dian age in cities and in rural areas. Parts of the largest cities in the region, Man-hattan, Junction City, and Emporia have a median age in the mid twenties while it is unusual for rural parts of the region to have a median age under 45. This aging of the population means that many small business proprietors are approaching re-tirement without a plan for transferring the business to the next generation.
In addition, as the population ages, there will be increasing reliance on nonwage sources of income such as transfers and investments. Like govern-ment employment, transfers are subject to public budgeting. In the past this form of income has been very reliable but it is becoming less reliable with public bodies defaulting on their obligations and
increasing debate over the federal role in Social Security. Likewise, investment income was drastically reduced following the 2008 recession as retirement port-folios shrank. This too has become a less reliable form of income.
We recognize that businesses fluc-tuate. Some grow, others decline as a part of the nature of competition. We want the businesses in our region to be successful and continue to grow, but we know that at times they may need to reduce their workforce or close some operations. Other institutions in the area such as Fort Riley must respond to forces outside the region. Similarly, we recog-nize that many of the threats that face rural areas stemming from the aging of the population are not within our ability to change.
Our current approach to address these threats is to work with the in-stitutions and businesses to make the adjustments as smooth and predictable as possible. Our good regional relationship with Fort Riley has allowed us to work with the fort to mitigate some of the effects of staffing fluctuations by planning for them. These relationships and avenues of communication will continue to be important for the region in the future.
REFERENCES 1 See list on the inside cover.
2 Contact FHRC for the complete list of participants.
3 US Bureau of Economic Analysis. 2011. Local Area Personal Income and Em-ployment, table CA04. Income includes all types of personal income not just income from employment. The per cap-ita income for the entire US is $41,560. The per capita income for each of the counties is Chase: $51,481; Geary: $41,409; Lyon: $29,493; Morris: $35,727; Pottawatomie: $36,131; Riley: $46,890; and Wabaunsee: $34,429.
4 US Bureau of Economic Analysis. 2011. Local Area Personal Income and Em-ployment, table CA04.
5 Kansas: Tallgrass Prairie National Preserve. The Nature Conservancy. Website, accessed January 14, 2014 at http://www.nature.org/ourinitiatives/regions/northamerica/unitedstates/kansas/placesweprotect/tallgrass-prai-rie-national-preserve.xml
6 Plans, Analysis and Integration Office (2012). Economic Impact Summary: 1 Oct 11 - 30 Sep 12, DSN 856-2022 Distrib-uted by Fort Riley Public Affairs Office.
7 US Bureau of Economic Analysis. Local Area Personal Income and Employment, Table CA25 and CA25N, 1969-2011.
8 Personal communication with Fort Riley Garrison Command Office.
27

28Photo by Brad Mangas bradmangasphoto.com
THE GOALS
One of the products of the Commu-nity Strategy Committee meetings was a vision for the FHEDD. The committee worked through several drafts collabora-tively and finalized a vision that is unique to the area and embodies the partici-pants’ hope for the future. From this vision the committee identified five goals for the region:
• Collaborate between participating governments, area institutions and other organizations with a stake in the Flint Hills.
• Brand the area to reflect the rich nat-ural and social history of the region.
• Promote the region to encourage
regional and national tourism.
• Sustain innovative businesses, both new and existing in the region.
• Educate the population well from early childhood through college and beyond.
The actions we have identified as the steps to take over the next three to five years each further multiple goals. Collaboration is central to all that we are planning. Branding, marketing and promoting the region will help to sustain and encourage business development in the region. And education will not only help children develop into creative and productive workers, but will also help workers transition between industries and help budding entrepreneurs take the
next step in developing their business.
These goals were further elaborated by the working groups. They identified priority projects for the region to achieve these goals. In this document, we focused on programs and projects that we could complete or initiate in the next five years. As we accomplish our goals we will evaluate the program and the process and revisit our action plan.
Collaboration has been a strength of this region. We aim to continue and deepen collaboration between local governments, institutions, and residents. There are many ways we can enhance collaborative efforts.
We have a rich natural and cultural heritage in the Flint Hills. We do not always remember how fortunate we are to be living in such a unique place. We need to create a more cohesive identity for the region that will not only remind us of what a wonderful place this is, but help people outside the region under-stand who we are and what the Flint Hills is like. This identity will not be forged overnight, but will be a process of edu-cation and communication. To begin this process, we plan to work with The Flint Hills Tourism Coalition to create a brand that can be used in marketing materials
29
OUR VISION
A highly educated populace, working in an evolving knowledge-based economy,
living in the rich heritage of the Flint Hills ecosystem.
Section 3: Strategic Direction
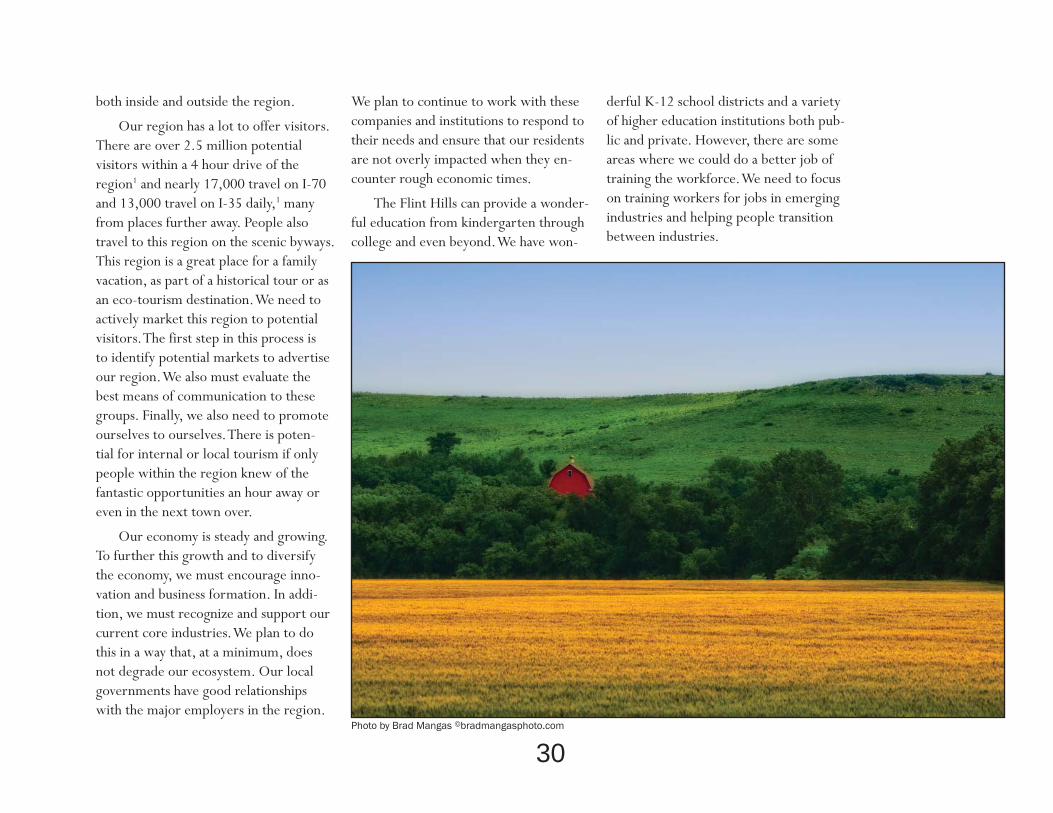
both inside and outside the region.
Our region has a lot to offer visitors. There are over 2.5 million potential visitors within a 4 hour drive of the region1 and nearly 17,000 travel on I-70 and 13,000 travel on I-35 daily,1 many from places further away. People also travel to this region on the scenic byways. This region is a great place for a family vacation, as part of a historical tour or as an eco-tourism destination. We need to actively market this region to potential visitors. The first step in this process is to identify potential markets to advertise our region. We also must evaluate the best means of communication to these groups. Finally, we also need to promote ourselves to ourselves. There is poten-tial for internal or local tourism if only people within the region knew of the fantastic opportunities an hour away or even in the next town over.
Our economy is steady and growing. To further this growth and to diversify the economy, we must encourage inno-vation and business formation. In addi-tion, we must recognize and support our current core industries. We plan to do this in a way that, at a minimum, does not degrade our ecosystem. Our local governments have good relationships with the major employers in the region.
We plan to continue to work with these companies and institutions to respond to their needs and ensure that our residents are not overly impacted when they en-counter rough economic times.
The Flint Hills can provide a wonder-ful education from kindergarten through college and even beyond. We have won-
derful K-12 school districts and a variety of higher education institutions both pub-lic and private. However, there are some areas where we could do a better job of training the workforce. We need to focus on training workers for jobs in emerging industries and helping people transition between industries.
30Photo by Brad Mangas bradmangasphoto.com
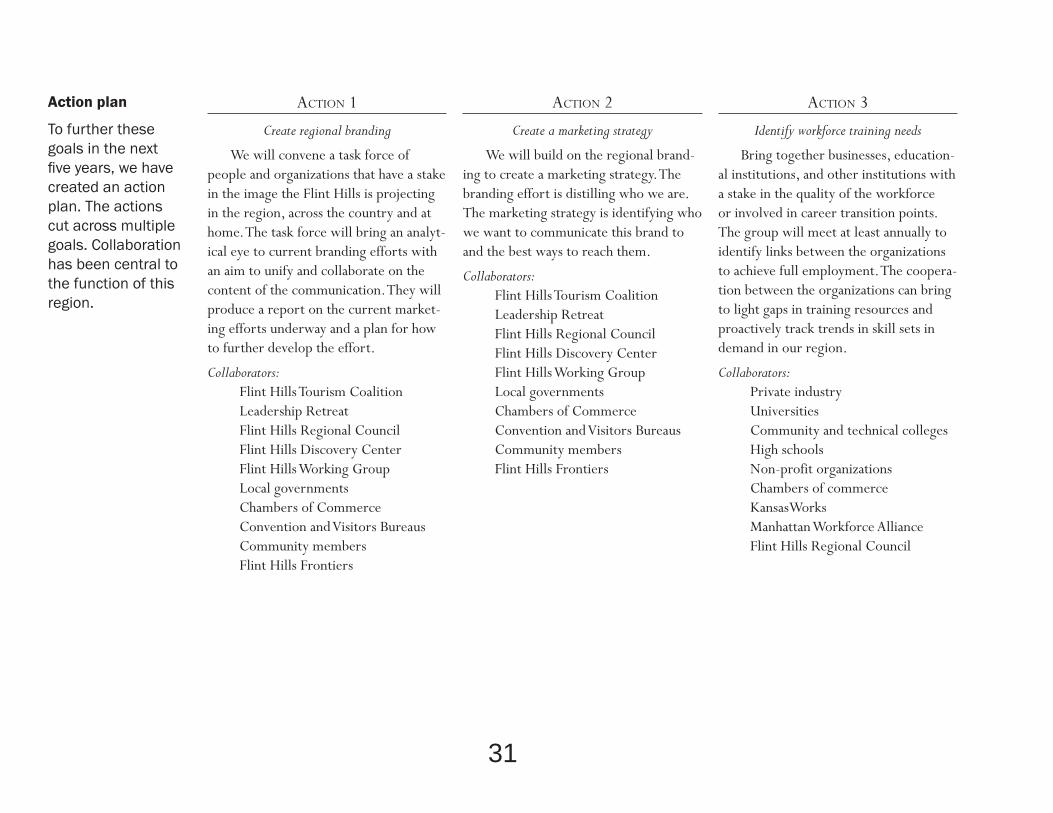
ACTION 1
Create regional branding
We will convene a task force of people and organizations that have a stake in the image the Flint Hills is projecting in the region, across the country and at home. The task force will bring an analyt-ical eye to current branding efforts with an aim to unify and collaborate on the content of the communication. They will produce a report on the current market-ing efforts underway and a plan for how to further develop the effort.
Collaborators:Flint Hills Tourism CoalitionLeadership RetreatFlint Hills Regional CouncilFlint Hills Discovery CenterFlint Hills Working GroupLocal governmentsChambers of CommerceConvention and Visitors BureausCommunity membersFlint Hills Frontiers
ACTION 2
Create a marketing strategy
We will build on the regional brand-ing to create a marketing strategy. The branding effort is distilling who we are. The marketing strategy is identifying who we want to communicate this brand to and the best ways to reach them.
Collaborators:Flint Hills Tourism CoalitionLeadership RetreatFlint Hills Regional CouncilFlint Hills Discovery CenterFlint Hills Working GroupLocal governmentsChambers of CommerceConvention and Visitors BureausCommunity membersFlint Hills Frontiers
ACTION 3
Identify workforce training needs
Bring together businesses, education-al institutions, and other institutions with a stake in the quality of the workforce or involved in career transition points. The group will meet at least annually to identify links between the organizations to achieve full employment. The coopera-tion between the organizations can bring to light gaps in training resources and proactively track trends in skill sets in demand in our region.
Collaborators:Private industryUniversitiesCommunity and technical collegesHigh schoolsNon-profit organizationsChambers of commerceKansasWorksManhattan Workforce AllianceFlint Hills Regional Council
31
Action plan
To further these goals in the next fi ve years, we have created an action plan. The actions cut across multiple goals. Collaboration has been central to the function of this region.

ACTION 4
Initiate a tallgrass entrepreneurship education curriculum
To help encourage the innovation and the growth of new businesses, we will begin a conversation about developing a curriculum about entrepreneurship. The curriculum will address the educa-tional needs of people from kindergarten through college and beyond. There are many existing resources. One of the first steps is bringing together people current-ly working on related efforts.
Starting a business is an inherently risky activity and we expect many will fail for a variety of reasons. Even suc-cessful businesses begin at a high cost to the entrepreneur in lost income, health care and time. We will develop a plan for supporting people through the uncertain formative years to encourage more peo-ple to take those risks.
Collaborators:UniversitiesCommunity and technical collegesPrivate industryK-12 schoolsChambers of commerceKansas Department of CommerceFlint Hills Regional CouncilSmall Business Administration
ACTION 5
Expand transportation options in our region
To further connect th populace be-tween the cities in our region, between our region and larger metropolitan areas and between the rural and urban areas of our region, we will continue to look for options to improve public transportation. We will identify linkages between public transit providers to create a network of transit service through out the region and to destinations outside the region. This will become ever more urgent in the coming years as the baby boomers move into retirement. As people age, health problems, reduced reflexes and other issues can prevent same driving. Imple-menting transportation options that will help people get around our region will not only help our aging communities, but it will also enhance access to employment and tourism.
Collaborators:Flint Hills Area Transport. AgencyLyon County Area TransitFlint Hills Regional CouncilKansas Dept.of TransportationLocal governmentsUniversitiesFort RileyCommunity and technical colleges
ACTION 6
Streamline the business attraction and retention process
We have a patchwork of business attraction and retention strategies across our region. We do not have a holistic understanding of the site availability or the desired site characteristics for various industries. In addition, the incentives available to businesses across our re-gion are not well advertised. There is an opportunity to create a comprehensive, integrated map of the opportunities avail-able in our region and to align our efforts and incentives to them.
Collaborators:Local governmentsChambers of commerceEconomic development organiza-tions
32

ACTION 7
Create a Welcome Center
Our region is rich with recreation opportunities yet we do not have a portal that can manage the information. From the Flint Hills Discovery Center to the hiking trails that traverse our region to the historic sites and annual festivals, there is a wealth of “stuff to do” across the region. Yet, even some long-time residents do not know all of the opportu-nities in their own town or a short drive away. We will develop a physical Welcome Center to welcome people to our area and help them navigate the variety of opportunities that at peoples’ fingertips.
Collaborators:Flint Hills Tourism CoalitionLeadership RetreatFlint Hills Regional CouncilFlint Hills Discovery CenterFlint Hills Working GroupLocal governmentsChambers of commerceConvention and visitors bureausCommunity members
ACTION 8
Create a site selection tool
Jurisdictions across our region have industrial and commercial land available for development and redevelopment. For potential businesses to access this infor-mation, they must contact several differ-ent organizations and the data is often in a variety of formats. We will develop a tool that will not only help local govern-ments in our region know what land is available, but will help potential business-es navigate the information.
Collaborators:Local governmentsChambers of commerceEconomic devel. organizations
ACTION 9
Flint Hills High Five
We have a rich cultural heritage. Much of that heritage is in jeopardy and much of it is due to the trends many feel are beyond our control: shifting demo-graphics, changing agricultural sys-tems, and global economics. Yet, a good foothold could be gained through stem-ming the tide of rural wealth transfer by giving a small portion back to those rural communities that gave so much to the Kansans that grew up there. We would like to develop a High Five program, where people who grew up in the Flint Hills would commit to giving 5 percent of their estates to our rural communities to help fund the next generation of rural entrepreneurs. This program would be designed to complement current efforts of area foundations to raise money.
Collaborators:Regional community foundationsFlint Hills Regional Council
33
RECOMMENDED ACTIONS
Action 10. Create a prime site program
In coordination with th regional site selection tool and commercial and the industrial land inventory, we will create a “shovel-ready” site certification program that identifies the top capacities necessary for the targeted industry sectors.
Action 11. Succession planning
The rural parts of our region face a growing challenge as populations decline and local economies shrink. Many of the businesses that became the cornerstones of our communities now face closure due to a failure to find someone to continue the practice. The University of Kansas’s Red Tire succession planning and part-nering system is one example of how succession training might be developed to help rural communities in the future. We will investigate models for succession training in rural areas and evaluate the approaches for our region.
Action 12. Flint Hills Opportunities Network
The Kansas Leadership Center sup-ports a wide variety of innovative lead-ership training for civic leaders across
Kansas, yet none are focused specifically on rural leadership in a changing econ-omy. In fact, none of the programs are dedicated to developing partnerships necessary in communities for future economic success. We will work with Kansas Cooperative Extension Service and Department of Commerce to help rural communities identify best practices and innovative programs for leadership training and find ways to apply them in the Flint Hills communities.
Action 13. Kansas Food Labs
Local food systems are redefining value-added production models. Work with the University Extension, the State Department of Commerce, and Com-munity Colleges to develop regional- or county-level Kansas certified Test Kitch-ens that act as entrepreneurial incubators for foodies. These kitchens could be hubs for educating and training future entre-preneurs while supplying entrepreneur-ial support towards meeting state and national code standards in production.
REFERENCES
1 The combined population of the Kansas City, Tulsa, and Omaha metropolitan areas is 2.5 million (Census 2010, table P1). This total does not include the pop-ulation of people who live outside these metro areas, but still within an easy drive of the FHEDD.
2 State Traffic Map, Kansas Department of Transportation, March 2013.
34

Our goal with this plan is to improve the economy in all parts of the Flint Hills. We have created a vision of the future we are working toward and nine actions that will help us achieve it. We have divided this section into measure-ments of our vision so we can track how we are progressing toward the future we are planning for. The second part of this section is measurements of each of the nine primary actions. Any one action on its own will not achieve the vision so the overarching measurements are not appropriate. However, we still need to be able to measure our progress on these actions.
MEASURES OF THE VISION
We plan to continue to monitor the overall health of the region’s economy at the regional scale, but also disaggregated to the county or sub-county level. We will compare these measures to national, state, and regional averages.
We are always paying attention to a variety of economic indicators and track them on our Dashboard. In addition to common measures, we have identified 4 measures that reflect our vision of the
region. These measures indicate the cur-rent state of our vision of the Flint Hills. While we are not necessarily working to change the levels of the measures direct-ly, we feel these indicators demonstrate the overall achievement of our vision. One measure will not tell us everything so we have created categories with at least two measures that we can contrast for a richer understanding of the subject. The four categories are:
Educational achievement
Industry mix
Historic preservation
Land stewardship
Educational Achievement. The first four words of our vision are “A highly edu-cated populace.” Education at all levels is something we value in the Flint Hills. We are currently more educated than the rest of the country and we would like to con-tinue to be at the forefront of knowledge generation and dissemination.
Measure 1. Percent of the population age 25 and over at four levels of educa-tion: less than a high school diploma, high
school diploma, bachelor’s degree, and more than a bachelor’s degree. (measure at FHEDD level and at county level)
Measure 2. Median state standardized test scores of fourth graders in FHEDD school districts. (measure at FHEDD level and at school district level)
Measure 3. SAT and ACT scores of students in FHEDD school districts. (measure at FHEDD level and at school district level)
Measure 4. Enrollment in certificate and non-degree programs. (measure at FHEDD level)
Measure 5. Enrollment in degree programs (measure at FHEDD level)
Industry Mix. Increasing the diversity of industries is a goal of all parts of the FHEDD. We support the current busi-nesses in the region and hope to enhance the economic climate by encouraging entrepreneurship in the region.
Measure 1. Employment in private industries by industry as well as federal military and civilian employment and state and local government employment. (measure at the FHEDD level, county level, and rural/urban)
Measure 2. Number of private
35
Section 4: Evaluation Framework
business establishments with 4 or fewer employees and self employed. (measure at the FHEDD level, county level, and rural/urban)
Measure 3. Number of new Kansas State Tax Identification numbers issued in the FHEDD. (measure at the FHEDD level, county level, and rural/urban)
Historic Preservation. Our heritage is important to us in the Flint Hills. While we continue to move forward, we strive to always honor our history and recog-nize the achievements of past genera-tions. History comes in many forms, from written and oral stories passed down through our communities, to the buildings in our towns and the civic organizations we maintain. We look for ways to bring the past into our current conversations, making the past relevant and the future rooted.
Measure 1. Buildings on the Reg-ister of Historic Kansas Places and the National Register of Historic Places. (measure at the FHEDD level, county level and municipal level)
Measure 2. Amount of historic tax credits used for the rehabilitation of old and historic buildings. (measure at the FHEDD level)
Land Stewardship. The natural envi-ronment and ecosystem is the lifeblood of this region. To continue to enjoy the high quality of life we have in the Flint Hills we must remain good steward of the land.
Measure 1. Percent of land dedi-cated to agriculture. (measure at the FHEDD level and county level)
Measure 2. Percent of urbanized land. (measure at the FHEDD level and county level)
Measure 3. Percent of energy use from renewable sources (measured at the FHEDD level and municipal level)
Measure 5. Water usage overall, per capita and per acre. (measure at the FHEDD level and rural/urban)
Overall Economic Health. In addition to these measures related specifically to our vision, we will also monitor the overall economic health of the FHEDD through 4 additional measures.
Measure 1. Employment, unem-ployment and the size of the labor force. (measure at the FHEDD level, county level, and rural/urban)
Measure 2. Employment by industry (FHEDD level)
Measure 3. Median household income (measured at FHEDD level, county level, and rural/urban)
Measure 4. Median value of own-er-occupied homes and median gross rent (measured at FHEDD level, county level, municipal level and rural/urban)
PROGRESS ON ACTIONS
Not only are we interested in mea-suring the general economic health of the region, but we are planning to mea-sure our progress on our nine primary actions every year. This will allow us to monitor where we are doing well and where we are lagging behind. The frame-work will also help us to assess whether an action item has become obsolete or if it needs to be altered in some way before the end of the five-year duration of the plan.
The measures are organized un-der the action item they apply to. They include measures of progress toward the goal of the action as well as measures of whether and to what degree the action has been achieved.
Action 1. Create regional branding
Progress. We will demonstrate
36
37
progress on this action by identifying a person or a couple of people to lead the task force. These champions will contact the relevant organizations identified as potential collaborators to find represen-tatives that are willing to serve as part of the task force. The group will establish a structure and a regular meeting schedule.
Achievement. We will know we have achieved this action when the task force meets as scheduled, has productive con-versations and creates a FHEDD brand.
Outcome:FHEDD brand
Action 2. Create a marketing strategy
Progress. We will demonstrate prog-ress on this action by identifying a person or a couple of people to lead the creation of a strategy. These champions will work with the people who have created the re-gional brand to identify possible markets and ways to communicate our brand to the market.
Achievement. We will know we have achieved this action when the task force meets as scheduled, has productive conversations and produces a marketing strategy that has broad support and com-mitment to implementation.
Outcome:
Marketing strategyBrand appears in print and online tourism publications
Action 3. Identify workforce training needs
Progress. We will demonstrate prog-ress on this action by identifying a person or a couple of people to lead the group. These leaders will contact the organiza-tions identified as potential collaborators to find representatives that are willing to serve on the board. The group will es-tablish a structure and a regular meeting schedule. They will identify an area or a couple of areas to focus their efforts.
Achievement. We will know we have achieved this action when the group has begun to track trends in skill sets in de-mand in our region and identified gaps in training resources.
Outcome:A method of tracking skill setsReport or other communication on training needsIncreased enrollment in technical training programs
Action 4. Initiate a tallgrass entrepreneur-ship education
Progress. We will demonstrate
progress on this action by identifying a person or a couple of people to lead a group of people focused on this issue. These leaders will contact the organiza-tions identified as potential collaborators to find representatives that are willing to contribute to the conversation. The group will establish near and long term outcomes for entrepreneurship educa-tion.
Achievement. We will know we have achieved this action when the group has met and the curriculum appropriate for the identified level of education is devel-oped in collaboration with the appropri-ate organizations.
Outcome:Entrepreneurship curriculum
Action 5. Expand transportation options in our region
Progress. We will demonstrate prog-ress on this action through the identified collaborators engaging in formal or informal conversations about transporta-tion needs, resources, and possibilities.
Achievement. We will know that we have achieved this action when collabora-tors have expanded geographic reach and increased ridership on buses.
Outcome:
38
Expanded geographic reachIncreased ridership
Action 6. Streamline the business attrac-tion and retention process
Progress. We will demonstrate progress on this action by convening the identified collaborators. The collabora-tors will identify activities that overlap that could be more comprehensively addressed.
Achievement. We will know we have achieved this action when the difficult steps in the system have been addressed by the appropriate party. The outcomes from this action will be specific to the needs identified, but will involve alter-ing some part of the business attraction and retention process to respond to needs at a regional level.
Outcome:Improved business attraction & retention processMore businesses in dialog with economic development leaders
Action 7. Create a Welcome Center
Progress. We will demonstrate progress on this action by convening the identified collaborators and creating a plan for the creation of both the physical
and virtual center.
Achievement. We will know we have achieved this action when a Welcome Center has been established with a stable management structure.
Outcome:Physical Welcome Center
Action 8. Create a site selection tool
Progress. We will demonstrate prog-ress on this action by bringing together the multiple parties with knowledge of potential land and buildings for com-mercial and industrial development. We will identify the land region-wide and create a plan for communicating this information to potential businesses in a way that can be continually updated.
Achievement. We will know we have achieved this action when we have an accessible and useful site selection tool in place with an inventory of industrial and commercial land and a process for updating and maintaining it.
Outcome:Site selection tool
Action 9. Flint Hills High Five
Progress. We will demonstrate prog-ress on this action by bringing together
the area foundations to collaborate on a fundraising campaign that would target those with roots in the area.
Achievement. We will know we have achieved this action when the campaign is underway and foundations in the area are seeing an increase in donations and bequests.
Outcome:Regional fundraising campaignIncreased funding of Flint Hills foundations

January 2014Flint Hills Regional Council
885 Marshall Loop, Fort Riley, Kansas 66442855-785-FHRC • www.fl inthillsregion.org