New Hampshire’s Labor Market · New Hampshire’s Labor Market ... This workforce product was...
21
Transcript of New Hampshire’s Labor Market · New Hampshire’s Labor Market ... This workforce product was...


New Hampshire’s Labor Market
In Review2017 Economic Analysis Report
State of New HampshireChristopher T. Sununu, Governor
New Hampshire Employment SecurityGeorge N. Copadis, Commissioner
Economic and Labor Market Informati on BureauBruce R. DeMay, Director
Spring 2017

Acknowledgments
The following New Hampshire Employment Security staff were instrumental in producing this publicati on:
Economic and Labor Market Informati on Bureau
Annett e Nielsen, Economist
Cover design and pre-press layout, and web publishing
Deborah J. Dunn, Informati onal/Web Site Representati ve
Reproducti on Services
Douglas Hamer, Supervisor of Reproducti on
Mark Robinson, Design Draft er
For further informati on about this analysis contact:
Annett e Nielsen (603) 229-4427Annett [email protected]
Economic and Labor Market Informati on BureauNew Hampshire Employment Security45 South Fruit StConcord, New Hampshire 03301(603) [email protected]/elmi
This workforce product was funded by a grant awarded by the U.S. Department of Labor’s Employment and Training Administrati on. The product was created by the recipient and does not necessarily refl ect the offi cial positi on of the U.S. Department of Labor. The Department of Labor makes no guarantees, warranti es, or assurances of any kind, express or implied, with respect to such informati on, including any informati on on linked sites and including, but not limited to, accuracy of the informati on or its completeness, ti meliness, usefulness, adequacy, conti nued availability, or ownership. This product is copyrighted by the insti tuti on that created it. Internal use by an organizati on and/or personal use by an individual for non-commercial purposes is permissible. All other uses require the prior authorizati on of the copyright owner.

Table of Contents
Introducti on . . . . . . . . . . . . . . . . . . . . . . . . . . . . . . . . . . . . . 1
The Employment Situati on in New Hampshire – A ti ght labor market. . . . . . 1
Nonfarm employment . . . . . . . . . . . . . . . . . . . . . . . . . . . . . . . . 2
Unemployment rate – How low can New Hampshire’s rate go? . . . . . . . . . 6
How can New Hampshire’s labor market widen its labor force base? . . . . . 7
Is there sti ll slack in the labor market? Encouraging higher levels of labor market intensity . . . . . . . . . . . . . . . . . . . . . . . . . . . . . . . . 8
Not in the labor force by County . . . . . . . . . . . . . . . . . . . . . . . . . . 11
Three parameters of community economic development (Covered employment, Resident employment and Populati on) . . . . . . . . . 14
Conclusion . . . . . . . . . . . . . . . . . . . . . . . . . . . . . . . . . . . . . . 16

New Hampshire’s Labor Market in ReviewInformati on TecOccupati ons in New Hamps Spring 2017
New Hampshire Employment Security Economic and Labor Market Informati on Bureauwww.nhes.nh.gov/elmi Page 1Page 1
he Federal Reserve raised the interest rate in mid-June for the second ti me in 2017 despite a below-expectati ons infl ati on rate, but referencing a strong labor market overall with a falling unemployment rate and projected GDP growth at 2.2 percent.
New Hampshire’s economy is showing strength as well. From 2015 to 2016, GDP in New Hampshire increased by 3.0 percent, the fastest among the states in New England.
The unemployment rate was 2.9 percent in May 2017 and has been below 3.0 percent for over a year. This has raised concerns among businesses regarding where additi onal workers are going to come from. The low unemployment rate is a reversal of the labor market trend from a couple of years ago, where there were many unemployed persons and few openings available. Now employers are feeling confi dent and ready to expand their businesses1 but are increasingly fi nding it harder to fi nd workers. In certain health care industries, such as long term care faciliti es, a labor shortage has led the New Hampshire Legislature to pass bills trying to ease the regulatory licensing burden at entry for hiring.2 The conditi on of the current labor market in New Hampshire requires employers to “think outside the box” to fi nd ways to att ract and hire additi onal labor.
The Employment Situati on in New Hampshire – A ti ght labor marketThe Employment Situati on in New Hampshire – A ti ght labor market
The New Hampshire labor market has steadily been improving since the beginning of 2010. Nonfarm jobs have grown from 621,200 in January 2010 to 674,700 in April 2017, a gain of 53,500 jobs. Resident employment has similarly grown over the period, with about 37,500 more residents holding jobs. In this recovery period, nonfarm jobs have been growing at a faster rate than resident employment.3 On the other hand, during the prior downturn, nonfarm jobs declined faster than resident employment. Currently, the two ti me series are closer together than prior to the Great Recession. As an economic measurement of labor market conditi ons, the nonfarm jobs count is considered the primary indicator, so its current strength in New Hampshire is a positi ve sign. Faster growth in nonfarm jobs relati ve to resident employment might indicate that an increased number of workers hold multi ple jobs or more out-of-state residents commute into New Hampshire for work.
The labor force has followed a somewhat diff erent patt ern. Yet, over the period January 2010 to May 2017, the labor force has increased by about 13,000 residents. The diff erence between the civilian labor force and resident employment equals the number of New Hampshire residents that are unemployed. The level of unemployment has diminished from about 46,400 in January 2010 to 21,920 in May 2017. When the resident employment level grows closer to total labor
1 According to the Granite State Poll released May 23,2017, “Confi dence in the New Hampshire economy remains near record highs.” The BIA Report on Consumer Confi dence. The University of New Hampshire Survey Center, accessed on June 15, 2017 at: htt p://cola.unh.edu/sites/cola.unh.edu/fi les/research_publicati ons/gsp2017_spring_ccon052317.pdf2 DeWitt , Ethan. “Bills to address New Hampshire nursing shortage clear State House.” June 13, 2017. The Keene Senti nel. Accessed on June 21, 2017 at: htt p://www.senti nelsource.com/news/local/bills-to-address-new-hampshire-nursing-shortage-clear-statehouse/ arti cle_772c60be-9f45-50eb-8e1c-f8f0e5f6f280.html 3 Nonfarm employment is a monthly esti mate of the number of payroll jobs (full and part –ti me) located in New Hampshire. Self-employment is excluded from this measure. Resident employment is the number of employed persons residing in New Hampshire. This employment measure includes these self-employed and includes New Hampshire residents employed out of state.
TT

New Hampshire Employment Security Economic and Labor Market Informati on BureauPage 2Page 2 www.nhes.nh.gov/elmi
New Hampshire’s Labor Market in ReviewSpring 2017
force, the unemployment rate is falls. Economists argue that there always will be a certain level of unemployment, someti mes referred to as the “natural rate” of unemployment.Large improvement in terms of job creati on in the labor market, without a similarly sizeable response in the size of the labor force, puts pressure on the number of available workers. The balance in the labor market has shift ed from an oversupply of workers to a potenti al shortage of workers. Additi onal sources of labor that might be available, such as workers not in the labor force, workers in the surrounding states (increase the number of out-of-state residents commuti ng to New Hampshire for work or retaining New Hampshire residents that currently are commuti ng out-of-state), and internati onal migrants.
The number of employed residents has grown closer to total labor force and more than 50,000 nonfarm jobs have been created since January 2010
Nonfarm employment Nonfarm employment
There has been an upti ck in the rate at which nonfarm jobs have been created in the New Hampshire economy. As New Hampshire was coming out of the Great Recession (2007-2009), over-the-year gains in nonfarm employment were modest, averaging less than 5,000 jobs annually. But over the last couple of years, these over-the-year gains have averaged around 12,000 jobs, more than double the number of gains in the earlier phase. These current job gains have helped the state’s economy overall, creati ng a more opti misti c environment among
600,000
620,000
640,000
660,000
680,000
700,000
720,000
740,000
760,000
Jan-
08
May
-08
Sep-
08
Jan-
09
May
-09
Sep-
09
Jan-
10
May
-10
Sep-
10
Jan-
11
May
-11
Sep-
11
Jan-
12
May
-12
Sep-
12
Jan-
13
May
-13
Sep-
13
Jan-
14
May
-14
Sep-
14
Jan-
15
May
-15
Sep-
15
Jan-
16
May
-16
Sep-
16
Jan-
17
May
-17
Empl
oym
ent/
Labo
r fo
rce
-Sea
sona
lly a
djus
ted
Nonfarm Jobs
Employment
Civilian Labor ForceJanuary 2010: 621,200January 2010: 621,200
Numberof unem-ployed
Source: Local Area Unemployment Statistics, Current Employment Statistics, Economic and Labor Market Information Bureau

New Hampshire’s Labor Market in ReviewInformati on TecOccupati ons in New Hamps Spring 2017
New Hampshire Employment Security Economic and Labor Market Informati on Bureauwww.nhes.nh.gov/elmi Page 3Page 3
4 op. cit. Granite State Poll
business owners,4 who are now hopeful to expand operati ons. However, businesses might increasingly face a labor market with few workers available. In order to sustain this current level of job growth, the labor force will have to be expanded.
Nonfarm job growth has started to pick up over the last couple of years
In order to understand what sectors are contributi ng to total job growth, the employment level for all industry sectors were compared to January 2010 — the lowest employment level coming out of the 2007-2009 recession. In comparing seasonally adjusted employment data from January 2010 to May 2017, all sectors have gained employment, an indicator of a broad-based expansion of the New Hampshire economy. Overall, total nonfarm employment gained 59,700 private jobs between January 2010 and May 2017, equivalent to an average monthly gain of 670 private jobs. The sectors contributi ng the most jobs were Accommodati on and food services, Administrati ve and support and waste management services, Health care and social assistance, and Professional, scienti fi c and technical services.
0
2,000
4,000
6,000
8,000
10,000
12,000
14,000
16,000
18,000Ja
n-11
Mar
-11
May
-11
Jul-1
1
Sep-
11
Nov
-11
Jan-
12
Mar
-12
May
-12
Jul-1
2
Sep-
12
Nov
-12
Jan-
13
Mar
-13
May
-13
Jul-1
3
Sep-
13
Nov
-13
Jan-
14
Mar
-14
May
-14
Jul-1
4
Sep-
14
Nov
-14
Jan-
15
Mar
-15
May
-15
Jul-1
5
Sep-
15
Nov
-15
Jan-
16
Mar
-16
May
-16
Jul-1
6
Sep-
16
Nov
-16
Jan-
17
Mar
-17
May
-17
Empl
oym
ent
chan
ge
Over-The-Year Change (TotalNonfarm - Not Seasonally Adjusted)
Source: Current Employment Statistics, Economic and Labor Market Information Bureau

New Hampshire Employment Security Economic and Labor Market Informati on BureauPage 4Page 4 www.nhes.nh.gov/elmi
New Hampshire’s Labor Market in ReviewSpring 2017
3,200
600
2,000
800
3,200
900
2,900
9,000
2,400
6,700
4,700
6,700
9,300
6,200
0
300
500
700
900
1,100
1,200
1,400
1,500
2,200
2,300
3,400
3,500
4,000
Retail Trade
Information
Wholesale Trade
Arts, Entertainment, and Recreation
Other Services
Finance and Insurance
Manufacturing
Administrative and Support and Waste ManagementServices
Transportation, Warehousing, & Utilities
Professional, Scientific, and Technical Services
Educational Services
Health Care and Social Assistance
Accommodation and Food Services
Construction
Since January 2015
Since January 2010
Source: Current Employment Statistics, Economic and Labor Market Information Bureau
But as described, there has been an upti ck in job growth more currently, so a second comparison was made between January 2015 and May 2017, seasonally adjusted. Over this more recent ti meframe since January 2015, New Hampshire gained 24,100 private jobs in total, which can be translated to an average monthly gain of 830 private jobs. The three sectors contributi ng the most to the job growth in the more current history were Constructi on, Accommodati on and food services, and Healthcare and social assistance.
Job growth by sector (nonfarm employment, seasonally adjusted)
Employment in both Health care and social assistance and Accommodati on and food services has been strong since January 2010. But over the last two years, the job growth in each of these two sectors has accelerated. As the economy improved slowly, though steadily, it seemed that business and consumer confi dence fi nally improved enough to spur improvement in other sectors of the economy. This might explain the current job growth in Constructi on. From January 2015 to May 2017, Constructi on gained 4,000 jobs, reaching 27,700 jobs in May 2017 — a level of employment not experienced in this sector since May 2007.

New Hampshire’s Labor Market in ReviewInformati on TecOccupati ons in New Hamps Spring 2017
New Hampshire Employment Security Economic and Labor Market Informati on Bureauwww.nhes.nh.gov/elmi Page 5Page 5
0
10,000
20,000
30,000
40,000
50,000
60,000
70,000
80,000
90,000
100,000
Jan-
10
May
-10
Sep-
10
Jan-
11
May
-11
Sep-
11
Jan-
12
May
-12
Sep-
12
Jan-
13
May
-13
Sep-
13
Jan-
14
May
-14
Sep-
14
Jan-
15
May
-15
Sep-
15
Jan-
16
May
-16
Sep-
16
Jan-
17
May
-17
Non
farm
em
ploy
men
t (Se
ason
ally
Adj
uste
d)
Retail Trade
Health Care and SocialAssistance
Manufacturing
Accommodation and FoodServices
Administrative and Supportand Waste ManagementServices
Professional, Scientific, andTechnical Services
Educational Services
Construction
Arts, Entertainment, andRecreation
Source:Current Employment Statistics, Economic and Labor Market Information Bureau
The initi al employment gains (since January 2010) in Retail trade stalled over the last couple of years. As consumers are growing more comfortable with their mobile gadgets and the internet, online shopping has started to take hold. Some of this new economic acti vity associated with online shopping is captured by employment growth in Transportati on, warehousing and uti liti es, gaining 1,500 jobs since January 2015.
When comparing the employment levels for each sector, Healthcare and social assistance might soon employ more workers than Retail trade. Modest employment gains in Manufacturing since January 2010 ensured that this sector remained New Hampshire’s third largest sector, accounti ng for about 68,000 jobs in May 2017.
Seasonally adjusted Nonfarm employment level by selected sectors

New Hampshire Employment Security Economic and Labor Market Informati on BureauPage 6Page 6 www.nhes.nh.gov/elmi
New Hampshire’s Labor Market in ReviewSpring 2017
0.0
1.0
2.0
3.0
4.0
5.0
6.0
7.0
8.0
9.0
66.0
67.0
68.0
69.0
70.0
71.0
72.0
73.0
74.0
75.0
Jan
198
5 Ja
n 1
986
Jan
198
7 Ja
n 1
988
Jan
198
9 Ja
n 1
990
Jan
199
1 Ja
n 1
992
Jan
199
3 Ja
n 1
994
Jan
199
5 Ja
n 1
996
Jan
199
7 Ja
n 1
998
Jan
199
9 Ja
n 2
000
Jan
200
1 Ja
n 2
002
Jan
200
3 Ja
n 2
004
Jan
200
5 Ja
n 2
006
Jan
200
7 Ja
n 2
008
Jan
200
9 Ja
n 2
010
Jan
201
1 Ja
n 2
012
Jan
201
3 Ja
n 2
014
Jan
201
5 Ja
n 2
016
Jan
201
7
Une
mpl
oym
ent
Rate
Labo
r Fo
rce
Part
icip
atio
n Ra
te
Labor Force Participation Rate (left axis)
Unemployment Rate (right axis)
Unemployment rate – How low can New Hampshire’s rate go?Unemployment rate – How low can New Hampshire’s rate go?
New Hampshire’s unemployment rate for May 2017 increased slightly to 2.9 percent from 2.8 percent in April 2017. Over-the-year from May 2016, the unemployment rate remained unchanged. The unemployment rate has remained below 3.0 percent for an extended period of ti me (18 months). Since the mid 1980’s, New Hampshire’s unemployment rate has been below 3.0 percent during two other ti me periods; from May 1986 to April 1989 and from January 1998 to March 2001. During these periods of very low unemployment, the labor force parti cipati on rate increased. Over ti me, though, there has been a structural decline in the labor force parti cipati on rate and, during each consecuti ve ti meframe with very low unemployment the response in the labor force parti cipati on rate has been increasingly muted.
New Hampshire’s labor force parti cipati on rate has experienced a structural decline, but does seem to respond when the unemployment rate is below 3 percent
During this current period of very low unemployment, the labor force parti cipati on rate increased only slightly, from 68.5 percent to 68.8. But within the current reality of an aging workforce, a stabilizati on of the labor force parti cipati on rate is in itself a response to a rather strong labor market.
To get a bett er understanding of the impact that slight changes in the labor parti cipati on rate have on the potenti al workforce, a “counterfactual” esti mati on can be made to illustrate this dynamic. If the parti cipati on rate reached back in January 2000, at 72.6 percent, was applied to the current level of the civilian populati on age 16 or over, approximately 40,000 additi onal
Source:Local Area Unemployment Statistics, Economic and Labor Market Information Bureau
New Hampshire’s Labor Market in ReviewInformati on TecOccupati ons in New Hamps Spring 2017
New Hampshire Employment Security Economic and Labor Market Informati on Bureauwww.nhes.nh.gov/elmi Page 7Page 7
5 2015 American Community Survey 1- year esti mate6 Ibid7 In the fi rst quarter of 2017, industrial vacancy rate for the Greater Boston area was down to “11.2 percent, a new low point for this economic expansion.” Rents have risen eight percent over the last year. Greater Boston Industrial Viewpoint. Accessed on June 15, 2017 at htt p://www.colliersboston.com/fl ipbook/research/2017-q1-industrial-viewpoint/?page=2
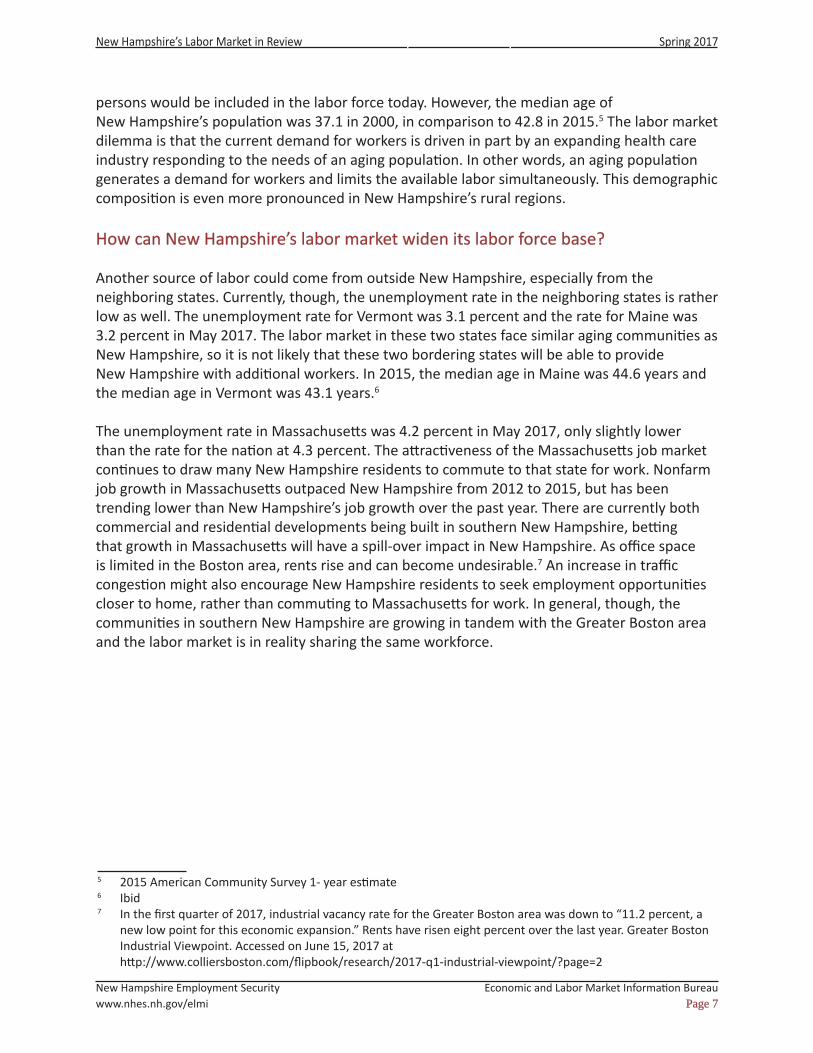
persons would be included in the labor force today. However, the median age of New Hampshire’s populati on was 37.1 in 2000, in comparison to 42.8 in 2015.5 The labor market dilemma is that the current demand for workers is driven in part by an expanding health care industry responding to the needs of an aging populati on. In other words, an aging populati on generates a demand for workers and limits the available labor simultaneously. This demographic compositi on is even more pronounced in New Hampshire’s rural regions.
How can New Hampshire’s labor market widen its labor force base? How can New Hampshire’s labor market widen its labor force base?
Another source of labor could come from outside New Hampshire, especially from the neighboring states. Currently, though, the unemployment rate in the neighboring states is rather low as well. The unemployment rate for Vermont was 3.1 percent and the rate for Maine was 3.2 percent in May 2017. The labor market in these two states face similar aging communiti es as New Hampshire, so it is not likely that these two bordering states will be able to provide New Hampshire with additi onal workers. In 2015, the median age in Maine was 44.6 years and the median age in Vermont was 43.1 years.6
The unemployment rate in Massachusett s was 4.2 percent in May 2017, only slightly lower than the rate for the nati on at 4.3 percent. The att racti veness of the Massachusett s job market conti nues to draw many New Hampshire residents to commute to that state for work. Nonfarm job growth in Massachusett s outpaced New Hampshire from 2012 to 2015, but has been trending lower than New Hampshire’s job growth over the past year. There are currently both commercial and residenti al developments being built in southern New Hampshire, betti ng that growth in Massachusett s will have a spill-over impact in New Hampshire. As offi ce space is limited in the Boston area, rents rise and can become undesirable.7 An increase in traffi c congesti on might also encourage New Hampshire residents to seek employment opportuniti es closer to home, rather than commuti ng to Massachusett s for work. In general, though, the communiti es in southern New Hampshire are growing in tandem with the Greater Boston area and the labor market is in reality sharing the same workforce.

New Hampshire Employment Security Economic and Labor Market Informati on BureauPage 8Page 8 www.nhes.nh.gov/elmi
New Hampshire’s Labor Market in ReviewSpring 2017
8 Table 3. Wage and salary workers paid hourly rates with earnings at or below the prevailing federal minimum wage, by state, 2016 annual averages. Bureau of Labor Stati sti cs. Accessed on June 15, 2017 at htt ps://www.bls.gov/opub/reports/minimum-wage/2016/home.htm
Is there sti ll slack in the labor market? Is there sti ll slack in the labor market? Encouraging higher levels of labor market intensity. Encouraging higher levels of labor market intensity.
Another way to make more labor available is to have the current workers work more hours. In today’s labor market, many workers are salaried and many workers are working on results-oriented measures not ti ed to hourly wages. So it might be hard to establish the level of ability to work more hours.
According to data compiled by Bureau of Labor Stati sti cs, and based on the Current Populati on Survey, in 2016 there were 398,000 workers in New Hampshire paid wages at an hourly rate.8 This was approximately 55 percent of all employed New Hampshire residents in 2016. Using data produced by Current Populati on Survey (CPS), though, on part-ti me and full-ti me employment status, an esti mate can be made of persons working part-ti me. Some of these workers might be encouraged to change to full-ti me status. Part-ti me employment is measured by reason for part-ti me status. The two main categories are for economic reasons (involuntary part-ti me) and for non-economic reasons (voluntary part-ti me).
Part-ti me for economic reasons indicates that the worker is working part-ti me and would like to work more hours but feels unable to fi nd such work.
The number of workers working part-ti me for economic reasons has decreased from a high of about 39,000 persons in the aft ermath of the Great Recession to below 20,000 persons. This measure is considered a way to esti mate the slack in the labor market. As the level has returned to the level prior to the Great Recession, it is likely not going to be reduced much further.

New Hampshire’s Labor Market in ReviewInformati on TecOccupati ons in New Hamps Spring 2017
New Hampshire Employment Security Economic and Labor Market Informati on Bureauwww.nhes.nh.gov/elmi Page 9Page 9
0
5,000
10,000
15,000
20,000
25,000
30,000
35,000
40,000
Jan-
04 to
Dec
-04
May
-04
to A
pr-0
5
Sep-
04 to
Aug
-05
Jan-
05 to
Dec
-05
May
-05
to A
pr-0
6
Sep-
05 to
Aug
-06
Jan-
06 to
Dec
-06
May
-06
to A
pr-0
7
Sep-
06 to
Aug
-07
Jan-
07 to
Dec
-07
May
-07
to A
pr-0
8
Sep-
07 to
Aug
-08
Jan-
08 to
Dec
-08
May
-08
to A
pr-0
9
Sep-
08 to
Aug
-09
Jan-
09 to
Dec
-09
May
-09
to A
pr-1
0
Sep-
09 to
Aug
-10
Jan-
10 to
Dec
-10
May
-10
to A
pr-1
1
Sep-
10 to
Aug
-11
Jan-
11 to
Dec
-11
May
-11
to A
pr-1
2
Sep-
11 to
Aug
-12
Jan-
12 to
Dec
-12
May
-12
to A
pr-1
3
Sep-
12 to
Aug
-13
Jan-
13 to
Dec
-13
May
-13
to A
pr-1
4
Sep-
13 to
Aug
-14
Jan-
14 to
Dec
-14
May
-14
to A
pr-1
5
Sep-
14 to
Aug
-15
Jan-
15 to
Dec
-15
May
-15
to A
pr-1
6
Sep-
15 to
Aug
-16
Jan-
16 to
Dec
-16
May
-16
to A
pr-1
7
Empl
oyed
Res
iden
ts
Female Part-Time for Economic Reasons Male Part-Time for Economic Reasons
The level of part-ti me workers for economic reasons in New Hampshire has subsided to a normal level
Part-ti me for non-economic reasons indicates that the worker is working part-ti me due to one of many reasons, but not due to the economic conditi ons of the labor market. Reasons for working part-ti me for non-economic reasons are childcare problems, family or personal obligati ons, school or training, reti rement, or Social Security limits on earnings.
Working part-ti me for non-economic reasons can be used as a way to measure the intensity of parti cipati on in the labor market.
• The group of employed are much larger than the part-ti me for economic reasons. • Aft er several years of decline in the aft ermath of the Great Recession, part-ti me workers
for non-economic reasons started to grow for both males and females.• For every male part-ti me, there are twice as many female part-ti me workers for non-
economic reasons. This male-to-female rati o seems consistent over ti me. This is likely due to females typically being responsible for family care.
Source: U.S. Census Bureau, unpublished Current Population Survey data

New Hampshire Employment Security Economic and Labor Market Informati on BureauPage 10Page 10 www.nhes.nh.gov/elmi
New Hampshire’s Labor Market in ReviewSpring 2017
0
20,000
40,000
60,000
80,000
100,000
120,000
140,000
160,000
180,000
Jan-
04 to
Dec
-04
May
-04
to A
pr-0
5
Sep-
04 to
Aug
-05
Jan-
05 to
Dec
-05
May
-05
to A
pr-0
6
Sep-
05 to
Aug
-06
Jan-
06 to
Dec
-06
May
-06
to A
pr-0
7
Sep-
06 to
Aug
-07
Jan-
07 to
Dec
-07
May
-07
to A
pr-0
8
Sep-
07 to
Aug
-08
Jan-
08 to
Dec
-08
May
-08
to A
pr-0
9
Sep-
08 to
Aug
-09
Jan-
09 to
Dec
-09
May
-09
to A
pr-1
0
Sep-
09 to
Aug
-10
Jan-
10 to
Dec
-10
May
-10
to A
pr-1
1
Sep-
10 to
Aug
-11
Jan-
11 to
Dec
-11
May
-11
to A
pr-1
2
Sep-
11 to
Aug
-12
Jan-
12 to
Dec
-12
May
-12
to A
pr-1
3
Sep-
12 to
Aug
-13
Jan-
13 to
Dec
-13
May
-13
to A
pr-1
4
Sep-
13 to
Aug
-14
Jan-
14 to
Dec
-14
May
-14
to A
pr-1
5
Sep-
14 to
Aug
-15
Jan-
15 to
Dec
-15
May
-15
to A
pr-1
6
Sep-
15 to
Aug
-16
Jan-
16 to
Dec
-16
May
-16
to A
pr-1
7
Empl
oyed
resi
dent
s
Female Part-Time for Non-Economic Reasons Male Part-Time for Non-Economic Reasons
There are twice as many females working part-ti me for non-economic reasons as males in New Hampshire
There are currently approximately 160,000 employed residents working part-ti me for non-economic reasons. Maybe some of these workers could be encouraged to work full-ti me. Employers would have to fi nd out what would enti ce these part-ti me workers for non-economic reasons to take-on more full-ti me employment. Increased fl exibility in job structure, such as telecommuti ng and alternati ve work schedules as well as more readily available and aff ordable childcare opti ons might enti ce some part-ti me workers to pursue a full-ti me work schedule.
Source: U.S. Census Bureau, unpublished Current Population Survey data

New Hampshire’s Labor Market in ReviewInformati on TecOccupati ons in New Hamps Spring 2017
New Hampshire Employment Security Economic and Labor Market Informati on Bureauwww.nhes.nh.gov/elmi Page 11Page 11
-
5,000
10,000
15,000
20,000
25,000
30,000
35,000
40,000
Empl
oyed
reis
dent
s
Ages 16 to 19 Ages 20 to 24 Ages 25 to 34 Ages 35 to 44
Ages 45 to 54 Ages 55 to 64 Ages 65 and over
There has been an increase in the number of older workers in New Hampshire working part-ti me for non-economic reasons
Over the last couple of years the rise in part-ti me workers for non-economic reasons is due to an increase in part-ti me workers in the older age cohorts (Ages 55 to 64 and Ages 65 and over).
The labor market might be able to encourage a more intense level of parti cipati on, though that might be diffi cult as the older workers appreciate the fl exibility of part-ti me work.
Not in the labor force by County Not in the labor force by County
Another source of labor is from encouraging persons not in the labor force to re-enter the labor force. There can be many reasons why a person is not in the labor force. Most common reasons include family care responsibiliti es, reti rement, disability, and studying full-ti me. Willingness to join the labor force can be swayed by the type of job opportuniti es available and by the level of pay being off ered. The ability to parti cipate in the labor market can be helped by removing barriers to employment, such as transportati on and availability of aff ordable child- and eldercare. Within New Hampshire, the share of the populati on att ached to the labor force diff ers from region to region.9
9 Data on employment status is available by county from the American Community Survey 5-year esti mates. In New Hampshire, American Community Survey 1-year esti mate is not available for all counti es as the populati on does not meet the minimum threshold. The disadvantage of using the 5-year esti mate is that tracking progress over ti me is limited. Data on employment to populati on rati o from Current Populati on Survey is not esti mated at the sub-state level.
Source: U.S. Census Bureau, unpublished Current Population Survey data

New Hampshire Employment Security Economic and Labor Market Informati on BureauPage 12Page 12 www.nhes.nh.gov/elmi
New Hampshire’s Labor Market in ReviewSpring 2017
10 Mary A. Burke. Labor Force Parti cipati on in New England vs the United States 2007-2015: Why Was the Regional Decline More Moderate? Page 12. Federal Reserve Bank Boston Current Policy Perspecti ves No. 16-2 (2016) Accessed on June 16, 2017 at htt ps://www.bostonfed.org/publicati ons/current-policyperspecti ves/2016 /labor-force-parti cipati on-in-new-england-vs-the-united-states-2007-2015.aspx
Three major factors that infl uence labor force parti cipati on:
• Age of the populati on- The older the median age in an area, the more likely a larger share of the populati on is reti red. Despite the fact that the labor force parti cipati on rate in older age groups has been increasing; however there is sti ll an immense drop in labor force parti cipati on for the age cohorts under 65 years of age compared to those 65 and over.
• Educati onal att ainment of the populati on – In a recent white paper from the Federal Reserve Bank of Boston, it was concluded the parti cipati on rate for workers ages 65 and over increased more sharply in New England than the U.S. between 2007 and 2015. The paper pointed out that the high level of educati onal att ainment among the region’s senior citi zen populati on has led to this increase in labor force parti cipati on.10
• Job creati on within the county or proximity to an area with economic opportuniti es.
54.2
56.6
59.7
60.6
60.8
62.2
62.9
64.3
66.1
68.0
4.0
3.6
3.2
3.8
3.4
4.1
3.6
4.7
4.2
4.4
41.8
39.8
37.1
35.6
35.8
33.7
33.5
31.0
29.7
27.6
0% 10% 20% 30% 40% 50% 60% 70% 80% 90% 100%
Coös County
Carroll County
Grafton County
Sullivan County
Belknap County
Cheshire County
Merrimack County
Strafford County
Hillsborough County
Rockingham County
Employment/Population 16+ Unemployment/Population 16+ Not in Labor force
1/3 Bachelor *
1/3 Bachelor
1/3 Bachelor
> 45
1/3 Bachelor
> 45 - Oldest
1/3 Bachelor
> 45
> 45
The share of populati on att ached to the labor force vary greatly between New Hampshire’s counti es
Source: U.S. Census Bureau, 2011-2015 American Community Survey 5-Year Estimates

New Hampshire’s Labor Market in ReviewInformati on TecOccupati ons in New Hamps Spring 2017
New Hampshire Employment Security Economic and Labor Market Informati on Bureauwww.nhes.nh.gov/elmi Page 13Page 13
The share of the populati on not in the labor force varies substanti ally, ranging from 41.8 percent in Coös County to 27.6 percent in Rockingham County. Four of the counti es with the highest median age are also the ones with the highest shares of populati on not in the labor force. In additi on, the share of the populati on with a Bachelor’s degree or higher in Coös County is only 17.8 percent. In comparison, the share of the populati on in Rockingham County with a Bachelor’s degree or above was 38.8 percent, the highest among all New Hampshire counti es.
The median age in Carroll County was 50.3 years, the highest of all New Hampshire’s counti es. Meanwhile, the share of the populati on with a Bachelor’s degree or above was rather high as well, at 32.1 percent. In-migrati on of reti rees over the last couple of decades has elevated the median age of the populati on and likely elevated the educati onal att ainment as well.
Graft on County has a fairly high share of the populati on not in the labor force, despite a high level of educati onal att ainment and, with a median age at 41.9 years, the third lowest among New Hampshire’s counti es. Due to Dartmouth College and Plymouth State University being located in Graft on County, a high share of younger persons (students) living on campuses in Hanover and Plymouth helped bring the median age down in a region that otherwise is aged. Graft on County also has the second highest share of populati on with a Bachelor’s degree or above, which would encourage a higher share of the populati on to be att ached to the labor force. One reason for the high share of the populati on not in the labor force could be that most of the students are att ending school full-ti me and may not parti cipate in the labor force.
The last factor impacti ng the level of labor force att achment is the availability of jobs in the region. In the following we will compare the ten counti es in terms of job and populati on growth over the last decade.

New Hampshire Employment Security Economic and Labor Market Informati on BureauPage 14Page 14 www.nhes.nh.gov/elmi
New Hampshire’s Labor Market in ReviewSpring 2017
Three parameters of community economic development (Covered employment, Three parameters of community economic development (Covered employment, Resident employment and Populati on)Resident employment and Populati on)
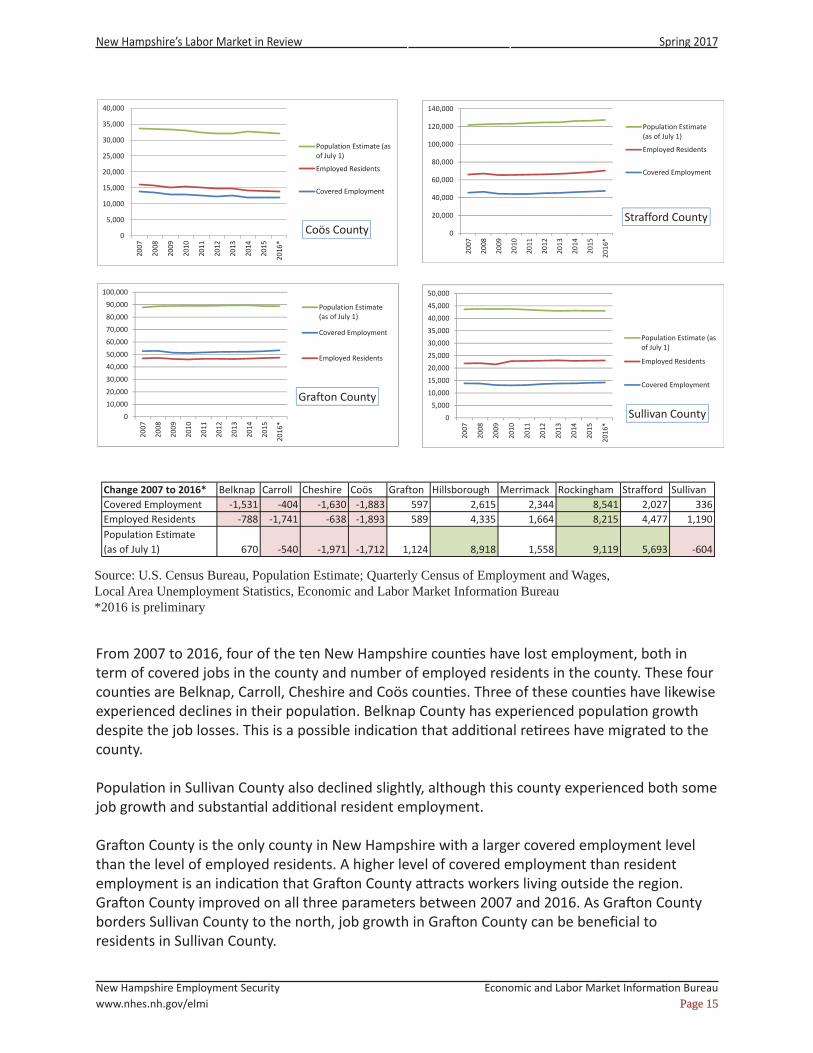
In general, the New Hampshire labor market has been growing at a faster rate, and the level of employment and labor force has reached above the pre-recession levels. But how do these measures look when evaluated at the county level? Below the ten counti es are compared over a ten-year period on three parameters. These parameters are covered employment, resident employment, and populati on.
Ten charts depicti ng whether counti es have recovered the number of jobs lost during the downturn
Source: U.S. Census Bureau, Population Estimate; Quarterly Census of Employment and Wages, Local Area Unemployment Statistics, Economic and Labor Market Information Bureau*2016 is preliminary
0
10,000
20,000
30,000
40,000
50,000
60,000
2007
2008
2009
2010
2011
2012
2013
2014
2015
2016
*
Carroll County
Population Estimate(as of July 1)
Employed Residents
Covered Employment
0
50,000
100,000
150,000
200,000
250,000
300,000
350,000
400,000
450,000
2007
2008
2009
2010
2011
2012
2013
2014
2015
2016
*
Hillsborough County
Population Estimate(as of July 1)
Employed Residents
Covered Employment
0
10,000
20,000
30,000
40,000
50,000
60,000
70,000
80,000
90,000
Cheshire County
Population Estimate(as of July 1)
Employed Residents
Covered Employment
0
10,000
20,000
30,000
40,000
50,000
60,000
70,000
2007
2008
2009
2010
2011
2012
2013
2014
2015
2016
*
Belknap County
Population Estimate(as of July 1)
Employed Residents
Covered Employment
0
50,000
100,000
150,000
200,000
250,000
300,000
350,000
2007
2008
2009
2010
2011
2012
2013
2014
2015
2016
*
Rockingham County
Population Estimate(as of July 1)
Employed Residents
Covered Employment
0
20,000
40,000
60,000
80,000
100,000
120,000
140,000
160,000
2007
2008
2009
2010
2011
2012
2013
2014
2015
2016
*
Merrimack County
Population Estimate(as of July 1)
Employed Residents
Covered Employment
New Hampshire’s Labor Market in ReviewInformati on TecOccupati ons in New Hamps Spring 2017
New Hampshire Employment Security Economic and Labor Market Informati on Bureauwww.nhes.nh.gov/elmi Page 15Page 15
Change 2007 to 2016* Belknap Carroll Cheshire Coös Grafton Hillsborough Merrimack Rockingham Strafford SullivanCovered Employment -1,531 -404 -1,630 -1,883 597 2,615 2,344 8,541 2,027 336Employed Residents -788 -1,741 -638 -1,893 589 4,335 1,664 8,215 4,477 1,190Population Estimate (as of July 1) 670 -540 -1,971 -1,712 1,124 8,918 1,558 9,119 5,693 -604
From 2007 to 2016, four of the ten New Hampshire counti es have lost employment, both in term of covered jobs in the county and number of employed residents in the county. These four counti es are Belknap, Carroll, Cheshire and Coös counti es. Three of these counti es have likewise experienced declines in their populati on. Belknap County has experienced populati on growth despite the job losses. This is a possible indicati on that additi onal reti rees have migrated to the county.
Populati on in Sullivan County also declined slightly, although this county experienced both some job growth and substanti al additi onal resident employment.
Graft on County is the only county in New Hampshire with a larger covered employment level than the level of employed residents. A higher level of covered employment than resident employment is an indicati on that Graft on County att racts workers living outside the region. Graft on County improved on all three parameters between 2007 and 2016. As Graft on County borders Sullivan County to the north, job growth in Graft on County can be benefi cial to residents in Sullivan County.
Source: U.S. Census Bureau, Population Estimate; Quarterly Census of Employment and Wages, Local Area Unemployment Statistics, Economic and Labor Market Information Bureau*2016 is preliminary
0
5,000
10,000
15,000
20,000
25,000
30,000
35,000
40,000
2007
2008
2009
2010
2011
2012
2013
2014
2015
2016
*
Coös County
Population Estimate (asof July 1)
Employed Residents
Covered Employment
0
10,000
20,000
30,000
40,000
50,000
60,000
70,000
80,000
90,000
100,000
2007
2008
2009
2010
2011
2012
2013
2014
2015
2016
*
Grafton County
Population Estimate(as of July 1)
Covered Employment
Employed Residents
0
5,000
10,000
15,000
20,000
25,000
30,000
35,000
40,000
45,000
50,000
2007
2008
2009
2010
2011
2012
2013
2014
2015
2016
*
Sullivan County
Population Estimate (asof July 1)
Employed Residents
Covered Employment
0
20,000
40,000
60,000
80,000
100,000
120,000
140,000
2007
2008
2009
2010
2011
2012
2013
2014
2015
2016
*
Strafford County
Population Estimate(as of July 1)
Employed Residents
Covered Employment

New Hampshire Employment Security Economic and Labor Market Informati on BureauPage 16Page 16 www.nhes.nh.gov/elmi
New Hampshire’s Labor Market in ReviewSpring 2017
The counti es experiencing the most gains on all three measures are Rockingham, Hillsborough, and Straff ord counti es. There were 9,119 more persons living in Rockingham County in 2016 than in 2007. About 8,500 jobs were gained in covered employment, three ti mes more jobs than were added in Hillsborough County. Interesti ngly, there was slightly larger gain in resident employment in Straff ord County than in Hillsborough County, likely due to more Straff ord County residents commuti ng to Rockingham County for work. These same three counti es are those with the smallest shares of populati on not in the labor force. This suggests that there is a connecti on between job opportuniti es, labor force att achment and populati on growth. However, job opportuniti es do not necessarily have to be within the county of residence, as long as job opportuniti es are within a reasonable commute. Job growth can be faster in one county, whereas the neighboring county would concurrently experience larger populati on and resident employment growth.
ConclusionConclusion
Overall, the labor market in New Hampshire is doing well in terms of job creati on. In additi on, the unemployment rate has remained below 3.0 percent for an extensive amount of ti me. This low unemployment rate has created a ti ght labor market, where employers need to be more creati ve in order to att ract additi onal workers. Flexibility in work scheduling and other accommodati ons might be necessary to enti ce persons not in the labor force to enter or re-enter the labor force. Similar remedies might be necessary to get part-ti me workers to accept more hours, thereby shift ing to full-ti me status.
However, there are regional diff erences from county to county. The southeastern parts of New Hampshire, as well as Graft on County, are growing in terms of jobs and populati on. On the other hand, the northern parts, except Graft on County, and western parts of the state have been losing both jobs and populati on between 2007 and 2016. The rapidly aging populati on in these mostly rural communiti es, in combinati on with lower educati onal att ainment, is a large obstacle to growth. Encouraging younger workforce-ready residents to relocate to rural communiti es would solve this problem. But what would be the incenti ve for younger workers to do so? There are many reasons for why young adults are less likely to stay or relocate to the rural areas of New Hampshire. A couple of examples of what could transform New Hampshire’s more rural communiti es in order to att ract the next generati on of workers include:
• Expanded ability to be connected to the web; • Bett er marketi ng of the career opportuniti es that are available;• Create a movement , such as “work in the cloud, live in the hills” as opposed to “work in
the city, play in the hills”
In additi on, technology and innovati on might alleviate the high demand for workers related to the delivery of services to an aging populati on.

Other publications from the Economic and Labor Market Information Bureau available online at www.nhes.nh.gov/elmi
Community ProfilesEconomic Analysis ReportsEconomic Impact Scenarios (REMI Model) Hospital Construction Projects in New Hampshire What if the Shipyard Closed? Childcare in New Hampshire Industry Sector Analysis Health Care Workers in New Hampshire Information Technology Occupations in New Hampshire Positively Productive The Hospitality Industry Cluster in New Hampshire Work in Progress: Construction in New HampshireJob Outlook and Locator: Occupations by IndustryLicensed, Certified, and Registered Occupations in New HampshireLocal Employment Dynamics/OnTheMap Analysis The Upper Valley – OnTheMap Sullivan County: A Workforce StudyManufacturing in New Hampshire Fact SheetNew Hampshire Economic Conditions New Hampshire Occupational Employment and WagesReal-Time Labor Market Information/Online Job Ads Analysis New Hampshire Online Job Ads Summary Staffing Agency Job Ads in New Hampshire Truckers: Keep Goods Moving Nursing Job Postings in New Hampshire New Hampshire Computer and Information Technology Job PostingsSTEM in New Hampshire: A Labor Demand-Supply AnalysisVeterans in New HampshireVital Signs, New Hampshire Economic and Social IndicatorsWorkforce and Career Information User’s Guide
New Hampshire Employment Security is a proud member
of America’s Workforce Network and NH WORKS. NHES
is an Equal Opportunity Employer and complies with the
Americans with Disabilities Act. Auxiliary aids and services
are available upon request to individuals with disabilities.
TDD Access: Relay NH 1-800-735-2964
The products and services of the NHES Economic and Labor Market Information Bureau result from the cooperation and teamwork of the entire ELMI Bureau staff: Michael Argiropolis, Robert Cote, Gregory David, Bruce DeMay, Deborah Dunn, Katrina Evans, Donna Finlay, Eleanor Goodbread, Debra Jodoin, Anita Josten, Donald Kelley, Annette Nielsen, Bruce Olinsky, Martin Page, Peter Sgrulloni, and James Smith.
For the latest information on the New Hampshire economy subscribe to ELMI E-lerts, a free subscription service providing notices about release of the monthly unemployment rate, updated economic and labor force statistics, new reports and publications, and announcements about new and updated career resources. To subscribe, go to www.nhes.nh.gov/elmi and click on Subscribe to ELMI E-lerts.