New Hampshire High Technology: The Future is Now NetworkNH April 2005.
25
New Hampshire High Technology: The Future is Now NetworkNH April 2005
-
date post
21-Dec-2015 -
Category
Documents
-
view
214 -
download
0
Transcript of New Hampshire High Technology: The Future is Now NetworkNH April 2005.

New Hampshire High Technology: The Future is Now
NetworkNHApril 2005

High Tech NH: What we will cover….:
Recent trends with comparisons to other states with significant technology concentrations and US averages
Why we should care about high technology employment and industries in NH
Vulnerabilities Opportunities Areas to focus efforts looking forward
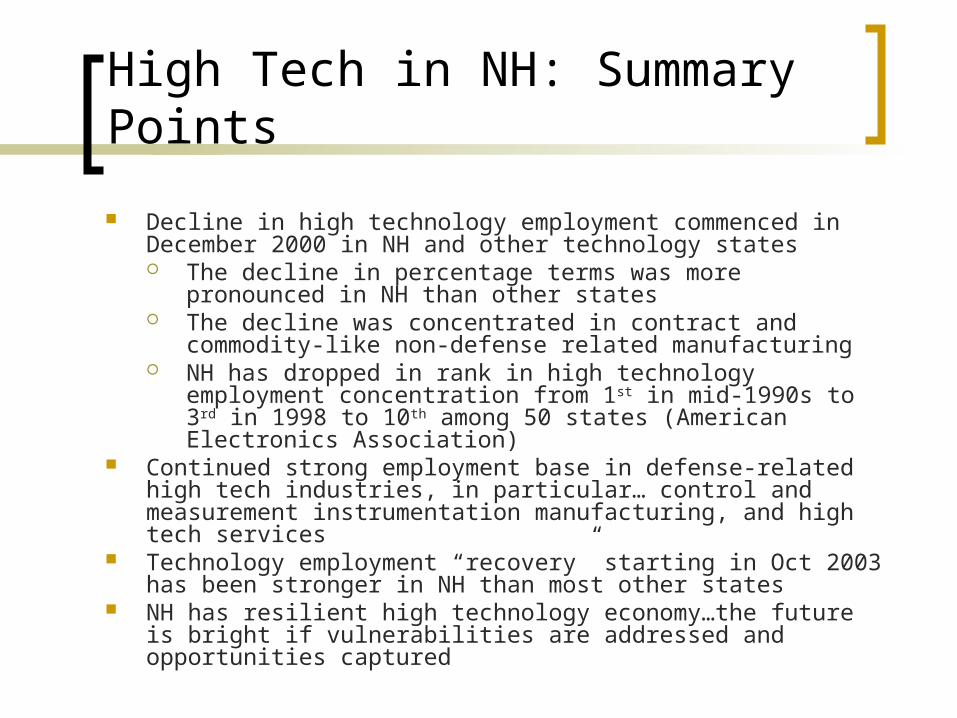
High Tech in NH: Summary Points
Decline in high technology employment commenced in December 2000 in NH and other technology states The decline in percentage terms was more pronounced in
NH than other states The decline was concentrated in contract and commodity-
like non-defense related manufacturing NH has dropped in rank in high technology employment
concentration from 1st in mid-1990s to 3rd in 1998 to 10th among 50 states (American Electronics Association)
Continued strong employment base in defense-related high tech industries, in particular… control and measurement instrumentation manufacturing, and high tech services
Technology employment “recovery” starting in Oct 2003 has been stronger in NH than most other states
NH has resilient high technology economy…the future is bright if vulnerabilities are addressed and opportunities captured
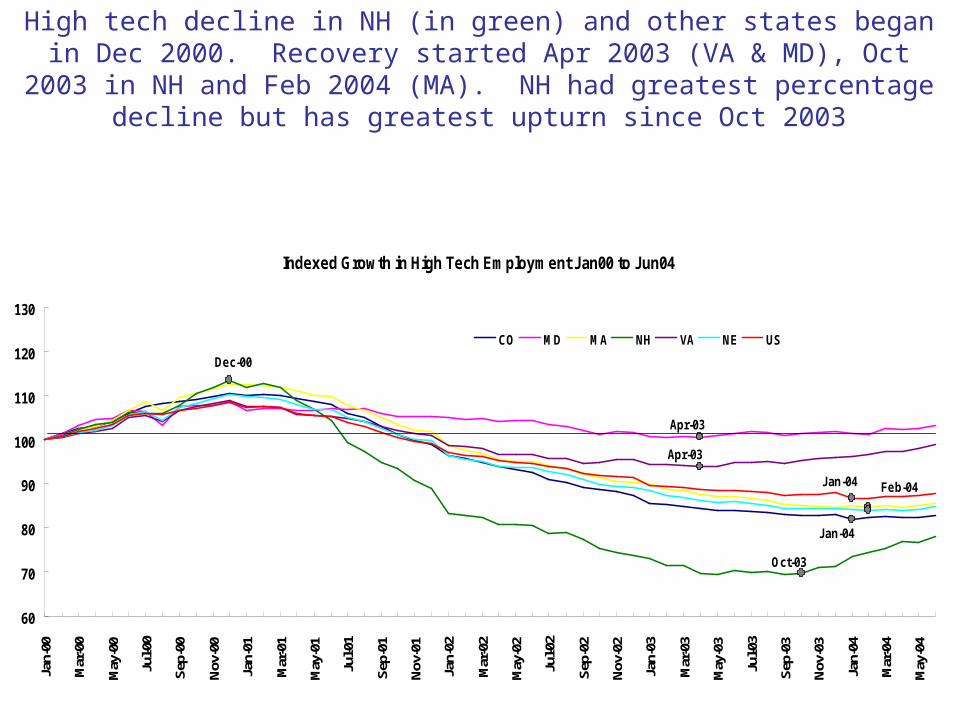
High tech decline in NH (in green) and other states began in Dec 2000. Recovery started Apr 2003 (VA & MD), Oct 2003 in NH and Feb 2004 (MA). NH had greatest percentage decline but has greatest upturn since Oct 2003
Indexed Growth in High Tech Employment Jan00 to Jun04
Jan-04
Apr-03
Feb-04
Oct-03
Dec-00
Apr-03
Jan-04
60
70
80
90
100
110
120
130
Jan-
00
Mar
-00
May
-00
Jul-0
0
Sep-
00
Nov
-00
Jan-
01
Mar
-01
May
-01
Jul-0
1
Sep-
01
Nov
-01
Jan-
02
Mar
-02
May
-02
Jul-0
2
Sep-
02
Nov
-02
Jan-
03
Mar
-03
May
-03
Jul-0
3
Sep-
03
Nov
-03
Jan-
04
Mar
-04
May
-04
CO MD MA NH VA NE US

High Technology Employment Boom, Bust and “Recovery” After boom in NH in mid to late-1990s (+15%), then sharpest decline (-36%),
New Hampshire (+9.2%) has experienced strongest “recovery” in total technology employment. Other high tech states are experiencing much more modest percentage gains in high tech employment …with the two leading tech
(concentration) states Mass. and Colorado lagging US recovery
Total High Tech Employment Change Over Selected Time Periods (Rates)
14.5%
9.1% 8.7% 8.7%
14.4%
10.9%
-36.0%
-14.0%
-8.2%
-19.6%
-25.4% -24.9%
9.2%
5.1%
2.5%1.0% 0.8% 0.7%
-40%
-30%
-20%
-10%
0%
10%
20%
NH VA MD US MA CO
Pre Recession Recession Post Recession

High technology resiliency (employment % change 2003-2004): NH compared to other high tech and New England States
Total High Tech Employment (June to June)
State 03--04 Rank
New Hampshire 7.8% 4
Virginia 4.1% 7
Vermont 3.2% 8
Maryland 1.7% 15
Rhode Island -1.1% 26
Connecticut -1.9% 31
Colorado -2.2% 34
Massachusetts -2.4% 35

Low- and High-lights of High Tech Employment Change
New Hampshire 2000-2004 • Decline in high technology manufacturing without recovery of lost jobs
– Semiconductors– Printed Circuit Boards
• Pronounced retrenchment in some sectors of high technology services in the tech “bust” of early 2000s
– Wired Tele-Communications Carriers – Data Processing / Warehousing – Tele-Communications Resellers– Software Publishing
• Stable Base of Defense-Related Industry. Employment helped state significantly during recession and recovery
– Search and detection instrument manufacturing…– One-fifth of all tech jobs now in this one defense-related sector– Without this industry tech employment would have declined more than 40 percent
• Resilience in some high technology service industries with recovery in last year– Engineering Services– Computer Programming– Computer System Design– R&D Physical, Engineering and Life Sciences
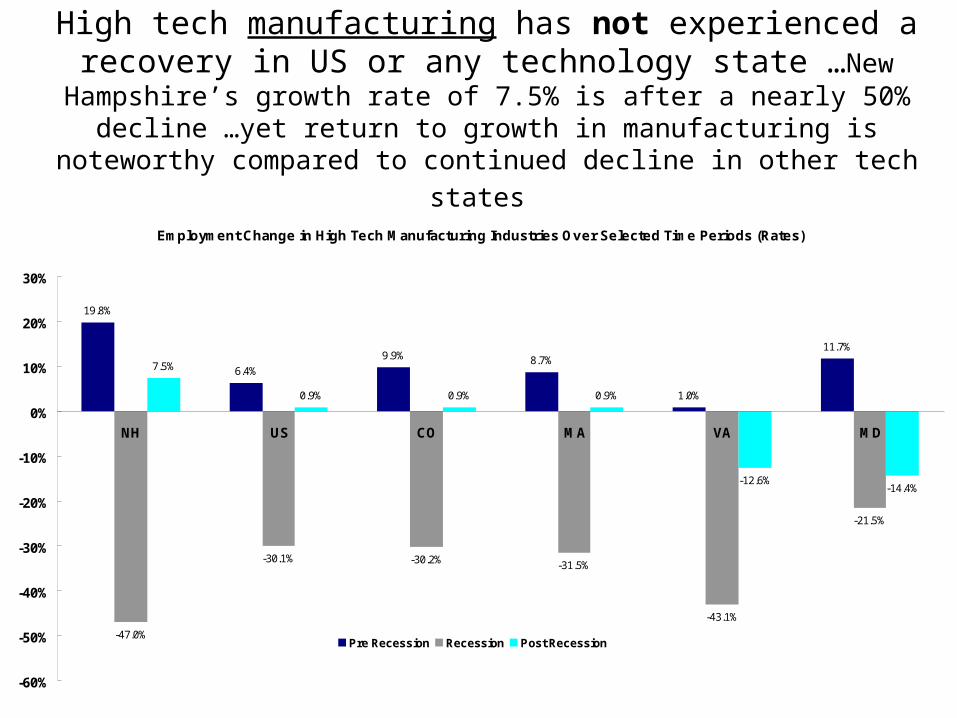
High tech manufacturing has not experienced a recovery in US or any technology state …New Hampshire’s growth rate of 7.5%
is after a nearly 50% decline …yet return to growth in manufacturing is
noteworthy compared to continued decline in other tech states
Employment Change in High Tech Manufacturing Industries Over Selected Time Periods (Rates)
19.8%
6.4%
9.9% 8.7%
1.0%
11.7%
-47.0%
-30.1% -30.2% -31.5%
-43.1%
-21.5%
7.5%
0.9% 0.9% 0.9%
-12.6%-14.4%
-60%
-50%
-40%
-30%
-20%
-10%
0%
10%
20%
30%
NH US CO MA VA MD
Pre Recession Recession Post Recession

Concentration in manufacturing within high technology in NH compared to US average contributed to pronounced decline, 2/3rds in NH compared to 1/3rd US average in late 1990s.
Now down to below 60 percent of high technology employment
High Tech Manufacturing as a Percentage of Total High Tech
Employment 2003
High Tech Services as a Percentage of Total High Tech
Employment 2003
High Tech Telecommunications as a Percentage of Total High
Tech Employment 2003MA 40.5% 41.4% 8.4%ME 28.3% 48.3% 15.3%NH 58.2% 28.1% 5.4%RI 36.9% 42.3% 12.5%US 32.3% 44.0% 16.4%

High technology services are recovering in many technology based states…New Hampshire (7.4%) and Virginia (9.0%)
both have growing engineering service and custom computer programming employment bases
Employment Change in High Tech Service Industries Over Selected Time Periods (Rates)
8.4%7.2% 7.1%
10.9%9.1%
20.3%
0.118289976
-5.3%
-21.7%
-0.1%
-18.7%
-10.9%
-17.1%
-0.149863701
9.0%7.4%
5.7%
3.4% 2.7%1.8% 0.022585571
-25%
-20%
-15%
-10%
-5%
0%
5%
10%
15%
20%
25%
VA NH MD CO US MA NE
Pre Recession Recession Post Recession
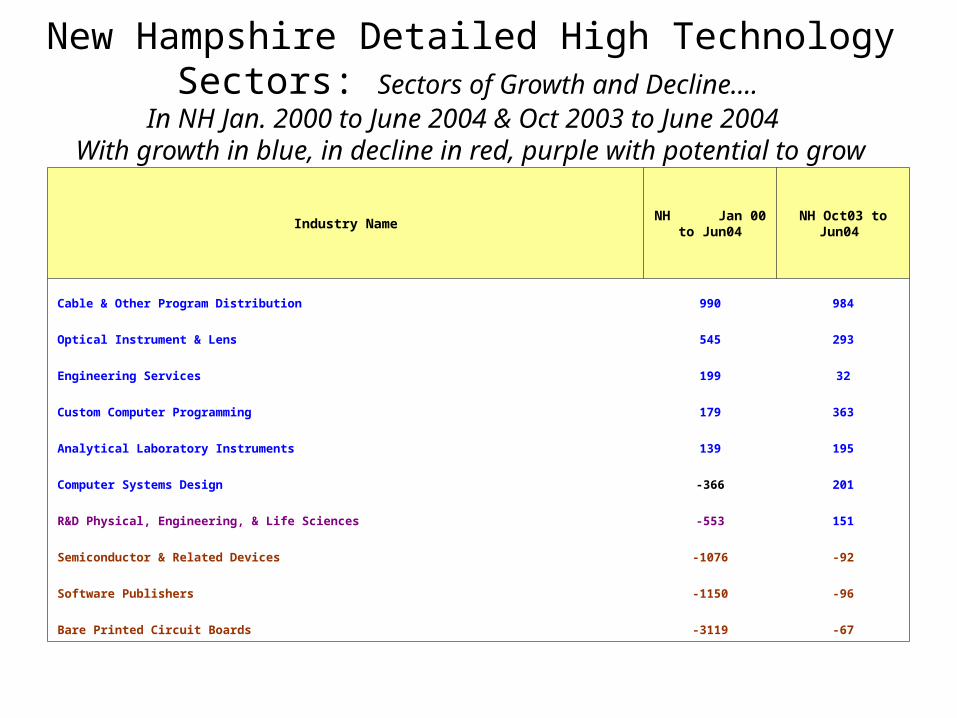
New Hampshire Detailed High Technology Sectors: Sectors of Growth and Decline….
In NH Jan. 2000 to June 2004 & Oct 2003 to June 2004 With growth in blue, in decline in red, purple with potential to grow
Industry NameNH Jan 00 to
Jun04NH Oct03 to
Jun04
Cable & Other Program Distribution 990 984
Optical Instrument & Lens 545 293
Engineering Services 199 32
Custom Computer Programming 179 363
Analytical Laboratory Instruments 139 195
Computer Systems Design -366 201
R&D Physical, Engineering, & Life Sciences -553 151
Semiconductor & Related Devices -1076 -92
Software Publishers -1150 -96
Bare Printed Circuit Boards -3119 -67

Why should we promote high technology industries in New Hampshire?
• States on the leading edge of technological innovation have the highest per capita income in the nation.
• High Tech jobs pay 75% higher wages than other industries.
• 1/3rd of NH Gross State Product directly or indirectly tied to high technology.
• High technology industries are the engine of growth. It is the key sector in the research and development (R&D), innovation and new product development base of the state’s economy
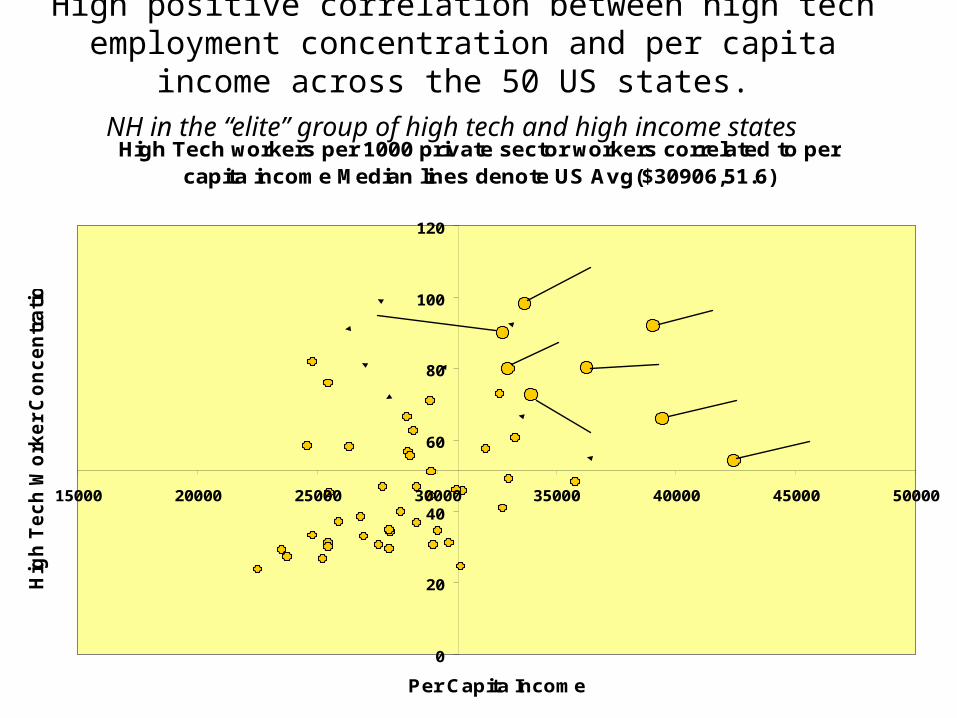
High positive correlation between high tech employment concentration and per capita income across the 50 US states.
NH in the “elite” group of high tech and high income states High Tech workers per 1000 private sector workers correlated to per
capita income Median lines denote US Avg($30906,51.6)
0
20
40
60
80
100
120
15000 20000 25000 30000 35000 40000 45000 50000
Per Capita Income
Hig
h T
ec
h W
ork
er
Co
nc
en
tra
tio
n
CT
NJ
MA
MD
CO
VA
CA
NH

R&D: Building on the base..the role of high
technology defense-related industries
• We estimate that high technology DoD contractors in the state -- through direct and in-direct (through the DoD) R&D investments in the state -- account for greater than one-third of the total private sector R&D investment in the state.
• Without the defense industry, New Hampshire would drop to well below the median in total R&D spending per capita and the state’s ability to compete and grow in high technology would suffer significantly.
• Close to 50 percent of all federal R&D funding and 90 percent of all federal R&D funding of industry in New Hampshire is from the DoD.
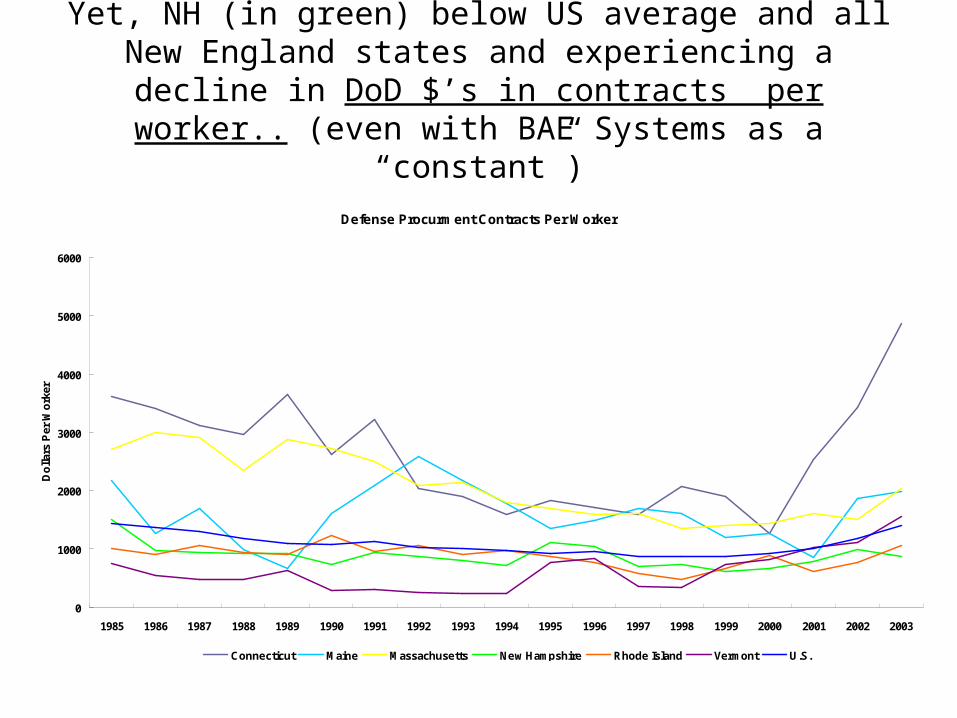
Yet, NH (in green) below US average and all New England states and experiencing a decline in DoD $’s in contracts
per worker.. (even with BAE Systems as a “constant”)
Defense Procurment Contracts Per Worker
0
1000
2000
3000
4000
5000
6000
1985 1986 1987 1988 1989 1990 1991 1992 1993 1994 1995 1996 1997 1998 1999 2000 2001 2002 2003
Do
llars
Per
Wo
rker
Connecticut Maine Massachusetts New Hampshire Rhode Island Vermont U.S.

New Hampshire High Technology: The Future is
Now Building on strengths
addressing weaknesses….
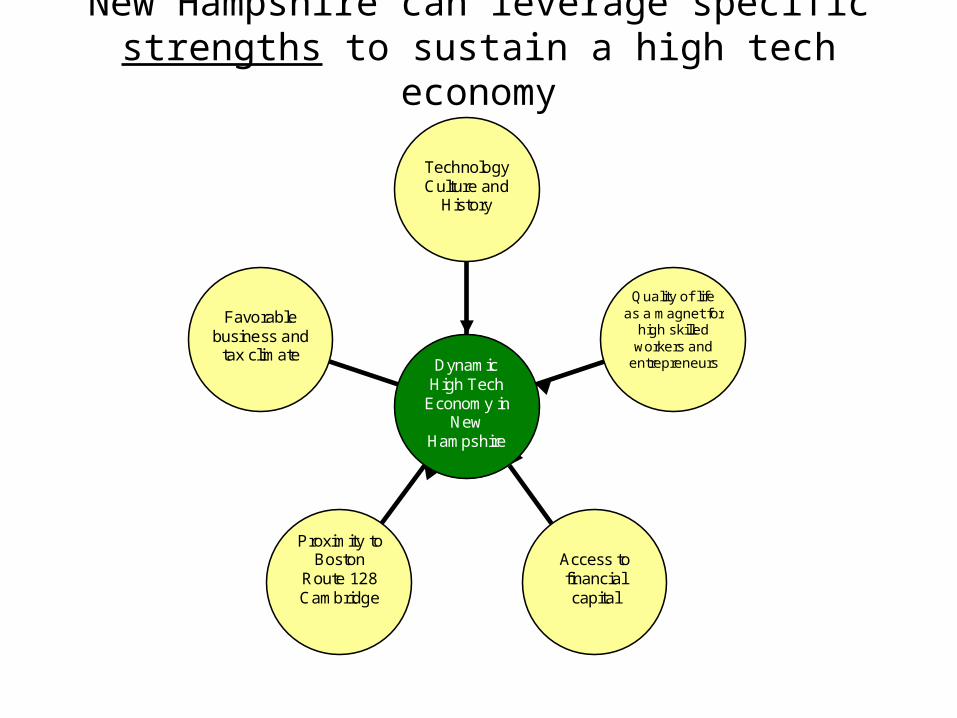
New Hampshire can leverage specific strengths to sustain a high tech economy
Favorable
business and tax climate
Proximity to Boston
Route 128 Cambridge
Access to financial capital
Quality of life as a magnet for
high skilled workers and
entrepreneurs
Technology Culture and
History
Dynamic High Tech
Economy in New
Hampshire

The Education Advantage: Educational Attainment and High Technology Employment Concentration
Percentage Of Population (25+) With Bachelors Degree 2000 vs. High Tech Employment Concentration
0%
2%
4%
6%
8%
10%
12%
14%
8% 10% 12% 14% 16% 18% 20% 22% 24%
Percent w/ BA
HT
Em
p C
on
cen
trat
ion
COMA
NHVA
MD
US Avg (15.2% , 6.12%)
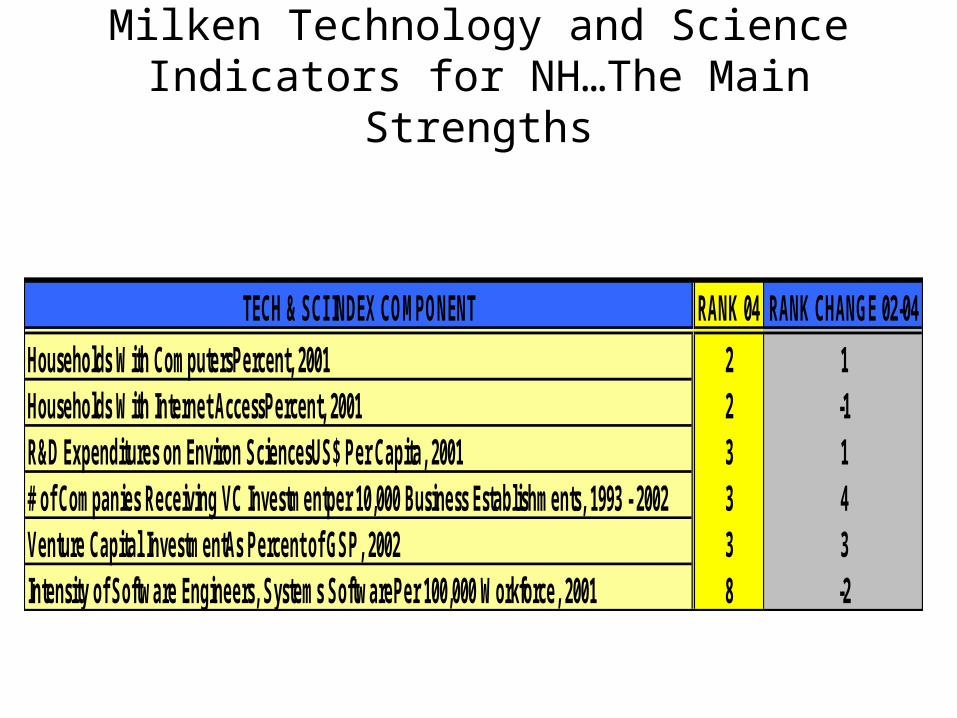
Milken Technology and Science Indicators for NH…The Main Strengths
TECH & SCI INDEX COMPONENT RANK 04 RANK CHANGE 02-04
Households With ComputersPercent, 2001 2 1Households With Internet AccessPercent, 2001 2 -1R&D Expenditures on Environ SciencesUS$ Per Capita, 2001 3 1# of Companies Receiving VC Investmentper 10,000 Business Establishments, 1993 - 2002 3 4Venture Capital InvestmentAs Percent of GSP, 2002 3 3Intensity of Software Engineers, Systems SoftwarePer 100,000 Workforce, 2001 8 -2

Milken Institute Overall Technology and Science Index Rank NH ranks 12th ..but behind 3 other New England states..
and competitor states, e.g., Rhode Island, New Mexico and Oregon, catching up fast.
State Rank (2004) Rank (2002)Change in Ranking
(2002-2004)
Massachusetts 1 1 0Colorado 3 2 -1Maryland 4 4 0Virginia 5 5 0Rhode Island 11 21 10New Hampshire 12 13 1New Mexico 14 20 6
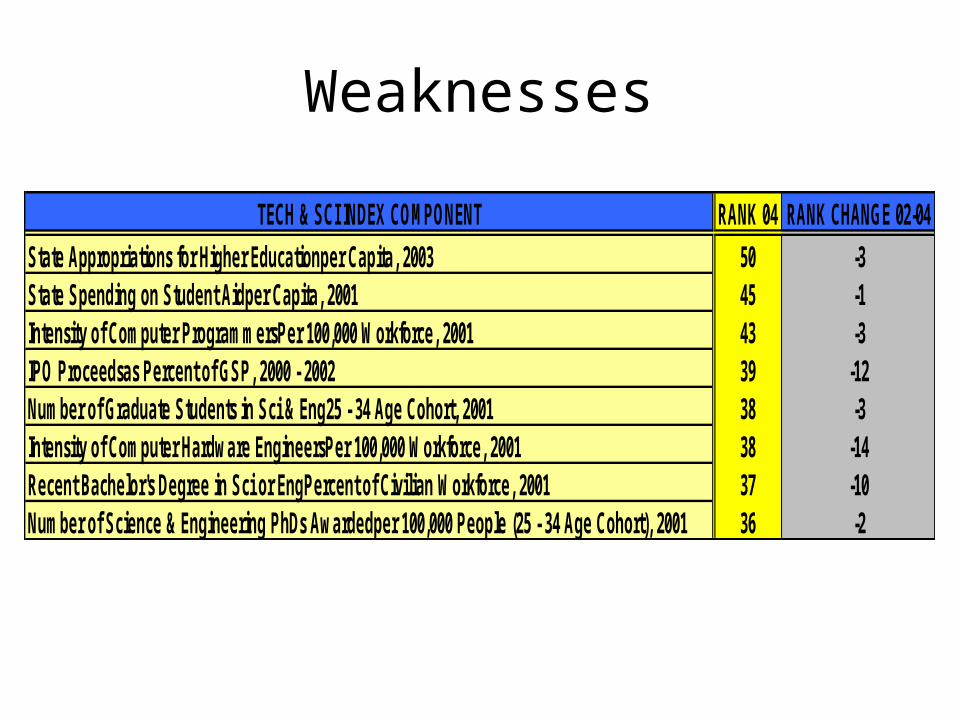
Weaknesses
TECH & SCI INDEX COMPONENT RANK 04 RANK CHANGE 02-04
State Appropriations for Higher Educationper Capita, 2003 50 -3State Spending on Student Aidper Capita, 2001 45 -1Intensity of Computer ProgrammersPer 100,000 Workforce, 2001 43 -3IPO Proceedsas Percent of GSP, 2000 - 2002 39 -12Number of Graduate Students in Sci & Eng25 - 34 Age Cohort, 2001 38 -3Intensity of Computer Hardware EngineersPer 100,000 Workforce, 2001 38 -14Recent Bachelor's Degree in Sci or EngPercent of Civilian Workforce, 2001 37 -10Number of Science & Engineering PhDs Awardedper 100,000 People (25 - 34 Age Cohort), 2001 36 -2
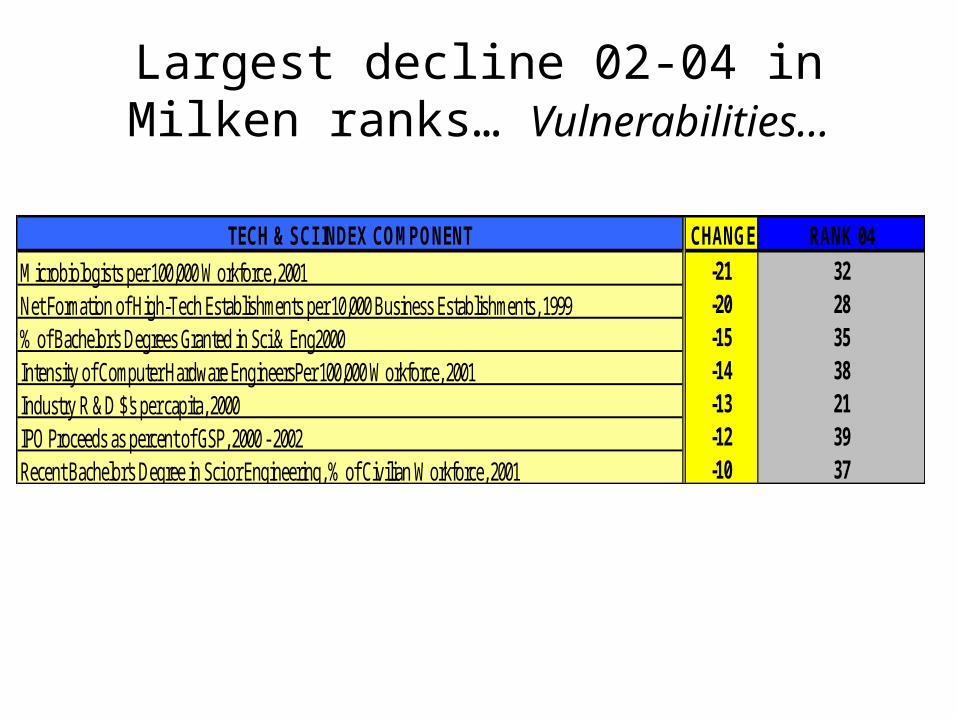
Largest decline 02-04 in Milken ranks… Vulnerabilities…
TECH & SCI INDEX COMPONENT RANK CHANGE 02-04 RANK 04
Microbiologists per 100,000 Workforce, 2001 -21 32Net Formation of High-Tech Establishments per 10,000 Business Establishments, 1999 -20 28% of Bachelor's Degrees Granted in Sci & Eng2000 -15 35Intensity of Computer Hardware EngineersPer 100,000 Workforce, 2001 -14 38Industry R &D $'s per capita, 2000 -13 21IPO Proceeds as percent of GSP, 2000 - 2002 -12 39Recent Bachelor's Degree in Sci or Engineering, % of Civilian Workforce, 2001 -10 37
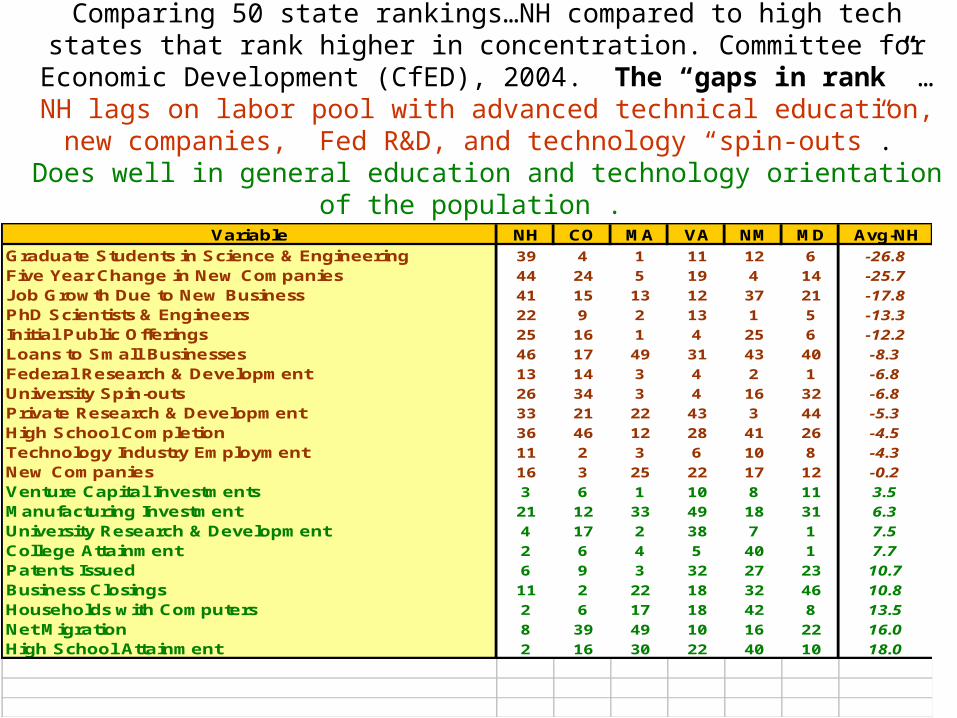
Comparing 50 state rankings…NH compared to high tech states that rank higher in concentration. Committee for Economic Development (CfED), 2004.
The “gaps in rank” …NH lags on labor pool with advanced technical education, new companies, Fed R&D, and technology “spin-outs”. Does well
in general education and technology orientation of the population .
Variable NH CO MA VA NM MD Avg-NHGraduate Students in Science & Engineering 39 4 1 11 12 6 -26.8
Five Year Change in New Companies 44 24 5 19 4 14 -25.7
Job Growth Due to New Business 41 15 13 12 37 21 -17.8
PhD Scientists & Engineers 22 9 2 13 1 5 -13.3
Initial Public Offerings 25 16 1 4 25 6 -12.2
Loans to Small Businesses 46 17 49 31 43 40 -8.3
Federal Research & Development 13 14 3 4 2 1 -6.8
University Spin-outs 26 34 3 4 16 32 -6.8
Private Research & Development 33 21 22 43 3 44 -5.3
High School Completion 36 46 12 28 41 26 -4.5
Technology Industry Employment 11 2 3 6 10 8 -4.3
New Companies 16 3 25 22 17 12 -0.2
Venture Capital Investments 3 6 1 10 8 11 3.5
Manufacturing Investment 21 12 33 49 18 31 6.3
University Research & Development 4 17 2 38 7 1 7.5
College Attainment 2 6 4 5 40 1 7.7
Patents Issued 6 9 3 32 27 23 10.7
Business Closings 11 2 22 18 32 46 10.8
Households with Computers 2 6 17 18 42 8 13.5
Net Migration 8 39 49 10 16 22 16.0
High School Attainment 2 16 30 22 40 10 18.0

Network NH Looking Forward
Working collaboratively with other groups across the state
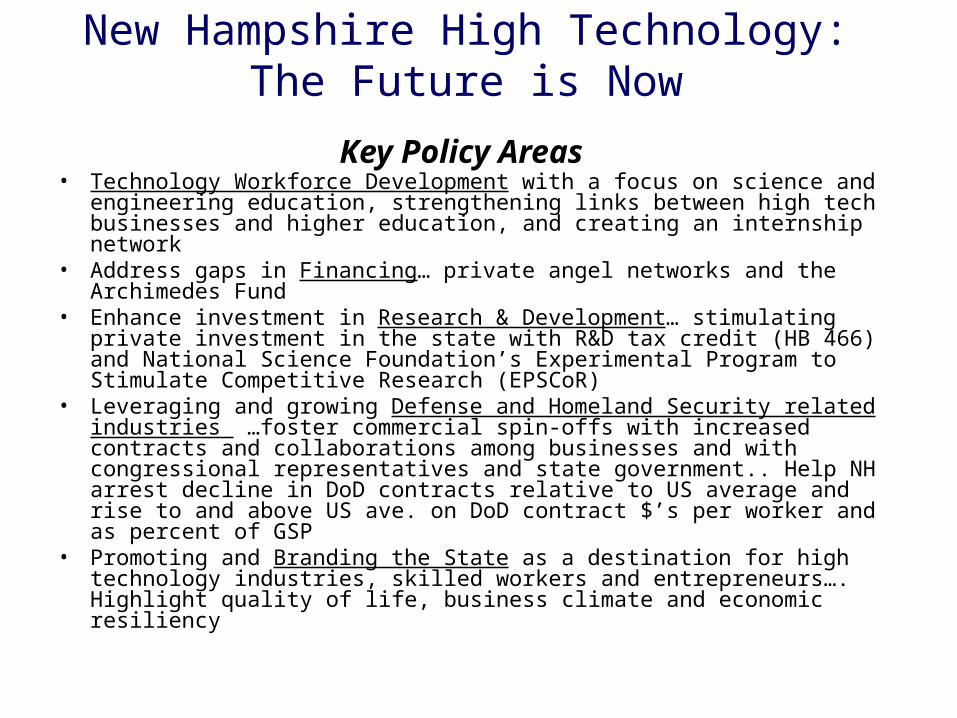
New Hampshire High Technology: The Future is Now
Key Policy Areas • Technology Workforce Development with a focus on science and
engineering education, strengthening links between high tech businesses and higher education, and creating an internship network
• Address gaps in Financing… private angel networks and the Archimedes Fund
• Enhance investment in Research & Development… stimulating private investment in the state with R&D tax credit (HB 466) and National Science Foundation’s Experimental Program to Stimulate Competitive Research (EPSCoR)
• Leveraging and growing Defense and Homeland Security related industries …foster commercial spin-offs with increased contracts and collaborations among businesses and with congressional representatives and state government.. Help NH arrest decline in DoD contracts relative to US average and rise to and above US ave. on DoD contract $’s per worker and as percent of GSP
• Promoting and Branding the State as a destination for high technology industries, skilled workers and entrepreneurs…. Highlight quality of life, business climate and economic resiliency