New Hampshire demographic trends in the twenty-first century
36
New Hampshire Demographic Trends in the Twenty-First Century KENNETH M. JOHNSON
Transcript of New Hampshire demographic trends in the twenty-first century

New Hampshire Demographic Trends in the Twenty-First Century
K E N N E T H M . J O H N S O N

Building Knowledge for Families and Communities
REPORT S ON NEW ENGL ANDNumber 4
Research on this project was funded by grants from the New Hampshire Endowment for Health and the New Hampshire Charitable Foundation.
Additional support for this research was provided by the New Hampshire Agricultural Experiment Station and by grants to the University of New Hampshire from the Annie E. Casey Foundation, the W. K. Kellogg Foundation, and an anonymous donor.
Special thanks to Deborah Schachter at the New Hampshire Charitable Foundation and Dennis Delay and Steve Norton at the New Hampshire Center for Public Policy Studies for their helpful comments and suggestions. Luke Rogers and Barb Cook of the Carsey Institute provided valuable research assistance.
© Copyright 2012
Carsey Institute University of New Hampshire Huddleston Hall73 Main StreetDurham, New Hampshire 03824-3563603-862-2821
www.carseyinstitute.unh.edu
Interim Director: Bruce L. MalloryDeputy Director: Curt GrimmCommunications Director: Amy Sterndale

New Hampshire Demographic Trends in the Twenty-First Century
Kenneth M. JohnsonSenior Demographer
The Carsey Institute
University of New Hampshire
A Carsey Institute Report on New England

Table of Contents
Executive Summary 3
Introduction 4
Key Findings 4
Population Redistribution Trends in New Hampshire 5
Demographic Components of Population Change 5The Recent Slowdown in Population Growth 8
New Hampshire’s Changing Age Structure 10
Age-Specific Migration Patterns 10New Hampshire’s Young Adult Population 11Age Structure Shifts 12New Hampshire’s Growing Older Population 13
New Hampshire’s Growing Diversity and Spatial Variation 15
Population Change by Race and Hispanic Origin 15Spatial Variation in Education, Income, and Poverty 18
Demographic Change Is Uneven Across New Hampshire 21
Rural Growth Rates Exceed Urban Growth Rates 21Different Places, Different Trends 21
Implications of Demographic Trends in the Granite State 24
Summary 27
Methods and Data 28
Endnotes 29
3
Executive Summary
New Hampshire’s future depends, in part, on the size, composition, and distribution of its population. This report provides insights into the patterns of demo-
graphic change under way in the state using the latest data available. For New Hampshire to continue to grow and pros-per, policymakers, businesses, and nonprofits must be aware of these demographic trends as they consider the future needs of its people, institutions, and organizations.
New Hampshire’s Population Increase Is Slowing
New Hampshire gained 80,700 residents between 2000 and 2010—its smallest population gain since the 1960s. This 6.5 percent gain is still the largest among the slow-growing north-eastern states, but modest compared to national trends. The underlying dynamics of demographic change that caused this population increase have changed as well. From 1970 to 2000, people moving to New Hampshire from other states provided most of the population growth. However, in the last decade it was the excess of births over deaths that produced most of the population increase, because gains from migration, which the state has long depended on, were sharply diminished. In part, this reflects the impact of the Great Recession, but migration was slowing even before. New Hampshire has long benefited from the demographic, social, economic, and intellectual capital that migrants bring to the state. If the migration slowdown continues, it will have significant implications for the state’s future.
New Hampshire’s Population Is Aging
New Hampshire does not currently have an old population; only twenty-one states have a smaller proportion of seniors. However, the state’s age structure dictates that a rapid increase in the senior population is inevitable and coming soon. The population age 65 and over will almost certainly double in the next two decades. In contrast, the number of children in the state diminished between 2000 and 2010, and the number of young adults and family-age residents increased only modestly. The state’s youngest and oldest residents are big consumers of government services like education and health care, so changes in the size of these groups have signifi-cant implications for the institutions and organizations that serve them. In contrast, New Hampshire’s large population of working-aged adults provides much of the human capital the state needs to fuel continued economic growth. Therefore, the lack of significant growth in these age groups is a cause for some concern.
The Pace of Demographic Change Is Uneven in New Hampshire
Population growth is slowing overall in New Hampshire, but some communities continue to grow rapidly. Elsewhere in the state, the population slowdown has been profound as more people die than are born, and young adults are continuing to leave, as they have for generations. These disparate demo-graphic trends complicate the task of policymakers because the needs of fast-growing communities for the tools and expertise to manage rapid growth are very different from those of com-munities struggling to maintain the local infrastructure and provide critical services to a diminishing population.
New Hampshire Is Becoming More Diverse
Diversity is increasing in New Hampshire. The state is be-coming more racially and ethnically diverse, although the diversity remains spatially concentrated. Children are in the vanguard of the change. New Hampshire compares admirably on statewide measures of income, education, and poverty, but there are pockets of significant poverty in the state and the poverty is pronounced among children. Income and educa-tional levels also vary across the state. Developing programs and policies to address such economic disparities and to meet the needs of an increasingly diverse population is particularly challenging when these pockets of economic and racial di-versity exist in a state that is generally affluent, well-educated, and non-Hispanic white.
The future of New Hampshire and its communities depends on the ability to anticipate change and respond appropriately. New Hampshire is a small player on the nation’s demographic stage. Yet, there is much to learn from an analysis of the way its population is growing and changing. The demographic analysis provided here is a powerful tool for informing policy and, in so doing, contributes to the efforts of policymakers, planners, nonprofits, and businesses to consider the future needs of New Hampshire’s people, institutions, and organiza-tions and allow it to continue to grow, prosper, and be a good place to live and raise families.

4
Introduction
With a population of only 1.3 million, New Hamp-shire is a small player on the nation’s demographic stage. Yet, the state’s sprawling suburbs, struggling
industrial towns, fast-growing amenity areas, and rural villages are representative of the diverse strands that compose the de-mographic fabric of the nation. There is much to learn from an analysis of New Hampshire’s changing population. For its size, the state reflects a surprising degree of demographic, geo-graphic, and economic diversity. This diversity, combined with a long history and strong tradition of independent local gov-ernments, has produced a complex tapestry of demographic change across the state. New Hampshire spans a broad spec-trum of landscapes, from the expanding periphery of the Bos-ton metropolitan area; through mill towns that ushered in the Industrial Revolution and have since transformed themselves into diversified economic centers; to picturesque villages that look much as they did a century ago; past sparkling lakes, ski slopes, and beautiful vistas that have attracted vacationers and second homeowners for generations; to the working forests
and rugged mountains of the north. The population changes New Hampshire has experienced over the past decade play out against this backdrop through the complex interaction be-tween fertility, mortality, and migration.
The future of New Hampshire depends in part on the size, composition, and distribution of its population. For the state to continue to grow, prosper, and be a good place to live and raise families, policymakers must be cognizant of these demo-graphic trends as they consider the future needs of its people, institutions, and organizations. This report examines the de-mographic changes under way in the state using the latest data available. The goal here is to:
nSummarize current population redistribution trends in New Hampshire
n Show how fertility, mortality, and migration contributed to these population trends
nDocument how these demographic trends vary by location, age, race, and Hispanic origin
nNew Hampshire’s population increased by 80,700 be-tween 2000 and 2010, mostly during the earlier years of the decade.
nMigration contributed 35,400 to the population gain, and the excess of births over deaths accounted for 45,300.
nPopulation change is uneven with some places growing rapidly while others are in decline.
nDemographic change is producing both challenges and opportunities for the state.
nThe loss of migrants has an immediate financial im-pact on the state and implications for its human, intel-lectual, and social capital.
nA rapid increase in New Hampshire’s older population is inevitable and coming soon.
nPopulation aging will increase the cost of providing state and local services.
nDiversity is growing, but it is modest and concentrated in a few areas of the state.
nA growing population of minority children heightens the need for appropriate public policy responses to ad-dress their needs.
nPockets of high poverty exist despite the lowest state poverty rates in the nation.
Key Findings

5
Population Redistribution Trends in New Hampshire
According to the 2010 census, New Hampshire gained 80,700 residents (a 6.5 percent increase) between 2000 and 2010. The state’s population on April 1, 2010, was
1,316,470. This 6.5 percent gain is greater than that of any other northeastern state (Figure 1), though it is modest compared to fast-growing western and Sunbelt states. New Hampshire’s re-gional ascendency can be attributed to a combination of natural increase (the excess of births over deaths) and net in-migration (more people moving into the state than leaving it). Compared to New Hampshire, Maine also enjoyed a significant migration gain, but it had minimal natural increase. On the other hand, Connecticut and Vermont had small migration gains, but rela-tively high levels of natural increase. Massachusetts and Rhode Island both lost migrants, growing only because the excess of births over deaths was sufficient to offset this migration loss.
central New Hampshire where scenic amenities abound (Figure 3). In contrast, slow growth or population loss is occurring in the north and in scattered pockets of western New Hampshire. This selective deconcentration is consistent with national trends, which demonstrate high growth in recreational areas and along the urban edge coupled with population stagnation or loss in remote areas that depend on extractive industries (such as for-est products, farming, and mining). Recently, the recession has slowed this deconcentration process both in New Hampshire and elsewhere in the nation, but over the course of the decade New Hampshire gained population from it.
Demographic Components of Population Change
Population change in New Hampshire is the result of two re-lated, but distinctly different demographic processes. The first is natural increase, which is the excess of births over deaths. Natural increase has contributed to overall population growth in New Hampshire throughout its history, although in recent years a few areas of the state have experienced natural decrease (more deaths than births). Natural increase tends to change in-crementally and has resulted in a gradually diminishing popu-lation gain in the state. The second component of demographic change is net migration (the difference between the number of people moving into New Hampshire and the number leav-ing). Migration has long been important to New Hampshire, but the magnitude of its contribution has varied historically. A far more volatile demographic force than natural increase, migration can change abruptly in response to shifts in the economy, employment opportunities, and the perceived appeal of the area, so it tends to have sharp peaks and valleys, pro-ducing substantial population gains in some periods and little, if any, population growth in other periods. Because migration patterns are sensitive to changing economic conditions, the current recession has had a significant impact on migration, producing the state’s first migration loss in nearly two decades.
The relative contributions of the two components over the last four decades are reflected in Figure 4. Natural increase has contributed significantly to the growth of New Hampshire in each decade, but the amount of natural increase has been declining. In the 1980s, when natural increase peaked, it con-tributed nearly 72,000 to the state’s population gain of 189,000. During the 1990s, the gain from natural increase declined by 14 percent. Between 2000 and 2010, the natural increase gain
Figure 1. New England Demographic Change, 2000 to 2010
Source: U.S. Census 2000, 2010 and FSCPE Estimates
Many of the fastest-growing areas in New England are con-centrated in southern and central New Hampshire (Figure 2). Rapid gains there contrast sharply with areas of slower growth or population loss in the inner ring of the Boston metropolitan areas and in northern Maine. Population gains in New Hamp-shire are stimulated by two trends. The first is the peripheral sprawl of the Boston metropolitan area. Population growth rates are high in a broad band around the outer edge of the Boston metropolitan area including much of southern New Hampshire. A second growth cluster centers on the recreational areas in

6
Figure 2. Population change in New England, 2000 to 2010
Source: U.S. Census 2000, 2010

7
Figure 3. Population change in New Hampshire, 2000 to 2010
Source: U.S. Census 2000, 2010
diminished to 45,300. Natural increase is diminishing because of a steady rise in deaths, rather than because of fewer births. There were 81,600 deaths in New Hampshire between 1980 and 1990 compared to 100,700 between 2000 and 2010, a rise of 23 percent. This compares to a 7 percent decline in births. This rising number of deaths reflects the aging of the state’s popula-tion, a matter with considerable policy implications, which will be discussed below.
Migration accounted for the majority of the state’s popu-lation increase in the 1970s, 1980s, and 1990s. Migration gains were greatest during the 1970s, when the state’s popu-lation grew by 183,000 (24.8 percent). Migration accounted for 74 percent of that population gain. In the 1980s, New Hampshire gained nearly 189,000 residents (20.5 percent); migration accounted for 62 percent of that gain. Growth slowed during the 1990s to 127,000 (11.4 percent) primar-ily because of the smaller migration gain. The situation changed in the last decade, when natural increase accounted for most of the state’s population increase for the first time in decades. In fact, the population gain from 2000 and 2010 declined to 80,700, in large part because migration contrib-uted just 35,400 people to the state’s growth.
Migration includes both domestic migration and immigra-tion. Domestic migration reflects the movement of people be-tween locations in the United States. Net immigration is the difference between the number of people coming into an area from outside the country and the number of people leaving the country from that area. Each of these components contributes to
Figure 4. New Hampshire demographic change, 1970 to 2010
Source: U.S. Census 1970-2010 and FSCPE Estimates

8
the overall migration gain or loss for the state. Immigration was important to New Hampshire early in its history and again at the turn of the twentieth century, but it has played a very minor role in overall migration gains during the last half-century. Only 5.5 percent of New Hampshire’s residents are foreign born. This compares to 12.8 percent of the U.S. population. As the recession grew worse late in the decade, immigration began to account for a larger percentage of the state’s migration gain. Census Bureau estimates suggest that between 2000 and 2010, immigration may have accounted for half of the state’s overall migration gain. This is a striking contrast to the situation in prior decades, when do-mestic migration accounted for the vast majority of the migra-tion gain. Immigration’s more prominent role recently is not the result of a surge in immigration to the state; rather, it is the result of sharply reduced domestic migration near the end of the de-cade as the recession intensified.
The Recent Slowdown in Population Growth
The long-term trends above show that both natural increase and migration have played important roles in the growth of New Hampshire’s population. However, in the short-term, population growth in New Hampshire has slowed dramatically. Between July 2000 and July 2001, the state gained an estimated 15,600 people (Figure 5), while between 2008 and 2009, New Hampshire’s population gain had diminished to just 200.1
These changes give rise to questions: How could the state’s population gain change so dramatically over such a short period? Has the recent economic recession had an impact on these de-mographic trends? In New Hampshire, as elsewhere in the United States, women are having fewer children in response to the eco-nomic problems fostered by the recession.2 But natural increase has diminished only modestly over the past several years in the state. The key driver of the sharp decline in population growth was the volatility of net migration. From 2000 to 2001, the net migration gain of 11,000 accounted for 70 percent of the annual population gain. But throughout the following decade, migration diminished to the point that the state lost nearly 2,800 through out-migration by 2009 to 2010. In fact, migration losses have oc-curred in each of the last four years. Since 2007, the population has increased only because of an excess of births over deaths by a margin sufficient to offset the losses owing to migration.3 A con-tinuation of this trend for a protracted period has significant im-plications for New Hampshire’s demographic future, and thus it is important to examine why this migration loss is occurring.
In essence, New Hampshire’s net migration loss late in the de-cade occurred because many fewer people moved into the state in 2010 than in 2001. The state’s migration gain dwindled through the decade, eventually shifting to a net loss late in the decade due to a sharp decline in the number of people moving into New Hampshire from other states.4 Those leaving the state for other U.S. destinations also declined in number, but the reduction was more modest (Figure 6). In 2001, 45,800 migrants moved to New Hampshire from other states, according to Internal Revenue Service estimates. In contrast, 35,100 New Hampshire residents moved to other states. The net migration gain to the state was 10,700. By 2010, when the recession was in full swing, the inflow to the state diminished to 29,400—a 36 percent reduction. In contrast, the number of out-migrants from the state declined to 31,600—a 10 percent reduction. The net effect of these migration stream changes was the transformation of a 10,700 migration gain in 2001 to a net domestic migration loss of 2,200 in 2010.
The reduced flow of migrants into New Hampshire is consis-tent with the experience of other states that usually attract domes-tic migrants. The job losses and severe slump in housing prices caused by the recession have “frozen people in place” nationwide, making it extremely difficult for them to move.5 As a result, states like New Hampshire that have long enjoyed a net influx of domes-tic migrants saw the flow of new residents to the state dwindle. In contrast, states with long histories of losing domestic migrants have lost fewer of them since the recession began. The migration exchange between Massachusetts and New Hampshire illustrates this point. Massachusetts has long been the biggest source of mi-grants to New Hampshire. In 2003, 19,000 people moved from Massachusetts to New Hampshire. In comparison, just 8,700 New Hampshire residents moved to Massachusetts. By 2010, the num-ber of migrants to New Hampshire from Massachusetts had dwin-dled to 10,100, while some 8,600 still moved in the opposite direc-tion. Thus, the net gain to the Granite State from Massachusetts was reduced from 10,300 to just 2,500, a 76 percent reduction.

9
Figure 5. New Hampshire demographic change, 2000 to 2011
Source: U. S. Census, FSCPE Estimates
Figure 6. New Hampshire migration, 2000 to 2010
Source: IRS Migration Data

10
Changes in the state’s migration streams and levels of natural increase have implications that reach far be-yond their immediate impact on population change.
These fluctuations have long-term impacts on the age struc-ture of the state. The tempo and pattern of change in the age structure are influenced by historical fertility and mortality trends, as well as by the age differences in the streams of migrants to and from New Hampshire. As we shall see, it takes decades for the consequences of trends in migration and fertility to be fully reflected in the age structure.
The age structure of New Hampshire’s population has changed over the last two decades. For example, the 20- to 29-year-old age group grew between 2000 and 2010 after sub-stantial losses during the 1990s (Figure 7). In contrast, the population aged 30-39 decreased by more than 40,000 between 2000 and 2010 after relatively little change in the 1990s. And, the size of the age 40-49 cohort, which had the largest gain of any age group during the 1990s, barely changed at all during the last decade. Meanwhile, the ranks of older adults in their 50s and 60s expanded substantially between 2000 and 2010, reflecting the aging of the population. On the surface, these changes seem straightforward, but the demographic processes that underlie them are not.
New Hampshire is growing older. The age change data make that abundantly clear. Migration contributes to this situation, but the primary driver is the aging in place of those currently residing in New Hampshire. Age structure changes have important implications for policymakers as well as for the state’s business, service, and nonprofit com-munities. The state’s youngest and oldest residents are big consumers of government services such as education and health care. In contrast, the working-age population pro-vides human capital and the skilled labor force needed to fuel economic growth, as well as much of the consumer base for goods and services. There is also an ongoing concern in New Hampshire about the state’s ability to retain and attract young adults and about whether the state has an old popula-tion. A careful examination of the state’s changing age struc-ture and the drivers of that change address many of these policy-relevant issues.
Age-Specific Migration Patterns
Although New Hampshire experienced modest migration loss-es in the last several years, between 2000 and 2010 it gained mi-grants in most age groups, just as it did during the 1990s (Figure 8). Numerical gains were greatest among those in their 30s and 40s and among children and adolescents. Adults between the ages of 30 and 49 are in the family-rearing stage of the life cycle, so their influx together with that of children and teens suggest that families have been flowing into New Hampshire. Migrants to the urban periphery include many family-age households,6 suggesting that the outward sprawl of the Boston metropolitan area contributes to this inflow. Parent-child households bring considerable social and financial capital to the state, but they also bring short-term costs. During the last decade, 9.7 percent more children started the first grade in New Hampshire than were born in the state six years earlier.7 Although these migrant children put immediate demands on local school districts, they represent an important source of young people for a state con-cerned about having too few young adults in the future.
New Hampshire’s Changing Age Structure
Figure 7. New Hampshire age structure change, 1990 to 2010
Source: U.S. Census 1990, 2000, 2010

11
New Hampshire also gained modest numbers of migrants over the age of 50. Some moved to be near their grown children, while others were attracted to the abundant amenity and scenic areas in the state. In fact, several amenity-rich counties in central New Hampshire experienced significant population gains fueled by the migration of older adults. This net inflow likely foreshad-ows a larger influx of baby boomers in coming years.
The state did not gain among all age groups. Out-migration reduced the number of people in their 20s in New Hampshire in each of the last two decades. During the 1990s this outflow was modest, with a loss of roughly 5,600 (4 percent). The loss was greater between 2000 and 2010, when the estimated net out-flow was 18,000 (10.6 percent). Most of this loss occurred later in the decade as the recession deepened.8 As explained below, this net loss of young adults likely occurred because fewer young migrants came to the state rather than because more left.9
New Hampshire’s Young Adult Population
Recently there has been much concern in New Hampshire about young adults leaving the state. Figures show that there was a 23 percent decline in the population aged 20 to 29 during the 1990s (see Figure 7 above). This figure is often cited to support the ar-gument that there has been a massive out-migration of young adults from New Hampshire. A critical question is: What caused this loss? As the data below demonstrate, demographic trends
in this age cohort are not driven by out-migration. Age-specific migration did contribute to it, but there were more powerful de-mographic forces at work. Recall that between 1990 and 2000, the state’s migration loss among 20- to 29-year-olds was just 4 percent, far short of the 23 percent population loss for this age group. And between 2000 and 2010, when there was an even larger migration loss of young adults in their 20s, the number of 20- to 29-year-olds in the state actually increased by 12.5 percent. In contrast, the number of 30- to 39-year-olds declined between 1990 and 2000 and again between 2000 and 2010 in spite of a significant migration gain among this age group in each decade. Clearly migration is not the primary cause of these age structure shifts. So, if migration gains and losses cannot totally account for the changes in the young adult and family-age population, then what does? The answer lies in historical fertility patterns.
Simply put, there was no massive net out-migration of young adults during the 1990s. Rather the sharp decline in the number of young adults in the state during the 1990s occurred because few babies were born in the state during the 1970s. In fact, fewer children were born in New Hampshire during the 1970s than in either the 1980s or the 1960s. The shortfall of births during the 1970s was substantial. In all, 26 percent fewer babies were born in New Hampshire during the 1970s than would be born in the 1980s. It was this shortfall of births dur-ing the 1970s which produced most of the 23 percent reduction in young adults twenty years later during the 1990s. Both the decline in births during the 1970s and the surge in births dur-ing the 1980s were due, in large part, to the delayed fertility of the baby boomers. Women born during the baby boom put off marriage and children to take advantage of the expanding op-portunities for education and employment. This caused a birth dearth in the early 1970s. Women on the leading edge of the baby boom did eventually have children late in the 1970s and during the 1980s. As a result, there were small birth cohorts in the early 1970s and larger birth cohorts later. In New Hamp-shire, the birth surge in the 1980s was augmented by an in-flux of middle-aged adults during the 1970s and 1980s, which brought young families—and the potential for more children—to the state. As these very different size cohorts born during the 1970s and 1980s grew up, the age structure expanded and contracted as they passed through it.
Figure 8. Age-specific net migration to New Hampshire, 1990 to 2000 and 2000 to 2010
Source: Johnson et al. 2005; Winkler and Johnson 2012

12
By 2000, the small “baby bust” cohort born between 1976 and 1980 was 20 to 24. Because it was so much smaller than the cohort 10 years older than it, this young adult age group dimin-ished in size compared to 1990 (Figure 10). It was this decline that fostered much of the concern about young adults leaving New Hampshire. Clearly, the decline was because this cohort was so small to begin with—not because of a massive out-mi-gration of young adults. The echo cohort born between 1986 and 1990 reached its early teens by 2000, causing this age group to grow precipitously. Meanwhile, the baby boom cohort, born between 1956 and 1960, was in its early 40s by 2000, and their large numbers dramatically increased the size of this age group compared to its size in 1990 when the pre-baby boomers were in their early 40s.
Figure 9. Age structure in New Hampshire, 1990
Source: U.S. Census 1990
Figure 10. Age structure in New Hampshire, 2000
Source: U.S. Census 2000
By 2010, the situation was changing. The baby bust cohort born between 1976 and 1980 was now in its early 30s, causing the age group to shrink. Even the substantial influx of 30- to 39-year-old migrants discussed earlier was not sufficient to offset the reduction caused by the aging of this small cohort. Meanwhile, the large baby boom cohort was in its early 50s in 2010, setting the stage for significant gains in the senior popu-lation in the near future. Figure 11 also demonstrates the influ-ence of aging on the echo cohort born between 1986 and 1990. In 2010, this large cohort increased the population of adults in their early 20s despite the migration losses to this age group.
Age Structure Shifts
Young adults are not the only age group influenced by chang-ing cohort size. And because the changes in New Hampshire’s age structure have significant long-term policy implications, it is important to examine the state’s age structure over time. The differential impact of cohort size on the age structure is illus-trated in a series of population pyramids (Figures 9 to 11) that trace three representative cohorts over the past twenty years. The first cohort of interest was born between 1956 and 1960. This “baby boom” cohort was born during the peak of the baby boom. The second cohort, born during the low fertility “baby bust” between 1976 and 1980, was 30 to 34 in 2010. The third cohort, born during the higher fertility “baby boom echo” years between 1986 and 1990, was 20 to 24 by 2010.
The relative size of these three cohorts in 1990 is illustrated in Figure 9. The large size of the baby boom cohort is evident in the large population bulge among those 30 to 34. In contrast, the smaller baby bust cohort is reflected in the small number of 10- to 14-year-olds. Finally, the members of the youngest “echo” cohort were all under age 5 in 1990 and are represented by the lowest bar in the pyramid. Note how much smaller the baby bust cohort is compared to the cohorts born twenty years earlier or ten years later. Tracing the passage of these three co-horts through the age structure between 1990 and 2010 illus-trates how New Hampshire’s population is changing.

13
Looking to the future, the growing size of the cohorts now moving into their early 20s has implications for New Hampshire fertility trends. If historical trends prevail, these larger cohorts of young women will likely be supplemented by migrants in their 30s, especially as the recession wanes. This combination will produce a large concentration of women in their prime child-bearing years later this decade. In addition, many young women who delayed marriage and/or children because of the recession may soon begin to start families. The net result could be an in-crease in births in New Hampshire later in this decade. These additional births may be needed to maintain the size of the youth population. There were 313,000 people under the age of 20 in New Hampshire in 1990. This number grew to 340,000 in 2000 before declining to 326,000 in 2010. More than 28 percent of the state’s population was under 20 in 1990. By 2010, it was just 24.7 percent. The declining proportion of youth is of particular con-cern because New Hampshire’s population is aging.
New Hampshire’s Growing Older Population
The population pyramids help to explain another major con-cern for policymakers: the widespread belief that New Hamp-shire has an old population. In 2010 the state’s median age was 41.1. Only three states had a higher median age in 2010. At first glance, this would suggest that New Hampshire’s population is among the oldest in the country. However, the demographic data support a different conclusion. In 2010, 13.5 percent of
Figure 11. Age structure in New Hampshire, 2010
Source: U.S. Census 2010
New Hampshire’s population was 65 or older, a figure only slightly above the U.S. figure of 13.0 percent. Only twenty-one states have a proportionally smaller population of 65 and older. Thus, New Hampshire does not currently have an unusually large proportion of seniors or a particularly old population.
New Hampshire’s high median age is a function of its large concentration of baby boomers. Only two states have a larger proportion of baby boomers in their population. Evidence of the large baby boom population in the state is reflected in the 2010 population pyramid (see Figure 11). In New Hampshire the cohort born between 1956 and 1960 represents the heart of the baby boom. Combining this cohort with those born between 1951 and 1955 (who were age 55 to 59 in 2010) and those born between 1961 and 1965 (who were age 45 to 49 in 2010) constitutes the bulk of the baby boom. It is the bulge of these age groups that produces New Hampshire’s high median age. Having such a large proportion of the population in late middle age has distinct advantages for New Hampshire right now. It means the state’s working age population is large com-pared to those either too old or too young to work. In fact, only five states have a higher proportion of working age adults than New Hampshire. This very large pool of experienced workers at the peak of their earning potential provides considerable so-cial, economic, and intellectual capital. However, as we look to the future, the aging of New Hampshire’s population presents significant challenges.
New Hampshire’s age structure dictates that the number of older adults will increase rapidly in the next two decades. There are currently 97,000 65- to 74-year-olds in New Hampshire. In contrast, there are 179,000 55- to 64-year-olds and 226,000 45- to 54-year-olds. Although mortality will modestly diminish these cohorts over time, the vast majority will celebrate their sixty-fifth birthday in New Hampshire. As these groups “age in place,” the number of seniors will grow precipitously. New Hampshire’s recreational and scenic amenities will attract ad-ditional older migrants, and this stream will likely swell as the large baby boom cohorts now in their late 40s to early 60s begin to retire. Of course, some older New Hampshire residents do leave the state for the Sunbelt, but on balance New Hampshire is currently gaining older migrants and will likely continue to do so. The combined effect of this aging in place and senior migration is a likely doubling of the population aged 65 to 74 in the next twenty years.

14
These age structure shifts are not occurring evenly. Northern and central New Hampshire already contain a substantially larger proportion of residents age 65 and over than do other parts of the state (Figure 12). Much of this is a function of aging in place among current residents of these regions, coupled with a continu-ing loss of young adults. In some areas this is supplemented by an inflow of older amenity migrants. The governments and organiza-tions in these regions will be the first to confront the challenge of
Figure 12a. Percent of population age less than 18, 2010
Source: U.S. Census 2010
an aging population. In contrast, children represent a significantly larger proportion of the population in southeastern New Hamp-shire, with the highest proportion of those under 18 residing near the Massachusetts border. Because this region incorporates Bos-ton’s suburban sprawl and includes Manchester, Nashua, and the Seacoast, it attracts and retains a significant family-age population. In these areas, financing the construction of new schools is likely to be a greater challenge than building senior centers.
Figure 12b. Percent of population age 65 and older, 2010
Source: U.S. Census 2010

15
New Hampshire’s Growing Diversity and Spatial Variation
Age structure shifts are not the only factor contribut-ing to demographic change in New Hampshire. The population is also becoming more diverse. Changes in
the composition of minority communities as well as the spatial distribution of education, income, and poverty have important implications for the state’s future.
Population Change by Race and Hispanic Origin
Any analysis of recent demographic trends in America must be cognizant of the growing demographic impact of minority populations. Between 2000 and 2010, minorities accounted for 90 percent of the overall population gain in the United States, although they represented just 36 percent of the population. New Hampshire has a considerably smaller minority population than the nation, but diversity is increasing here as well. In 2010, 92.3 percent of New Hampshire’s population was non-Hispan-ic white, making it one of the least diverse states in the United States. Minorities represent 7.7 percent of the state’s population. Hispanics, the largest group, numbered 36,700 (2.3 percent). Asians follow at 28,200 (2.1 percent), and blacks at 13,600 (1.0 percent). All other groups make up the remaining 2 percent.
But diversity is increasing here as well. Between 2000 and 2010, the racial and Hispanic origin of the state changed mod-estly (Figure 13). Although minorities represented only 4.9 percent of New Hampshire’s population in 2000, they produced 50 percent of the population gain between 2000 and 2010. The minority population grew by 40,900 (67.5 percent) to 101,400 during the period. The white population grew by 39,800 (3.4 percent) to 1,215,000. Thus, while the numerical gains for whites and minorities were roughly equal, minority growth rates were significantly higher. Percentage gains among Asians, Hispanics, and African-Americans all exceeded 50 percent. The overall effect of these recent changes has been to modestly increase diversity in the state.
Children are in the vanguard of this growing diversity. In all, 12.2 percent of the New Hampshire child population belonged to a minority in 2010 compared to 6.3 percent of the adult popu-lation (Figure 14). Hispanics, Asians, and those of two or more races represent the largest share of this minority youth popu-lation. The greater diversity within the population of children is the result of two factors. First, the minority child population grew by 14,700 (72.1 percent) with Hispanics accounting for the largest share (41 percent) of this growth (Figure 15). Second, the non-Hispanic white youth population diminished by 37,000 (-12.8 percent) between 2000 and 2010. The minority youth gain was not sufficient to offset the non-Hispanic white loss, so New Hampshire’s child population declined by 22,300 during the de-cade. New Hampshire’s experience is consistent with national trends, which showed the non-Hispanic white child popula-tion declining in forty-six of the fifty states. The combination of fewer white children and more minority children accelerated the growing diversity among young New Hampshire residents.
Figure 13. Population Change in New Hampshire from 1990 to 2010
Source: U.S. Census 1990, 2000, 2010

16
Figure 14a. New Hampshire population by race and hispanic origin, under 18, 2010
Source: U.S. Census 2010
Figure 15. New Hampshire population change by age, race, and hispanic origin, 2000 to 2010
Source: U.S. Census 2000, 2010
Figure 14b. New Hampshire population by race and hispanic origin, adults 18 and over, 2010

17
Although minority populations are growing, they remain spa-tially concentrated in just a few areas. Minorities represent a sig-nificant part of the population in the Concord-Manchester-Nash-ua urban corridor, as well as in the Hanover-Lebanon region and in a few areas of the Seacoast (Figure 16). Because the diversity of the child population is increasing much more rapidly than that of the adult population, areas where minority children represent a significant proportion of all children are more numerous (Figure 17). A comparison of Figures 16 and 17 underscores the greater diversity among children. This is particularly evident in the Con-cord-Manchester-Nashua corridor, where populations of minor-
ity children exceeding 40 percent can be found in a number of places (Figure 18). Concentrations of minority children are largest in the City of Manchester, where 30 percent of children belong to a minority. Here, neighborhoods with significant concentrations of minority children are tightly clustered in the urban core (Figure 19). In a state where diversity historically has been unusual, such large concentrations of minority children represent a challenge to school districts, health care providers, and communities that must meet the needs of these diverse groups. It also presents an oppor-tunity for these communities to embrace and celebrate diversity, as well as to use it to foster mutual understanding and acceptance.
Figure 16. Percent minority by census tract, 2010
Source: U.S. Census 2010
Figure 17. Percent minority under 18 by census tract, 2010
Source: U.S. Census 2010

18
Spatial Variation in Education, Income, and Poverty
The distribution of income, education, and poverty in the state varies by locale. New Hampshire is widely recognized for its high rates of educational achievement and income, as well as its low poverty rates. The percentage of New Hampshire adult college graduates (32.4 percent) is the seventh highest in the country, thanks, in part, to the inflow of well-educated migrants from other states. Such high educational levels contribute to New Hampshire’s high median family income of $75,500—the eighth highest in the country. This combination of high education and income levels contributes to the state having the lowest overall poverty and child poverty rates in the country.
Although New Hampshire compares favorably on most statewide measures of income, education, and poverty, spa-tial variation within the state is notable. Educational levels are highest on the Seacoast and in the Concord-Manchester-Nashua corridor, as well as in the Hanover-Lebanon area (Fig-ure 20). The proportion of adult college graduates is lowest in the North Country and in parts of western New Hampshire. As would be expected, there is a high correlation between in-come and educational levels. Median family income is highest on the Seacoast, in the Concord-Manchester-Nashua corri-dor, along the Massachusetts border and in scattered pockets around Hanover-Lebanon and Lake Winnipesauke.
Figure 18. Percent minority under age 18 by census tract, 2010—Concord, Manchester, Salem, and Nashua
Figure 19. Percent minority under age 18 by census tract, 2010—Manchester
Source: U.S. Census 2010 Source: U.S. Census 2010

19
Figure 20a. Median family income
Source: U.S. Census 2005-2009 American Community Survey
Figure 20b. Percent adults having education BA or higher
Source: U.S. Census 2005-2009 American Community Survey
Similarly, the state’s overall poverty levels are surprisingly varied by location. Poverty levels are higher in the North Country and along the Maine Border (Figure 21). For example, 12.4 percent of the population and 21.6 percent of the children in the city of Rochester are below the poverty line. The higher levels of poverty most likely stem from lower levels of educa-tion and income in these regions. In contrast, pockets of high child poverty exist in the Concord-Manchester-Nashua corri-
dor where education and income levels are high. In fact, there are several areas within the corridor where poverty levels are twice that of the state as a whole.10
Because poverty levels are highest for children, a careful look at this most vulnerable of populations is critical. The child poverty situation in the City of Manchester highlights the fact that even in a state with the lowest child poverty rate in the country, pockets of high child poverty exist. In the

20
Disparities in family incomes likely account for some of the differences in child poverty within the county, but not all of them. With a median family income of $80,200, Hillsborough County is above the state average of $75,400. However, within the county, median incomes vary considerably. Incomes are highest in the suburban areas at $92,000, and lowest in Man-chester at $61,000, with Nashua falling between the two at $77,400. Data suggest that since at least 1990, incomes have consistently been higher in suburban Hillsborough County than in the cities. However, these income disparities do not fully account for the fact that Manchester has more than twice the rate of child poverty than Nashua. Nor does it explain why the number of children in poverty in Manchester increased markedly between 1999 and 2010, while in Nashua, the num-ber barely changed.11 In a state with the lowest child poverty levels in the nation, it is puzzling that Manchester’s rates are nearly as high as those in Boston (26.7 percent) and New York City (28.4 percent). Explanations for such disparities are be-yond the purview of this report but certainly deserve the at-tention of policymakers as they plan for the future of New Hampshire’s most vulnerable populations.
Figure 21. Percent poverty
Source: U.S. Census 2005-2009 American Community Survey
0%
5%
10%
15%
20%
25%
1989 1999 2008-10
State Manchester Nashua Suburban Hillsborough
Perc
ent I
n Po
vert
y
Figure 22. Children in Poverty, Hillsborough County and State, 1989-2010
Sources: U.S. Census 1990, 2000 and 2008-2010 American Community Survey
City of Manchester, 24 percent of all children are below the poverty line (Figure 22). This represents a striking contrast with Nashua, where only 10.5 percent of the children are in poverty, or in suburban areas of Hillsborough County, where less than 5 percent of the children are in poverty. Data for 1989 and 1999 suggest that there have long been disparities in poverty levels, though the situation in Manchester appears to have worsened over the last decade.

21
Demographic change has been uneven across New Hampshire. The varied demographic change is evi-dent when considering demographic trends in urban
and rural New Hampshire, as well as in three of its ten counties, and in the Manchester-Nashua metropolitan area. The patterns of population change in these selected areas are produced by a very different combination of demographic elements.
Rural Growth Rates Exceed Urban Growth Rates
Most of New Hampshire’s population (62 percent) resides in its three metropolitan counties (Hillsborough, Rocking-ham, and Strafford) encompassing 819,000 residents. These counties grew by 6.3 percent since 2000, mostly as a result of natural increase. Between 2000 and 2010, there were 97,000 births in urban counties compared to 56,300 deaths, pro-ducing a natural increase of 40,600 (5.3 percent). This gain was supplemented by a small net migration gain of 1.0 per-cent. In all, just 8,000 more people moved into metropolitan areas than moved out.
The state’s 498,000 other residents live in seven nonmet-ropolitan (rural) counties, which grew by 6.9 percent. Com-pared to other states, the percentage of New Hampshire’s population residing in rural areas is disproportionately large. Some 38 percent of its residents live in nonmetropolitan counties compared to just 16 percent nationally. New Hamp-shire is also unusual in that its rural population increased at a higher rate than its urban population. Migration accounted for 86 percent of the population increase in rural New Hamp-shire compared to just 16 percent in the metropolitan areas. Natural increase was minimal in rural areas. The 49,000 rural births exceeded the 44,400 rural deaths by just 4,600. In all, there were only 1,104 rural births for every 1,000 deaths com-pared to 1,721 births per 1,000 deaths in urban counties. The lower birth-to-death ratio in rural areas reflects the higher mortality of its older populations and the fact that fewer ba-bies are born to a dwindling number of women in their prime child-bearing years. With low birth-to-death ratios, future growth in rural New Hampshire is highly dependent on mi-gration, which, as noted above, is extremely volatile.
Different Places, Different Trends
Population changes occurring in three New Hampshire coun-ties further demonstrate the demographic complexities. Carroll County is representative of 300 nonmetropolitan recreational counties around the country that are major rural growth nodes. Situated in an amenity-rich area and accessible from large urban centers to the south, its appeal as a recreational destination is re-flected in the fact that 42 percent of its housing is second homes. Carroll County’s 9.5 percent increase in population was the sec-ond highest in the state. However, this gain is considerably small-er than prior gains of 23 percent in the 1990s, and 27 percent in the 1980s. In all, in the last thirty years the county’s population grew from 28,000 to 48,000. Nearly all of this increase was the result of migration. In Carroll County, between 2000 and 2010 a natural loss of 700 due to deaths exceeding births was offset by a migration gain of 4,900 (11.2 percent) (Figure 23).12
Demographic Change Is Uneven Across New Hampshire
Figure 23. Demographic Change for Hillsborough, Carroll, and Coös Counties, 2000 to 2010
Source: U.S. Census 2000, 2010 and FSCPE Estimates

22
Carroll County’s migration stream is dominated by an in-flux of adults in their 50s and 60s, the hallmark of a recre-ational and retirement destination (Figure 24). Such amenity migration also stimulated an influx of families with working-aged parents, who are attracted by the economic opportuni-ties. Carroll’s proximity to metropolitan New Hampshire also makes it appealing to commuters. Carroll did lose young adults in their 20s, reducing the number of potential parents whose children would offset the high mortality of its large, older population. If not for the inflow of migrants, the county would have lost population rather than have grown at the sec-ond highest rate in the state.
Figure 24. Estimated net migration for selected New Hampshire counties, 2000 to 2010
Source: Johnson et al. 2005; Winkler and Johnson 2012
In northernmost Coös County, declining manufacturing and timber industries coupled with growing recreational activity and a new prison have produced an unusual demographic profile. For more than 100 years, wood and paper products were a main-stay of the local economy, with large mills employing genera-tions of residents who processed the timber of the vast northern forests. Today, only one mill remains and its future is uncertain. Yet Coös County is also situated in a scenic region with ski areas and grand old resorts that have welcomed generations of vaca-tioners, and now amenity migrants.
Coös County currently has 33,100 residents, roughly 1,200 fewer residents than it had in 1970, and it has lost population in each of the last three decades. There were 3,000 births in Coös County between 2000 and 2010, but more than 4,100 deaths. This produced a natural population loss of 3.3 percent. Coös also ex-
perienced natural decrease in the 1990s. However, between 2000 and 2010, Coös County gained migrants for the first time since 1980. This migration gain was the result of amenity migrants mov-ing into the county and the opening of a new prison.13 The migra-tion gain offset most of the county’s natural decrease, resulting in a population decline of just 56 people (0.2 percent), a considerable improvement over the loss of nearly 1,700 during the 1990s.
The differing influence of manufacturing and recreation is evident in local migration patterns. Coös County is still losing many of its 20- to 29-year-olds, as it has for decades. This trend is common in forestry, farming, and mining counties, where working-aged adults often leave to seek opportunities elsewhere. At the same time, the modest influx of adults age 50 to 59 reflects its growing appeal as a recreational destination.14 Coös County’s migration signature is an amalgam of manufacturing and rec-reational counties. In the first, out-migration of working-age adults is common while, in the latter, an influx of older amenity migrants is typical. Coös County is seeking to capitalize on its growing recreational appeal through a county-wide effort to cre-ate a common brand. However, this effort must overcome the fierce independence of local communities in a state whose motto is “live free or die.”15 Such rebranding and regional cooperation is an important strategy for rural communities who must adapt to the economic and demographic transformations facing New Hampshire in the new century.
Hillsborough County, with 400,700 residents in 2010, is the most populous in the state. Hillsborough includes the state’s two largest cities: Manchester, which has transformed itself from a fading mill town to a diversified regional center, and Nashua, which straddles the border with Massachusetts. The county also incorporates a significant suburban popu-lation. Over the past several decades, the proximity of both cities to the sprawling Boston urban area has contributed to their historical growth. Between 1980 and 2000, Hillsborough County grew by over 100,000 people (38 percent), but growth has slowed since 2000, with a gain of just 19,900 residents (5.2 percent). All this recent population increase was due to natural increase. There were 22,000 more births than deaths, enough to offset the loss of 2,100 through migration and pro-duce a population gain of 5.8 percent. Hillsborough was the only New Hampshire county to have a net loss of migrants during the decade. Although the county gained some adults in their 30s, this gain was not enough to offset the out-migra-tion of young adults in their 20s and people of retirement age. This migration profile is consistent with national trends for smaller metropolitan areas.

23
Within Hillsborough County there were striking spatial dif-ferences in the patterns of demographic change. The Manches-ter-Nashua Metropolitan Area is divided here into three parts: the City of Manchester with a population of 109,600 in 2010, the City of Nashua with a population of 86,600, and the balance of Hillsborough County with a population of 204,600 (this last area will be referred to here as the suburbs). During the 1990s, growth was widespread. Manchester and Nashua grew by 7.9 percent and 8.6 percent, respectively, and the suburban gain was 19.2 percent. Growth in all three areas slowed between 2000 and 2010 (Figure 25). Manchester grew by just 2,600 (2.4 percent); Nashua declined by -100 (-0.1 percent); and the suburban population grew by 17,400 (9.3 percent). Both cities lost migrants: Manches-ter had a net out-migration of 3,300 (-3.1 percent), and Nashua had a net loss of 5,100 (-5.9 percent). The minimal growth in the cities was the result of natural increase; births exceeded deaths by 5,800 (5.5 percent) in Manchester, while Nashua gained 4,900 (5.7 percent) from natural increase. Demographic trends in the rest of the metropolitan area contrasted sharply with those in the cities. Most of the suburban population growth also came from a natural increase of 11,200 (6.0 percent), but there was also a gain from migration of 6,200 (3.3 percent).
The Manchester-Nashua metropolitan area is the most di-verse part of New Hampshire with reference to race and His-panic origin. Nearly 49 percent of the minority residents of the state live in Hillsborough County. Approximately 12.4 percent of the area’s population was minority in 2010. Hispanics, the largest minority, numbered just over 21,200 (5.3 percent), and Asians, the second largest minority, numbered 12,900 (3.2 percent). Blacks are 1.8 percent of the population with all other groups constituting the remaining 2.0 percent. Non-Hispanic whites represent 87.6 percent of the total. As a share of the metropolitan area’s total population, the number of minorities is fairly modest. However, minorities produced all the population gain between 2000 and 2010, growing by 20,000 (67.8 percent) to 49,500 dur-ing the period. The white population remained stable at 351,200.
Minorities and non-Hispanic whites contributed unevenly to population growth in the cities. Minority population gains ac-counted for all the increase in both Manchester and Nashua (Fig-ure 26), the first growing by 8,200 (72 percent) and the latter by 6,500 (55 percent). In contrast, the non-Hispanic white popula-tion in each city declined. The loss in Manchester was -6.0 percent (-5,700), and it was -8.8 percent (-6,600) in Nashua. Trends were quite different in the suburbs. Most of the suburban population gain was fueled by non-Hispanic white growth of 12,200 (6.3 per-cent). The minority population gain in the suburbs was smaller in absolute terms at 5,300, but constituted a greater percentage gain (82 percent). Minorities still constituted a smaller share of the sub-urban population (5.7 percent) than they did of the population of Manchester (18.0 percent) and Nashua (21.0 percent).
Figure 25. Demographic change in Hillsborough County, 2000 to 2010
Source: U.S. Census 2010 and FSCPE Estimates
Figure 26. Hillsborough population change by race and Hispanic origin, 2000-2010
Source: U. S. Census 2000, 2010
24
New Hampshire’s changing demography has significant implications for the state. Population growth slowed in New Hampshire in the first decade of the twen-
ty-first century because migration contributed far less to the state’s population than it had during the 1990s. This population increase is spatially uneven, with some communities growing significantly while others grew slowly or lost population. New Hampshire’s population is also growing older as the large baby boom cohorts age in place, middle-aged and older adults move into the state, the young adult population grows only modestly, and the number of children diminishes. The first decade of the twenty-first century also highlights new patterns of racial and ethnic diversity in New Hampshire. Although diversity re-mains modest, it is growing, and children are in the forefront of this change. These demographic changes produce both chal-lenges and opportunities. Policymakers must understand these varied patterns of demographic change to design policies that are comprehensive enough to address the multifaceted chal-lenges that the state and its communities face.
Significant policy concerns stem from the varied patterns of population change documented here. Population growth is slowing overall in New Hampshire, but some communi-ties are booming. The days of double-digit growth fueled by large influxes of migrants may be over, but fast-growing communities, including those just beyond Boston’s urban edge and in amenity-rich areas, still need programs and ex-pertise to address the complex issues of managing growth and development. These needs are particularly acute in com-munities with recreational and natural amenities. Though the recession is currently slowing growth in these commu-nities, it may well resume when the recession eases and the large cohorts of retiring baby boomers swell the ranks of amenity migrants. In these amenity areas, rapid population increase puts additional pressure on environmentally sen-sitive riparian, forest, historical, and scenic areas. For the small governmental units that are pervasive in New Hamp-shire, managing rapid growth will be a particular challenge. Many of them simply do not have, and likely cannot afford, the professional staff needed to address the challenges that such growth produces, especially during a major recession that is stretching limited resources. Regional initiatives to provide such professional staff may face resistance from lo-cal governments protective of their autonomy.
In other parts of the state, the population slowdown has been profound. In some of these areas, more people are now dying than being born and young adults continue to leave, as they have for decades. Here policy efforts must focus on ameliorating the adverse impacts of a diminishing popula-tion on the provision of critical services and support pro-grams. Also, policies must be designed to provide access to needed resources (internet, capital, and expertise) to ex-pand the local infrastructure and enhance future develop-ment opportunities. Once again, this will require regional cooperation among local governments that have long been fiercely independent.
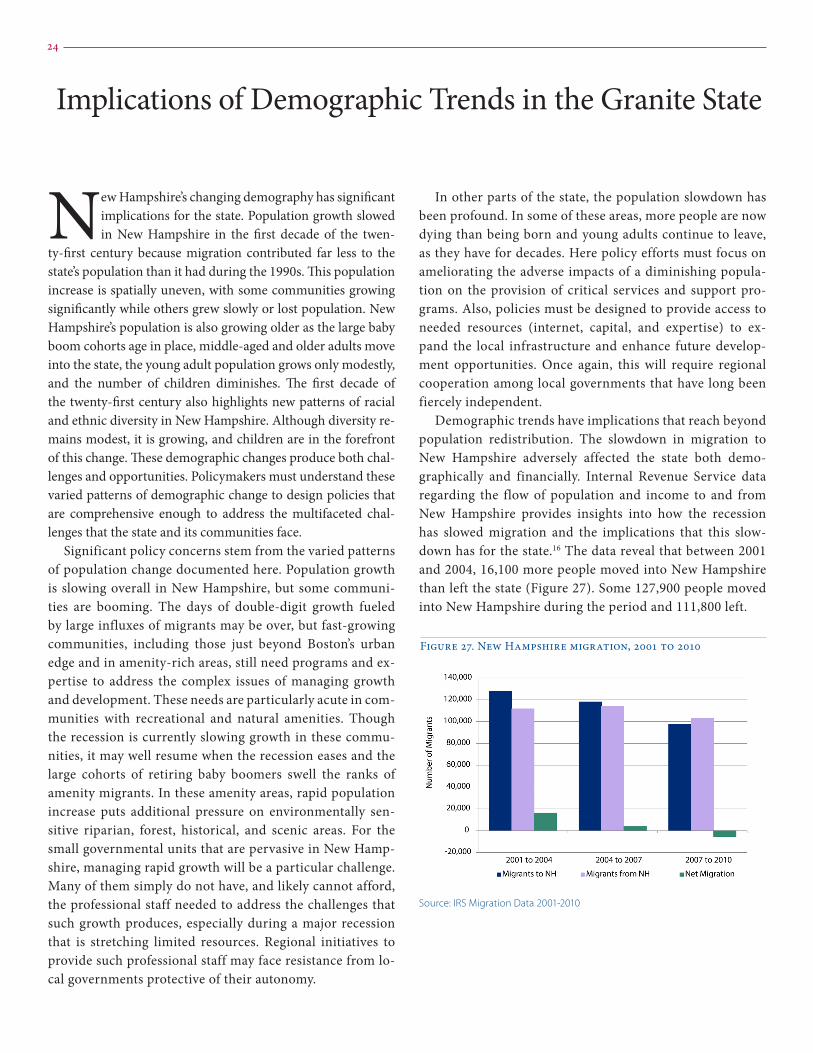
Demographic trends have implications that reach beyond population redistribution. The slowdown in migration to New Hampshire adversely affected the state both demo-graphically and financially. Internal Revenue Service data regarding the flow of population and income to and from New Hampshire provides insights into how the recession has slowed migration and the implications that this slow-down has for the state.16 The data reveal that between 2001 and 2004, 16,100 more people moved into New Hampshire than left the state (Figure 27). Some 127,900 people moved into New Hampshire during the period and 111,800 left.
Figure 27. New Hampshire migration, 2001 to 2010
Source: IRS Migration Data 2001-2010
Implications of Demographic Trends in the Granite State

25
The sheer magnitude of the migration that produced this modest net change is stunning. Nearly 240,000 people migrat-ed to produce a net change of 16,100. In just these three years, 18 percent of the state’s population turned over from migra-tion. This migration gain produced a significant income gain. Households leaving New Hampshire had an aggregate income of roughly $3.41 billion, whereas those moving in earned $4.46 billion.17 Stated differently, New Hampshire gained $1.05 bil-lion dollars in the 2001-2004 migration exchange, as well as 16,100 residents (Figure 28). As the decade progressed, both the migration and the income gain dwindled. Between 2004 and 2007, the state gained just 3,900 migrants, and the in-come gain diminished to $637 million. With the onset of the recession, New Hampshire’s traditional migration advantage disappeared. Between 2007 and 2010, the state experienced a net migration loss of -5,500, and its income gain was just $46 million. Over the entire period, the state gained $1.7 billion because more migrants arrived than left, and because the in-coming population had higher household incomes than those leaving. However, by the end of the decade, migration losses were mounting and the income advantage vanished. If migra-tion does not pick up again as the recession eases, future in-come losses to the state will be significant.
New Hampshire were born in the state compared to 67 percent of the native born residents of the United States as a whole. Only seven states have a smaller proportion of residents born in-state. Among New Hampshire adults 25 and over, just 33 percent were born in the state. Migrants bring considerable human capital. For example, adult migrants to New Hampshire are better educated than those born in the state, with 36 percent of adult migrants to the state having a college degree compared to 24 percent of New Hampshire-born adults. Therefore, the migration slowdown has significant repercussions for the future intellectual capital of the state as well as direct financial consequences.
Migration also brings social capital. For a state with a modest birth rate and an aging population, the influx of 30- to 49-year-olds and their children is particularly important. These adults are near the peak of their earning potential, and they augment the ranks of volunteers and leaders for nonprofit and civic orga-nizations that form the state’s social backbone. The children who come with them or are born after they arrive in New Hampshire present short-term financial challenges to school districts where they are enrolled, but they represent a long-term investment for a state that needs to replenish its young adult labor force. New Hampshire’s modest net inflow of retirees brings additional so-cial capital because older migrants tend to be active in social, civ-ic, religious and service organizations in the communities where they settle, and they bring with them the expertise of a lifetime as well as considerable financial resources.18 Integrating these new arrivals into community life presents challenges, so towns need to promote an inclusive environment that encourages participa-tion by both recent arrivals and long-term residents.19 However, as noted above, this influx of older residents does have the dis-advantage of accelerating the population aging process, which is already a matter of concern.
Although the state benefits from the inflow of migrants from several age groups, attracting and retaining young adults in their 20s is a challenge. Between 1990 and 2005, there was no net gain or loss of migrants aged 20 to 29 because the inflow of these young people roughly matched the outflow. However, as the re-cession began to take hold, New Hampshire experienced a 10.6 percent net loss of 20- to 29-year-olds, mostly late in the decade. Because employers covet young adults, their numbers have been a significant policy concern for some time.20 Aggressive pro-grams exemplified by the “Stay, Work, Play Initiative” should be considered to retain young adults, encourage those who left to return, and attract more young adults to the state.21
Figure 28. New Hampshire migration income flows, 2001 to 2010
Source: IRS Migration Data 2001-2010
Migration to the state has more than just an immediate finan-cial benefit; it is also a critical source of human, social and intel-lectual capital. Contrary to common stereotypes, most of New Hampshire’s population has not lived in the state for generations. In 2010, just 44 percent of the United States-born residents of

26
The state’s aging population is a matter of significant concern as well. Currently, the proportion of the state’s population that is 65 or older is only slightly above the national average, but this older population will more than double in the next twenty years. This raises significant policy concerns for government at all levels. The New Hampshire Center for Public Policy has nicely documented some of the likely policy impacts of this “Sil-ver Tsunami” in a recent report.22 They suggest that the growing older population will reshape how the state of New Hampshire pays for health care, shifting much of the burden from private to public sources. It will put additional financial pressure on the state budget and increase expenses for state employee and re-tiree pensions and health care. The report also notes that local governments will face challenges in providing social and health care services to this growing population of seniors, and they will need to consider the implications for education of granting tax exemptions to seniors, when seniors exceed the school age pop-ulation. The Policy Center report also voices concerns about the state’s ability to retain and recruit a high-quality health care labor force when both the health care workforce and the population that needs its services are aging rapidly. These problems are ex-acerbated by the uneven distribution of seniors within the state, which means that many of these challenges will impact some areas more than others. As the Center for Public Policy’s report emphasizes, now is the time to prepare for this Silver Tsunami. Findings here underscore the urgency of addressing the issues raised in the Center’s report. A rapid increase in New Hamp-shire’s senior population is inevitable, and it is coming soon.
New Hampshire’s growing diversity also presents challenges and opportunities. The growth of the population of minority children partially offsets the declining number of children. This is an important advantage to a state challenged by an ag-ing population and a potential shortage of young people in the near future. Because children are in the forefront of the state’s
growing diversity, institutions that serve young people, such as education and health care, will be the first to face the challeng-es of this growing diversity. For example, the new racial and ethnic diversity among New Hampshire’s children, specifically those that face language or other cultural barriers, heightens the need for appropriate public policy responses to changing health conditions (for example, culturally-sensitive obstetrics and pediatric care), school programs (such as pre-school pro-grams, ESL, or LEP) and community services (including recre-ational programs, teen employment, and juvenile justice). In-stitutions that serve children are among the most expensive for local governments. Adjusting to growing diversity is a finan-cial challenge for communities during the best of times, much less when they face the worst recession in a generation. Nor are financial problems the only challenges communities face in dealing with diversity. In other parts of the United States, grow-ing minority populations are transforming the social fabric of many communities, while raising important policy questions (schooling, political participation, racial tensions, and more) about the successful incorporation of diverse populations into American society.23 New Hampshire’s future depends, in part, on its children and the residential patterns of those children, that is, whether they are increasingly growing up in multira-cial and multiethnic communities where opportunities for mutual understanding and acceptance are greater.24 For New Hampshire’s young people, their exposure to racial diversity—in neighborhoods and communities—will remake patterns of interracial relations and friendship networks, now and in the future.25 New Hampshire must be prepared to embrace such opportunities and address related challenges as the minority child population continues to grow. Because minorities are concentrated within a few areas and non-Hispanic whites re-main the majority in most of the state, the challenges and op-portunities facing policymakers will be localized.
27
New Hampshire gained 80,700 residents between 2000 and 2010. This 6.5 percent gain exceeds that of every other northeastern state, though it is modest compared
to growth rates elsewhere in the nation. Natural increase and mi-gration fueled growth, though the relative contribution of each varied over the course of the decade. New Hampshire gained both financial and human capital from migrants, and as a result, the migration slowdown in the middle of the decade and its re-versal to migration loss late in the decade is of significant con-cern. New Hampshire is and will likely remain a largely white, non-Hispanic state, but minorities accounted for a dispropor-tionate share of the population increase during the past decade. As a result, the state is becoming more diverse, and this diver-sity is growing fastest among the state’s youth. New Hampshire is also growing older, primarily because its large baby boomer cohorts are aging, but also because it continues to gain modest numbers of seniors and family-age households. However, in the last few years it has experienced a net migration loss of young adults in their 20s and a decline in its population of children.
The demographic trends under way in New Hampshire pres-ent both challenges and opportunities. Migrants contribute to the well-being of the state by providing human capital that en-hances the workforce and contributes to the state’s social, intel-lectual, and economic life. However, the aging of the state’s popu-lation over the next several decades will put considerable pres-sure on the financial resources of state and local governments. Furthermore, the spatial disparities in age, diversity, education, income, and poverty across the state will present significant chal-lenges for government, businesses, and nonprofits.
New Hampshire’s future depends, in part, on the size, com-position, and distribution of its population. This report pro-vides insights into the patterns of demographic change under way in the state using the latest data available. For New Hamp-shire to continue to grow and prosper, policymakers must be cognizant of these demographic trends as they consider the fu-ture needs of its people, institutions, and organizations.
Summary

28
Methods and Data
Most of the data in this report are from the 1970 to 2010 decennial census, supplemented with infor-mation from the American Community Survey
five-year data set from 2005 to 2009 and three-year data set for 2008 to 2010. Additional data are from the Federal-State Coop-erative Population Estimates program (FSCPE), which provides information on births and deaths for April 1970 to July 2009.26 Births and deaths from July 2009 to April 2010 were estimated at .75 of the amount from July 2008 to July 2009. Estimates of net migration were derived by the residual method, whereby net migration is what is left when natural increase (births mi-nus deaths) is subtracted from total population change.
Data for the racial and Hispanic origin of the population are from the 1990, 2000, and 2010 censuses. Five ethno-racial groups are used: (1) Hispanics of any race, (2) non-Hispanic whites, (3) non-Hispanic blacks, (4) non-Hispanic Asians, and (5) all other non-Hispanics, including those who reported two or more races.
The age-specific net migration estimates for 2000 to 2010 are preliminary. The estimation procedures have proved quite reli-able in the past, but results must be interpreted with caution. Estimates were produced using a modified cohort-component method. Detailed birth and death data by age, race, and sex come from the National Center for Health Statistics. The 2000 census populations were adjusted for the enumeration under-count prior to calculating age-specific net migration. However, because undercount information is not yet available for the 2010 census, only preliminary adjustments were made to it. The 1990 to 2000 age-specific migration comes from prior pub-lished work. A detailed description of the methods employed for these calculations is available.27
Data on migration and income flows to and from New Hampshire are from the Internal Revenue Service County-to-County Migration Flow Data. The IRS measures migration by comparing the county of residence in successive years of income tax returns. For each return indicating a change in county of residence, the county of origin, destination, number of depen-dents, and income is reported. Coverage includes between 95 and 98 percent of all tax returns filed. However, the data series excludes persons who do not file returns (because of low income, income from non-taxed retirement plans, recent international immigrants, some undocumented immigrants, and the like). Although the coverage is not complete, the vast majority of the population is included and findings reported for the IRS data are likely to closely approximate overall migration trends.
The unit of analysis for this study varies. In some analyses, the entire state is used, in other instances counties, towns, or census tracts are used. Though counties are not significant units of government in New Hampshire, they are important units for the collection of demographic data. They are also the basic building blocks for metropolitan areas. In many cases, the county-level data are aggregated to other levels of geography. For purposes of this study, the Boston met-ropolitan area is defined as the Boston-Cambridge-Quincy Metropolitan Statistical Area.

29
Endnotes
1. The first post-censal estimates released recently by the Census Bureau show that New Hampshire’s population gain from 2010 to 2011 was 1,400. This gain exceeds that in either of the prior two years and occurred because the net migration loss diminished. This could suggest that the demographic situation for the state is improving. However, it is important to recognize that these are only population estimates, and though they have proven reliable in the past as indicators of demographic change, it will likely be some time before demographers have sufficient evidence to ascertain whether the demographic situation is improving for New Hampshire. 2. Brady Hamilton, J.A. Martin, and S.J. Ventura, “Births: Pre-liminary Data for 2010,” National Vital Statistics Reports, vol. 60 (2010), available at http://www.cdc.gov/nchs/data/nvsr/nvsr60/nvsr60_02.pdf.
3. New Hampshire last experienced a migration loss in the early 1990s when the state was in the midst of a significant recession. During the same period, Pease Air Force Base near Portsmouth closed, which resulted in nearly 6,000 military personnel leav-ing the state in a very short period of time.
4. The Internal Revenue Service data used here measure inter-nal migration. They do not include immigrants. A few people who returned to the United States from abroad are included, but their numbers are minimal.
5. Kenneth M. Johnson, “With Less Migration, Natural In-crease Is Now More Important to State Growth,” Fact Sheet no. 17 (Durham, NH: Carsey Institute, University of New Hampshire, 2009).
6. Prior national age-specific net migration research sug-gests very distinct migration signatures for counties based on their proximity to metropolitan areas. See Kenneth M. Johnson et al., “Temporal and Spatial Variation in Age-Spe-cific Net Migration in the United States,” Demography, vol. 42, no. 4 (2005): 791-812.
7. The difference between births and first grade enrollments declined sharply after 2007 as the recession deepened and mi-gration to New Hampshire slowed. Birth data are from the New Hampshire Division of Vital Records, available at: http://nh-vrinweb.sos.nh.gov/Default.aspxVital. School enrollment data are from the New Hampshire Department of Education, avail-able at: http://www.education.nh.gov/data/attendance.htm.
8. Earlier research indicates the state gained migrants in their 20s between 2000 and 2005, but this flow reversed later in the decade. Kenneth M. Johnson, “The Changing Faces of New Hampshire: Recent Demographic Trends in the Granite State,” Reports on New England (Durham, NH: Carsey Institute, Uni-versity of New Hampshire, 2007).
9. Preliminary analysis of age-specific net migration data suggests fewer 25- to 29-year-olds moved to the state later in the decade (data not shown), a finding consistent with other evidence of a slower inflow of migrants to the state because of the recession.
10. It is important to keep this discussion of high poverty levels in the state in proper context. Even the higher levels of poverty reported in the northern regions of the state and most of the pockets of poverty in southern New Hampshire remain modest when compared to poverty levels in most other states.
11. The poverty statistics reported for the most recent period are based on data from the American Community Survey for 2005 to 2009 and 2008 to 2010. The data for 1999 and 1989 are from the 1990 and 2000 censuses, respectively. Though the data for each pe-riod represent the most comprehensive representation of poverty available and can be compared cross-sectionally, making compari-sons between time periods is complicated by differences in data collection and sampling. Longitudinal comparisons of these dif-ferent data sets properly convey the overall patterns of change in poverty. That is, a large increase in poverty occurred in Manches-ter between 1999 and 2008-2010. The actual numerical change in poverty is subject to some error of estimate as well as differences due to the data collection techniques employed.

30
12. Kenneth M. Johnson, “The Continuing Incidence of Natu-ral Decrease in American Counties,” Rural Sociology, vol. 76, no. 1 (2011): 74-100.
13. Prison inmates are enumerated by the census in the place in which the prison is located. Thus, the new state prison built in Coös County produced a population gain for the county and accounted for a significant part of the county’s migration gain. Most of the inmates are in their 20s, 30s, and 40s. They account for much of the age-specific net migration gains (or diminished losses) in these age groups in Coös County be-tween 2000 and 2010.
14. Johnson et al., “Temporal and Spatial Variation.”
15. Michele Dillon, “Stretching Ties: Social Capital in the Re-branding of Coös County, New Hampshire,” New England Is-sues Brief (Durham, NH: Carsey Institute, University of New Hampshire, 2011).
16. IRS data report annual movements of the population. Not all the migrants who come to New Hampshire stay, and some of the migrants who leave New Hampshire eventu-ally return. Therefore, conclusions drawn from analysis of IRS migration data are indicative of the overall volume of migrants and income to and from the state longitudinally. However, they may be less reliable at estimating the number of long-term migrants to and from the state. The slowing of migration reflected in the IRS data is consistent with other data sources in documenting that migration diminished over the course of the decade. For additional information about the high levels of migration to New Hampshire and its implications, see Kenneth M. Johnson, Dante Scala, and An-drew Smith, “Many New Voters Make the Granite State One to Watch in November,” New England Issue Brief (Durham, NH: Carsey Institute, University of New Hampshire, 2008).
17. All dollar values are reported in 2010 dollars. Note the in-come reported is only in the year of migration, so the longitu-dinal impact of these migration streams is considerably larger. That is, for a household moving to New Hampshire in 2002, only the income earned in that tax year is included here. The additional income earned by the migrants in 2003 to 2010 is not included. Thus, the estimate of the income gain garnered by migration reported here are quite conservative.
18. Nina Glasgow and David Brown, Rural Retirement Mi-gration (New York: Springer, 2008); and “Grey Gold: Do Older In-Migrants Benefit Rural Communities?” Policy Brief no. 10 (Durham, NH: Carsey Institute, University of New Hampshire, 2008).
19. Glasgow and Brown, Rural Retirement Migration.
20. The “Final Report of the Governor’s Task Force for Recruit-ment and Retention of a Young Workforce for the State of New Hampshire” is available at: http://www.usnh.edu/initiatives/doc-uments/TaskForceFinal061809.pdf.
21. More information on the Stay, Work Play Initiative is avail-able at: http://www.stayworkplay.org/.
22. Steve Norton, “New Hampshire’s Silver Tsunami: Aging and the Health Care System” (Concord: New Hampshire Center for Public Policy, 2011).
23. Douglas S. Massey, New Faces in New Places: The Changing Geography of American Immigration (New York: Russell Sage Foundation, 2008).
24. Robert D. Putman, “E Pluribus Unum: Diversity and Com-munity in the Twenty-First Century,” Scandinavian Political Studies, vol. 30 (2007): 137-174.
25. K.M. Johnson and D. T. Lichter, “The Growing Diversity of America’s Children and Youth: Spatial and Temporal Di-mensions,” Population and Development Review, vol. 36, no. 1 (2010): 151-176; Kara Joyner and Grace Kao, “School Racial Composition and Adolescent Racial Homophily,” Social Sci-ence Quarterly, vol. 81 (2010): 810-826; Daniel T. Lichter and Warren Brown, “Race, Immigration, and the Future of Mar-riage,” Marriage and Families: Complexities and Perspectives, edited by H. E. Peters and C.M.K. Dush (New York: Columbia University Press, 2009).
26. Federal-State Cooperative Population Estimates are available at: http://www.census.gov/popest/data/counties/totals/2009/in-dex.html.
27. See Johnson et al., “Temporal and Spatial Variation” and R. Winkler and K. M. Johnson, “Preliminary Estimates of Age-Specific Migration, 2000-2010,” Applied Population Lab, University of Wisconsin (2012) forthcoming.

31
About the Author
Kenneth M. Johnson is senior demographer at the Carsey Institute and professor of sociology at the University of New Hampshire. He is a nationally recognized expert on U.S. demographic trends. His research at the Carsey Institute examines national and regional population redistribution trends, rural and urban demographic change, the growing racial diversity of the U.S. population, and the relationship between demographic and environmental change.
Dr. Johnson has authored a book and more than 150 articles, reports, and papers. His research has been published in aca-demic journals, including Demography, Population and De-velopment Review, Social Forces, Ecological Applications, the Wilson Quarterly, and Rural Sociology. His research has also been reported in the New York Times, the Wall Street Journal, the Chicago Tribune, the Los Angeles Times, the Washington Post, and USA Today, and he has appeared on ABC’s World News Tonight, NBC’s Nightly News, CNN, BBC, and Nation-al Public Radio. His research has been funded by grants from the National Institutes of Health, U.S. Department of Agri-culture, Economic Research Service, and U.S. Forest Service.
Dr. Johnson received his doctorate degree in sociology and de-mography from the University of North Carolina, Chapel Hill, and his undergraduate training at the University of Michigan.
.


Building Knowledge for families and Communities
About the Carsey InstituteThe Carsey Institute conducts policy research on vulnerable children, youth, and families and on sustainable community development. We give policy makers and practitioners the timely, independent resources they need to effect change in their communities.
The Carsey Institute was established in May 2002 from a generous gift from alumna and noted television producer Marcy Carsey.
Building Knowledge for families and Communities
Carsey Institute University of New Hampshire Huddleston Hall73 Main StreetDurham, New Hampshire 03824-3563
603-862-2821
www.carseyinstitute.unh.edu