New GOME/ERS-2 Level-1 Product In-Flight Calibration … · ESA’s GOME-Evolution project started...
25
New GOME/ERS-2 Level-1 Product In-Flight Calibration and Degradation Monitoring www.DLR.de • Chart 1 M. Coldewey-Egbers 1 , B. Aberle 1 , S. Slijkhuis 1 , D. Loyola 1 , and A. Dehn 2 1 DLR-IMF and 2 ESA-ESRIN ESA - ACVE Workshop, Frascati, 18 October 2016
Transcript of New GOME/ERS-2 Level-1 Product In-Flight Calibration … · ESA’s GOME-Evolution project started...

New GOME/ERS-2 Level-1 Product In-Flight Calibration and Degradation Monitoring
www.DLR.de • Chart 1
M. Coldewey-Egbers1, B. Aberle1, S. Slijkhuis1, D. Loyola1, and A. Dehn2
1DLR-IMF and 2ESA-ESRIN
ESA - ACVE Workshop, Frascati, 18 October 2016
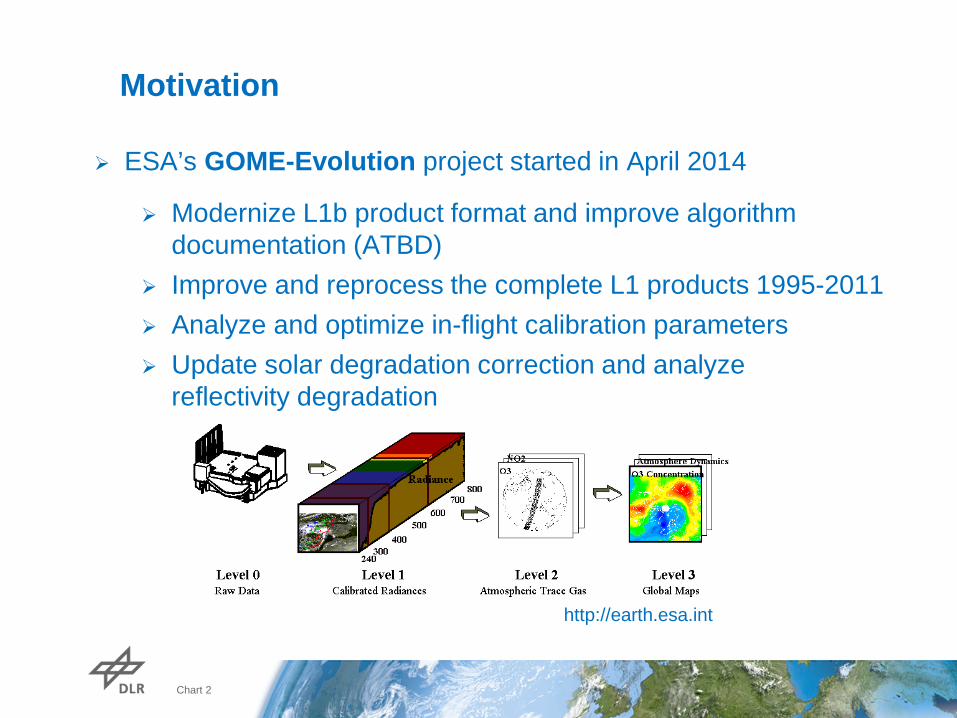
Chart 2
Motivation
ESA’s GOME-Evolution project started in April 2014
Modernize L1b product format and improve algorithm documentation (ATBD)
Improve and reprocess the complete L1 products 1995-2011 Analyze and optimize in-flight calibration parameters Update solar degradation correction and analyze
reflectivity degradation
http://earth.esa.int

Chart 3
New GOME Level-1 Product
NetCDF-4-CF compliant.
Similar to currently developed or planned EO products, especially to those of the Sentinel missions.
The similarity to other EO products should lead to reusable reading software with little or no adaptations to the various products.
The product shall additionally be compliant to following standards:
EOP (Earth Observation Programme, ESA)
EO-FFS (Earth Observation – File Format Standard, ESA)
INSPIRE (Infrastructure for spatial information in Europe, EU based on ISO)
The measurements will be organized in netCDF-4-groups for modes and bands. Geolocation and other associated data will be incorporated in such a group and match to the measured ground pixels. It will not be necessary to interpolate or co-add geolocation data for certain ground pixels as in older products.
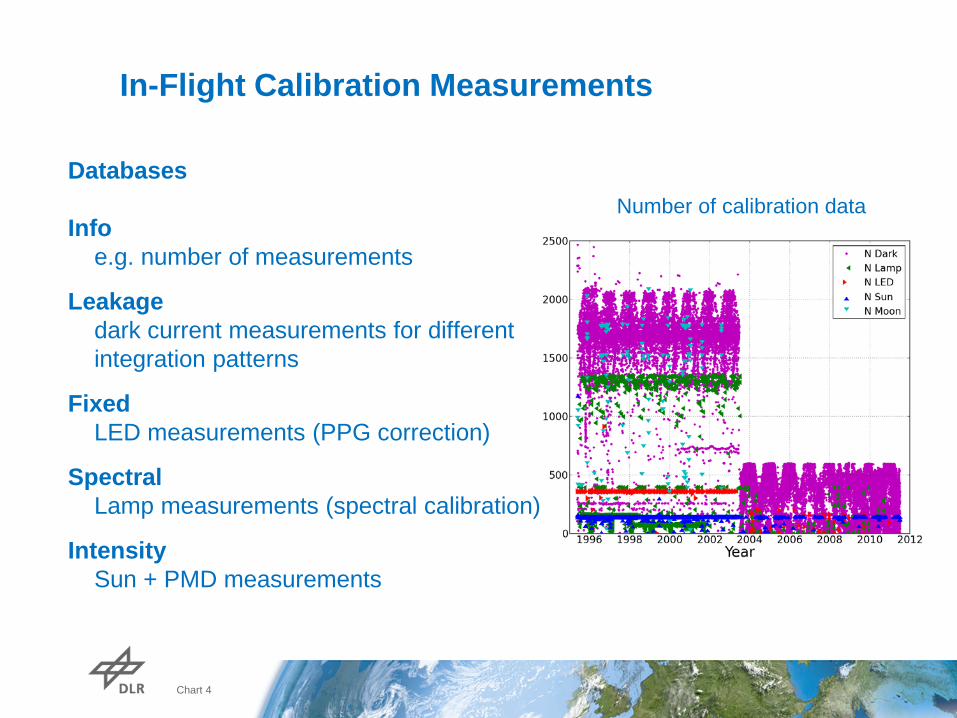
Chart 4
In-Flight Calibration Measurements
Databases Info
e.g. number of measurements
Leakage dark current measurements for different integration patterns
Fixed LED measurements (PPG correction)
Spectral Lamp measurements (spectral calibration)
Intensity Sun + PMD measurements
Number of calibration data

Chart 5
GOME Mean Sun Reference Spectra
Channel 4
Channel 3
Channel 2
Channel 1
Ch1 Ch2 Ch3 Ch4
Dichroic filter
Anomalies in 2001 due to gyroscope failure

Chart 6
PMD Measurements and Q-Factors
PMD Signal Relative Change vs. 1995 Q-Factors
Q-Factors: Relative difference between PMD signal and the expected PMD signal from the corresponding channel signal assuming unpolarized input.

Chart 7
GOME Predisperser Temperature
Quartz predisperser prism is one of the key elements in the optical system
Refractive index depends on wavelength and temperature
Temperature increases along an orbit due to warming of the satellite by the sun and partly because light passes through the instrument
Temperature changes affect the wavelength calibration
Long-term increase is due to degradation of the thermal system
Outliers are connected to instrument and cooler switch-offs

Chart 8
Wavelength Calibration Improvements
GOME houses a platinum-chromium-neon hollow cathode emission lamp
Calibration coefficients: fitting a polynomial through pixel-wavelength pairs
Analyzed individual lamp lines:
67 lines are available (13, 14, 18, 23)
analyze line parameters (line position, intensity, skew, FWHM) as a function of time
switch-on / -off individual lines for the polynomial fit in each channel
investigate stability of the calibration, i.e. standard deviation of each wavelength (assigned to 4x1024 pixels) for a fixed temperature 281.9K
In channels 1, 2, and 3: curious lamp lines were identified
No changes in channel 4

Chart 9
Spectral Lamp Measurements
Ch 1: 283nm Ch 2: 391nm
Ch 3: 582nm Ch 4: 668nm

Chart 10
Spectral Lamp Measurements
Ch 2: old coefficients Ch 2: new coefficients

Chart 11
Dark Current Measurements
→ Increase: 4-6 BU/s / 10 years
Integration time pattern: Scan Integration time pattern: LED Integration time pattern: Moon (Band 1a: 12s and Bands 2-4: 1.5s) (Bands 1-4: 30s) (Band 1a: 60s and Bands 2-4: 6s)

Chart 12
Dark Current Noise SAA
Old
Integration time pattern: Scan Integration time pattern: LED Integration time pattern: Moon

Chart 13
PMD Noise Integration time pattern: Scan Integration time pattern: LED Integration time pattern: Moon

Chart 14
GOME Solar Degradation Monitoring Ch
1 2 3 4

Chart 15
Solar Degradation Correction (1)
1. Polynomial fit vs. wavelength
Ch 1: n_degree = 3
Ch 3: n_degree = 2
Ch 2: n_degree = 3
Ch 4: n_degree = 1

Chart 16
Solar Degradation Correction (2)
2. Apply Savitzky-Golay smoothing filter (vs. time) to each coefficient 3. Store coefficients as a function of time in look-up tables
Channel 1 Channel 3
Channel 2 Channel 4

Chart 17
GOME Solar Degradation Correction - Residuals

Chart 18
GOME PMD Degradation Correction

Chart 19
GOME Reflectivity Degradation Monitoring
http://calval.cr.usgs.gov/rst-resources/sites_catalog/ceos-reference-sites/#CEOS
Selected 4 of 6 CEOS standard reference test sites Pseudo-Invariant Calibration Site (PICS) Libya-1, and -4, and Algeria-3 and -5 GOME data for almost the entire period
Characteristics: temporal stability, uniformity, homogeneity high reflectance (sand dunes) climatologically low aerosol loading practically no vegetation
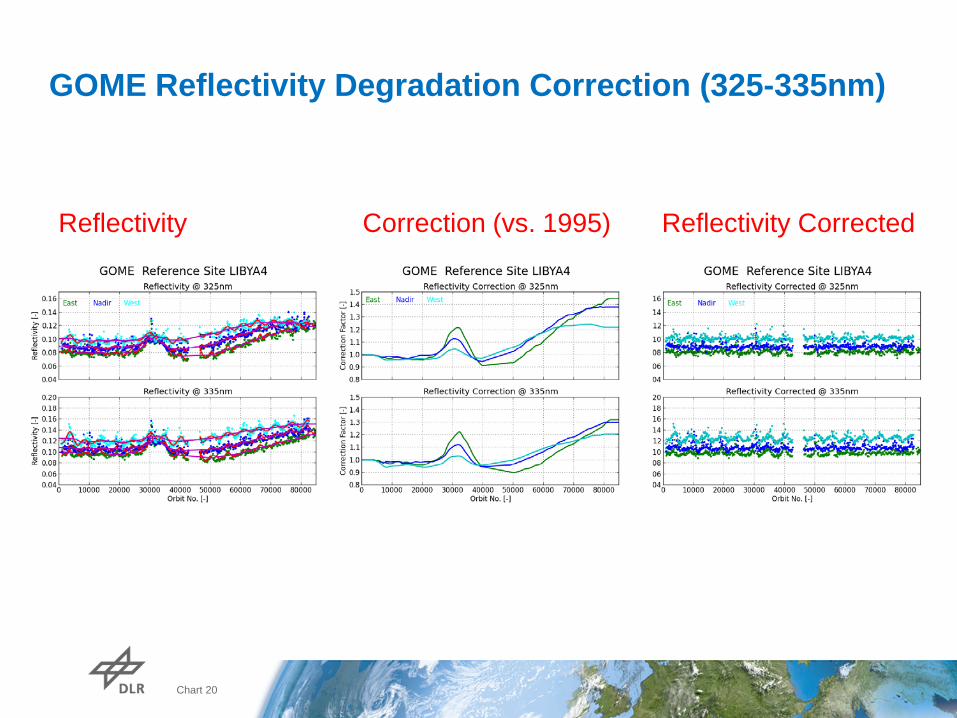
Chart 20
GOME Reflectivity Degradation Correction (325-335nm)
Reflectivity Correction (vs. 1995) Reflectivity Corrected

Chart 21
Use median of four reference sites
Correction comparable to soft-calibration approach used in GODFITv3 total ozone retrieval algorithm (Lerot et al., 2014) -> Poster No. 31: GODFITv4 by Lerot et al.
Repeat analysis with final level-1 products
GOME Reflectivity Degradation Correction (325-335nm)
Lerot et al., JGR, 2014

Chart 22
Summary
Analyzed GOME/ERS-2 in-flight calibration data → monitor the long-term behavior of the GOME instrument
Optimized calibration settings → spectral calibration and dark current correction
Recomputed solar degradation correction
Computed degradation correction for PMDs
Analyzed reflectivity degradation correction for level-2 fitting window 325-335nm (ozone)
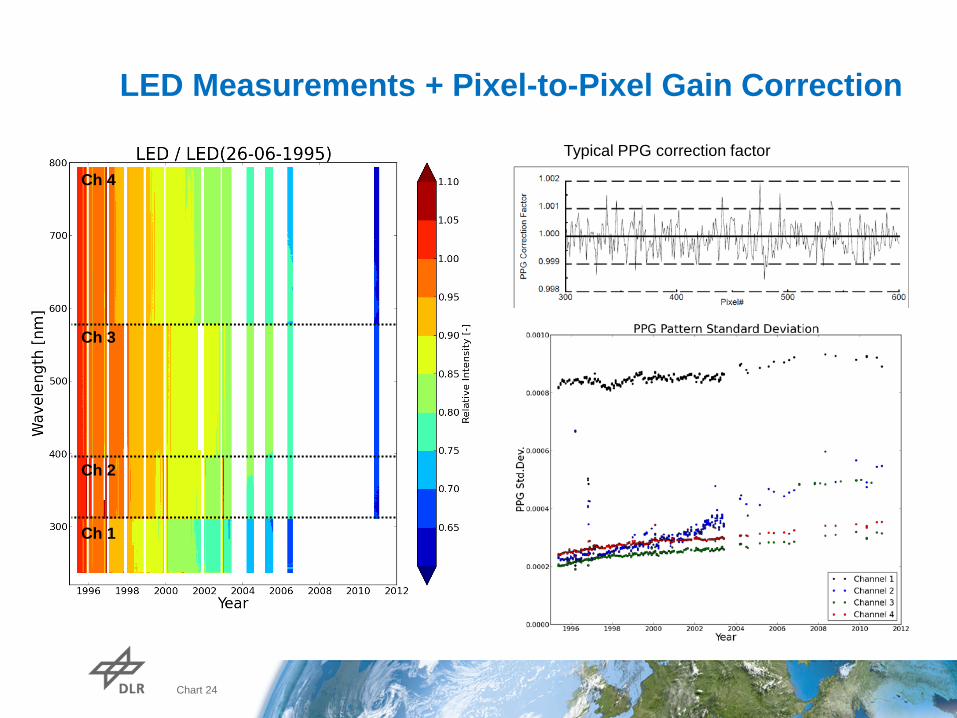
Chart 24
LED Measurements + Pixel-to-Pixel Gain Correction
Typical PPG correction factor
Ch 4
Ch 3
Ch 2
Ch 1

Chart 25
PMD Noise + Zero Offset Integration time pattern: Scan Integration time pattern: LED Integration time pattern: Moon

Chart 26
Outline
Motivation
New GOME Level-1 Product
In-Flight Calibration Data Monitoring
Solar Degradation Correction
Reflectivity Degradation Monitoring
Summary