
NEW GENERATION SOLAR COOLING AND HEATING
16
Sept 19 th 2018 ISES webinar Slide 1 NEW GENERATION SOLAR COOLING AND HEATING EXPERIENCES FOR SUCCESFULL DESIGN AND OPERATION Daniel NEYER 1,2 , Rebekka KÖLL 3 , Daniel MUGNIER 4
Transcript of NEW GENERATION SOLAR COOLING AND HEATING
Sept 19th 2018 ISES webinar Slide 1
NEW GENERATION SOLAR COOLING AND HEATING EXPERIENCES FOR SUCCESFULL DESIGN AND OPERATION
Daniel NEYER1,2, Rebekka KÖLL3, Daniel MUGNIER4
Sept 19th 2018 ISES webinar Slide 2
Introduction
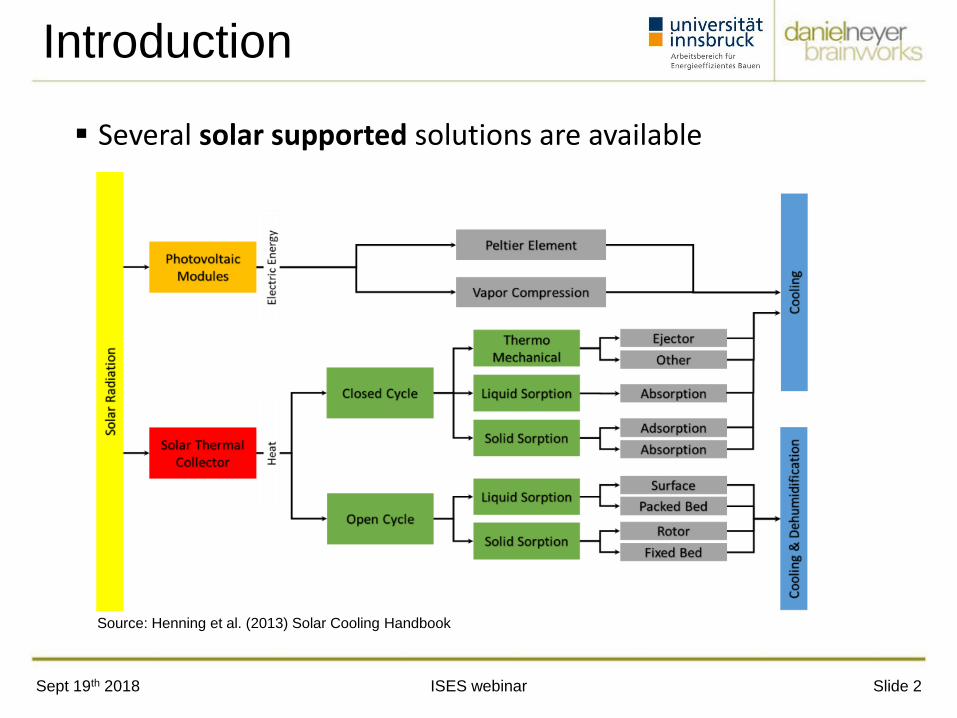
Several solar supported solutions are available
Source: Henning et al. (2013) Solar Cooling Handbook
Sept 19th 2018 ISES webinar Slide 3
Introduction
(2001-2015)
Lack of
efficient, reliable and cost competitive
SHC solutions
Summary of experiences / lesson's learned
General findings 10 key principles
Specific outcomes 3 examples
The Solar Cooling Design Guide, Case Studies of Successful Solar Air Conditioning Design
Sept 19th 2018 ISES webinar Slide 4
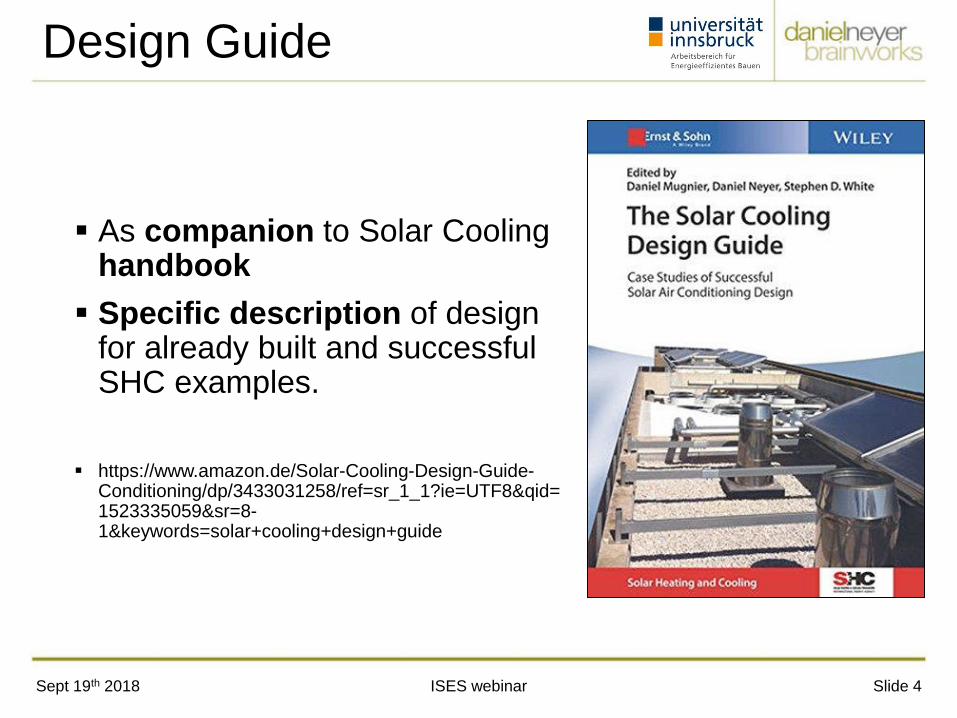
Design Guide
As companion to Solar Cooling handbook
Specific description of design for already built and successful SHC examples.
https://www.amazon.de/Solar-Cooling-Design-Guide-
Conditioning/dp/3433031258/ref=sr_1_1?ie=UTF8&qid=1523335059&sr=8-1&keywords=solar+cooling+design+guide
Sept 19th 2018 ISES webinar Slide 5
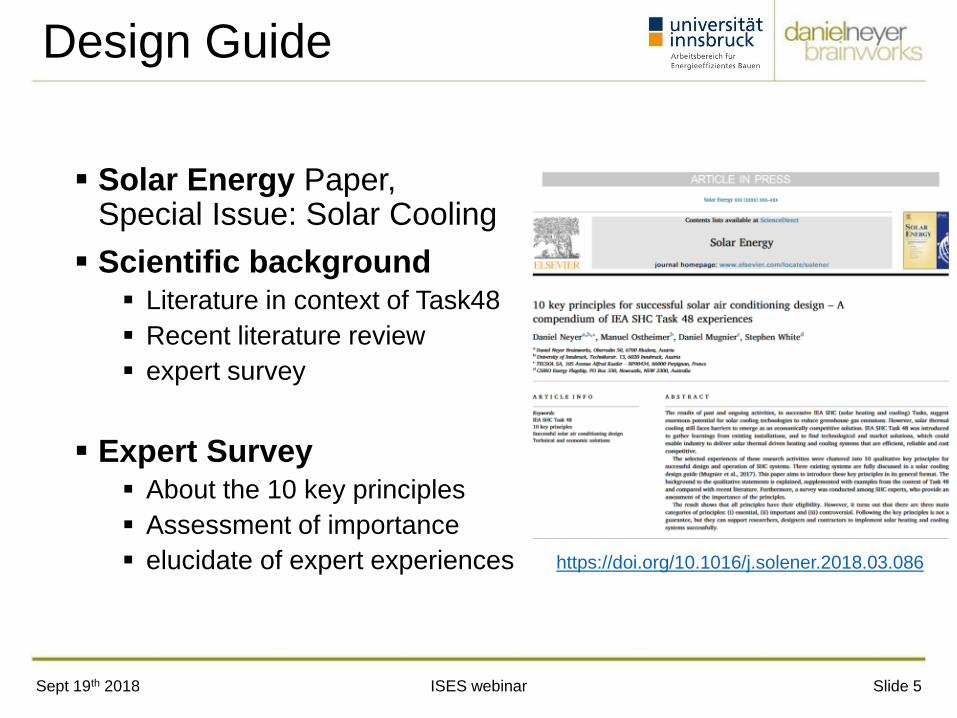
Design Guide
Solar Energy Paper, Special Issue: Solar Cooling
Scientific background Literature in context of Task48
Recent literature review
expert survey
Expert Survey About the 10 key principles
Assessment of importance
elucidate of expert experiences
https://doi.org/10.1016/j.solener.2018.03.086
Sept 19th 2018 ISES webinar Slide 6
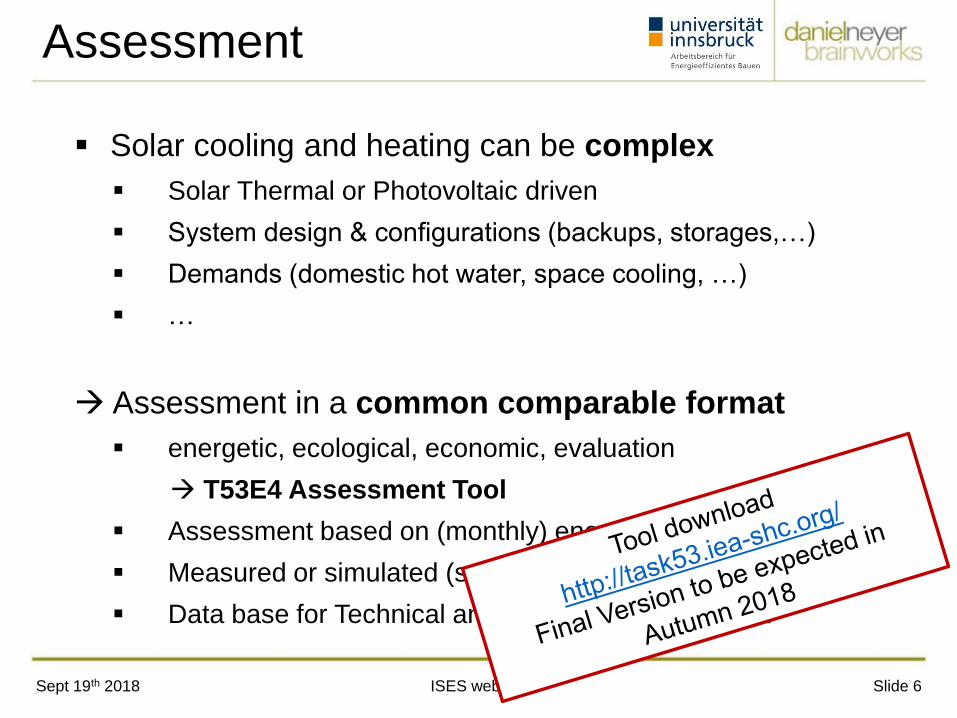
Assessment
Solar cooling and heating can be complex
Solar Thermal or Photovoltaic driven
System design & configurations (backups, storages,…)
Demands (domestic hot water, space cooling, …)
…
Assessment in a common comparable format
energetic, ecological, economic, evaluation
T53E4 Assessment Tool
Assessment based on (monthly) energy balances
Measured or simulated (sub) system
Data base for Technical and Economic assessment
Sept 19th 2018 ISES webinar Slide 7
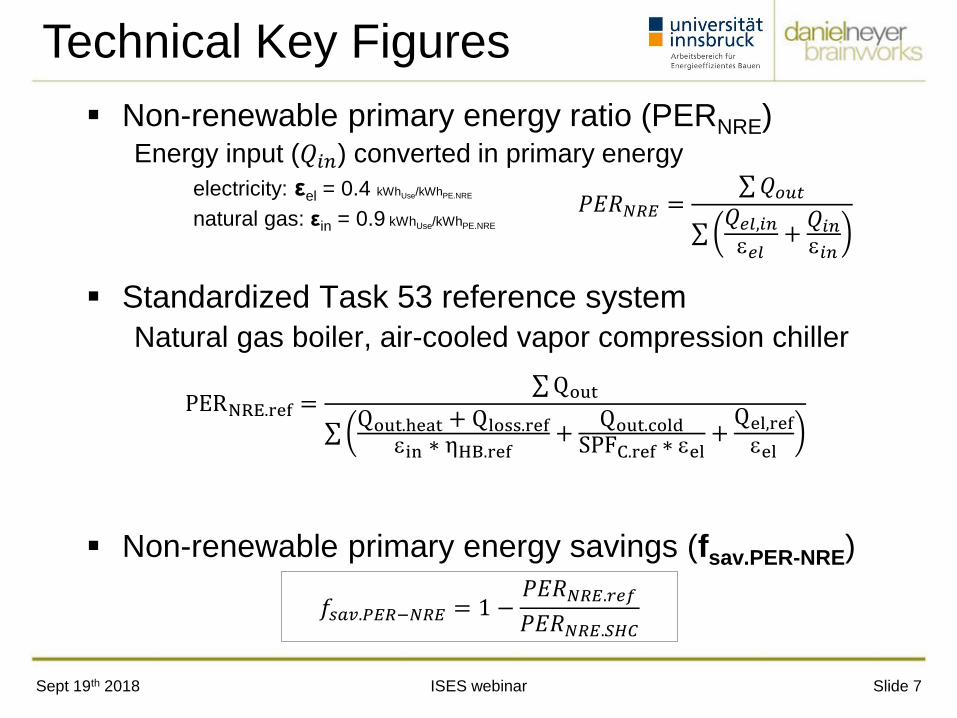
Technical Key Figures
Non-renewable primary energy ratio (PERNRE) Energy input (𝑄𝑖𝑛) converted in primary energy
electricity: εel = 0.4 kWhUse/kWhPE.NRE
natural gas: εin = 0.9 kWhUse/kWhPE.NRE
Standardized Task 53 reference system
Natural gas boiler, air-cooled vapor compression chiller
Non-renewable primary energy savings (fsav.PER-NRE)
𝑓𝑠𝑎𝑣.𝑃𝐸𝑅−𝑁𝑅𝐸 = 1 −𝑃𝐸𝑅𝑁𝑅𝐸.𝑟𝑒𝑓
𝑃𝐸𝑅𝑁𝑅𝐸.𝑆𝐻𝐶
PERNRE.ref = Qout
Qout.heat + Qloss.ref
in ∗ ηHB.ref+
Qout.coldSPFC.ref ∗ el
+Qel,refel
𝑃𝐸𝑅𝑁𝑅𝐸 = 𝑄𝑜𝑢𝑡
𝑄𝑒𝑙,𝑖𝑛𝑒𝑙
+𝑄𝑖𝑛𝑖𝑛

Sept 19th 2018 ISES webinar Slide 8
Economic Key figures
Annuity method & input values based on EN-standards
Standardized (data base) to calculate annualized costs Investment, replacement & residual value
Maintenance & service,
Operational costs (energy, water)
Solar Heating and Cooling and Reference
Levelized cost of energy
CostRatio (CR)
CostRatio(CR) =𝑎𝑛𝑛𝑢𝑎𝑙𝑖𝑧𝑒𝑑 𝑐𝑜𝑠𝑡𝑠 𝑆𝐻𝐶
𝑎𝑛𝑛𝑢𝑎𝑙𝑖𝑧𝑒𝑑 𝑐𝑜𝑠𝑡 𝑅𝐸𝐹
Sept 19th 2018 ISES webinar Slide 9
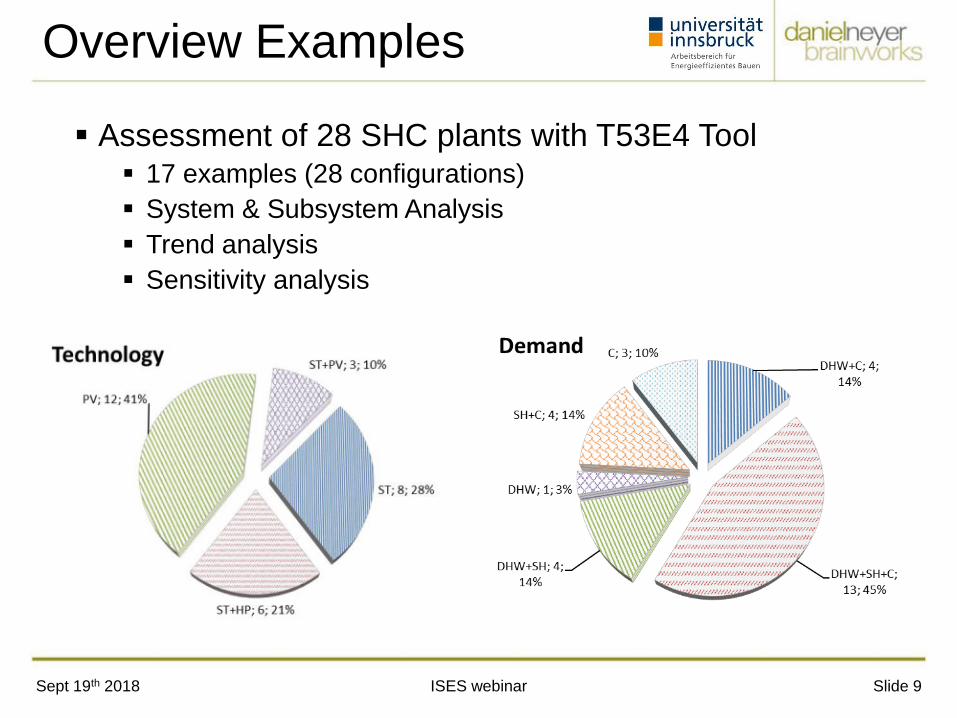
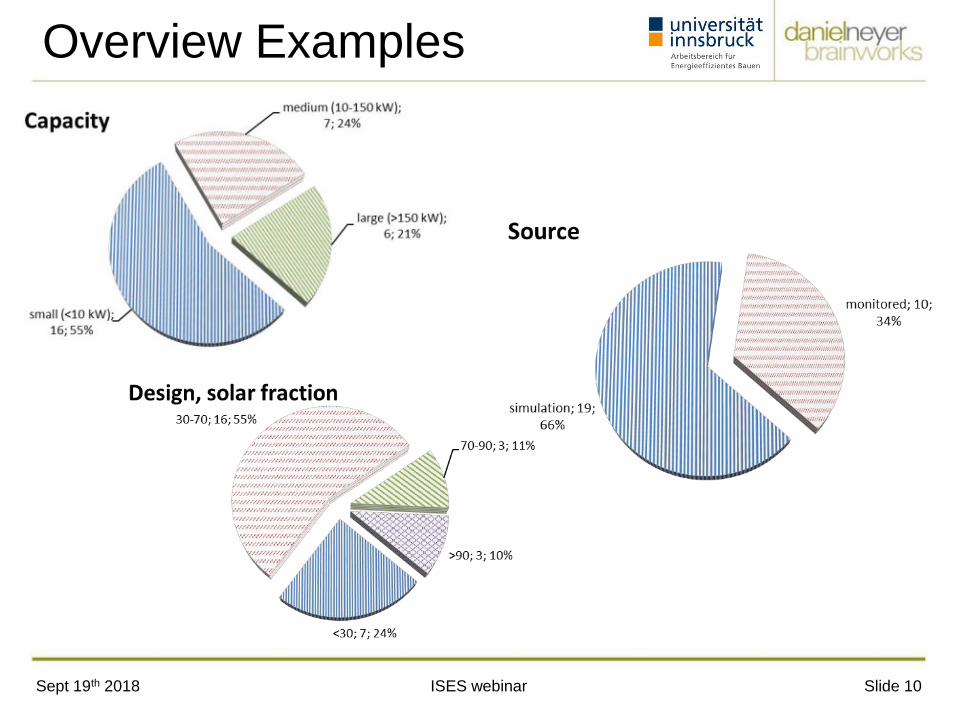
Overview Examples
Assessment of 28 SHC plants with T53E4 Tool 17 examples (28 configurations)
System & Subsystem Analysis
Trend analysis
Sensitivity analysis
Sept 19th 2018 ISES webinar Slide 10
Overview Examples
Sept 19th 2018 ISES webinar Slide 11
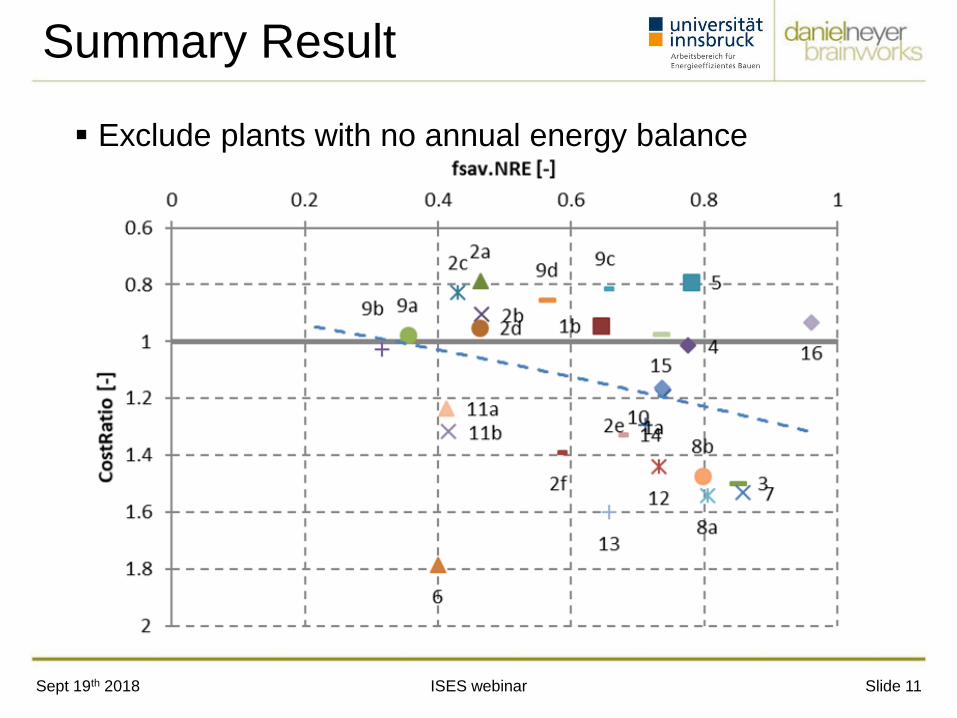
Summary Result
Exclude plants with no annual energy balance
Sept 19th 2018 ISES webinar Slide 12
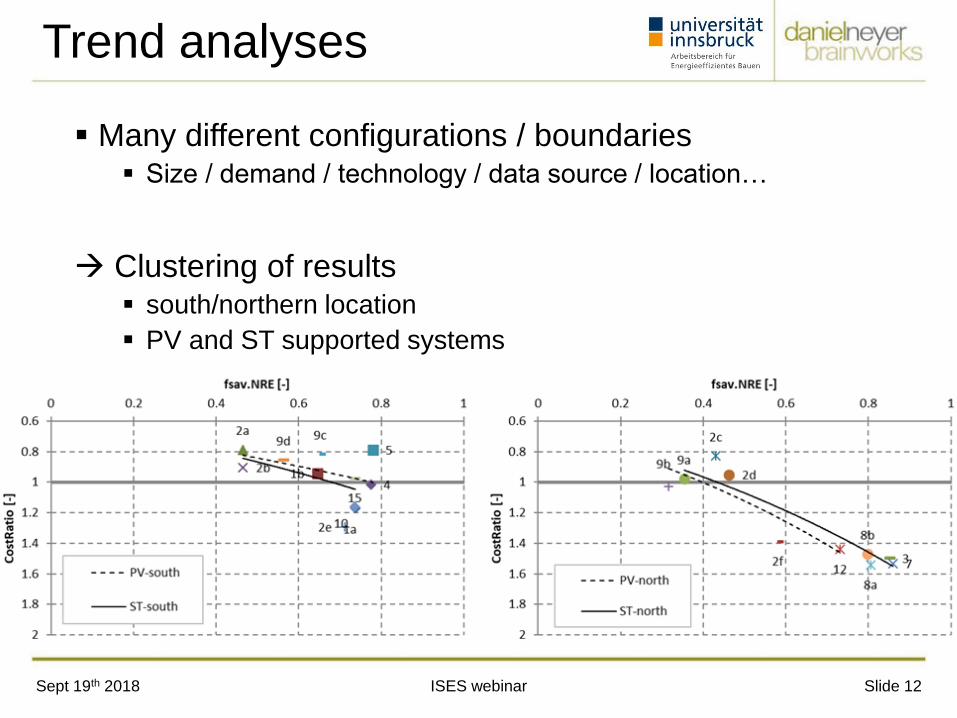
Trend analyses
Many different configurations / boundaries Size / demand / technology / data source / location…
Clustering of results south/northern location
PV and ST supported systems
Sept 19th 2018 ISES webinar Slide 13
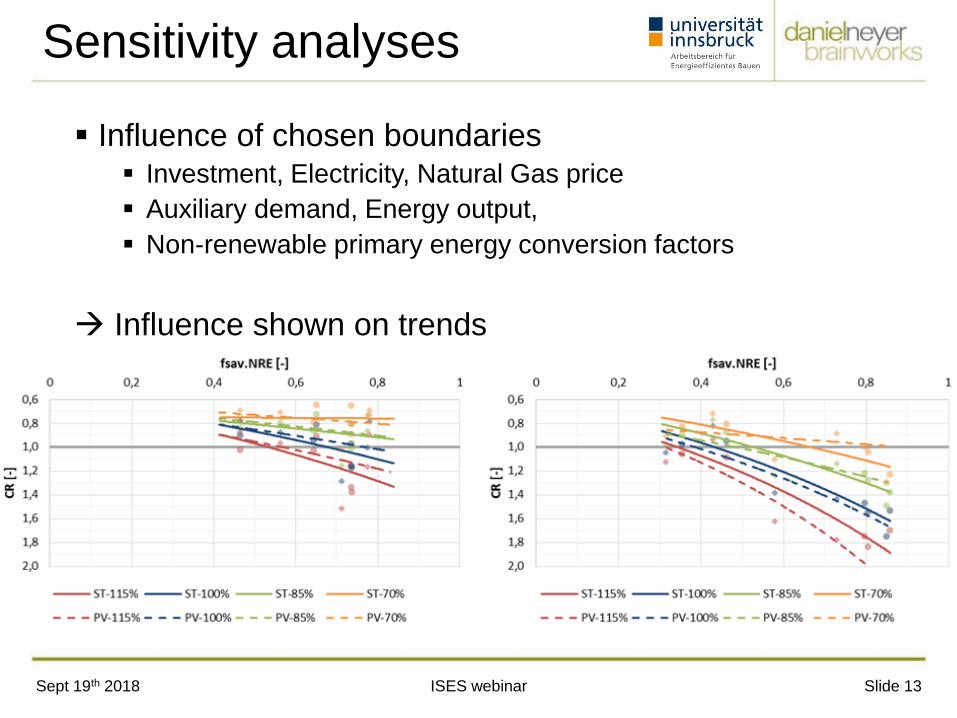
Sensitivity analyses
Influence of chosen boundaries Investment, Electricity, Natural Gas price
Auxiliary demand, Energy output,
Non-renewable primary energy conversion factors
Influence shown on trends
Sept 19th 2018 ISES webinar Slide 14
Summary
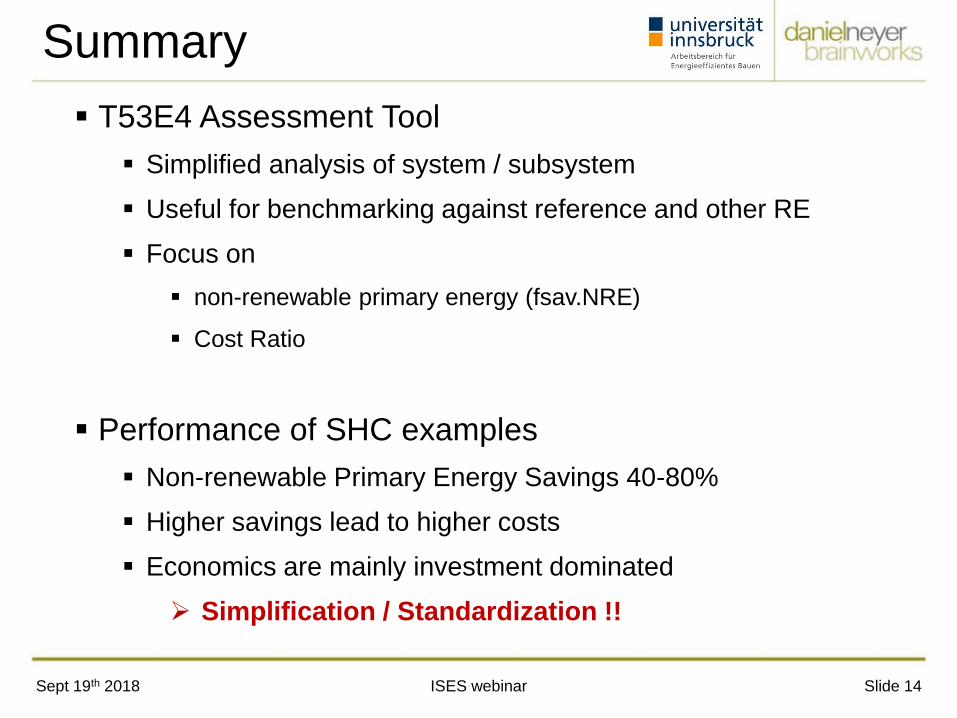
T53E4 Assessment Tool
Simplified analysis of system / subsystem
Useful for benchmarking against reference and other RE
Focus on
non-renewable primary energy (fsav.NRE)
Cost Ratio
Performance of SHC examples
Non-renewable Primary Energy Savings 40-80%
Higher savings lead to higher costs
Economics are mainly investment dominated
Simplification / Standardization !!
Sept 19th 2018 ISES webinar Slide 15
Summary
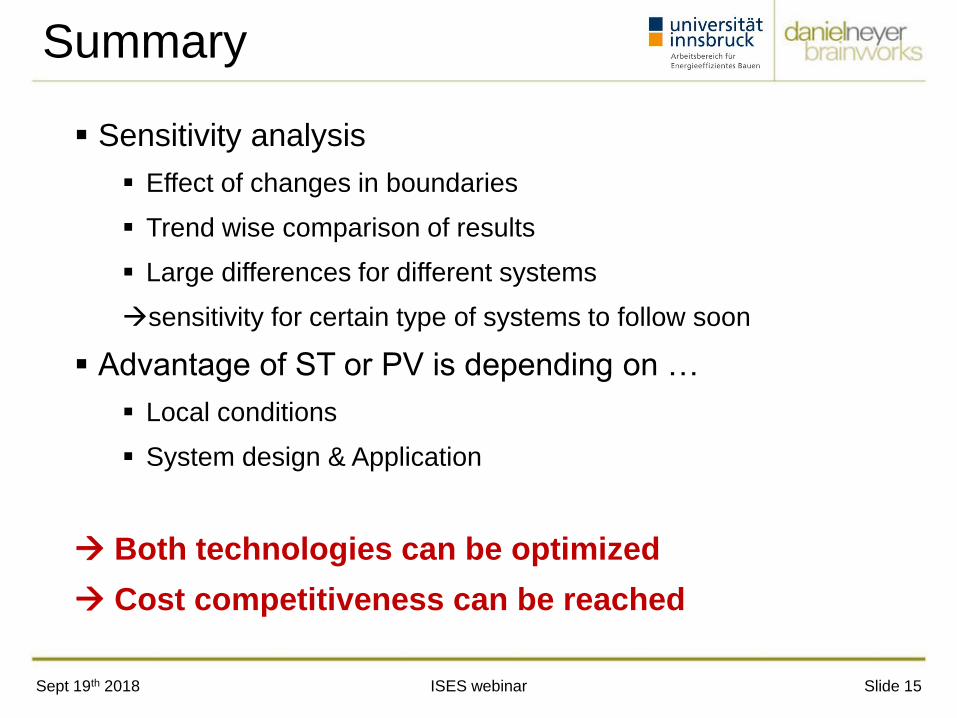
Sensitivity analysis
Effect of changes in boundaries
Trend wise comparison of results
Large differences for different systems
sensitivity for certain type of systems to follow soon
Advantage of ST or PV is depending on …
Local conditions
System design & Application
Both technologies can be optimized
Cost competitiveness can be reached
Sept 19th 2018 ISES webinar Slide 16
Thank you for your attention!


![Solar Cooling...Solar powered cooling •Connect solar electric panels to an air conditioner •Solar heating panels can also power air conditioning!ElectricityThe importance of [solar]](https://static.fdocuments.us/doc/165x107/60bf8a7d6ecb68280108d4a8/solar-cooling-solar-powered-cooling-aconnect-solar-electric-panels-to-an-air.jpg)
