NEW FRONTIERS IN POVERTY MEASUREMENT James E. Foster George Washington University and OPHI, Oxford.
51
NEW FRONTIERS IN POVERTY MEASUREMENT James E. Foster George Washington University and OPHI, Oxford
-
Upload
solomon-bridges -
Category
Documents
-
view
216 -
download
1
Transcript of NEW FRONTIERS IN POVERTY MEASUREMENT James E. Foster George Washington University and OPHI, Oxford.

NEW FRONTIERS IN POVERTY MEASUREMENT
James E. Foster George Washington University and OPHI, Oxford

Traditional Poverty Measurement
Variable – incomeIdentification – absolute poverty lineAggregation – Foster-Greer-Thorbecke ’84
Example Incomes y = (7,3,4,8) Poverty line z = 5
Deprivation vector g0 = (0,1,1,0)
Headcount ratio P0 = (g0) = 2/4Normalized gap vector g1 = (0, 2/5, 1/5, 0)
Poverty gap = P1 = (g1) = 3/20Squared gap vector g2 = (0, 4/25, 1/25, 0)
FGT Measure = P2 = (g2) = 5/100

Critique
Variable – incomeIdentification – absolute poverty lineAggregation – Foster-Greer-Thorbecke ’84
Why income alone?Income is a means Other achievements matter not convertible into incomeShould differentiate between multidimensional poverty and individual
dimensions of deprivation
Sen Development as FreedomPoverty as capability deprivationInherently multidimensional
New methods of measuring multidimensional poverty

Critique
Variable – incomeIdentification – absolute poverty lineAggregation – Foster-Greer-Thorbecke ’84
Why only one period of income?More periods in poverty is worseShould differentiate between: Chronic poverty and transient poverty
Jalan-RavallionManchester Chronic Poverty CenterNew methods of measuring chronic poverty

Critique
Variable – incomeIdentification – absolute poverty lineAggregation – Foster-Greer-Thorbecke ’84
Why an unchanging cutoff?Minimally acceptable cutoff should change as general living standards change
Sen Poor, Relatively SpeakingCitro-Michael Measuring PovertyManchester Chronic Poverty CenterNew methods of setting poverty line
Coherent framework across time and space

Critique
Variable – incomeIdentification – absolute poverty lineAggregation – Foster-Greer-Thorbecke ’84
Why use a cutoff in income space at all?Arbitrary, yet important
Deaton, Dollar/KraayNew methods of deriving “low income standard”
Low income comparisons without identification stepAre the poor sharing in economic growth?
Inequality Adjusted Human Development IndexClose links to the Human Opportunity Index

This Talk: Multidimensional Poverty
Review Matrices Identification Aggregation Illustration Caveats/Advantages

Also Touch Upon
Chronic Poverty Hybrid Poverty Lines IHDI HOI

Multidimensional
“Counting and Multidimensional Poverty Measurement” (with S. Alkire)
“A Class of Chronic Poverty Measures” “Measuring the Distribution of Human
Development (with L.F.Lopez Calva and M. Székely)
“Rank Robustness of Composite Indicators” (with M. McGillivray and S. Seth)
“Reflections on the Human Opportunity Index” (with Shabana Singh)

Why Multidimensional Poverty?
Missing Dimensions Just low income?
Capability Approach Conceptual framework
Data More sources
Tools Unidimensional measures into multidimensional
Demand Governments and other organizations

Hypothetical Challenge
A government would like to create an official multidimensional poverty indicator
Desiderata It must understandable and easy to describe It must conform to a common sense notion of poverty It must fit the purpose for which it is being developed It must be technically solid It must be operationally viable It must be easily replicable
What would you advise?
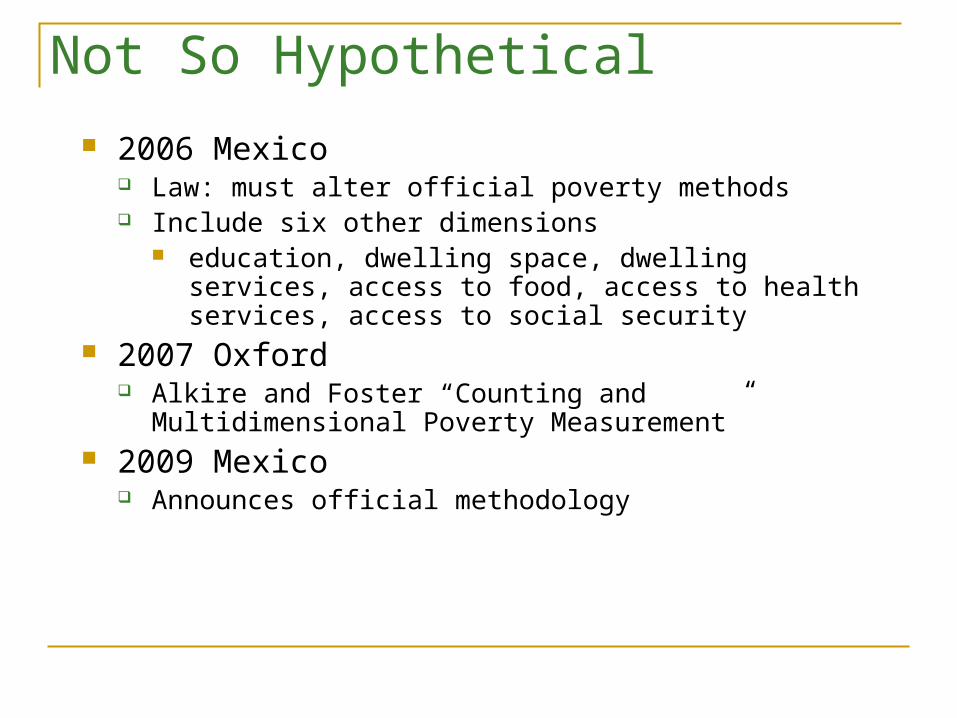
Not So Hypothetical
2006 Mexico Law: must alter official poverty methods Include six other dimensions
education, dwelling space, dwelling services, access to food, access to health services, access to social security
2007 Oxford Alkire and Foster “Counting and Multidimensional Poverty
Measurement” 2009 Mexico
Announces official methodology
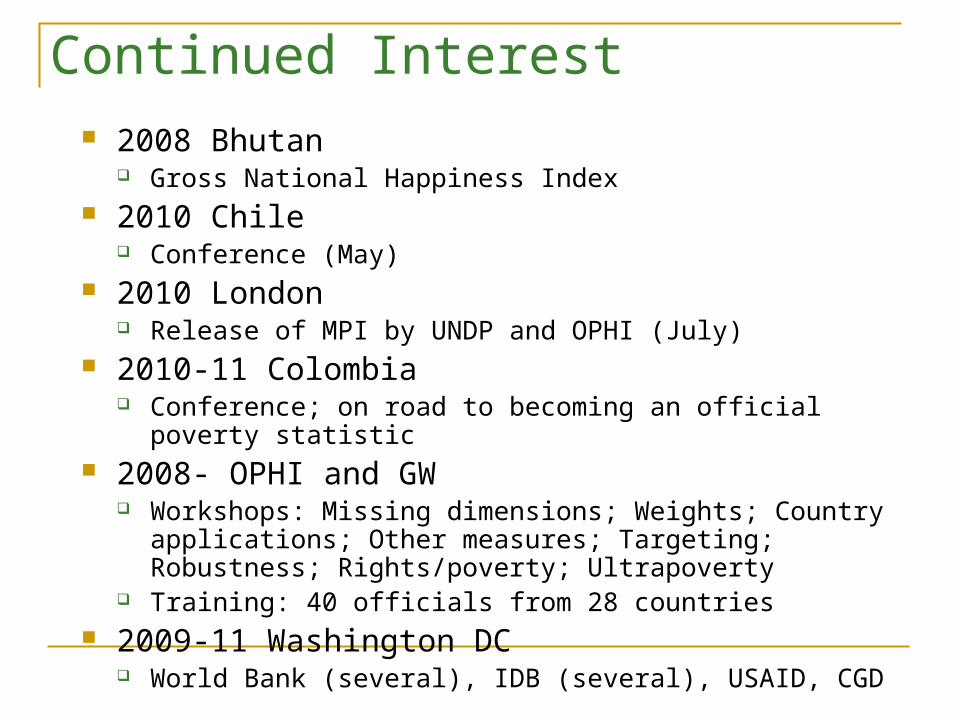
Continued Interest 2008 Bhutan
Gross National Happiness Index 2010 Chile
Conference (May) 2010 London
Release of MPI by UNDP and OPHI (July) 2010-11 Colombia
Conference; on road to becoming an official poverty statistic 2008- OPHI and GW
Workshops: Missing dimensions; Weights; Country applications; Other measures; Targeting; Robustness; Rights/poverty; Ultrapoverty
Training: 40 officials from 28 countries 2009-11 Washington DC
World Bank (several), IDB (several), USAID, CGD
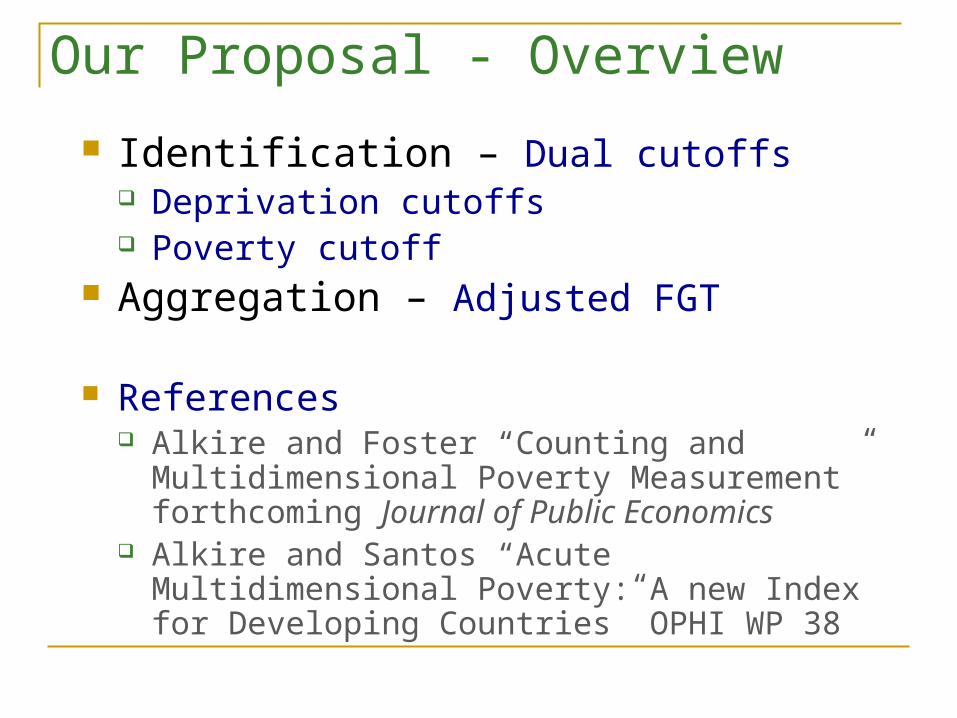
Our Proposal - Overview
Identification – Dual cutoffs Deprivation cutoffs Poverty cutoff
Aggregation – Adjusted FGT
References Alkire and Foster “Counting and Multidimensional
Poverty Measurement” forthcoming Journal of Public Economics
Alkire and Santos “Acute Multidimensional Poverty: A new Index for Developing Countries” OPHI WP 38

Multidimensional Data
Matrix of achievements for n persons in d domains
Domains
Persons
z ( 13 12 3 1) Cutoffs
These entries fall below cutoffs
y
13.1 14 4 1
15.2 7 5 0
12.5 10 1 0
20 11 3 1

Deprivation Matrix
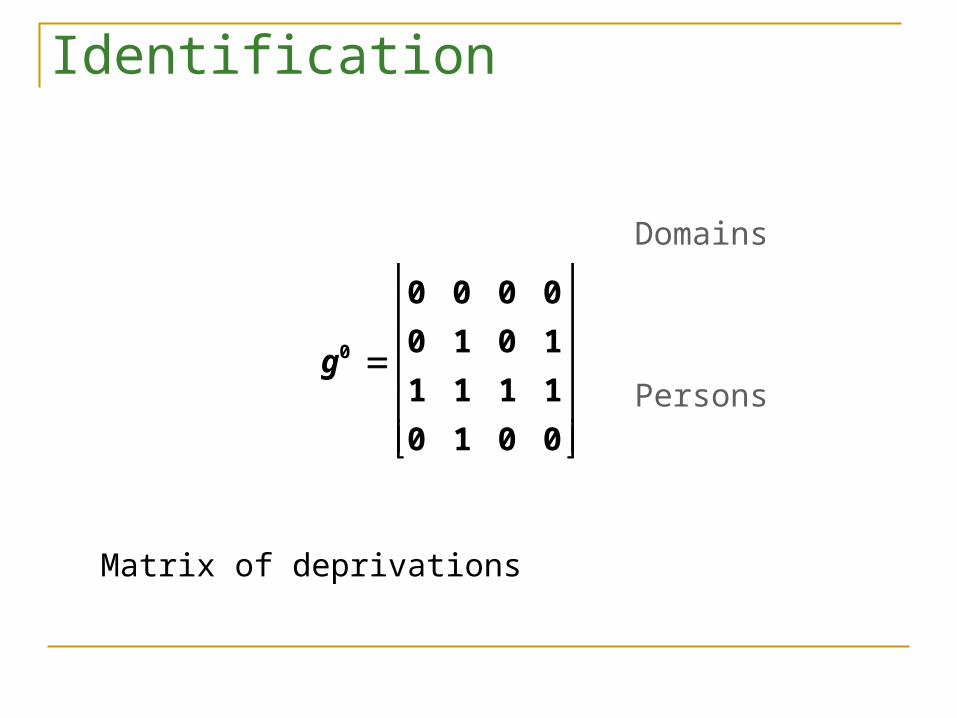
Replace entries: 1 if deprived, 0 if not deprived
Domains
Persons
g0
0 0 0 0
0 1 0 1
1 1 1 1
0 1 0 0
Normalized Gap Matrix
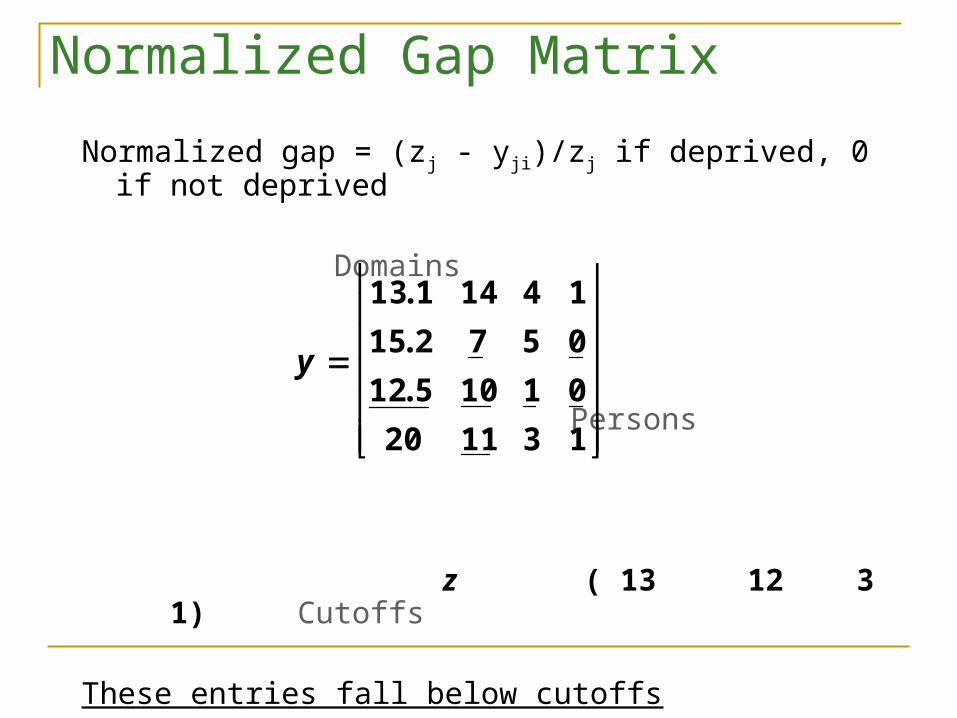
Normalized gap = (zj - yji)/zj if deprived, 0 if not deprived
Domains
Persons
z ( 13 12 3 1) Cutoffs
These entries fall below cutoffs
y
13.1 14 4 1
15.2 7 5 0
12.5 10 1 0
20 11 3 1
Normalized Gap Matrix
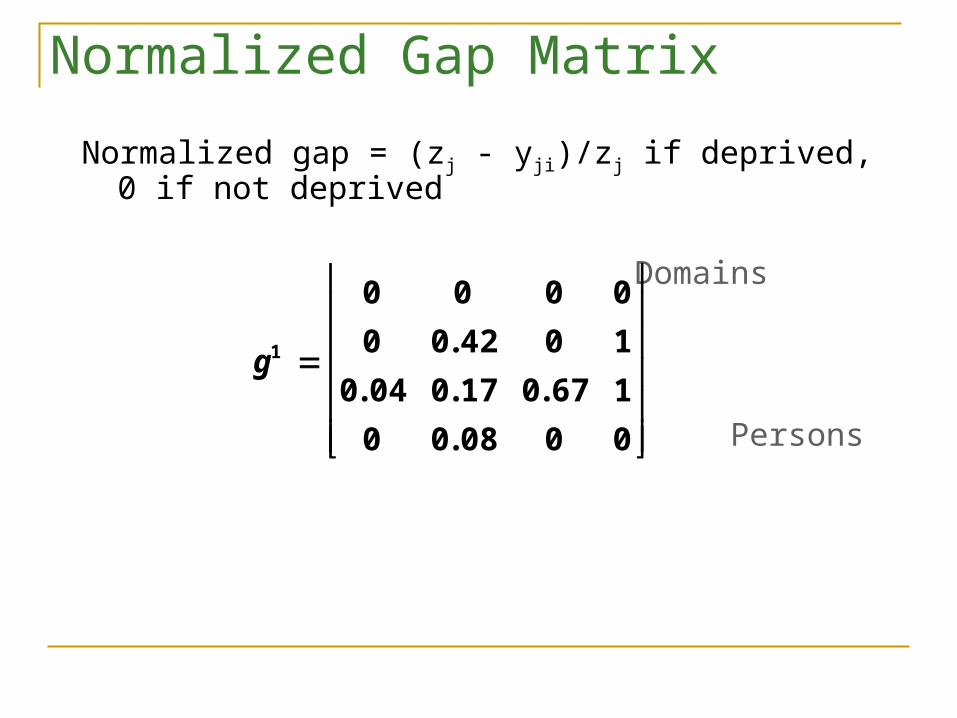
Normalized gap = (zj - yji)/zj if deprived, 0 if not deprived
Domains
Persons
g1
0 0 0 0
0 0.42 0 1
0.04 0.17 0.67 1
0 0.08 0 0
Squared Gap Matrix
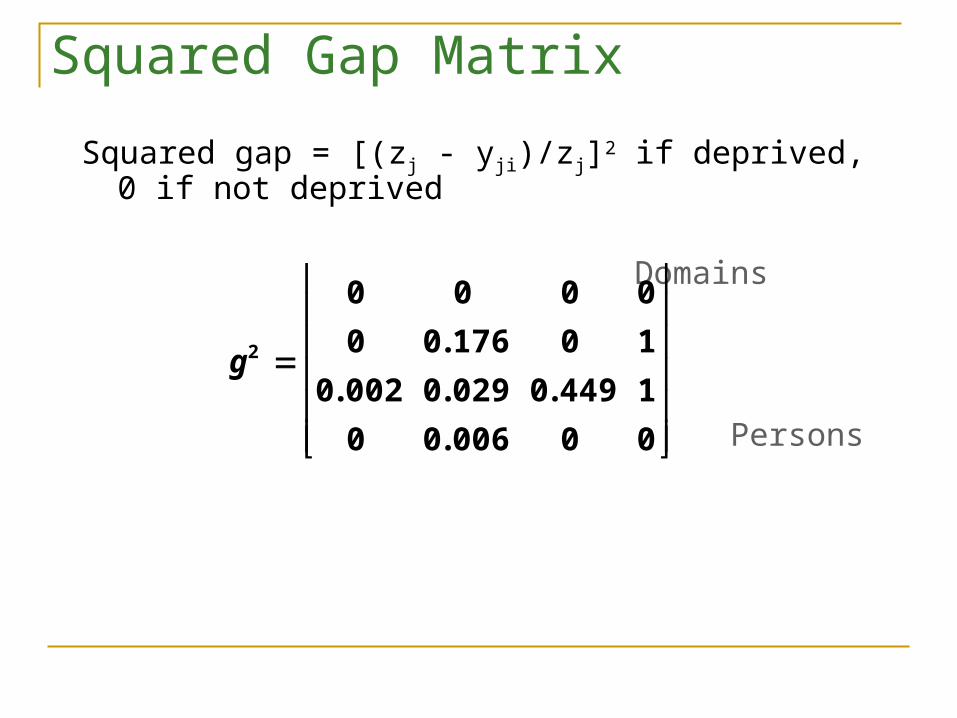
Squared gap = [(zj - yji)/zj]2 if deprived, 0 if not deprived
Domains
Persons
g2
0 0 0 0
0 0.176 0 1
0.002 0.029 0.449 1
0 0.006 0 0
Identification
Domains
Persons
Matrix of deprivations
g0
0 0 0 0
0 1 0 1
1 1 1 1
0 1 0 0

Identification – Counting Deprivations
Q/ Who is poor?
Domains c
Persons
g0
0 0 0 0
0 1 0 1
1 1 1 1
0 1 0 0
0
2
4
1
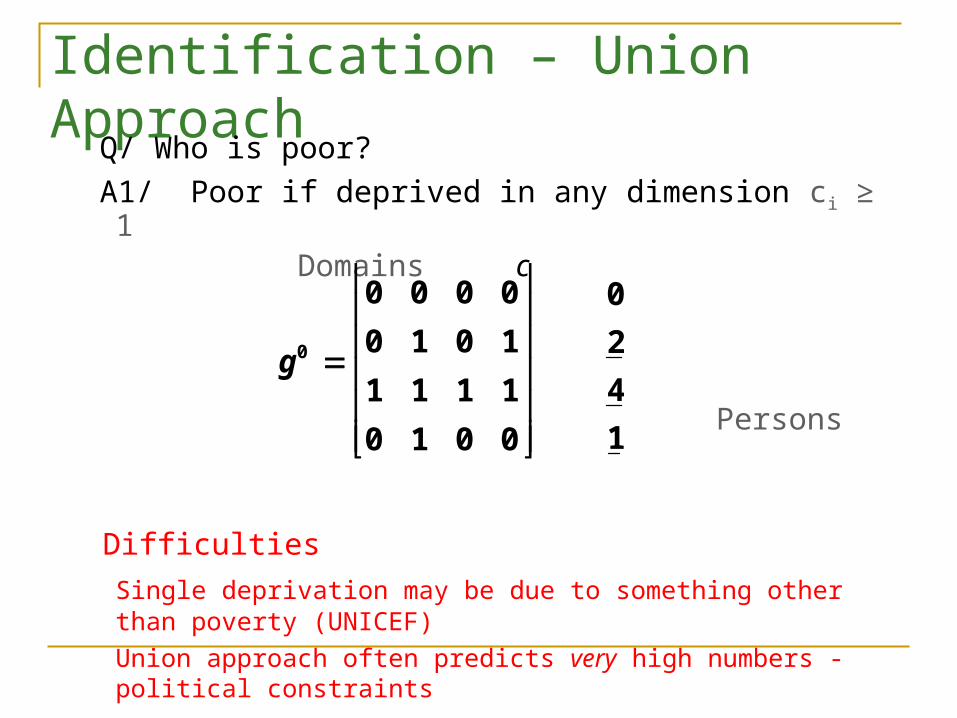
Identification – Union Approach
Q/ Who is poor?
A1/ Poor if deprived in any dimension ci ≥ 1 Domains c
Persons
Difficulties
Single deprivation may be due to something other than poverty (UNICEF)
Union approach often predicts very high numbers - political constraints
g0
0 0 0 0
0 1 0 1
1 1 1 1
0 1 0 0
0
2
4
1

Identification – Intersection Approach
Q/ Who is poor?
A2/ Poor if deprived in all dimensions ci = d Domains c
Persons Difficulties
Demanding requirement (especially if d large)Often identifies a very narrow slice of population
g0
0 0 0 0
0 1 0 1
1 1 1 1
0 1 0 0
0
2
4
1

Identification – Dual Cutoff Approach
Q/ Who is poor?
A/ Fix cutoff k, identify as poor if ci > k (Ex: k = 2) Domains c
Persons
Note Includes both union and intersection Especially useful when number of dimensions is large
Union becomes too large, intersection too small
Next step - aggregate into an overall measure of poverty
g0
0 0 0 0
0 1 0 1
1 1 1 1
0 1 0 0
0
2
4
1

Aggregation
Censor data of nonpoor
Domains c(k)
Persons
Similarly for g1(k), etc
g0(k)
0 0 0 0
0 1 0 1
1 1 1 1
0 0 0 0
0
2
4
0

Aggregation – Headcount Ratio
Domains c(k)
Persons
Two poor persons out of four: H = ½ ‘incidence’
g0(k)
0 0 0 0
0 1 0 1
1 1 1 1
0 0 0 0
0
2
4
0
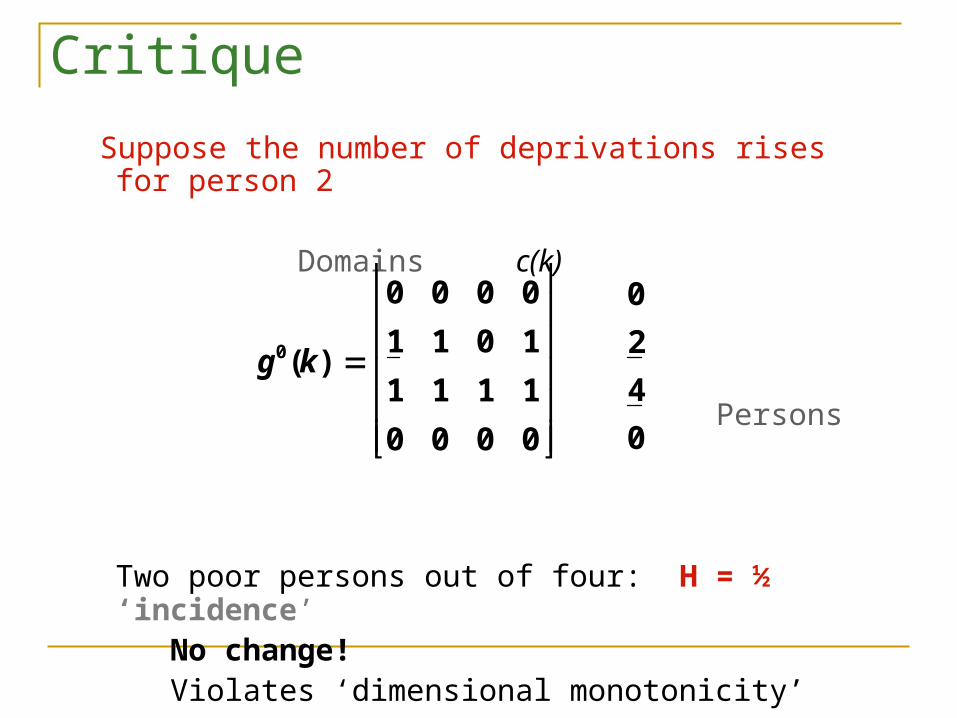
Critique
Suppose the number of deprivations rises for person 2
Domains c(k)
Persons
Two poor persons out of four: H = ½ ‘incidence’ No change! Violates ‘dimensional monotonicity’
g0(k)
0 0 0 0
1 1 0 1
1 1 1 1
0 0 0 0
0
2
4
0
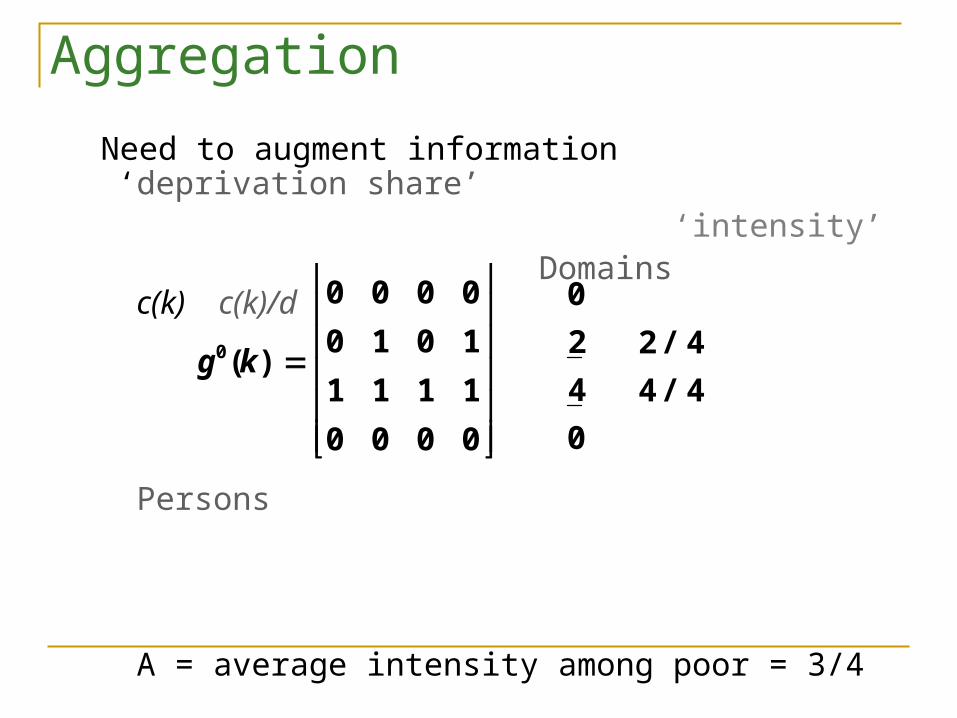
Aggregation
Need to augment information ‘deprivation share’ ‘intensity’
Domains c(k) c(k)/d
Persons
A = average intensity among poor = 3/4
g0(k)
0 0 0 0
0 1 0 1
1 1 1 1
0 0 0 0
0
2
4
0
2 / 4
4 / 4

Aggregation – Adjusted Headcount Ratio
Adjusted Headcount Ratio = M0 = HA = (g0(k)) = 6/16 = .375
Domains c(k) c(k)/d
Persons
A = average intensity among poor = 3/4
Note: if person 2 has an additional deprivation, M0 risesSatisfies dimensional monotonicity
g0(k)
0 0 0 0
0 1 0 1
1 1 1 1
0 0 0 0
0
2
4
0
2 / 4
4 / 4

Aggregation – Adjusted Headcount Ratio
ObservationsUses ordinal data
Similar to traditional gap P1 = HI
HI = per capita poverty gap
= headcount H times average income gap I among poor
HA = per capita deprivation
= headcount H times average intensity A among poor
Decomposable across dimensions after identification
M0 = j Hj/d not dimensional headcount ratios
Axioms - Characterization via “unfreedoms”
Foster (2010) Freedom, Opportunity, and Wellbeing

Adjusted Headcount Ratio
Note M0 requires only ordinal information.
Q/ What if data are cardinal? How to incorporate information on depth of deprivation?

Aggregation: Adjusted Poverty Gap
Augment information of M0 using normalized gaps
Domains
Persons
Average gap across all deprived dimensions of the poor:
G
g1(k)
0 0 0 0
0 0.42 0 1
0.04 0.17 0.67 1
0 0 0 0

Aggregation: Adjusted Poverty Gap
Adjusted Poverty Gap = M1 = M0G = HAG = (g1(k))
Domains
Persons
Obviously, if in a deprived dimension, a poor person becomes
even more deprived, then M1 will rise. Satisfies monotonicity – reflects incidence, intensity, depth
g1(k)
0 0 0 0
0 0.42 0 1
0.04 0.17 0.67 1
0 0 0 0

Aggregation: Adjusted FGT
Consider the matrix of squared gaps
Domains
Persons
g2 (k )
0 0 0 0
0 0.422 0 12
0.042 0.172 0.672 12
0 0 0 0

Aggregation: Adjusted FGT
Adjusted FGT is M = (g(k))
Domains
Persons
Satisfies transfer axiom – reflects incidence, intensity, depth, severity– focuses on most deprived
g2 (k )
0 0 0 0
0 0.422 0 12
0.042 0.172 0.672 12
0 0 0 0
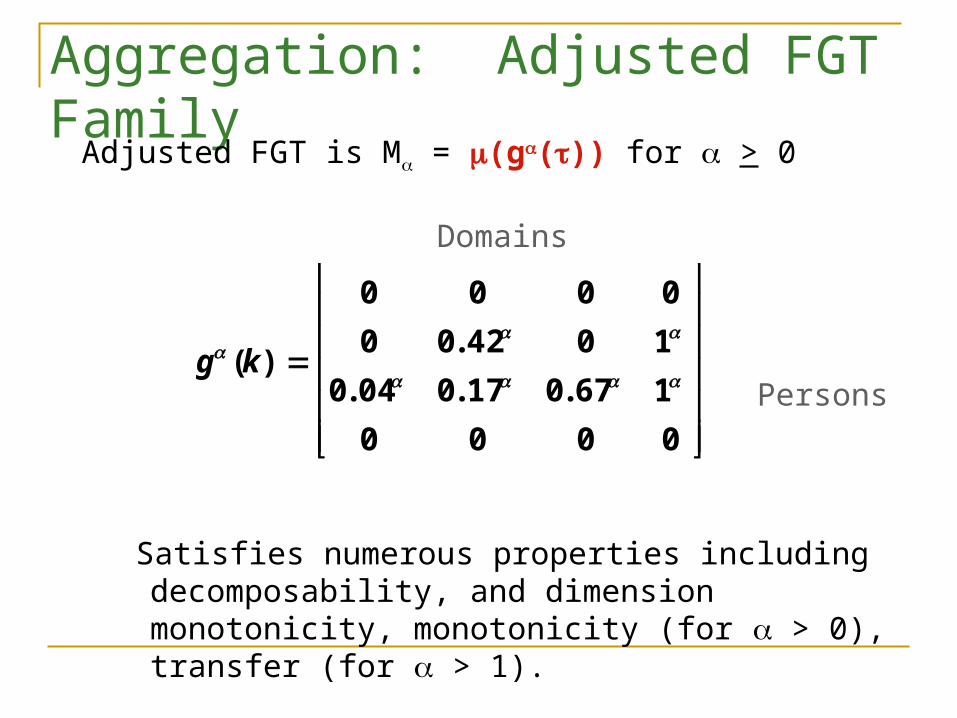
Aggregation: Adjusted FGT Family
Adjusted FGT is M = (g()) for > 0
Domains
Persons
Satisfies numerous properties including decomposability, and dimension monotonicity, monotonicity (for > 0), transfer (for > 1).
g (k)
0 0 0 0
0 0.42 0 1
0.04 0.17 0.67 1
0 0 0 0
Illustration: USAData Source: National Health Interview Survey, 2004, United States
Department of Health and Human Services. National Center for Health Statistics - ICPSR 4349.
Tables Generated By: Suman Seth.
Unit of Analysis: Individual.
Number of Observations: 46009.
Variables:
(1) income measured in poverty line increments and grouped into 15 categories
(2) self-reported health
(3) health insurance
(4) years of schooling.
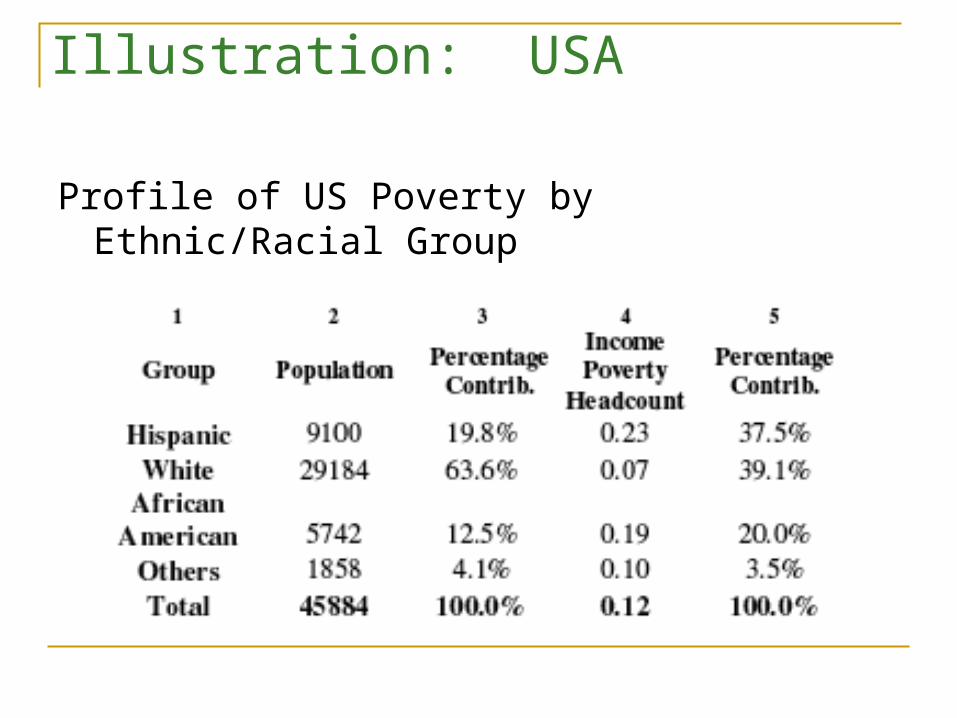
Illustration: USA
Profile of US Poverty by Ethnic/Racial Group

Illustration: USA
Profile of US Poverty by Ethnic/Racial Group

Illustration: USA
Profile of US Poverty by Ethnic/Racial Group
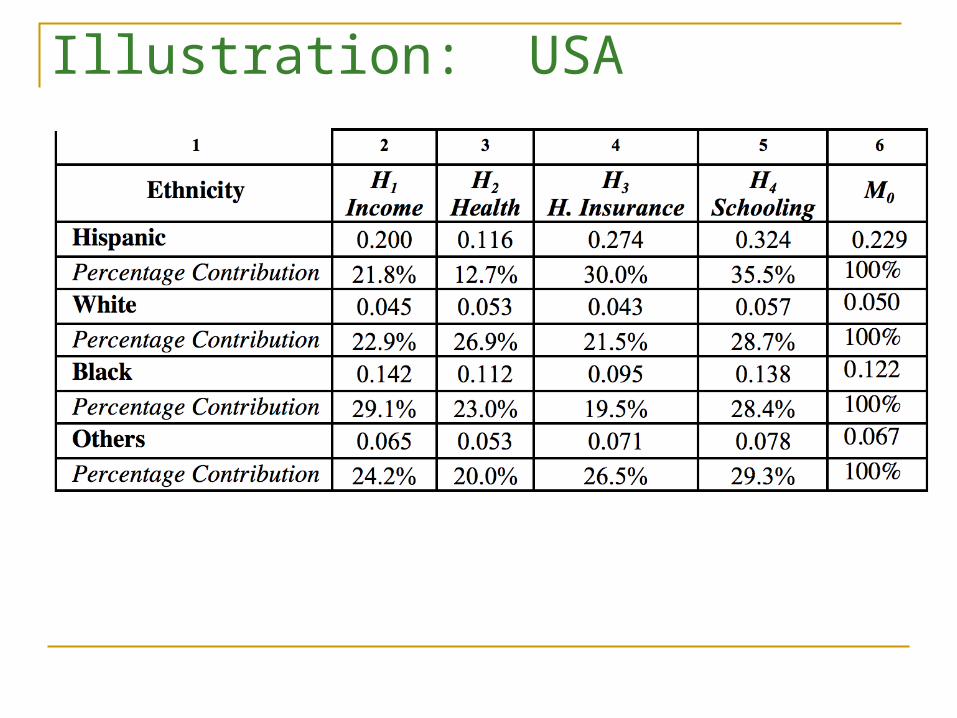
Illustration: USA
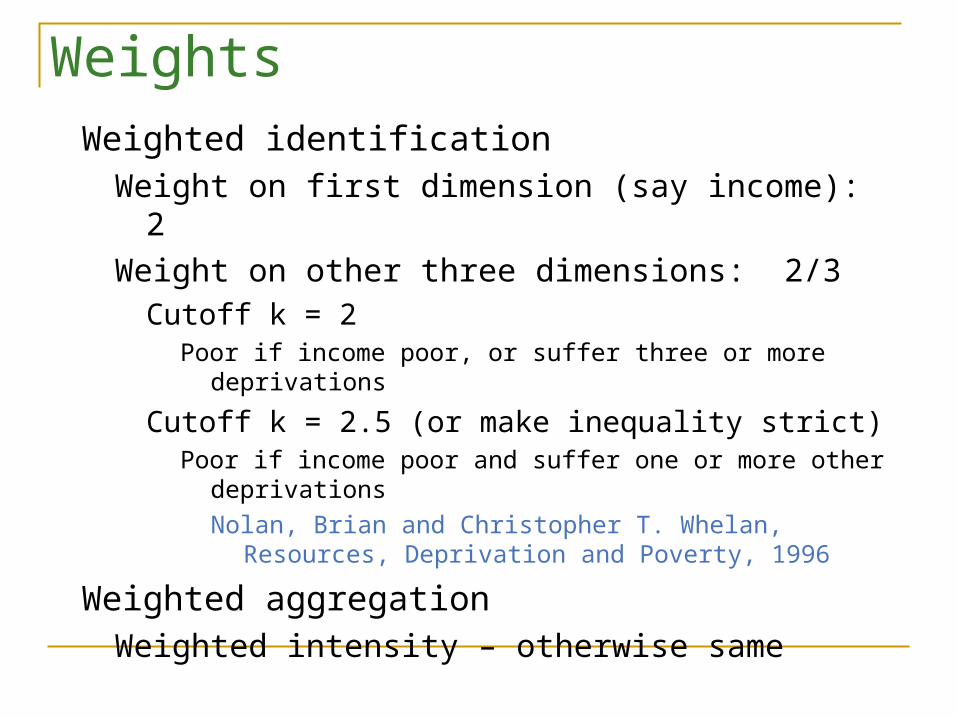
WeightsWeighted identification
Weight on first dimension (say income): 2
Weight on other three dimensions: 2/3Cutoff k = 2
Poor if income poor, or suffer three or more deprivations
Cutoff k = 2.5 (or make inequality strict)Poor if income poor and suffer one or more other deprivations
Nolan, Brian and Christopher T. Whelan, Resources, Deprivation and Poverty, 1996
Weighted aggregationWeighted intensity – otherwise same
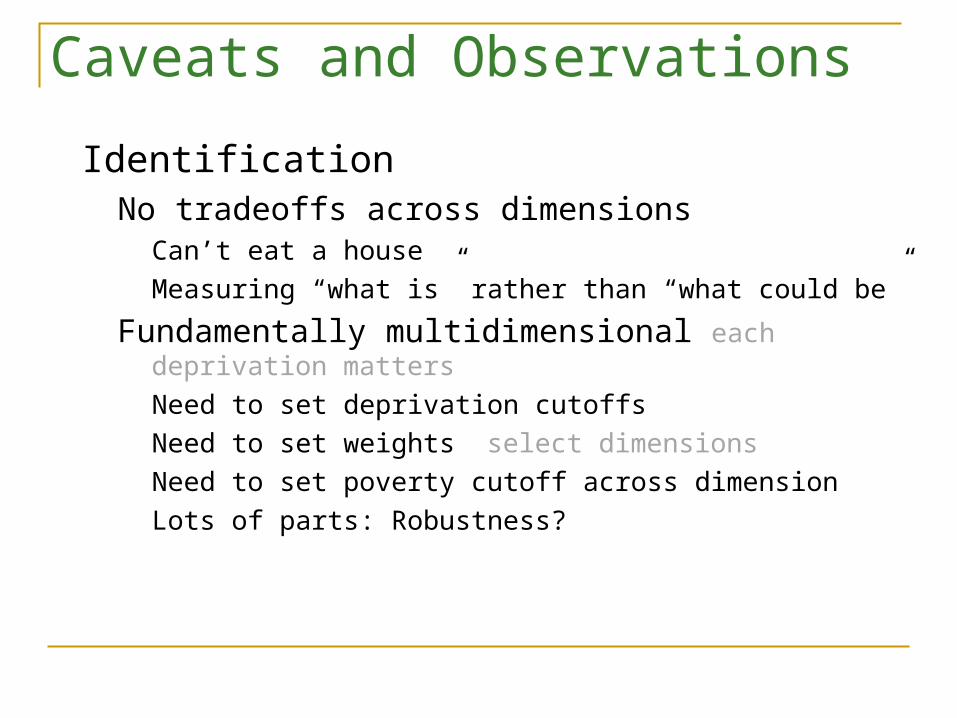
Caveats and Observations
Identification No tradeoffs across dimensions
Can’t eat a house
Measuring “what is” rather than “what could be”
Fundamentally multidimensional each deprivation matters
Need to set deprivation cutoffs
Need to set weights select dimensions
Need to set poverty cutoff across dimension
Lots of parts: Robustness?

Sub-Sahara Africa: Robustness Across k
Burkina is always poorer than Guinea, regardless of whether we count as poor persons who are deprived in only one kind of assets (0.25) or every dimension (assets, health, education, and empowerment, in this example). (DHS Data used)
Batana, 2008- OPHI WP 13

Caveats and Observations
AggregationNeutral
Ignores coupling of disadvantages
Not substitutes, not complements
DiscontinuitiesMore frequent, less abrupt
Advantages
Intuitive
Transparent
FlexibleMPI – Acute poverty

Dimensions and Indicators of MPI
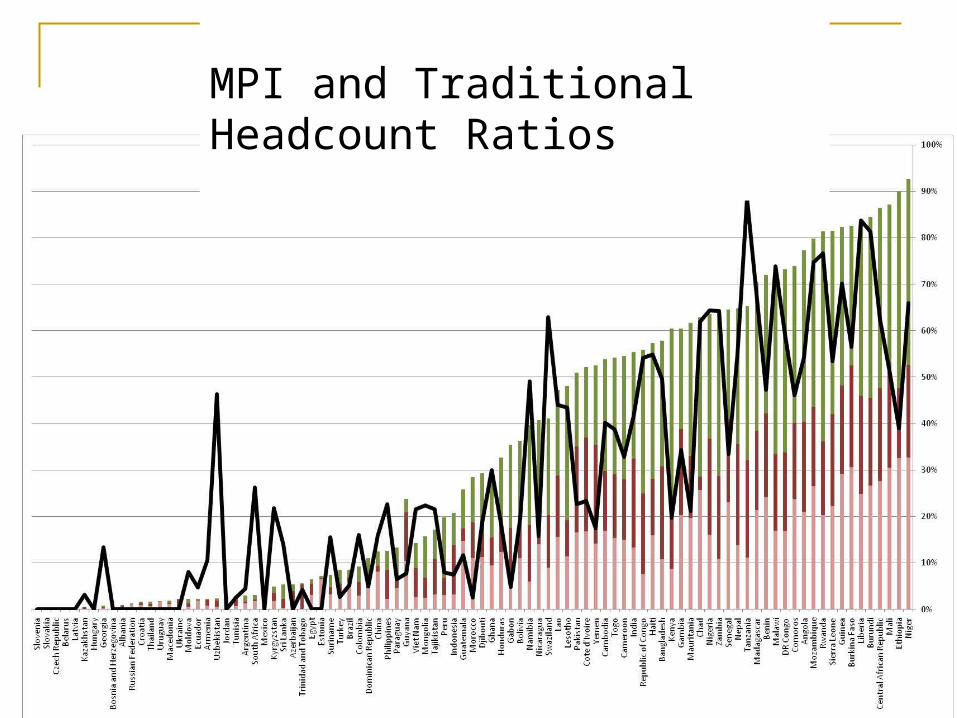
MPI and Traditional Headcount Ratios

Advantages
Intuitive
Transparent
FlexibleMPI – Acute poverty
Country Specific MeasuresPolicy impact and good governance
Targeting
Accounting structure for evaluating policies
Participatory tool

Revisit Objectives
Desiderata It must understandable and easy to describe It must conform to a common sense notion of poverty It must fit the purpose for which it is being developed It must be technically solid It must be operationally viable It must be easily replicable
What do you think?

Thank you