
New Fluorescent Probes for ATP and other Phosphates · Die vorliegende Arbeit wurde in der Zeit von...
112
New Fluorescent Probes for ATP and other Phosphates Dissertation zur Erlangung des Doktorgrades der Naturwissenschaften (Dr. rer. nat.) an der Fakultät für – Chemie und Pharmazie – der Universität Regensburg vorgelegt von Thomas Lang aus Regensburg im Mai 2012
Transcript of New Fluorescent Probes for ATP and other Phosphates · Die vorliegende Arbeit wurde in der Zeit von...

New Fluorescent Probes for ATP and other
Phosphates
Dissertation zur Erlangung des Doktorgrades der Naturwissenschaften
(Dr. rer. nat.)
an der
Fakultät für
– Chemie und Pharmazie –
der Universität Regensburg
vorgelegt von
Thomas Lang
aus Regensburg
im Mai 2012

Die vorliegende Arbeit wurde in der Zeit von Mai 2009 bis April 2012 unter Anleitung von Herrn Prof. Dr. O. Wolfbeis am Institut für Analytische Chemie, Chemo- und Biosensorik der Universität Regensburg angefertigt.
Promotionsgesuch eingereicht am: 14.05.2012
Kolloquiumstermin: 06.06.2012
Prüfungsausschuss Vorsitzender: Prof. Dr. J. Daub
Erstgutachter: Prof. Dr. O. S. Wolfbeis
Zweitgutachter: Prof. Dr. K. Zeitler
Drittprüfer: Prof. Dr. H. Brunner

Acknowledgements
First of all I would like to thank Prof. Dr. O. S. Wolfbeis for the great opportunity and
experience of working at his institute.
Furthermore, I want to thank PD Dr. Michael Schäferling for acting as my supervisor.
A lot of people have contributed greatly in various ways to this work. From the very
beginning Thomas Hirsch was a tremendous source of help and encouragement. Matthias
Stich and Martin Link instantly made me feel at home. The latter patiently trying to “learn
me his experience” (Yogi Berra). Ceaselessly, Péter Kele allowed me to benefit from the
genius of the Pannonians. Do’minique Grögel was always open to discussions. Daniela
Achatz and Gisela Hierlmeier are way too nice for their own good. I want to express my
deep appreciation for what you all have been doing and for your friendship.
Moreover I want to thank Judith, Raphaela, Joachim, Franzi, Steffi, Frau Stoiber, Reham
and Sayed, James, Bobbel, and each and every member of the Institute of Analytical
Chemistry, Chemo- and Biosensors including the mass spec department, our (former)
apprentice Martin Rappl, and my bachelor students, especially Uwe Käfer.
Good connections to other institutes are always important. Hence, Hannes Krauss, Klaus
Harrar, Thomas Ehrenschwender, Dominik Frank, Ludwig Pilsl, Diana Drettwan and
Christine Thoms duly deserve to be mentioned here.
Lunch is also important, so are the people who voluntarily offer their company, thank you for
doing just that!
I hope my friends know how grateful I am for everything - for them!
I lack the words, however, to express how grateful I am and to describe how much my
parents, Renate and Pius Lang have contributed to making this work possible and to making
me the person I am (faults are definitely not theirs to blame). Thank you so much!

Without deviation from the norm, progress is not possible!
Frank Vincent Zappa

Dedicated to Marc Studtmann

Inhaltsverzeichnis
1. Introduction ................................................................................................................. 8
2. Background ................................................................................................................ 17
2.1 Viologens as New Phosphate-sensitive Fluorescent Probes ........................... 17
2.2 NIR Dye as New Phosphate-sensitive Fluorescent Probe ............................... 28
3. Experimental .............................................................................................................. 37
3.1 Materials and Methods ......................................................................................... 37
3.1.1 Instrumental Set Up ............................................................................................. 37
3.1.2 Chemicals ............................................................................................................. 38
3.1.2 Synthesis .............................................................................................................. 39
4. Viologen-Type Probes for Phosphates ..................................................................... 49
4. 1 Results and Discussion ........................................................................................ 49
4.1.1 HPTS with TEAPB as fluorescent probe for the detection of ATP and other phosphates ............................................................................................................ 51
4.1.2 APTS with TEAPB as fluorescent probe for the detection of ATP and other phosphates ............................................................................................................ 56
4.1.3 HPTS with TEABB as fluorescent probe for the detection of ATP and other phosphates ............................................................................................................ 61
4.1.4 APTS with TEABB as fluorescent probe for the detection of ATP and other phosphates ............................................................................................................ 67
4.1.5 HPTS with TEAPeB as fluorescent probe for the detection of ATP and other phosphates ............................................................................................................ 72
4.1.6 APTS with TEAPeB as fluorescent probe for the detection of ATP and other phosphates ............................................................................................................ 78
4..2 Summary .............................................................................................................. 83
5. Cyanine-Type Probe for Phosphates ....................................................................... 90
5.1 Results and Discussion ........................................................................................ 90
5.1.1 [Zn(FEW-L)]: Absorption-Based sensing of ATP and other phosphate species 92
5.1.2 [Zn(FEW-L)]: Emission-Based sensing of ATP and other phosphate species ... 97
5.1.3 [Zn(FEW-L)]: Optimization of composition of the complex ............................ 101
5.2 Conclusion ......................................................................................................... 103
6. Summary .................................................................................................................. 107
6.1 English ............................................................................................................... 107
6.2 Deutsch .............................................................................................................. 108

7. Curriculum Vitae .................................................................................................... 109
8. List of Publications .................................................................................................. 111

8
1. Introduction
“In hoc signo vinces!” or “!” are the famous words addressed to Constantine
the Great by God himself in the wake of the Battle of the Milvian Bridge according to
Lactantius (Latin) [1, 2] or Eusebios of Caesarea (Greek) [2, 3]. This event, which sees its
1700th anniversary this year, Constantine becoming the protégée of the Christian god, had a
tremendous impact on the course of world history and science. On the one hand the Christian
Roman Empire retained a big portion of the strength and power of its pagan predecessor and
grew extremely resilient in the east, surviving well into the 15th century [4, 5]. On the other
hand, the unfortunate symbiosis of church and state put a hold to freedom of expression and
thought, interrupting scientific progress for one millennium.
Atomic hypothesis, for instance, was postulated by Democritus, Leucippus and
Epicurus as early as the 4th century BCE [6]. One of the latter’s most dedicated pupils,
Lucretius, expressed in his famous work De rerum natura that life is merely based on, and
governed by, the movement, association and dissociation of atoms [7, 8]. It took well over
1500 years before John Dalton [9] would pick such theories up again and thus enabled science
to continue where it had been forced into silence. A generation after atomic hypothesis had
reemerged, Friedrich Miescher discovered a substance he labeled “nuclein” which happened
to be crude DNA. After further examination he concluded that it must be distinct from
proteins, as it contains no sulphur and does not undergo typical reactions. He also found out
that phosphor, in the form of phosphoric acid, formed an essential part and gained a vague
idea of its true structure [10]. Miescher and many other contemporaries, however, thought,
while deeming “nuclein” to be very interesting, that it was too simple a compound to play a
crucial part in genetics. Thus proteins were believed to be responsible for heredity. Hence
progress in that field stalled.
It was as late as 1952 when most doubts were dismissed by the Hershey-Chase
experiment, using radioactive labeling [11]. Now DNA was rightfully regarded as the driving
force behind heredity. Thus, after 2000 years, Lucretius, who was called insane by Christian
historians of the Dark Ages [8], was rehabilitated: life is indeed to a very large extent a matter
of atoms, their association and dissociation.

9
Early and important basic information on the structure of DNA was provided by Phoebus
Levine and William Astbury. Yet it was not until 1953 when Rosalind Franklin (X-ray),
James Watson and Francis Crick came up with the correct solution: a helical structure of two
strands consisting of a backbone of sugars, linked by phosphate esters, and carrying bases
which link these two strands by hydrogen bonds (Fig.1). Watson and Crick presented the first
model of this base pairing in DNA with the help of Chargaff’s experimental results [12]. A
DNA strand consists of nucleotides: phosphate ester, sugar (deoxyribose) and base. These
bases are aromatic compounds: purines such as adenine and guanine possess ten cyclic
conjugated -electrons according to Hückel’s rule (4n+2; n=2) over two rings, while the
pyrimidine-based thymine and cytosine constitute of a single ring of six electrons (n=1).
Hence -stacking and other - interactions are important factors of stability in the 3-D
structure of DNA [14].
Nucleotides do not merely constitute a structural element of DNA but together with
nucleosides they serve as substrates or products in enzymatic processes as well. Adenosine
mono-, di-, and triphosphate (AMP, ADP, ATP), guanine mono-, di-, and triphosphate (GMP,
GDP, GTP), cyclic adenosine and cyclic guanine monophosphate (cAMP, cGMP), phosphate
(Pi) and pyrophosphate (diphosphate, PPi) are most prominently featured in such reactions
[15-24]. The various enzymes involved therein can be divided into several categories:
Phosphotransferases or kinases [25] in particular catalyze phosphorylations, phosphatases
[26] cleave esters, and phosphorylases [27] are responsible for phosphorolysis. The cell cyle
Fig. 1. Part of random double strand DNA, emphasizing the Watson Crick base pairing. The pyrimidines thymine (T) and cytosine (C) are linked to their purine counterparts adenine (A) and guanine (G) by two (A-T) or three hydrogen bonds (C-G) respectively.
Double strand DNA possesses a helical structure with a major and minor groove (left) [13].

10
is regulated by cyclin-dependent kinases (CDKs) [28] while G protein-coupled receptor
kinase plays a key role in signal transduction [29, 30]. Furthermore, ATPases decompose
ATP (Scheme 1) in order to provide energy for important processes and reactions. P-type
ATPases, for instance, control and enable the transport of certain ions across biological
membranes against gradient between the extra- and intracellular spaces.
One such enzyme is H+/K+ ATPase which is crucial in the production of gastric acid
[31]. Furthermore, sarco/endoplasmic reticulum Ca2+ ATPase (SERCA) is transferring Ca2+
ions after muscle relaxation [32], Cu2+ is transported by ATP7B, the Wilson disease protein
[33]. Additionally, there are several such enzymes like ATP13A2 [34] which deal with less
common or more complex, organic ions [35-37]. Finally, Na+/K+-ATPase is an important part
of the cell membrane as it regulates the ionic gradient of cell by maintaining a relatively low
level of sodium inside and a relatively high concentration of sodium outside [38].
Apparently, these enzymes are abundant, versatile, diverse and crucial to many
processes inside the human body or organisms in general. Hence it is a great goal in biology
to gain insight into the principles according to which they are working and how they can be
controlled, inhibited or stimulated, rendering them a substantial drug target. Monitoring
alterations in phosphate concentrations can provide essential information for the better
O-
O-
O-
P+
O-
O-
O P+
O-
O-
O
O
OH OH
OP
+N
N
N
N
NH2
+
O-
O-O
-
O-
P+
O-
O-
O-
O-
O-
O
O
OH OH
OP
+N
N
N
N
NH2
P+
ATP
ADP
Pi
Scheme 1. Generic decomposition pathway of ATP: Energy is released by cleaving one anhydride bond. This process is catalyzed by ATPase forming the products ADP and phosphate. They can serve as starting materials for the reverse reaction, when ATP levels need to be recovered, or become substrates for other processes and enzymes.

11
understanding of the working mechanism of these enzymes. Thus detection of phosphates is
an important analytical task.
Various sensing schemes have been reported which harness amperometry, or
electrochemistry in general, (capillary) electrophoresis, and (ion) chromatography [39, 40].
Procedures derived from protocols focused on the Taussky-Shorr [41] reagent (including
ammonium molybdate) are still widely used. However, this approach is rather complicated
and sensitive to many external influences like pH. Other fluorescent setups apply enzymes
and/or organic dyes but these methods, too, suffer from the same drawbacks [40]. Another
way of monitoring phosphate concentrations, with ATP in particular, is radioactive labeling
with 32P. This very sensitive method suffers from the poor reputation of radiochemistry which
entails a legislation that demands high and expensive standards of quality management,
operational safety and waste-disposal to be maintained [42]. Lanthanide complexes,
especially these of europium and terbium, have become a convenient alternative though.
Numerous sensing schemes have been designed which are based on such compounds [39, 40,
43, 44]. Complexes based on ruthenium, aluminum, cadmium, copper and zinc have been
reported [42, 43, 45, 46]. Furthermore sensors utilizing aptamers [47], carbon nanotubes [48],
and polythiophene [49, 50] and polyamine probes have been published [51].
As could be seen, the field of available phosphate-sensitive probes offers a large pool of
compounds and schemes for a variety of applications. Yet there are disadvantages that need to
be taken into account: cross-sensitivity, complicated set-ups which are expensive and require
trained personnel, limit of detection, toxicity in biological matrices or in vivo studies, pH-
dependence of probe, and many more [39, 40, 43, 46, 51].
Hence, new probes are expected not to suffer from the shortcomings of these current
probes. Accordingly, the design and screening of new fluorescent probes for the detection of
ATP and other phosphates is an important task and the main objective of this work. It is
focused on possible application for enzymatic assays for ATPase, GTPase, protein kinases
and adenylylcyclase.

12
[1] Laktanz, A. Städele, Laktanz – Die Todesarten der Verfolger / De Mortibus
Persecutorum, Brepols, Turnhout, 2003
[2] S. N. C. Lieu, D. Montserrat, From Constantine to Julian, Pagan and Byzantine Views,
Routledge, New York, 1996
[3] Eusebius von Caesarea, H. A. Gärtner, H. Kraft, P. Haeuser, Kirchengeschichte,
Wissenschaftliche Buchgesellschaft, Darmstadt, 2006
[4] S. Mitchell, A history of the Later Roman Empire, Blackwell, Malden, Oxford & Carlton,
2009
[5] A. Cameron, The Byzantines, Blackwell, Malden, Oxford & Carlton, 2006
[6] C. Bailey, The Greek Atomists and Epicurus, Russell & Russell, Kent, 1964
[7] Lukrez; K. Büchner, De Rerum Natura / Welt aus Atomen, Reclam, Stuttgart, 1973
[8] G. B. Conte, J. B. Solodow, D. Fowler, G. W. Most, Latin Literature, John Hopkins,
Baltimore & London, 1994
[9] F. Greenway, John Dalton and the Atom, Cornell University Press, Ithaca, 1966
[10] R. Dahm, Friedrich Miescher and the Discovery of DNA, Dev Biol, 2005, 278, 274-288
[11] A. Hershey, M. Chase, Independent function of Viral Protein and Nucleic in Growth of
Bacteriophage, J Gen Physiol, 1952, 1, 39-56
[12] J. Watson, D. Crick, Molecular Structure of Nucleic Acids, Nature, 1953, 171, 737-738
[13] http://en.wikipedia.org/wiki/File:DNA_Structure%2BKey%2BLabelled.pn_NoBB.png
(accessed on 04-05-2012)
[14] P. Yakovchuk, E. Protozanova, M. D. Frank-Kamenetskii, Base-stacking and base-
pairing contributions into thermal stability of the DNA double helix, Nucleic Acids Res, 2006,
34, 2, 564-574
[15] C. M. Spangler, C. Spangler, M. Göttle, Y. Shen, W.J. Tang, R. Seifert, M. Schäferling,
A fluorimetric assay for real-time monitoring of adenylyl cyclase activity based on
norfloxacin, Anal Biochem, 2008, 381, 86-93

13
[16] F. Facchiano, A. Facchiano, A. M. Facchiano, The role of transglutaminase-2 and its
substrates in human disease, Front Biosci, 2006, 11, 1758-73
[17] J. R. Knowles, Enzyme-Catalyzed Phosphoryl Transfer Reactions, Ann Rev Biochem,
1980, 49, 877-919
[18] K. Hibino, T. Shibata, T. Yanagida, Y. Sako, Activation Kinetics of RAF Protein in the
Ternary Complex of RAF, RAS-GTP, and Kinase on the Plasma Membrane of Living Cells, J
Biol Chem, 2011, 286, 36460-36468
[19] C. P. Vellano, F. Shu, S. Ramineni, C. K. Yates, G. G. Tall, J. R. Helper, Activation of
the Regulator of G Protein Signaling 14−Gαi1-GDP Signaling Complex Is Regulated by
Resistance to Inhibitors of Cholinesterase-8A, Biochemistry, 2011, 50, 752-762
[20] G. S. Ahluwalia, J. L. Grem, Z. Hao, D. A. Cooney, Metabolism And Action Of Amino
Acid Analog Anti-Cancer Agents, Pharmac Ther, 1990, 46, 243-271
[21] R. Abramovitch, E. Tavor, J. Jacob-Hirsch, E. Zeira, N. Amariglio, O. Pappo, G.
Rechavi, E. Galun, A. Hnigman, A Pivotal Role of Cyclic AMP-Responsive Element Binding
Protein in Tumor Progression, Cancer Res, 2004, 64, 1338-1346
[22] F. Polleux, T. Morrow, A. Ghosh, Semaphorin 3A is a chemoattractant for cortical
apical dendrites, Nature, 2000, 404, 567-574
[23] S. Y. Breusegem, H. Takahashi, H. Giral-Arnal, X. Wang, T. Jiang, J. W. Verlander, P.
Wilson, S. Miyazaki-Anzai, E. Sutherland, Y. Caldas, J. T. Blaine, H. Segawa, K. Miyamoto,
N. P. Barry, M. Levi, Differential regulation of the renal sodium-phosphate cotransporters
NaPi-IIa, NaPi-IIc, and PiT-2 in dietary potassium deficiency, Am J Physiol Renal Physiol,
2009, 297, 350-361
[24] S. K. Kim, D. H. Lee, J. Hong, J. Yoon, Chemosensors for Pyrophosphate, Accounts
Chem Res, 2009, 42, 23-31
[25] K. R. Hallows, R. Alzamora, H. Li, F. Gong, C. Smolak, D. Neumann, N. M. Pastor-
Soler, AMP-activated protein kinase inhibits alkaline pH- and PKA-induced apical vacuolar
H+-ATPase accumulation in epididymal clear cells, Am J Physiol Cell Physiol, 2009, 296,
672–681

14
[26] Y. Ma, I. Szostkiewicz, A. Korte, D. Moes, Y. Yang, A. Christmann, E. Grill, Regulators
of PP2C Phosphatase Activity Function as Abscisic Acid Sensors, Science, 2009, 324, 1064-
1068
[27] S. K. Dasa, U. K. Sokhia, S. K. Bhutiaa, B. Azaba, Z. Sua, D. Sarkara, P. B. Fishera,
Human polynucleotide phosphorylase selectively and preferentially degraded microRNA-221
in human melanoma cells, PNAS, 2010, 11948-11953
[28] J. W. Harper, P. D. Adams, Cyclin-Dependent Kinases, Chem Rev, 2001, 2511-2526
[29] J. A. Pitcher, N. J. Freedman, R. J. Lefkowitz, G Protein-Coupled Receptor Kinases,
Annu Rev Biochem, 1998, 67, 653-692
[30] D. M. Rosenbaum, S. G. F. Rasmussen, B. K. Kobilka, The structure and function of G-
protein-coupled receptors, Nature, 2009, 459, 356-363
[31] H. Luo, J. Wang, W. Deng, N. Huang, K. Zuo, Bisabolangelone, a gastric H+/K+-
ATPase inhibitor: homology modeling and docking study, Med Chem Res, 2011, 2, 9780-
9784
[32] J. V. Møller, C. Olesen, A. L. Winther, P. Nissen, The sarcoplasmic Ca2+-ATPase:
design of a perfect chemi-osmotic pump, Q Rev Biophys, 2010, 43, 501-566
[33] P. C. Bull, G. R. Thomas, J. M. Rommens, J. R. Forbes, D. W. Cox, The Wilson disease
gene is a putative copper transporting P-type ATPase similar to the Menkes gene, Nat Genet,
1993, 5, 327-337
[34] A. Ramirez, A. Heimbach, J. Grpndemann, B. Stiller, D. Hampshire, L. P. Cid, I.
Goebel, A. F. Mubaidin, A. Wriekat, J. Roeper, A. Al-Din, A. M. Hillmer, M. Karsak, B.
Liss, C. G. Woods, M. I. Behrens, C. Kubisch, Hereditary parkinsonism with dementia is
caused by mutations in ATP13A2, encoding a lysosomal type 5 P-type ATPase, Nat Genet,
2006, 38, 1184- 1191
[35] X. Tang, M. S. Halleck, R. A. Schlegel, P. Williamson, A Subfamily of p-Type ATPases
with Aminophospholipid Transporting Activity, Science, 1996, 272, 1495-1497
[36] M. Solioz, C. Vulpe, CPx-type ATPase: a class of P-type ATPases that pump heavy
metals, Trends in Biologocal Sciences, 1996, 21, 237-241
15
[37] C. Rensing, Y. Sun, B. Mitra, B. Rosen, Pb(II)-translocating P-type ATPases, J Biol
Chem, 1998, 49, 32614-32617
[38] D. S. Alves, G. A. Farr, P. Seo-Mayer, M. J. Caplan, AS160 Associates with the Na+,K+-
ATPase and Mediates the Adenosine Monophosphate-stimulated Protein Kinase-dependent
Regulation of Sodium Pump Surface Expression, Mol Biol Cell, 2010, 21, 4400-4408
[39] M. Turel, A. Dürkop, A. Yegorova, A. Karasyov, Y. Scripintes, A. Lobink,
Microtiterplate phosphate assay based on luminescent quenching of a terbium complex
amenable to decay time detection, Anal Chim Acta, 2010, 675, 42-48
[40] A. Dürkop, M. Turel, A. Lobnik, O. S. Wolfbeis, Microtiter plate assay for phosphate
using a europium-tetracycline complex as a sensitive luminescent probe, Anal Chim Acta,
2006, 555, 292-298
[41] H. H. Taussky, E. Shorr, A Microcolorimetic Method For The Determination Of
Inorganic Phosphorus, J Biol Chem, 1953, 202, 675-685
[42] A. Riechers, F. Schmidt, S. Stadlbauer, B. König, Detection of Protein Phosphorylation
on SDS-PAGE Using Probes with a Phosphate-Sensitive Emission Response, Bioconjugate
Chem, 2009, 20, 804-807
[43] C. M. Spangler, C. Spangler, M. Schäferling, Luminescent Lanthanide Complexes as
Probe for the Determination of Enzyme Activities, Ann N.Y. Acad Sci, 2008, 1130, 138-148
[44] C. Spangler, C. M. Spangler, M. Soerer, M. Schäferling, Kinetic determination of the
GTPase activity of Ras proteins by means of a luminescent terbium complex, Anal Bioanal
Chem, 2009, 394, 989-996
[45] R. Joseph, J. P. Chinta, C. P. Rao, Calix[4]arene-Based 1,3-Diconjugate of Salicycl
Imine Having Dibenzyl Amine Moiety (L): Synthesis, Characterization, Receptor Properties
toward Fe2+, Cu2+, and Zn2+, Crystal Structure of Its Zn2+ and Cu2+ Complexes, and
Selective Phosphate Sensing by the [ZnL], Inorg Chem, 2011, 50, 7050-7058
[46] S. Akar, V. Tek, A. Bange, L. Lagos, P. Gill, N. Munroe, T. G. Thundat, Development of
a Biosensor for Detection of Phosphate Species in Uranium Contaminated Ground Water and
Wastewater Sediments, WM2010 Conference, March 7-11, 2010, Phoenix, AZ

16
[47] W. Li, Z. Nie, X. Xu, Q. Shen, C. Deng, J. Chen, S. Yao, A sensitive, label free
electrochemical aptasensor for ATP detection, Talanta, 2009, 78, 954-958
[48] C. B. Jacobs, M. J. Peairs, B. J. Venton, Review: Carbon nanotube based
electrochemical sensors for biomolecules, Anal Chim Acta, 2010, 662, 105-127
[49] C. Li, M. Numata, M. Takeuchi, S. Shinkai, A Sensitive Colorimetric and Fluorescent
Probe Based on a Polythiophene Derivative for the Detection of ATP, Angew Chem Int Ed,
2005, 44, 6371-6374
[50] H. Ho, M. Boissinot, M. G. Bergeron, G. Corbeil, Kim Dore, D. Boudreau, M. Leclerc,
Colorimetric and Fluorometric Detection of Nucleic Acids Using Cationic Polythiophene
Derivatives, Angew Chem Int Ed, 2002, 41, 1548-1551
[51] C. Spangler, M. Schäferling, O. S. Wolfbeis, Fluorescent probes for microdetermination
of inorganic phosphates and bisphosphates, Microchim Acta, 2008, 161, 1-39

17
2. Background
2.1 Viologens as New Phosphate-sensitive Fluorescent Probes
Bipyridylium salts can easily be reduced electrochemically to form radical anions (Scheme 1)
of mostly blue colour. Hence they are duly referred to as viologens [1]. Owing to its electron
deficiency, the dication is found to readily form charge-transfer complexes with electron-rich
donors thus creating a variety of other coloured compounds [1, 3].
The still common herbicide paraquat consists of a mere 4,4’-bipyridine which is
alkylated by chloromethane. In spite of its continued popularity it is toxic to animals and
human beings coupled with serious long time effects [4]. Owing to the fact that it is easily
available it has become a common substance for self-poisoning in suicides in many third
world countries.
The toxicity of paraquat and its low lethal dose is partly due to the fact that viologens can
coordinate biomolecules electrostatically, through -stacking, - and cation- interactions
[4-6]. Yet viologens have become an integral part of many useful applications. Accordingly,
N+
N+
R
R
N+
C
N
R
R
colourless coloured
- e-
Scheme 1. This reaction illustrates the electrochromic reaction [2] which creates a coloured monocation from a colourless dication by electrochemical reduction of a generic bipyridylium salt.

18
these various interactions with (bio)molecules have been utilized. Hence viologens have been
extensively exploited [7-11] as potential DNA intercalating labels. Moreover, sensor schemes
for nitrite [12], oxygen [13] and dopamines [14] have been developed which include a
bipyridinium component. As viologens are potentially strong redox active species [15] they
have attracted attention in the field of electrochemistry. Cyclic voltammetry in particular has
been widely used to investigate and characterize these salts [16-18]. Furthermore, they were
utilized to electrochemically switch the emission of rare earth complexes [19]. Additionally
interactions with nanomaterials [20] have been examined, e.g. graphene oxide [21] and silver
nanoparticles [21, 22].
Viologens are powerful quenchers of fluorescence [23, 24]. This trait was harnessed for
numerous applications in (bio)chemical sensing [25, 26]. The 3-D structure of proteins, for
instance, could be examined. A fluorescent ruthenium complex was linked to a viologen
group via a spacer which coordinates to the protein. Quenching of the complex was observed
for one tertiary structure while not for the other. This is due to the fact that upon an alteration
in the folding of the involved peptide bonds quenching is induced through a closer proximity
of the bipyridinium groups of the chain [27].
The worldwide prevalence of diabetes is conjectured to be 3% [28]. Hence, one of the
most common sensors is for glucose. Thus, the design and production of simple, inexpensive
and sensitive devices for this task is an important field of analytical chemistry, pharmacy and
medicine. Accordingly glucose has remained in the focus of attention for the application of
new sensing schemes. A frequent approach is utilizing boronic acid derivatives as probes [29].
They adhere to the following concept. Diols and sugars in particular coordinate on these
moieties and thereby induce a transformation in the 3-D structure from a trigonal planar
geometry to a tetrahedron. Thus the reactivity and characteristic features of such a probe are
crucially altered enabling optical, electrochemical, or other read outs [29, 30]. Viologens have
also been intensively examined as parts of sensing schemes for glucose either with [31] or
without boronic acids involved [32-34]. Singaram et al. have contrived an approach to the
detection of saccharides that utilizes the quenching effect of bipyridinium salts on HPTS [35,
36], APTS [37] and other like molecules [38]. These compounds are common aromatic dyes
(Fig. 1, 2). Their fluorescence is quenched in the presence of viologens that were modified
with a boronic acid moiety. When a sugar coordinates at this position, the 3-D structure is
impacted and quenching can no longer be exercised. Hence an increase in fluorescence

19
corresponds to a rise of glucose concentration. A similar approach was contrived here. Three
different viologens (Fig. 3) were synthesized which varied in the length of the alkyl spacer:
TEAPB, TEABB, and TEAPeB. These will interact with APTS and HPTS by forming weak
complexes with electrostatic, - and cation- interactions [25, 41] thus enabling electron
transfer [25] leading to decreased fluorescence intensity (Scheme 2). Nucleotides and
nucleosides, however, will strongly bind to viologens in the following way. The anionic
oxygen groups of the phosphoric acid will readily form salts with the quarternary ammonium
cation on the side chain while the aromatic bases will prefer the aromatic bipyridin site [42-
44].
NH2 SO3-
SO3-
O3S-
OH SO3-
SO3-
O3S-
Fig. 1. HPTS (8-Hydroxypyrene-1,2,3-trisulfonate) is a common probe for pH. Upon deprotonation (pKa 6.4) the fluorescence intensity is greatly enhanced. The excitation reaches a maximum at 454 nm of wavelength; emission peaks at 520 nm in water [39].
Fig. 2. The fluorescence of APTS (8-Aminopyrene-1,2,3-trisulfonate) is largly independent of pH. The amine group is only protonated under very acidic conditions. The excitation reaches a maximum at 488 nm of wavelength; emission peaks at 520 nm in water [40].

20
N+
N+
N+
N+
CH3
CH3
CH3
CH3
CH3
CH3
n
n
Fig. 3. Chemical structure of 1,1’-di[3-(triethylammonium)alkyl]-4,4’-bipyridylium (n=1, 2, 3) which has been designed as a quencher for sensing phosphate.
1,1’-di[3-(triethylammonium)propyl]-4,4’-bipyridilium (TEAPB), n=1
1,1’-di[3-(triethylammonium)butyl]-4,4’-bipyridilium (TEABB), n=2
1,1’-di[3-(triethylammonium)pentyl]-4,4’-bipyridylium (TEAPeB), n=3

21
It is surmised that upon interaction with ATP, for instance, the side chains of the viologens
will align and fix ATP on the phosphate groups saturating the electron deficient quencher.
Thus the fluorescence of the pyrene is reinstated (Scheme 3), and the concentration of
phosphate can be determined from the intensity of fluorescence.
Theoretically, different types of nucleoside phosphates can be distinguished by their
nucleic base (guanine or adenine) or lack thereof, the number of phosphate groups (mono-, di,
triphosphates) and structure (cAMP, cGMP). The first factor determines the extent of - and
-cation interactions between the nucleotide and the viologen. The number of phosphate
OH SO3-
SO3-
O3SN
+
N+
N+
N+
CH3
CH3 CH3
CH3 CH3
CH3
exc (460 nm)
weak emission
-(520 nm)
ET
ET
Scheme 2. Depicted here is the mechanism of fluorescence quenching of pyrenes (excitation around 450 nm) by viologens through electron transfer (ET). HPTS is coordinated by
TEAPB through electrostatic, - and cation- interactions. Thus electron transfer is enabled entailing to a decrease in fluorescence intensity on HPTS.

22
groups corresponds to the number of possible negative charges. The quenchers possess four
cationic charges on two sites where ionic bonds can be formed, i.e. the rings and the
peripheral quaternary nitrogen atoms. Additional factors to be considered are the size and the
3-D structure of the viologen. These have crucial impacts on the strength of the interaction
between phosphates and viologens. It also should be taken into account that these nucleotides
can affect the fluorescence of the pyrenes in a similar fashion and thus lowering fluorescence
intensity though to a lesser degree.
The length of the alkyl chain carrying the quaternary ammonium function is also crucial
in terms of complexation and therefore quenching potential of the bipyridinium unit. The
mode of complexation determines the possible orientation of the viologens with respect to the
analytes and thus the way and extent of binding to HPTS or APTS.
The objective of the following chapters is to report on the synthesis and quenching
potential of three different quenchers TEAPB (chapter 4.1.1/2), TEABB (chapter 4.1.3/4),
TEAPeB (chapter 4.1.5/6) as phosphate-sensitive probes, with HPTS and APTS as organic
dyes with high fluorescence intensity. Their resolution, response time and capacity of
quenching have been examined.
OH SO3-
SO3-
O3S-
exc (460 nm)
em (520 nm)
N+
N+
N+
N+
CH3
CH3
CH3
CH3
CH3
CH3
O-
O- O
-
P+
O-
O-
OP
+
O-
O-
O
O
OP
+
NN
NN
NH2
OHOH
Scheme 3. ATP interacts with and saturates the electron deficient viologen. Thus fluorescence of HPTS (excitation at 460 nm) is no longer quenched and a rise in intensity of the green emission at 520 nm could be observed.

23
[1] P. M. S. Monk, N. M. Hodgkinson, Charge-transfer complexes of the viologens: effects of
complexation and the rate of electron transfer to methyl viologen, Electrochim Acta, 1998,
43, 245-255
[2] R. J. Mortimer, T. S. Varley, Novel Color-Reinforcing Electrochromic Device Based on
Surface-Confined Ruthenium Purple and Solution-Phase Methyl Viologen, Chem Mater,
2011, 23, 4077-4082
[3] L. Pospil, J. Kuta, J. Volke, Adsorption Coupled Electrode Kinetics Of Bipyridylium-
Based Herbicides, Electroanal Chem Interfac Electrochem, 1975, 58, 217-227
[4] M. L. Roldan, G. Corrado, O. Francioso, S. Sanchez-Cortes, Interaction of soil humic
acids with herbicide paraquat analyzed by surface-enhanced Raman scattering and
fluorescence spectroscopy on silver plasmonic nanoparticles, Anal Chim Acta, 2011, 699, 87-
96
[5] A. Hori, S. Takatani, T. K. Miyamoto, M. Hasegawa, Luminescence from - stacked
bipyridines through arene-perfluoroarene, Cryst Eng Comm, 2009, 11, 567-569
[6] Y. Gao, D. Wu, 4-(4-Pyridyl)pyridinium perchlorate methanol solvate, Acta Cryst, 2010,
1068
[7] E. G. Hvastkos, D. A. Buttry, Recent advances in electrochemical DNA hybridization
sensors, Analyst, 2010, 135, 1817-1829
[8] S. Takenaka, T. Ihara, M. Takagi, Bis-9-acridinyl Derivative Containing a Viologen
Linker Chain: Electrochemically Active Intercalator for Reversible Labelling of DNA, Chem
Comm, 1990, 1585-1487
[9] G. Bellia, E. Vittorino, Salvatore, Sortino, A novel molecular conjugate for the
simultaneous DNA oxidation and targeted delivery of nitric oxide triggered by light,
Photochem Photobiol Sci, 2009, 8, 1534-1538
[10] P. P. Neelakandam, K. S. Sanju, D. Ramaiah, Effect of Bridging Units on Photophysical
and DNA Binding Properties of a Few Cyclophanes, Photochem Photobiol, 2010, 86, 282-289
[11] J. E. Satterwhite, A. M. Pugh, A. S. Danell, E. G. Hvastkovs, Electrochemical Detection
on ant-Benzo[a]pyrene Diol Epoxide DNA Damage on TP53 Codon 273 Oligomers, Anal
Chem, 2011, 83, 3327-3335

24
[12] D. Quan, W. Shin, A Nitrite Biosensor Based on Co-immobilizaion of Nitrite Reductase
and Viologen-modified Chitosan on a Glassy Carbon Electrode, Sensors, 2010, 10, 6241-
6256
[13] L. Roberts, R. Lines, S. Reddy, J. Hay, Investigation of polyviologens as oxygen
indicators in food packaging, Sens Actuat B, 2011, 152, 63-67
[14] C. Hsu, V.S. Vasantha, P. Chen, K. Ho, A new stable Fe(CN)63-/4--immobilized poly(butyl
viologen)-modified electrode for dopamine determination, Sens Actuat B, 2009, 137, 313-319
[15] W. W. Porter, T. P. Vaid, A. L. Rheingold, Synthesis and Characterization of a Highly
Reducing Neutral “Extended Viologen” and the Isostructural Hydrocarbon 4,4’’’’-Di-n-
octyl-p-quarterphenyl, J Am Chem Soc, 2005, 127, 16559-16566
[16] S. C. Dorman, R. A. O’Brien, A. T. Lewis, E. A. Slater, A. Wierzbicki, P. W. Hixon, R.
E. Sykora, A. Mirjafari, J. H. Davis, A new block for electroactive organic materials?
Synthesis, cyclic voltammetry, single crystal X-ray structure, and DFT treatment of a unique
boron-based viologen, Chem Comm, 2011, 47, 9072-9074
[17] M. Bonchio, M. Carraro, G. Casella, V. Causin, F. Rastrelli, G. Saielli, Thermal behavior
and electrochemical properties of bis(trifluoromethanesulfonyl)amide and
dodecatungstosilicate viologen dimmers, Phys Chem Chem Phys, 2012, 14, 2710-2717
[18] I. Yamaguchi, N. Mizoguchi, M. Sato, Self-Doped Polyphenylenes Containing Electron-
Accepting Viologen Side Group, Macromol, 2009, 42, 4416-4425
[19] K. Nakamura, K. Kanazawa, N. Kobayashi, Electrochemically controllable emission and
coloration by using europium(III) complex and viologen derivatives, Chem Comm, 2011, 47,
10064-10066
[20] N. Vlachopoulos, J. Nissfolk, M. Möller, A. Briancon, D. Corr, C. Grave, N. Leyland, R.
Mesmer, F. Pichot, M. Ryan, G. Boschloo, A. Hagfeldt, Electrochemical aspects of display
technology based on nanostructured titanium dioxide with attached viologen chromophores,
Electrochim Acta, 2008, 53, 4065-4071
[21] S. Krishnamurty, I. V. Lightcap, P. V. Kamat, Electron transfer between methyl viologen
radicals and graphene oxide: Reduction, electron storage and discharge, J Photochem
Photobiol A: Chemistry, 2011, 221, 214-219

25
[22] L. Guerrini, J. V. Garcia-Ramos, C. Domingo, S. Sanchez-Cortes, Nanosensors Based on
Viologen Funtionolized Silver Nanoparticles: Few Molecules Surface-Enhanced Raman
Spectroscopy Detection of Polycyclic Aromatic Hydrocarbons in Interparticle Hot Spots,
Anal Chem, 2009, 81, 1418-1425
[23] T. Ogoshi, A. Harada, Chemical Sensors Based on Cyclodextrin Derivatives, Sensors,
2008, 8, 4961-4982
[24] A. L. Holt, J. P. Bearinger, C. L. Evans, S. A, Carter, Chemically robust conjugated
polymer platform for thin-film sensors, Sensor Actuator B, 2010, 143, 600-605
[25] L. Chen, D. W. McBranch, H. Wang, R. Helgeson, F. Wudl, D. G. Whitten, Highly
sensitive biological and chemical sensors based on reversible fluorescence quenching in a
conjugated polymer, Proc Natl Acad Sci USA, 1999, 96, 12287-12292
[26] S. W. Thomas, G. D. Joly, T. M. Swager, Chemical Sensors Based on Amplifying
Fluorescent Conjugated Polymers, Chem Rev, 2007, 107, 1339-1386
[27] K. J. Oh, K. J. Cash, K. W. Plaxco, Beyond Molecular Beacons: Optical Sensprs Based
on the Binding-Induced Folding of Proteins and Polypeptides, Chem Eur J, 2009, 15, 2244-
2251
[28] S. Wild, G. Roglic, A. Green, R. Sicree, H. King, Global Prevalence of Diabetes,
Diabetes Care, 2004, 27, 1047-1053
[29] J. S. Hansen, J. B. Christensen, J. F. Petersen, T. Hoeg-Jensen, J. C. Norrild, Arylboronic
acids: A diabetic eye on glucose sensing, Sens Actuat B, 2012, 161, 45-79
[30] J. Yan, G. Springsteen, S. Deeter, B. Wang, The relationship among pKa, pH, and
binding constants in the interactions between boronic acids and diols – it is not as simple as it
appears, Terahedron, 2004, 60, 11205-11209
[31] D. Das, D. Kim, D. Park, Y. Shim, A Glucose Sensor Based on an Aminophenyl Boronic
Acid Bonded Conducting Polymer, Electroanal, 2011, 23, 2036-2041
[32] C. P. Sousa, A. S. Polo, R. M. Torresi, S. I. Córdoba de Torresi, W. A. Alves, Chemical
modification of a nanocrystalline TiO2 film for efficient electric connection of glucose
oxidase, J Coll Interf Sci, 2010, 346, 442-447

26
[33] D.B. Cordes, S. Gamsey, B. Singaram, Fluorescent Quantum Dots with Boronic Acid
Substituted Viologens To Sense Glucose in Aqueous Solution, Angew Chem Int Ed, 2006, 45,
3829-3832
[34] N. DiCesare, M. R. Pinto, K. S. Schanze, J. R. Lakowicz, Saccharide Detection Based on
the Amplified Fluorescence Quenching of a Water-Soluble Poly(phenylene ethynylene) by a
Boronic Acid Functionalized Benzyl Viologen Derivative, Langmuir, 2002, 18, 7785-7787
[35] S. Gamsey, A. Miller, M. M. Olmstead, C. M. Beavers, L. C. Hirayama, S. Pradhan, R.
A. Wessling, B. Singaram, Boronic Acid-Based Bipyridinium Salts as Tunable Receptors for
Monosaccharides and -Hydroxycarboxylates, J Am Chem Soc, 2007, 129, 1278-1286
[36] S. Gamsey, J. T. Suri, R. A. Wessling, B. Singaram, Continuous Glucose Detection
Using Boronic Acid-Substituted Viologens in Fluorescent Hydrogels: Linker Effects and
Extension to Fiber Optics, Langmuir, 2006, 22, 9067-9074
[37] B. Vilozny, A. Schiller, R. A. Wessling, B. Singaram, Multiwell plates loaded with
fluorescent hydrogel sensors for measuring pH and glucose concentration, J Mater Chem,
2011, 21, 7589-7595
[38] D. B. Cordes, A. Miller, S. Gamsey, Z. Sharrett, P. Thoniyot, R. Wessling, B. Singaram,
Optical glucose detection across the visible spectrum using anionic fluorescent dyes and a
viologen quencher in a two-componenet saccharide sensing system, Org Biomol Chem, 2005,
3, 1708-1713
[39] O. S. Wolfbeis, E. Fürlinger, H. Kroneis, H. Marsoner, Fresenius Z., Fluorimetric
Analysis, Fresen J Ana. Chem, 1983, 314, 119-124.
[40] http://www.sigmaaldrich.com/catalog
[41] K. Sato, T. Nakahodo, H. Fujihara, Redox-active -conjugated polymer nanotubes with
viologen for encapsulation and release of fluorescent dye in the nanospace, Chem Commun,
2011, 47, 10067-10069
[42] A. N. Swinburne, M. J. Paterson, K. H. Fischer, S. J. Dickson, E. V. B. Wallace, W. J.
Belcher, A. Beeby, J. W. Steed, Colourimetric Carboxylate Anion Sensors Derived from
Viologen-Based Receptors, Chem Eur J, 2010, 16, 1480-1492

27
[43] S. L. Tobey, E. V. Anslyn, Energetics of Phosphate Binding to Ammonium and
Guanidinium Containing Metallo-Receptos in Water, J Am Chem Soc, 2003, 125, 14807-
14815
[44] Y. Zhou, Z. Xu, J. Yoon, Fluorescent and calorimetric chemosensors for detection of
nucleotides, FAD and NADH: highlighted research during 2004-2010, Chem Soc Rev, 2011,
40, 2222-14815

28
2.2 NIR Dye as New Phosphate-sensitive Fluorescent Probe
Fluorescent probes have generated a lot of interest in the last couple of decades owing to their
sensitivity, low costs, and their easy and various applications [1]. One major disadvantage,
however, of fluorescent probes can be identified in their excitation and emission maxima
being located in the blue or even in the ultraviolet region. It would be very convenient and
advantageous if these were shifted towards the near-infrared (NIR) region. Then damage of a
living organism can be excluded [2]. Additionally a deeper penetration through tissue is also
enabled [3]. Moreover, auto- and background fluorescence is minimized [4] rendering this
approach very appealing to in vivo imaging [2, 5], especially due to the convenient operation
in the “water window” (650 nm to 950 nm) [2, 6]. Furthermore, an inexpensive diodes are
adequate for excitation [7].
Accordingly, numerous applications and an abundance of probes have been reported.
Many NIR dyes found applications in oncology [8, 9] for instance. Likewise, NIR Quantum
Dots have been utilized for tumor imaging and in vivo investigations [3, 10, 11].
Upconverting nanoparticles (UCNPs) have attracted tremendous interest in recent years. Their
unique capability of anti-Stokes luminescence upon excitation in the NIR region renders them
promising tools for a variety of applications [12]. UCNPs have been harnessed to probe the
activity of metalloproteinase [13], oxygen [14] and carbon dioxide [15]. They prospect to
remain in the focus of heated research for the forseeable future. Furthermore, phenoxazines
have been used as labels for proteins and amines [16]. Cyanine dyes can serve this purpose as
well [17-19]. They have become versatile molecules for a variety of applications such as in
semiconductors [20], photochromic [21] and photorefractive materials [22], in photovoltaics
[23], in light harvesting [24], and as smart materials [25]. Furthermore, cyanines have served
in mass spectroscopy [26], in imaging pertaining to cancer studies [27, 28], in solar cells [29],
in proteomics [30], as potential optical data storage [31] and in monitoring of polymerization
[32]. Hence, their tailor made synthesis has duly received a lot of attention [33-36]. Sensing
of cations such as potassium [37, 38], mercury [38, 39] and calcium [40] via probes based on
cyanine dyes has long been established. Recently anions [41], copper [42] and especially zinc
[43-45] has been added to the fold.

29
Nagano et al. [46] contrived a sensing scheme for zinc ions as follows. A cyanine dye from
the FEW company [47] was linked to a ligand which carries four nitrogen atoms. The free
electron pairs of these can form a tetrahedral complex with zinc. Upon coordination of the
metal the spectroscopic characteristics pertaining to the free ligand/dye are altered. Hence, a
shift in the excitation and emission maxima can be recorded [46]. This is due to the fact that
zinc is acting as a Lewis acid, reducing electron density, and this results in a change in the 3-
D structure of the molecule.
This scheme was exploited for phosphate sensing here. An identical dipicolylamine
ligand (L) was synthesized in two straightforward steps (see 2.2.1 below) rendering this an
easier, quicker and more inexpensive approach than described by Nagano et al. [46]. This
particular moiety has been reported to form chelates with zinc numerous times. [33, 46, 48,
49] Then a like dye was attached to this polydentate ligand (Fig. 1).
Na+
N+
CH3CH3
SO3-
N
NHCH3
CH3
SO3-
N
N
N
L
FEW-L
Fig. 1. Depicted here is FEW dye S0378. It was linked to a dipicolylamine chelate ligand.
Thus a reversible coordination of zinc cations is enabled. Free FEW-L possesses different
spectroscopic characteristics than the metal complex.

30
Upon complexation with metal cations, the spectroscopic properties of this probe are crucially
altered. When phosphate interacts with zinc, removing it from the equilibrium of free
ion/coordinated ion, a reverse effect can be observed (Scheme 1).
Additionally to the minor shift in the maxima of excitation and emission, the fluorescence
intensity is substantially decreased if metal ions are present. Different types of phosphates
N+
CH3CH3
SO3-
N
NHCH3
CH3
SO3-
N
NN
Na+
Zn2+
Na+
N+
CH3CH3
SO3-
N
NHCH3
CH3
SO3-
N
N
N
+ Zn2+ - Zn
2+
exc 670em 735
exc 656em 725
Scheme 1. The excitation maximum of FEW-L at 656 nm is shifted to 670 nm upon coordination of zinc. Likewise the emission maximum at 725 nm will be altered to 735 nm. The equilibrium can be modified by the addition of phosphate, removing the metal ion and interaction with the dye and ligand.

31
exercise different impacts on the complex [Zn(FEW-L)], either by releasing zinc or by
electrostatic interaction with dye or through the -systems from the nucleic bases.
Theoretically, different types of phosphates can be distinguished by their nucleic base
(guanine or adenine) or lack thereof, the number of phosphate groups (mono-, di-,
triphosphates) and structure (cAMP, cGMP). The base determines if, and to what extent, -
and -cation interactions can be formed between the sample and FEW-L. The number of
phosphate groups corresponds to the number of negative charges. The dye possesses one,
while zinc ions carry two positive charges to form ionic bonds. The third factor, size and 3-D
structure is very important and crucially impacts the extent to which interaction between
phosphates, the metal ion, FEW-L and [Zn(FEW-L)] is possible. Thus it needs to be taken
into account that these phosphates can impact the zinc complex and/or the free FEW-L in a
like way and thus affecting fluorescence intensity.
The objective of chapter 5 is to report on the potential of [Zn(FEW-L)] as a phosphate-
sensitive probe. Hence Pi, PPi, GTP, GDP, GMP, cGMP and their adenine counterparts are
probed by applying this particular sensing scheme in this work.

32
[1] U. Resch-Genger, M. Grabolle, S. Cavaliere-Jaricot, R. Nitschke, T. Nann, Quantum dots
versus organic dyes as fluorescent labels, Nat Methods, 2008, 5, 763-775
[2] M. Y. Berenzin, H. Lee, W. Akers, S. Achilefu, Near Infrared Dyes as Lifetime
Solvatochromic Probes for Micropolarity Measurements of Biological Systems, Biophys J,
2007, 93, 2892-2899
[3] L. A. Bentolila, Y. Ebenstein, S. Meiss, Quantum Dots for In Vivo Small-Animal Imaging,
J Nucl Med, 2009, 50, 493-496
[4] H. Lee, M. Y. Berenzin, M. Henary, L. Strekowski, S. Achilefu, Fluorescence lifetime
properties of near-infrared cyanine dyes in relation to their structures, J Photoch Photobio A,
2008, 200, 438-444
[5] J. O. Escobedo, O. Rusin, S. Lim, R. M. Strongin, NIR dyes for bioimaging applications,
Current Opinion in Chem Biol, 2010, 14, 64-70
[6] K. Umezawa, A. Matsui, Y. Nakamura, D. Citterio, K. Suzuki, Bright, Color-Tunable
Fluorescent Dyes in the Vis/NIR Region: Establishment of New “Tailor.Made” Multicolor
Fluorophores Based on Borondipyrromethane, Chem Eur J, 2009, 15, 1096-1106
[7] G. M. Fischer, M. Isomäki-Krondahl, I. Göttker-Schnetmann, E. Daltrozzo, A. Zumbusch,
Pyrrolopyrrole Cyanine Dyes: A New Class of Near-Infrared Dyes and Fluorophores, Chem
Eur J, 2009, 15, 4857-4864
[8] S. Luo, E. Zhang, Y. Su, T. Cheng, C. Shi, A review of NIR dyes in cancer targeting and
imaging, Biomaterials, 2011, 7127-7138
[9] K. Licha, B. Riefke, V. Ntziachristos, A. Becker, B. Chance, W. Semmler, Hydrophilic
Cyanine Dyes as Contrast Agents for Near-infrared Tumor Imaging: Synthesis, Photophysical
Properties and Spectroscopic In vivo Characerization, Photochem Photobiol, 2000, 72, 392-
398
[10] P. P. Neelakandam, K. S. Sanju, D. Ramaiah, Effect of Bridging Units on Photophysical
and DNA Binding Properties of a Few Cyclophanes, Photochem Photobiol, 2010, 86, 282-289
[11] K. Yong, Mn-doped near-infrared quantum dots as multimodal targeted probes for
pancreatic cancer imaging, Nanotechnology, 2009, 20, 1-11

33
[12] F. Wang, D. Debapriya, Y. Liu, X. Chen, X. Liu, Upconversion nanoparticles in
biological labeling, imaging, and therapy, Analyst, 2010, 135, 1839-1854
[13] D. E. Achatz, G. Mezö, P. Kele, O. S. Wolfbeis, Probing the Activity of Matrix
Metalloproteinase II with a Sequentially Click-Labelled Silica Nanoparticle FRET Probe,
Chem Bio Chem, 2009, 10, 2316-2320
[14] D. E. Achatz, R. Ali, O. S. Wolfbeis, Luminescent Chemical Sensing, Biosensing, and
Screening Using Upconverting Nanoparticles, Top Curr Chem, 2011, 300, 29-50
[15] D. E. Achatz, R. J. Meier, L. H. Fischer, O. S. Wolfbeis, Luminescent Sensing of Oxygen
Using a Quenchable Probe and Upconverting Nanoparticles, Angew Chem Int Ed, 2011, 50,
260-263
[16] M. Link, P. Kele, D. E. Achatz, O. S. Wolfbeis, Brightly fluorescent purple and blue
labels for amines and proteins, Bioorg Med Chem Lett, 2011, 21, 5538-5542
[17] H. H. Gorris, Sayed M. Saleh, D. B. M. Groegel, S. Ernst, K. Reiner, H. Mustroph, O. S.
Wolfbeis, Long-Wavelength Absorbing and Fluorescent Chameleon Labels for Proteins,
Peptides, and Amines, Bioconjugate Chem, 2011, 22, 1433-1437
[18] K. Saatchi, P. Soema, N. Gelder, R. Misri, K. McPhee, J. H. E. Baker, S. A. Reinsberg,
D. E. Brooks, U. O. Häfeli, Hyperbranched Polyglycerols as Trimodal Imaging Agents:
Design, Biocompatibility, and Tumor Uptake, Bioconjugate Chem, 2012, published online
ahead of print
[19] B. Renard, Y. Aubert, U. Asseline, Fluorinated squarine as near-IR label with improved
properties for the labeling of oligonucleotides, Tetrahedron Lett, 2009, 50, 1897-1901
[20] P. Schouwink, H. von Berlepsch, L. Dähne, R. F. Mahrt, Observation of strong exciton-
photon coupling in an organic microcavity in transmission and photoluminescence, J Lumin,
2001, 94-95, 821-826
[21] K. Yumoto, M. Irie, K. Matsuda, Control of the Photoreactivity of Diarylethene
Derivatives by Quarternarization of the Pyridylethynyl Group, Org Lett, 2008, 10, 2051-2054
[22] F. Würthner, S. Yao, J. Schilling, R. Wortmann, M. Redi-Abshiro, E. Mecher, F.
Gallego-Gomez, K. Meerholz, ATOP Dyes. Optimization of a Multifunctional Merocyanine

34
Chromophore for High Refractive Index Modulation in Photorefractive Materials, J Am
Chem Soc, 2001, 123, 2810-2824
[23] P. Bouit, D. Rauh, S. Neugebauer, J. L. Delgado, E. Di Piazza, S. Rigaut, O. Maury, C.
Andraud, V. Dyakonov, N. Martin, A “Cyanine-Cyanine” Salt Exhibiting Photovoltaic
Properties, Org Lett, 2009, 11, 4806-4809
[24] K. R. J. Thomas, J. T. Lin, Y. Hsu, K. Ho, Organic dyes containing thienylfluorene
conjugation for solar cells, Chem Commun, 2005, 4098-4100
[25] P. M. Mendes, Stimuli-responsive surfaces for bio-applications, Chem Soc Rev, 2008,
37, 2512-2529
[26] A. Kameyama, Y. Kaneda, H. Yamanaka, H. Yoshimine, H. Narmatsu, Y. Shinohara,
Detection of Oligosaccharides Labeled with Cyanine Dyes Using Matrix-Assisted Laser
Desorption/Ionization Mass Spectroscopy, Anal Chem, 2004, 76, 4537-4542
[27] S. Ke, X. Wen, M. Gurfinkel, C. Charnsangavej, S. Wallace, E. M. Sevick-Muraca, C.
Li, Near-Infrared Optical Imaging of Epidermal Growth Factor Receptor in Breast Cancer
Xenografts, Cancer Res, 2003, 63, 7870-7875
[28] L. J. Jones, V. L. Singer, Fluorescence Microplate-Based Assay for Tumor Necrosis
Factor Activity Using SYTOX Green Stain, Anal Biochem, 2001, 293, 8-15
[29] B. Fan, F. A. de Castro, J. Heier, R. Hany, F. Nüesch, High performing doped cyanine
bilayer solar cell, Org Electron, 2010, 11, 583-588
[30] N. A. Karp, K. S. Lilley, Maximising sensitivity for detecting changes in protein
expression: Experimental design using minimal CyDyes, Proteomics, 2005, 5, 3105-3115
[31] M. Heilemann, E. Margeat, R. Kasper, M. Sauer, P. Tinnefeld, Carbocyanine Dyes as
Efficient Reversible Single-Molecule Optical Switch, J Am Chem Soc, 2005, 127, 3801-3806
[32] J. Kabatc, A. Bajorek, R. Dobosz, Bichromophoric hemicyanine dyes as fluorescence
probes applied for monitoring of the photochremically initiated polymerization, J Mol Struct,
2011, 985, 95-104
[33] R.K. Das, A. Samanta, H.Ha, Y. Chang, Solid phase synthesis of ultra-photostable
cyanine NIR dye library, RSC Adv, 2011, 1, 573-575

35
[34] M. Panigrahi, S. Dash, S. Patel, B. K. Mishra, Synthesis of cyanines: a review,
Tetrahedron, 2012, 68, 781-805
[35] M. R. Mazieres, C. Duprant, J. Bellan, J. G. Wolf, Synthesis and characterization of new
phosphonate labeled cyanines, Dyes Pigments, 2007, 74, 404-409
[36] A. V. Kulinich, N. A. Derevyanko, A. A. Ischenko, Synthesis and spectral properties of
cyanine dyes – Derivatives of 10,10-dimethyl-7,8,9,10-tetrahydro-6H-pyrido[1,2-]indolium,
J Photoch Photobio A: Chemistry, 2008, 198, 119-125
[37] O. S. Wolfbeis, B. P. H. Schaefer, Optical Sensors: An Ion-Selective Optrode For
Potassium, Anal Chim Acta, 1987, 198, 1-12
[38] G. J. Mohr, I. Murkovic, F. Lehmann, C. Haider, O. S. Wolfbeis, Application of
potential-sensitive fluorescent dyes in anion- and cation-sensitive polymer membranes,
Sensor Actuator B, 1997, 38-39, 239-245
[39] I. Murkovic, O. S. Wolfbeis, Fluorescence-based sensor membrane for mercury (II)
detection, Sensor Actuator B, 1997, 38-39, 246-251
[40] B. P. H. Schaefer, O. S. Wolfbeis, A Calcium-Selective Optrode Based On Fluorimetric
Measurements Of Membrane Potential, Anal Chim Acta, 1989, 217,1-9
[41] X. Cao, W. Lin, L. He, A Near-Infrared Fluorescence Turn-On Sensor for Sulfide
Anions, Chem Commun, 2011, 13, 4716-4719
[42] T. Hirayama, G. C. Van de Bittner, L. W. Gray, S. Lutsenko, C. J. Chang, Near-Infrared
fluorescent sensor for in vivo copper imaging in a murine Wilson disease model, PNAS,
2012, 109, 2228-2233
[43] K. Kiyose, H. Kojima, T. Nagano, Functional Near-Infrared Fluorescent Probes, Chem
Asian J, 2008, 3, 506-515
[44] P. Carol, S. Sreejith, A. Ajayaghosh, Ratiometric and Near-Infrared Molecular Probes
for the Detection and Imaging of Zinc Ions, Chem Asian J, 2007, 2, 338-348
[45] D. Oushiki, H. Kojima, T. Terai, M. Arita, K. Hanaoka, Y. Urano, T. Nagano,
Development and Applicationof a Near-Infrared Fluorescence Probe for Oxidative Stress
Based on Differential Reactivity of Linked Cyanine Dyes, J Am Chem Soc, 2010, 132, 2795-
2801

36
[46] http://www.few.de/English/index.htm
[47] K. Kiyose, H. Kojima, Y. Urano, T. Nagano, Development of a Ratiometric Fluorescenct
Zinc Ion Probe in Near-Infrared Region, Based on Tricarbocyanine Chromophore, J Am
Chem Soc, 2006, 128, 6548-6549
[48] Y. You, S. Lee, T. Kim, K. Ohkubo, W. Chae, S. Fukuzumi, G. John, W. Nam, S. J.
Lippard, Phosphorescent Sensor for Biological Mobile Zinc, J Am Chem Soc, 2011, 133,
18328-18342
[49] A. J. Moro, P. J. Cywinski, S. Körsten, G. J. Mohr, An ATP fluorescent chemosensor
based on a Zn(II)-complexed dipicolylamine receptor cpupled with a naphthalimide
chromophore, Chem Commun, 2010, 46, 1085-1087

37
3. Experimental
3.1 Materials and Methods
3.1.1 Instrumental Set Up
All NMR spectra were recorded on a 300 MHz Burker Avance spectrometer (Bruker,
www.bruker-biospin.com).
HRMS was acquired on an Agilent Q-TOF 6540 UHD (www.agilent.co.uk).
All measurements dealing with quenchers were carried out on a Tecan GENios Plus microtiter
plate reader F129024 (www.mtxlsi.com/TECANGENIOS.htm).
Experimenta parameters: Temperature: 37 °C; Filter (emission): 535 nm; Filter (excitation):
430 nm; Gain: 84 V; Integration time: 30 µs; Shaking: 25 s; Number of flashes: 110;
Duration: 1800 s
Microtiter Plate: Micro-Assay-Plate, Chimney, 96Well, 127, 8/86/15, Black, Clear Bottom
by Greiner Bio-One (655096, www.gbo.com) was exclusively used.
All emission and excitation spectra were recorded on a Jasco FP-6200 (www.jasco.co.uk).
Measurement parameters: PMT Voltage: 400 V; Excitation Band Width: 5 nm; Emission
Band Width: 10 nm; Speed: 100 nm/s; Data Pitch: 0.5 nm; Response: Medium; Filters
(excitation): 670 nm; Filters (emission): 740 nm

38
3.1.2 Chemicals
All chemicals were obtained from commercial sources, e.g. Sigma Aldrich
(www.sigmaaldrich.com) in the highest purity available or from Deutero GmbH
(www.deutero.de) (Table 1). The FEW dye S0378 was obtained from FEW Chemicals
GmbH (Bitterfeld) (http://www.few.de).
All measurements were carried out in TRIS buffer of the following composition:
24 mM*L-1 Tris(hydroxymethyl)aminomethan (TRIS), 160 mM*L-1 NaCl, 3.60 mM*L-1
KCl, 0.50 mM*L-1 MgCl2.
pH was adjusted to 7.4 by addition of 1 M*L-1 HCl. It was monitored using a CG 842 pH
meter (Schott, www.schott.com). The following stock conc. Were adjusted. Phosphates: 17.5
µM*L-1, FEW-L: 1 µM*L-1, zinc perchlorate: 5.00 µM*L-1, pyrenes: 0.50 µM*L-1, and
viologens: 5 µM*L-1
All chemicals were added in the following order: Quencher, buffer, pyrene, and sample
phosphate.

39
3.1.2 Syntheses
Synthesis of Trisodium 8-Aminopyrene-1,2,3-trisulfonate (APTS) [1]
The synthesis of APTS was carried out according to the protocol by Singaram et al. [1]. First,
sodium sulfate (1.13g, 8.00 mmol), conc. sulphuric acid (5 ml), and aminopyrene (434 mg,
2.00 mmol) were placed into a dry round-bottom flask equipped with a drying tube. Next 6 ml
of fuming sulphuric acid (20% SO3) was added, and the reaction mixture was stirred at 60 °C.
After 24 hours the solution was carefully poured into 50 ml of water. The aqueous mixture
was neutralized using 50 % m/m sodium hydroxide solution. Water was removed on a rotary
evaporator then methanol was added to the crude product. The mixture was sonicated in an
ultrasonic bath for 30 minutes then insolubles were removed by filtration. Volatiles were
removed by evaporation. The crude product was kept in the fridge over-night to solidify.
Ethanol was added, and after filtration the solvents were removed by evaporation. The
product did not require further purification. A brown solid was obtained in 3% yield (30.00
mg, 0.05 mmol). ESI–MS: [M-H-] (calculated): 456.4, [M-H-] (found): 456.0; 1H NMR
(CD3OD, 300 MHz) 8.19 (s, 1H), 8.41 (d, J = 9.88 Hz, 1H), 8.91(d, J = 9.88 Hz, 1H),
9.03 (d, J = 9.88 Hz, 1H), 9.15 (d, J = 9.88 Hz, 1H), 9.30 (s, 1 H); 13C NMR (CD3OD, 75
MHz) 114.92, 117.74, 119.52, 122.20, 124.18, 124.99, 126.20, 127.76,
128.00, 128.94, 131.51, 131.93, 136.07, 136.54, 142.35, 145.83.
[1] Z. Sharrett, S. Gamsey, L. Hirayama, B. Vilozny, J. T. Suri, R. A. Wessling, B. Singaram, Exploring the use
of APTS as a fluorescent reporter dye for continuous glucose sensing, Org Biomol Chem, 2009, 7, 1461-1470
NH2 NH2 SO3-
SO3-
O3S-
217.27 g/mol
Na+
Na+
Na+
523.40 g/mol
1) H2SO4, H2SO4 (fuming, 20% SO3),
Na2SO4, 60 °C, 1 d
2) H2O, NaOH (50%)

40
Synthesis of 3-bromo-N,N,N-triethylpropane-1-ammonium-bromide
The synthesis of the 3-Bromo-N,N,N-triethylalkyl-1-ammonium-bromides was carried out
using a modified protocol of Kim et al. [2]. A round-bottom flask was charged with
dibromopropane (24 ml, 47.52 g, 235.36 mmol), 1.64 ml triethylamine (1.20 g, 11.86 mmol)
and 5 ml THF and the resulting mixture was stirred at room temperature over-night. Ethanol
was added and product was collected by filtration, yielding 1.16 g (3.83 mmol, 32.04%) of a
white solid. HR-ESI–MS: [M*+] (calculated): 208.0695, [M*+] (found): 208.0700; 1H NMR
(D2O, 300 MHz) 1.21 (t, J = 6.59, 9H), 2.21 (m, 2H), 3.25 (m, 8H), 3.47 (t, J = 6.04
Hz, 2H); 13C NMR (D2O, 75 MHz) 6.72, 24.25, 29.32, 52.87, 55.36.
[2] W. S. Jeon, E. Kim, Y. H. Ko, I. Hwang, J. W. Lee, S. Kim, H. Kim, K. Kim, Molecular Loop Loc: A Redox-
Driven Molecular Machine Based on a Host-Stabilized Charge-Transfer Complex, Angew Chem Int Ed, 2005,
44, 87-91
Br
Br+
N
CH3
CH3 CH3
Br
N+
CH3
CH3
CH3
101.19 g/mol201.90 g/mol
Br-
303.08 g/mol
THF
1 d

41
Synthesis of 3-Bromo-N,N,N-triethylbutyl-1-ammonium bromide
Dibromobutane (64.37 ml, 117.41 g, 543.75 mmol), 3.8 ml triethylamine (2.763 g, 27.30
mmol) and 5 ml THF were placed into a round-bottom flask and stirred at room temperature
over-night. Ethanol was added and the product was filtered off, yielding 6.66 g (21.00 mmol,
76.91%) of a white solid. HR-ESI–MS: [M*+] (calculated): 236.1008, [M*+] (found):
236.1007; 1H NMR (D2O, 300 MHz) 1.17 (t, J = 7.14, 9H), 1.80 (m, 4H), 3.17 (t, J =
6.66 Hz, 2H), 3.20 (q, J = 7.14, 6H), 3.47 (t, J = 6.66 Hz, 2H); 13C NMR (D2O, 75 MHz)
6.79, 19.89, 28.67, 33.37, 52.62, 55.63.
Synthesis of 3-Bromo-N,N,N-triethylpentyl-1-ammonium-bromide
Dibromopentane (74.37 ml, 125.09 g, 543.75 mmol), 3.8 ml triethylamine (2.763 g, 27.30
mmol) and 5 ml THF were placed into a round-bottom flask and stirred at room temperature
over-night. Ethanol was added and the product was filtered off, yielding 6.26 g (18.90 mmol,
69.23%) of a white solid. HR-ESI–MS: [M*+] (calculated): 252.1144, [M*+] (found):
252.1149; 1H NMR (D2O, 300 MHz) 1.18 (t, J = 7.14, 9H), 1.43 (m, 2H), 1.63 (m, 2H),
Br
Br+
N
CH3
CH3 CH3
N+
CH3
CH3
CH3
Br
101.19 g/mol
Br-
THF
1 d
229.95 g/mol 331.14 g/mo
Br
Br
+N
CH3
CH3 CH3
N+
CH3
CH3
CH3
Br
101.19 g/mol215.93 g/mol
Br-
317.12 g/mol
THF
1 d

42
1.85 (m, 2H), 3.10 (t, J = 6.54 Hz, 2H), 3.20 (q, J = 7.14, 6H), 3.45 (t, J = 6.54 Hz,
2H); 13C NMR (D2O, 75 MHz) 6.84, 20.34, 24.42, 31.48, 34.49, 52.64, 56.53.
Synthesis of 1,1’-di[3-(triethylammonium)propyl]-4,4’-bipyridilium (TEAPB)
3-Bromo-N,N,N-triethylproyl-1-ammonium bromide (1.16 g, 3.82 mmol) and 4,4’-bipyridin
(74.60 mg, 0.48 mmol) were dissolved in acetonitrile and the reaction mixture was refluxed
for three days. The resulting mixture was allowed to cool to room temperature then crude
product was collected by filtration and dissolved in water. Addition of excessive amount of
potassium hexafluorophosphate induced crystallization of the product as its
hexafluorophosphate salt. An off white solid was obtained in a yield of 288.00 mg (0.28
mmol, 58.33%). HR-ESI–MS: [M*+] (calculated): 372.4, [M*+] (found): 372.9; 1H NMR
(DMSO, 300 MHz) 1.20 (t, J = 7.28, 18H), 2.40 (m, 4H), 3.22 (m, 16H), 4.70 (t, J =
7.14 Hz, 4H), 8.81 (d, J = 8.23 Hz, 4H), 9.40 (d, J = 8.23 Hz, 4H); 13C NMR (DMSO, 75
MHz) 7.00, 23.19, 52.26, 52.40, 126.32, 146.07, 148.59.
N
NBr
N+
CH3
CH3
CH3
+
N+
N+
N+
N+
CH3
CH3
CH3
CH3
CH3
CH3
303,08 g/mol 156,19 g/mol
1) MeCN, , 3 d 2) H2O, KPF6
PF6- PF6
-
PF6-
PF6-
Br-
1022.58 g/mol

43
Synthesis of 1,1’-di[3-(triethylammonium)butyl]-4,4’-bipyridylium (TEABB)
3-Bromo-N,N,N-triethylbutyl-1-ammonium-bromide (4.00 g, 12.62 mmol) and 4,4’-
bipyridine (200.00 mg, 1.28 mmol) were dissolved in acetonitrile and refluxed for three days.
The crude product was filtered off, dissolved in water and precipitated by addition of
potassium hexafluorophosphate. An off white solid was obtained in a yield of 956.50 mg
(0.93 mmol, 72.66%). HR-ESI–MS: [M*+] (calculated): 560.4296, [M*+] (found): 560.4294; 1H NMR (DMSO, 300 MHz) 1.24 (m, 22H), 1.70 (m, 4H), 3.24 (m, 16H), 4.76 (t, J =
7.14 Hz, 4H), 8.82 (d, J = 8.23 Hz, 2H), 9.41 (d, J = 8.23 Hz, 2H); 13C NMR (DMSO, 75
MHz) 7.06, 18.05, 27.55, 51.93, 52.02, 126.48, 145.77, 148.51.
N+
CH3
CH3
CH3
Br
Br-
+N
N
N+
N+ N
+
N+
CH3 CH3
CH3CH3
CH3 CH3
1) MeCN, , 3 d 2) H2O, KPF6
PF6-
PF6-
PF6-
PF6-
1050.63 g/mol
215.93 g/mol156,19 g/mol

44
Synthesis of 1,1’-di[3-(triethylammonium)pentyl]-4,4’-bipyridylium (TEAPeB)
3-Bromo-N,N,N-triethylpentyl-1-ammonium-bromide (4.58 g, 13.83 mmol) and 4,4’-
bipyridin (255.00 mg, 1.63 mmol) were dissolved in acetonitrile and refluxed for three days.
The crude product was filtered off, dissolved in water and precipitated by addition of
potassium hexafluorophosphate. An off white solid was obtained in a yield of 331.20 mg
(0.31 mmol, 19.02%). HR-ESI–MS: [M*+] (calculated): 588.4609, [M*+] (found): 588.4611; 1H NMR (DMSO, 300 MHz) 1.20 (t, J = 7.28, 18H), 1.40 (m, 4H), 1.64 (m, 4H), 3.22
(m, 16H), 4.70 (t, J = 7.14 Hz, 4H), 8.81 (d, J = 8.23 Hz, 2H), 9.40 (d, J = 8.23 Hz, 2H); 13C NMR (DMSO, 75 MHz) 6.96, 29.99, 31.43, 34.60, 51.91, 126.49, 145.65,
148.56.
N+
CH3
CH3
CH3
Br
Br-
331.14 g/mol
+
N
N
N+
N+
N+
N+
CH3
CH3
CH3
CH3
CH3
CH3
156.19 g/mol
PF6- PF6
-
PF6-
PF6-
1078.68 g/mol
1) MeCN, , 3 d 2) H2O, KPF6

45
Synthesis of N-(2-[di(2-picolyl)amino]ethyl)phthalimide
Di(2-picolyl)amine (2.70 ml, 15.00 mmol), N-(2-bromoethyl)phthalimide (4.17 g, 16.42
mmol) and potassium carbonate (3.30 g, 23.88 mmol) were heated at 90 °C in DMF over-
night. After cooling to room temperature the reaction mixture was poured onto ice-water.
Two hours later the crude product was filtered off and washed with cold water and was dried
over calcium chloride in vacuo. An off white solid was obtained in a yield of 2.45 mg (6.58
mmol, 43.87%). ESI–MS: [MH+] (calculated): 472.4, [MH+] (found): 472.9; 1H NMR
(CDCl3, 300 MHz) 2.79 (t, J = 6.86, 2H), 3.79 (m, 6H), 6.99 (t, J = 7.69 Hz, 2H), 7.31
(m, 4H), 7.71 (m, 4H), 8.34 (d, J = 7.69 Hz, 2H); 13C NMR (CDCl3, 75 MHz) 36.04,
51.60, 60.20, 121.92, 122.98, 123.06, 132.20, 133.79, 136.18, 148.85,
159.6, 168.06.
N
NHN
+ N
O
O
Br
N
NN
NO O
199.25 g/mol 254.09 g/mol
372.42 g/mol
K2CO3 DMF, 90 °C
46
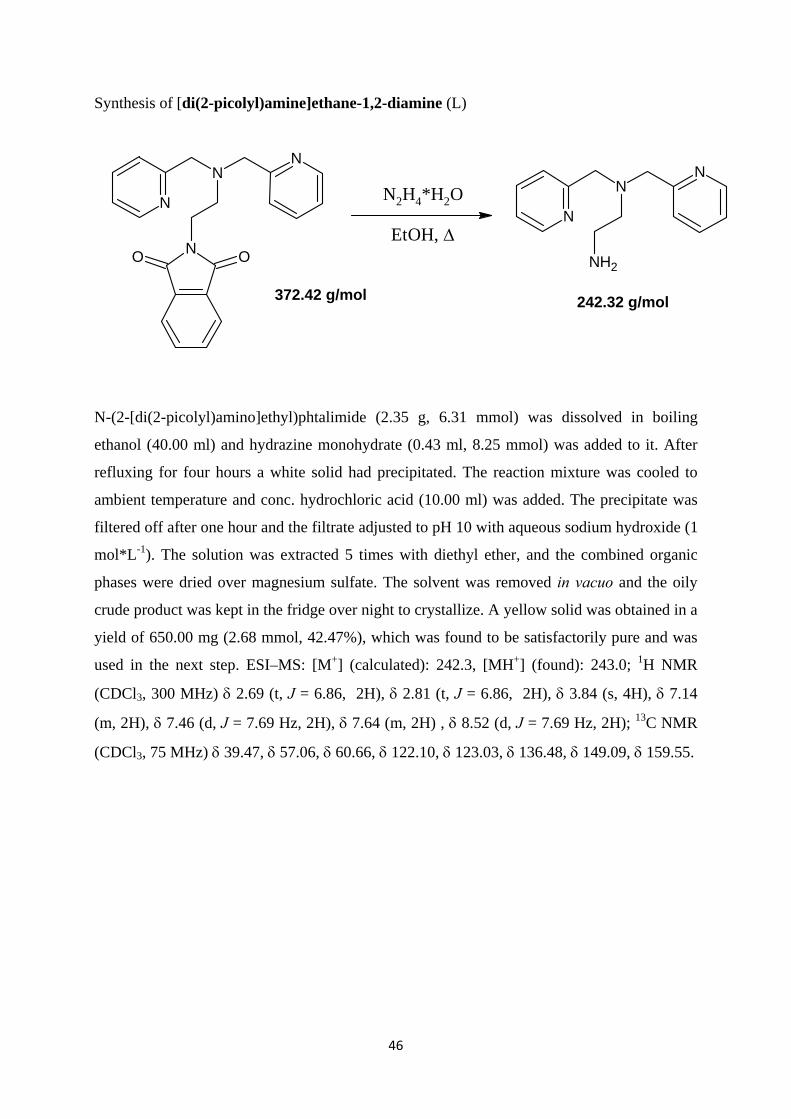
Synthesis of [di(2-picolyl)amine]ethane-1,2-diamine (L)
N-(2-[di(2-picolyl)amino]ethyl)phtalimide (2.35 g, 6.31 mmol) was dissolved in boiling
ethanol (40.00 ml) and hydrazine monohydrate (0.43 ml, 8.25 mmol) was added to it. After
refluxing for four hours a white solid had precipitated. The reaction mixture was cooled to
ambient temperature and conc. hydrochloric acid (10.00 ml) was added. The precipitate was
filtered off after one hour and the filtrate adjusted to pH 10 with aqueous sodium hydroxide (1
mol*L-1). The solution was extracted 5 times with diethyl ether, and the combined organic
phases were dried over magnesium sulfate. The solvent was removed in vacuo and the oily
crude product was kept in the fridge over night to crystallize. A yellow solid was obtained in a
yield of 650.00 mg (2.68 mmol, 42.47%), which was found to be satisfactorily pure and was
used in the next step. ESI–MS: [M+] (calculated): 242.3, [MH+] (found): 243.0; 1H NMR
(CDCl3, 300 MHz) 2.69 (t, J = 6.86, 2H), 2.81 (t, J = 6.86, 2H), 3.84 (s, 4H), 7.14
(m, 2H), 7.46 (d, J = 7.69 Hz, 2H), 7.64 (m, 2H) , 8.52 (d, J = 7.69 Hz, 2H); 13C NMR
(CDCl3, 75 MHz) 39.47, 57.06, 60.66, 122.10, 123.03, 136.48, 149.09, 159.55.
242.32 g/mol
N
NN
NH2
N
NN
NO O
372.42 g/mol
N2H4*H2O
EtOH,

47
Synthesis of 2-[2-[2-[di(2-Picolyl)amine]ethane-1,2-diamine]-3-[2-[1,3-dihydro-3,3-
dimethyl-1-(4-sulfobutyl)-2H-indol-2-ylidene]-ethylidene]-1-cyclopenten-1-yl]-ethenyl]-
3,3-dimethyl-1-(4-sulfobutyl)-3H-indolium sodium salt (FEW-L)
[di(2-Picolyl)amine]ethane-1,2-diamine (650.00 mg, 2.68 mmol), FEW S0378 (1.58 g, 2.15
mmol), and triethylamine (0.36 ml, 2.60 mmol) were stirred in DMF at room temperature
over-night while a change of colour from green to blue could be observed. The reaction
mixture was poured into methyl tert-butyl ether. The product precipitated and was collected
by filtration. The crude product was washed with methyl tert-butyl ether and dried in vacuo.
A blue solid was obtained in a yield of 2.00 g (2.12 mmol, 79.10%). HR-ESI–MS: [M-2H2+]
(calculated): 460.2159, [M-2H2+] (found): 460.2164; 1H NMR (DMSO, 600 MHz) 1.52 (s,
242.32 g/mol
N+
CH3CH3
SO3-
N
ClCH3
CH3
SO3-
Na+
+
N+
CH3CH3
SO3-
N
NHCH3
CH3
SO3-
N
NN
Na+
N
NN
NH2
735.33 g/mol
941.19 g/mol
Et3N DMF, 12 hFEW S0378

48
12H), 1.69 (m, 4H), 1.75 (m, 4H), 2.52 (t, J = 7.14 Hz, 4H), 2.62 (m, 4H), 2.68 (m,
4H), 3.01 (t, J = 6.00 Hz, 2H), 3.87 (t, J = 6.00 Hz, 2H), 3.91 (m, 4H), 4.16 (t, J = 7.14
Hz, 1H), 5.61 (d, J = 12.00 Hz, 2H), 7.04 (t, J = 8.00 Hz, 2H), 7.13 (d, J = 8.00 Hz, 2H),
7.27 (m, 2H), 7.46 (d, J = 8.00 Hz, 2H), 7.49 (d, J = 8.00 Hz, 2H), 7.73 (d, J = 8.00
Hz, 2H), 7.73 (d, J = 12.00 Hz, 2H), 7.74 (d, J = 8.00 Hz, 2H), 8.46 (d, J = 4.00 Hz, 2H); 13C NMR (DMSO, 600 MHz) 22.57, 22.70, 25.55, 25.96, 26.13, 26.21, 27.55,
36.00, 42.44, 43.85, 44.18, 45.83, 47.15, 49.00, 50.80, 51.08, 52.35,
58.89, 59.44, 96.45, 102.72, 109.29, 111.63, 122.16, 122.54, 122.69,
123.28, 126.40, 128.35, 135.72, 136.90, 137.12, 139.81, 141.44, 142.33,
143.10, 148.78, 149.37, 158.44, 162.63, 164.52, 166.33, 170.85.

49
4. Viologen-Type Probes for Phosphates
4.11 Results and Discussion
This chapter deals with the luminescence of various probe designs (see Table1) of HPTS and
APTS with the quenchers TEAPB, TEABB, and TEAPeB in the presence of numerous
phosphates.
A large number of phosphates was investigated. Hence it is convenient to group these
analyte phosphates. ATP, ADP and Pi are involved in the ATPase reaction (see Introduction,
scheme 1). Thus the first group includes these phosphate species. Moreover, guanosines were
investigated. AMP, cAMP, and PPi were also studied. Finally all adenines are displayed in
one plot. Fluorescence intensity was recorded in a microtiter plate. All experiments were
repeated at least eight times for each phosphate sample and subjected to statistical evaluation,
mostly standard deviation by Excel. The concentrations were 5 µM*L-1 for the quenchers,
17.5 µM*L-1 for the samples and 0.5 µM*L-1 for the pyrenes according to chapter 3.1.2.
Each measurement was referenced to the emission of HPTS or APTS (I0) without quencher
and sample. The fluorescence intensity was recorded in 24 mM TRIS buffer solution (see 1.2)
at pH 7.8.

50
Table 1. Overview of the sensing schemes for phosphate that were investigated in this chapter. The notation PQI refers to HPTS serving as fluorescent pyrene and TEAPB as quencher. PQI to PQVI were subsequently studied and exposed to phosphates in order to
determine whether or not a viable sensing scheme could be achieved.
Pyrene Quencher Notation
HPTS TEAPB PQI
TEABB PQIII
TEAPeB PQV
APTS TEAPB PQII
TEABB PQIV
TEAPeB PQVI

51
4.1.1 HPTS with TEAPB as fluorescent probe for the detection of
ATP and other phosphates
Fig. 1 displays the quenching of HPTS by TEAPB. The signal became stable after 200
seconds and yielded a drop to 83%.
Upon addition of phosphates a reverse effect, i.e. a partial recovery of the fluorescence signal,
is expected due to interaction of the negative charges and the aromatic nucleic bases with the
viologens (see 1.1).
0 300 600 900 1200 1500 1800
0.75
0.80
0.85
0.90
0.95
1.00
1.05 HPTS HPTS, TEAPB
I/I 0
(%)
t (s)
Fig. 1. The quenching of HPTS by TEAPB is displayed here. The fluorescence intensity of mere HPTS (solid) remains at 100%. After 200 seconds the signal of HPTS and TEAPB is constant and yields a quenching of roughly 20%.

52
Phosphates in ATPase Reaction
The intensity plots upon the addition of ATP, ADP and Pi are displayed in Fig. 2.
It was found that there is a sufficiently strong interaction between ATP and TEAPB entailing
to a release of virtually all HPTS. Hence the fluorescence intensity recovers to the level I0 of
the reference. A substantially weaker interaction takes place between ADP and TEAPB. This
can be explained on the basis of remaining electron transfer from HPTS to the quencher not
being completely disabled and thus fluorescence intensity is of intermediate magnitude.
Contrary to this, Pi carries no sugar and aromatic base moieties. As a consequence there is no
possibility for - or similar interactions, only electrostatic interaction between phosphate and
the quaternary nitrogen groups of TEAPB can be accounted for any effect. Accordingly, the
0 300 600 900 1200 1500 1800
0,75
0,80
0,85
0,90
0,95
1,00
1,05 HPTS HPTS_TEAPB_ATP HPTS_TEAPB HPTS_TEAPB_P
i
HPTS_TEAPB_ADP
I/I 0
(%
)
t (s)
ATP
ADP
Pi
TEAPB
HPTS
Fig. 2. The effect of ATP, ADP and Pi on the quenching of HPTS by TEAPB is depicted here. The low signal at 83% due to TEAPB is increased. After 200 seconds the interaction of the phosphates is strong enough to release HPTS, in the case of ATP virtually completely. Quenching by TEAPB is decreased, entailing to a rise in fluorescence intensity.

53
weakest fluorescence recovery can be observed in the case of Pi. Due to the difference in the
interacting forces a clear distinction between the three phosphates involved can be drawn.
Guanosine Phosphates
Guanine carrying nucleotides constitute the next group of phosphates. Their response is
depicted in Fig. 3. GTP is analogous to ATP and the strongest interaction with TEAPB is
recorded in this case. The signal is recovered to 95% of the reference. A slightly lower signal
was recorded for GMP. This is surprising as the molecule is substantially smaller and it
possesses fewer phosphate groups as opposed to GTP. Hence the possibility for interaction
with the quaternary nitrogen moiety of TEAPB is limited. A substantial gap is observed
0 300 600 900 1200 1500 1800
0,75
0,80
0,85
0,90
0,95
1,00
1,05
HPTS HPTS_TEAPB HPTS_TEAPB_GTP HPTS_TEAPB_GDP HPTS_TEAPB_GMP HPTS_TEAPB_cGMP
I/I 0
(%
)
t (s)
HPTS
GTP
GMP
cGMP
GDP
TEAPB
Fig. 3. The effect of GTP, GDP, GMP and cGMP on the quenching of HPTS by TEAPB is depicted here. The low signal at 83% from TEAPB is increased. After 300 seconds the interaction of the phosphates, especially GTP and GMP, is strong enough to release most HPTS. Quenching by TEAPB is decreased, entailing to a rise in fluorescence intensity.
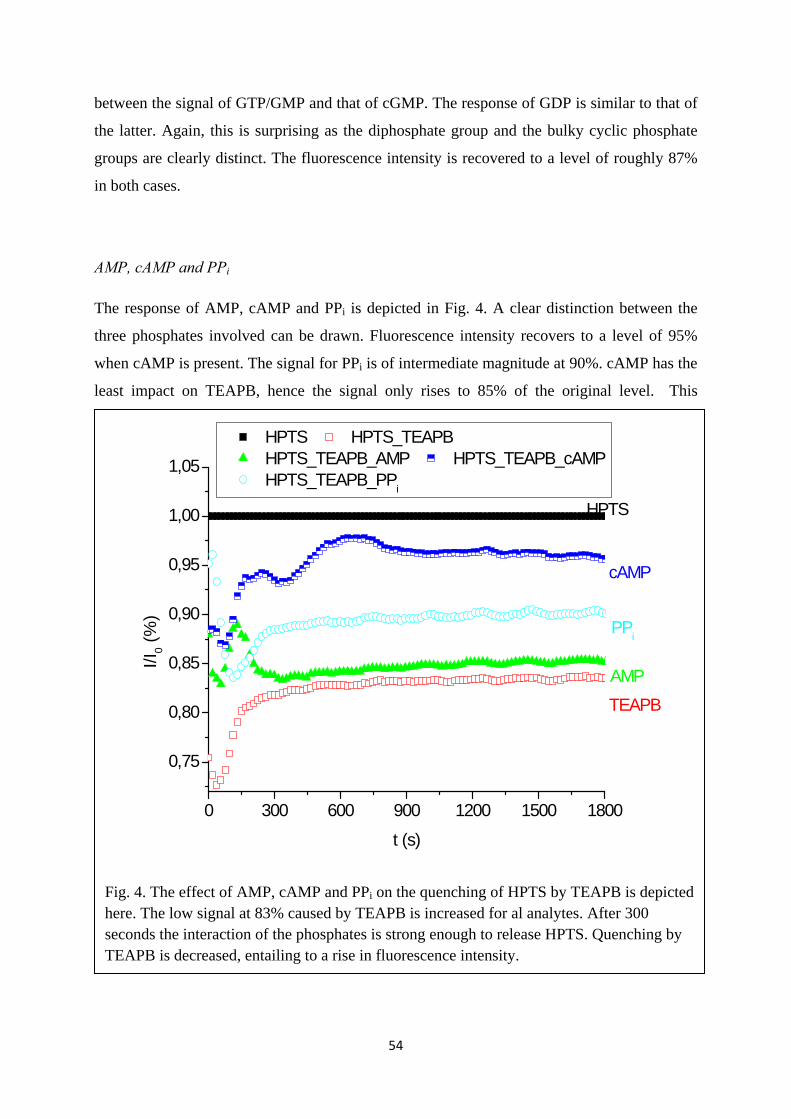
54
between the signal of GTP/GMP and that of cGMP. The response of GDP is similar to that of
the latter. Again, this is surprising as the diphosphate group and the bulky cyclic phosphate
groups are clearly distinct. The fluorescence intensity is recovered to a level of roughly 87%
in both cases.
AMP, cAMP and PPi
The response of AMP, cAMP and PPi is depicted in Fig. 4. A clear distinction between the
three phosphates involved can be drawn. Fluorescence intensity recovers to a level of 95%
when cAMP is present. The signal for PPi is of intermediate magnitude at 90%. cAMP has the
least impact on TEAPB, hence the signal only rises to 85% of the original level. This
0 300 600 900 1200 1500 1800
0,75
0,80
0,85
0,90
0,95
1,00
1,05
HPTS HPTS_TEAPB HPTS_TEAPB_AMP HPTS_TEAPB_cAMP HPTS_TEAPB_PP
i
I/I 0
(%
)
t (s)
HPTS
cAMP
PPi
AMP
TEAPB
Fig. 4. The effect of AMP, cAMP and PPi on the quenching of HPTS by TEAPB is depicted here. The low signal at 83% caused by TEAPB is increased for al analytes. After 300 seconds the interaction of the phosphates is strong enough to release HPTS. Quenching by TEAPB is decreased, entailing to a rise in fluorescence intensity.

55
confirms the assumption that due to their distinct structure, distinct signals are to be expected
from different modes and intensity of interaction with the fluorescent quencher TEAPB. The
signal requires a considerably longer time to become stable. This might be due to the presence
of the bulky phosphate ester. The equilibrium requires longer time to be set in such a case.
Adenosine Phosphates
Fig. 5 summarizes the response of all adenosine derivatives. Again, a clear distinction can be
drawn between the four species. The phosphate species that were investigated here all possess
the same base. They only differ in size and number of phosphate groups and thus their
potential to participate in electrostatic interactions. Yet that point of discrimination suffices in
75
80
85
90
95
100
105
cAM
PAM
PADP
ATPTE
APB
I/I 0
(%)
HPTS
Fig. 5. The response of ATP, ADP, AMP and cAMP on the quenching of HPTS by TEAPB is depicted here at 200 seconds including error bars. The low signal at roughly 80% from TEAPB alone is increased after addition of (bio)phosphates. The signal for ATP almost fully recovers. Quenching by TEAPB is decreased, entailing to a rise in fluorescence intensity upon addition of phosphates.

56
order to obtain results in good resolution. Yet a sometimes high standard deviation needs to
be taken into account.
4.1.2 APTS with TEAPB as fluorescent probe for the detection of
ATP and other phosphates
The potential of TEAPB as a quencher is depicted in Fig. 6. The fluorescence intensity
became immediately stable and dropped to 76%. Forcomparon, when HPTS was used, a time
delay of 200 seconds was required. The only distinction between these two pyrenes lies in the
side group. APTS possesses an uncharged amino group while HPTS has a negatively charged
hydroxyl group at the applied pH. While relatively weak –interactions offer the only mode
0 300 600 900 1200 1500 18000,70
0,75
0,80
0,85
0,90
0,95
1,00
1,05
1,10 APTS APTS_TEAPB
I/I 0
(%)
t (s)
Fig. 6. Quenching of APTS by TEAPB: The fluorescence intensity of mere APTS (solid) remains at 100%. The addition of TEAPB causes a quenching by roughly 25%.

57
of coordination in the former case much stronger electrostatic forces are involved in the latter
case. Hence, equilibration is much faster. Moreover, TEAPB quenches the fluorescence by
roughly 5%. The more efficient quenching is probably due to the more compact complex as a
result of the presence of stronger interacting forces.
The quenched signal is expected to recover to its original level upon addition of phosphates.
Phosphates in ATPase Reaction
The responses of ATP, ADP and Pi are displayed in Fig. 7. Contrary to HPTS, APTS does
not retrieve the level of fluorescence intensity without TEAPB as quencher when phosphate is
added. While it causes the strongest reverse effect, only about 90% of the fluorescence
intensity of the original signal is reached upon addition of ATP. The stronger quenching of
the fluorescence intensity of APTS by TEAPB would be an explanation. Thus an equal
concentration of ATP entails to the signal recovering less effectively. Apparently, a weaker
interaction is present between ADP and TEAPB and fluorescence intensity is of intermediate
magnitude. Pi carries no sugar and aromatic base. Owing to this fact - or similar
interactions are obviously no factor here. Phosphate and the quaternary nitrogen groups of
TEAPB are only subjected to electrostatic attraction. Yet Pi raises fluorescence intensity to
nearly the level of ADP. A distinction between the three phosphates investigated can be
drawn. However, the resolution is less advantageous than for HPTS.

58
Guanosine Phosphates
Fig. 8 yields the response of the guanine phosphates. The fluorescence intensity of cGMP and
GDP is not recovered at all. A rise of 5% to 80% of the signal I0 can be observed for GMP.
GTP, in analogy to ATP, yields the highest signal recovery. This was also the case for HPTS.
Yet the resolution is much poorer in this case. A possible explanation may lie behind the
strong interaction between TEAPB and APTS as could be seen in a more efficient quenching
and an immediate drop in fluorescence (Fig. 6). Accordingly phosphates cannot pry the
quencher off the pyrene quick and sufficiently enough. cGMP might require more time for the
equilibrium to become set as was the case for PQI. It can also be concluded that GMP and
0 300 600 900 1200 1500 18000,70
0,75
0,80
0,85
0,90
0,95
1,00
1,05
APTS APTS_TEAPB_ATP APTS_TEAPB APTS_TEAPB_P
i
APTS_TEAPB_ADPI/
I 0 (%
)
t (s)
ATPADPPi
TEAPB
APTS
Fig. 7. Effect of ATP, ADP and Pi on the quenching of APTS by TEAPB. The low signal at 76% stemming from electron transfer to TEAPB is increased. After 200 seconds the interaction of the phosphates is strong enough to release APTS. Quenching by TEAPB is decreased and causes a rise in fluorescence intensity.

59
GTP seem to be a better match for TEAPB regarding size and number of charges.
AMP, cAMP and PPi
Fig. 9 exhibits the behaviour of cAMP, AMP and diphosphate in the sensing scheme PQII.
The signal of cAMP does not surpass the response from TEAPB, i.e. no reduction of
quenching occurs. Once more, resolution is poor. AMP and PPi are of virtually the same level
at slightly below 80% of the fluorescence intensity of the reference. Both molecules feature
distinct building blocks and were not expected to prompt a like response. This observation is
contrary to PQI. A very good resolution could be achieved there for all adenosine phosphates.
0 300 600 900 1200 1500 18000,70
0,75
0,80
0,85
0,90
0,95
1,00
1,05
APTS APTS_TEAPB APTS_TEAPB_GTP APTS_TEAPB_GMP
I/I 0
t (s)
APTS
GTP
GMP
TEAPB
Fig. 8. Effect of GTP, GDP, GMP and cGMP on the quenching of APTS by TEAPB. The low signal at 76% caused by TEAPB is increased. After 200 seconds the interaction of the phosphates is sufficient for the release of most HPTS. Quenching by TEAPB is decreased and causes a rise in fluorescence intensity. The curves pertaining to cGMP and GDP are omitted here as they do not surpass the signal by APTS/TEAPB significantly.

60
Adenosine Phosphates
The response of ATP, ADP, AMP and cAMP is on display in Fig. 10. The signal of ADP and
AMP is of virtually the same magnitude. That of ATP reaches only a slightly higher level.
The signal of cAMP does not surpass that of the quencher TEAPB. This renders resolution
rather poor once more. Hence a stronger interaction of the viologen with APTS is conjectured
while a weaker interaction with the phosphates takes place. The response seems to be largly
independent of size and charge. It may be assumed, however, that cyclic phosphates require a
substantially longer time to coordinate TEAPB and thus no change of signal could be
recorded within the time-frame of the experiment. In any case, PQII makes up a rather
inconvenient sensing scheme due to its poor resolution and sensitivity. Although standard
deviation is mostly on a satisfying level, poor reproducibility is indicated in the case of ATP.
0 300 600 900 1200 1500 18000,70
0,75
0,80
0,85
0,90
0,95
1,00
1,05
HPTS HPTS_TEAPB HPTS_TEAPB_AMP HPTS_TEAPB_PP
i
I/I 0
(%)
t (s)
AMP
PPi
TEAPB
APTS
Fig. 9. Fluorescence intensity of AMP, cAMP and PPi in system PQII. The curve for cAMP is omitted due to virtually no response.

61
4.1.3 HPTS with TEABB as sensing design for the detection of ATP
and other phosphates
The potential of TEAPB as a fluorescent quencher of HPTS is depicted in Fig. 11. The
fluorescence intensity became stable after approximately 200 seconds and yielded a drop to
65%. PQI required the same period of time. The TEABB probe entails to stronger quenching
than TEAPB on HPTS. Both viologens differ in length of the alkyl chain only. Apparently a
longer spacer enables a better “embrace”, i.e. a stronger mode of binding is able to fix the
0,70
0,75
0,80
0,85
0,90
0,95
1,00
1,05
cAMP
AMPADP
ATP
TEAPB
APTS
I/I 0
Fig. 10. Response of ATP, ADP, (cAMP) and AMP on system PQII at 200 seconds including error bars. The low signal (of 77%) from TEAPB is increased. The response of cAMP is omitted here (see Fig. 9).

62
quencher/pyrene complex, to render it more stable and more efficient. Upon exposure to
phosphates, PQIII is expected to yield a rise in fluorescent intensity.
Phosphates in ATPase Reaction
ATP, ADP and Pi are displayed in Fig. 12. Contrary to PQI, ATP is not capable of releasing
most HPTS by interaction with the quencher. Pi impacts TEABB the most while it had no
substantial effect on TEAPB. Apparently electrostatic interaction was sufficient for reversing
quenching. Fluorescence intensity recovers to 80% of the level of the reference. A weaker
interaction takes place between ATP and TEABB. At 75% of the reference value,
fluorescence intensity is of intermediate magnitude. The signal for ADP rose to 70% of the
reference. Thus a clear distinction between the three phosphates involved can be drawn. Yet
resolution was poorer than in the case of TEAPB.
0 300 600 900 1200 1500 18000,60
0,65
0,70
0,75
0,80
0,85
0,90
0,95
1,00
1,05 HPTS TEABB
I/I0
(%)
t (s)
Fig. 11. Quenching of HPTS by TEABB. After 200 seconds the signal of HPTS and TEABB is sufficiently constant and yields a quenching by roughly 35%. The fluorescence intensity of mere HPTS (solid) remains at 100%.

63
Guanosine Phosphates
Guanine carrying nucleotides constitute the next group of phosphates investigated. Their
response is depicted in Fig. 13. The signal is recovered to over 90% of the reference in the
case of GDP. Hence, the strongest interaction with TEABB takes place here. A notably lower
signal at 85% was recorded for cGMP. GTP and GMP slightly raise the fluorescence intensity
by 5% to a level of 70% of the reference. This is unexpected as both molecules are clearly
distinct. GMP is considerably smaller and it possesses fewer phosphate groups as opposed to
GTP. Hence a difference in size and charge needs to be taken into account. Yet their response,
and thus their capability of impacting TEABB, is of similar order. Despite the fact that GMP
and GTP cannot be clearly distinguished, the response of PQIII to the guanine carrying
phosphates offers good resolution. Thus this sensing scheme is well suited for probing
0 300 600 900 1200 1500 18000,60
0,65
0,70
0,75
0,80
0,85
0,90
0,95
1,00
1,05
HPTS HPTS_TEABB_ATP HPTS_TEABB HPTS_TEABB_P
i
HPTS_TEABB_ADPI/I
0 (
%)
t (s)
HPTS
Pi
ATP
ADP
TEABB
Fig. 12. Effect of ATP, ADP and Pi on system PQIII. The low signal at 65% from TEAPB is increased. After 300 seconds the interaction of the phosphates is strong enough to release HPTS. Quenching by TEAPB is decreased and causes a rise in fluorescence intensity.

64
guanosine phosphates and the investigation of enzymes that produce and/or consume such
species.
AMP, cAMP and PPi
The response of AMP, cAMP and PPi is depicted in Fig. 14. A clear distinction between the
three phosphates involved can be drawn. Fluorescence intensity recovers to a level of nearly
80% when PPi is present. The signal for AMP is of intermediate magnitude at 75%. cAMP
has the least impact on TEABB, hence the signal only rises to 85% of the reference.
0 300 600 900 1200 1500 18000,55
0,60
0,65
0,70
0,75
0,80
0,85
0,90
0,95
1,00
1,05
TEABB
HPTS HPTS_TEABB HPTS_TEABB_GTP HPTS_TEABB_GDP HPTS_TEABB_GMP HPTS_TEABB_cGMP
I/I 0
(%)
t (s)
GDP
cGMP
GMP
GTP
HPTS
Fig. 13. Effect of GTP, GDP, GMP and cGMP on the quenching of HPTS by TEAPB. The low signal at 65% from TEAPB is increased. After 300 seconds the interaction of the phosphates is sufficiently strong enough to release most HPTS. Quenching by TEAPB is decreased and causes a rise in fluorescence intensity.

65
Adenosine Phosphates
Curves for all adenosine phosphates are plotted in Fig. 15 after exposure to PQIII. A
distinction can be drawn albeit to a lesser degree. The response of ATP and AMP converges
to virtually the same level though. Resolution and reproducibility (see error bars) are poorer
than in PQI. This observation confirms the initial observation that TEABB and HPTS are
more inclined to form complexes than TEAPB and HPTS. Thus phosphates can only free a
smaller amount of pyrene. Poor resolution and a slower response can be explained on the
same basis as well.
0 300 600 900 1200 1500 1800
0,55
0,60
0,65
0,70
0,75
0,80
0,85
0,90
0,95
1,00
1,05
HPTS
cAMP
AMP
PPi
TEABB
HPTS HPTS_TEABB HPTS_TEABB_AMP HPTS_TEABB_cAMP HPTS_TEABB_PP
i
I/I 0
(%)
t (s)
Fig. 14. Effect of AMP, cAMP and PPi on the quenching of HPTS by TEABB is depicted here. The low signal at 65% caused by TEABB is increased. After 300 seconds the interaction of the phosphates is strong enough to release HPTS. Quenching by TEABB is decreased and causes to a rise in fluorescence intensity.

66
Calibration for ATPase reaction
ATPase decomposes ATP to ADP and Pi releasing energy (see Introduction, Scheme 1).
Accordingly, calibration curves were recorded (Fig. 16). The concentration of ADP equalled
that of Pi as for one consumed molecule of ATP one molecule of ADP and one of Pi is
generated. The concentration of ATP was determined by subtraction of the ADP
concentration from 20 µM. Poor resolution was achieved and no clear distinction of the
curves was possible at a concentration of ATP below 17.5 µM. Accordingly, this sensing
scheme cannot be applied to monitoring ATPase activity.
45
50
55
60
65
70
75
80
85
90
95
100
105
cAM
PAM
PADP
ATP
TEABB
HPTS
I/I 0
(%)
Fig. 15. Changes caused by ATP, ADP, AMP, and cAMP in system PQIII at 350 seconds. Upon addition of phosphates the fluorescence intensity recovers from the low level of 65%.

67
4.1.4 APTS with TEABB as sensing design for the detection of ATP
and other phosphates
Fig. 17 yields the potential of TEABB on APTS as a quencher. The fluorescence intensity
became stable after 300 seconds and dropped to 70%. Upon the addition of phosphates a
reverse effect, i.e. a recovery of fluorescence was expected and subsequently studied.
0 200 400 600 800 1000 1200 1400 1600 180060
65
70
75
80
85
90
95
100
105
HPTS TEABB +10 µM ATP, + 5 µM ADP/P +12.5 µM ATP, + 7.5 µM ADP/P +15 µM ATP, + 5 µM ADP/P +17.5 µM ATP, + 2.5 µM ADP/P
I/I 0
(%
)
t (s)
Fig. 16 Calibration plot of PQIII for ATPase reaction. Upon the addition of more than one phosphate simultaneously the curves cannot be sufficiently discriminated.

68
Phosphates in ATPase Reaction
The response of ATP, ADP and Pi in PQIV are displayed in Fig. 18. Fluorescence of APTS
does not retrieve the level without TEABB for any adensine. A like observation could be
made in the case of HPTS. ATP exercises the strongest influence on the viologen in PQ III
and PQIV. Contrary to HPTS, a great deal of fluorescence intensity is recovered here as a rise
to 85% of the reference is recorded. This confirms the behaviour observed in PQI and PQII
that ATP yields the highest signal in this sensing scheme. Thus a better match between
TEABB and ATP is presumed, both electrostatically and through - interactions, as
fluorescence intensity rises to a relatively higher lever compared to the previous quencher.
0 300 600 900 1200 1500 18000,60
0,65
0,70
0,75
0,80
0,85
0,90
0,95
1,00
1,05 APTS TEABB
I/I 0
t (s)
Fig. 17. Quenching of APTS by TEABB. The fluorescence intensity of APTS alone (solid) remains at 100%. The signal of APTS and TEAPB is sufficiently constant after 300 seconds and yields a quenching by over 30%.

69
Apparently a weaker interaction takes place between ADP and TEABB and fluorescence
intensity is of a low magnitude at below 75%. The signal for Pi lies at 75% of the reference. A
better resolution and clearer discrimination was expected as phosphate and ADP are distinct
due to the lack of a sugar and aromatic base of the former. A considerable difference in size
needs to be taken into account as well.
Therefore this system is not suitable for monitoring the decomposition of ATP into ADP and
phosphate by ATPase owing to poor discrimination of these three phosphates.
0 300 600 900 1200 1500 18000,60
0,65
0,70
0,75
0,80
0,85
0,90
0,95
1,00
1,05
APTS APTS_TEABB_ATP APTS_TEABB APTS_TEABB_ADP APTS_TEABB_P
i
I/I 0
(%
)
t (s)
ATP
Pi
ADP
APTS
TEABB
Fig. 18. Effect of ATP, ADP and Pi on system PQIV. After 300 seconds the interaction of the phosphates is strong enough to release APTS and the low signal at 70% from TEABB is increased. Quenching by TEAPB is decreased and caused to a rise in fluorescence intensity.

70
Guanosine Phosphates
The response of guanine carrying nucleotides in PQIV is depicted in Fig. 19. The strongest
interaction with TEABB is recorded in the case of GMP. The signal is recovered to over
almost 85% of the reference. A notably lower signal at 80% was recorded for cGMP. GTP
and GDP slightly raise the fluorescence intensity by 5% to a level of above 70% of the
reference. Although resolution is not sufficient, discrimination of the species is possible. This
is reasonable as both molecules differ only slightly in terms of the number of the phosphate
groups. Despite the fact that GDP and GTP can only be somewhat distinguished, the response
of the guanine carrying phosphates features good resolution.
0 300 600 900 1200 1500 18000,60
0,65
0,70
0,75
0,80
0,85
0,90
0,95
1,00
1,05
APTS APTS_TEABB APTS_TEABB_GTP APTS_TEABB_GDP APTS_TEABB_GMP APTS_TEABB_cGMP
I/I 0
(%)
t (s)
GMP
cGMP
GDPGTP
TEABB
APTS
Fig. 19. Effect of GTP, GDP, GMP and cGMP in system PQIV is depicted here. The low signal at 70% caused by the quencher TEABB is increased. After 300 seconds the signals became constant for the most part. Upon the addition of phosphates, quenching of TEABB is decreased and causes a rise in fluorescence intensity.

71
AMP, cAMP and PPi
The response of AMP, cAMP and PPi is depicted in Fig. 20. A clear distinction cannot be
drawn between the three phosphates involved. Fluorescence intensity recovers to a level of
80% when PPi and cAMP are present. The signal for AMP is of intermediate magnitude at
72%. A similar behaviour was observed in PQII (see above).
Adenosine Phosphates
Fig. 21 puts on display the effects of all adenine phosphates on the fluorescence intensity of
PQIV. Resolution surpasses that of PQIII. Yet the signals of ADP, AMP and TEABB are
close albeit on a tolerable level, i.e. a distinction can be drawn between all species, yet
0 300 600 900 1200 1500 18000,60
0,65
0,70
0,75
0,80
0,85
0,90
0,95
1,00
1,05
APTS APTS_TEABB APTS_TEABB_AMP APTS_TEABB_cAMP APTS_TEABB_PP
i
I/I 0
(%)
t (s)
AMP
TEABB
PPi
cAMP
APTS
Fig. 20. Effect of AMP, cAMP and PPi on the quenching of APTS by TEABB. The low signal at 67% from TEABB is increased. After 300 seconds the interaction of the phosphates is strong enough to release APTS. Quenching of TEABB is decreased and causes a rise in fluorescence intensity.
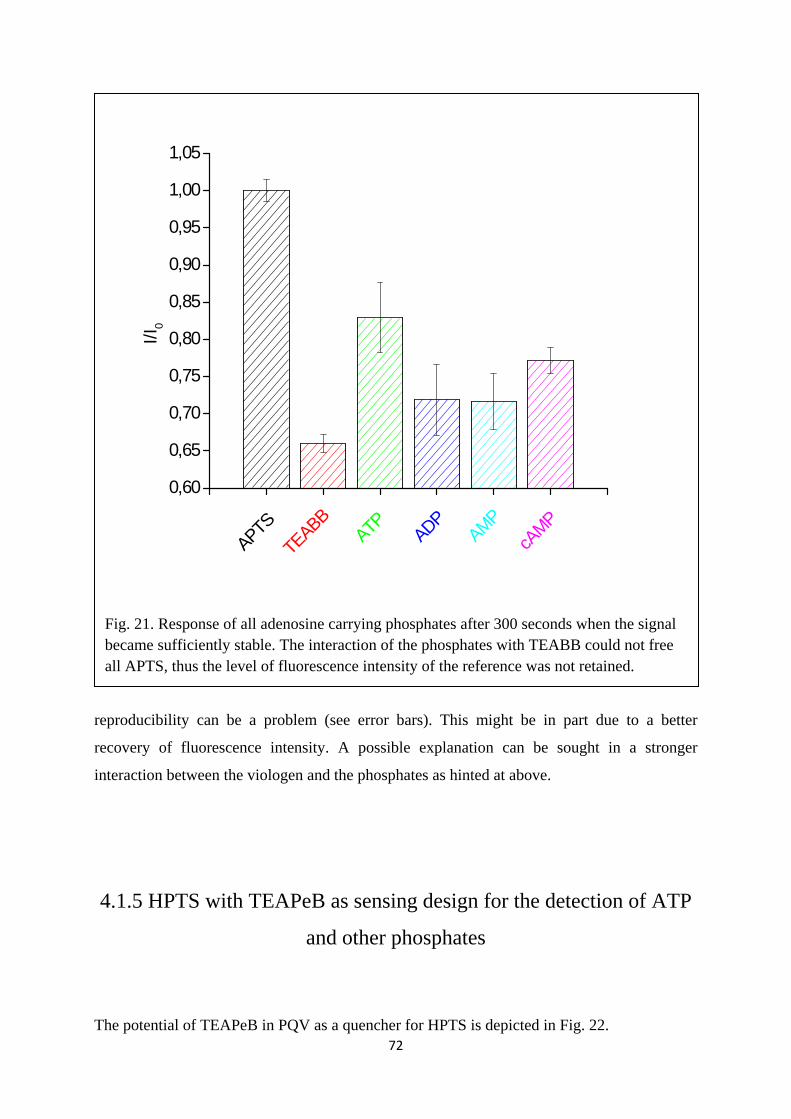
72
reproducibility can be a problem (see error bars). This might be in part due to a better
recovery of fluorescence intensity. A possible explanation can be sought in a stronger
interaction between the viologen and the phosphates as hinted at above.
4.1.5 HPTS with TEAPeB as sensing design for the detection of ATP
and other phosphates
The potential of TEAPeB in PQV as a quencher for HPTS is depicted in Fig. 22.
0,60
0,65
0,70
0,75
0,80
0,85
0,90
0,95
1,00
1,05
cAMP
AMPADP
ATP
TEABB
APTS
I/I 0
Fig. 21. Response of all adenosine carrying phosphates after 300 seconds when the signal became sufficiently stable. The interaction of the phosphates with TEABB could not free all APTS, thus the level of fluorescence intensity of the reference was not retained.

73
The signal needed over 350 seconds to become stable yielding a drop to 50%. This constitutes
the longest time frame required to conduct measurements, easily surpassing PQI-IV. Among
the viologens studied, TEAPeB possesses the longest (pentyl) spacer. Apparently this enables
a broader variety in orientation and 3 D structures that demand more time to align and interact
with HPTS and for the complex to reach equilibrium.
Phosphates in ATPase Reaction
Fluorescence intensity of PQV upon exposure to ATP, ADP and Pi is displayed in Fig. 23.
There is virtually no interaction between ATP and TEAPeB entailing to apparently no release
of HPTS. Hence the fluorescence intensity remains at the low level caused by the quenching
of TEAPeB. A substantially stronger interaction takes place between ADP/ Pi and TEAPeB
0 300 600 900 1200 1500 1800
0,40
0,45
0,50
0,90
0,95
1,00
1,05 HPTS HPTS_TEAPeB
I/I 0
(%
)
t (s)
Fig. 22. shows the fluorescence intensity of mere HPTS (solid) at 100% in PQV. Furthermore, the quenching of HPTS by TEAPeB is displayed here. After more than 350 seconds the signal became constant and a quenching by roughly 50% could be observed.

74
thus only some electron transfer from HPTS to the quencher is enabled. Hence fluorescence
intensity recovers to a level of 53% relatively quickly in the case of ADP while for Pi a longer
time is required. The fact that both of these phosphates had similar affect on TEAPEB is
rather surprising as both molecules are clearly distinct regarding the number of negative
charges and the fact that one carries a base and a sugar entailing to a big difference in size.
This observation, a rather inconvenient resolution with a relatively long response time renders
this system not suitable for application in monitoring ATPase activity for instance.
0 300 600 900 1200 1500 1800
0,40
0,45
0,50
0,95
1,00
1,05
HPTS_TEAPeB HPTS_TEAPeB_ATP HPTS HPTS_TEAPeB_P
i
HPTS_TEAPeB_ADPI/
I 0 (%
)
t (s)
HPTS
Pi
ADP
TEAPeB
Fig. 23. Effect of ATP, ADP and Pi on sensing scheme PQV (quenching of HPTS by TEAPeB). The low signal at approximately 47% from TEAPeB is increased, it became stable after 350 seconds. The curve of ATP is omitted as the response did not raise the fluorescence intensity. The other phosphates decrease the quenching by TEAPeB, entailing to a recovery of fluorescence intensity.

75
Guanosine Phosphates
The response of the guanine carrying nucleotides in PQV is depicted in Fig. 24. Results yield
that GTP behaves analogously to ATP. Yet, an intermediate signal was recorded in this
instance instead of the hardly detectable signal observed in the former case. The fact that GTP
does not occupy the top spot is in line with PQIII-IV. A recovery to 55% of the level of the
reference could be observed. GDP impacted PQV the most, with signal recovery to 67%. A
slightly lower signal was recorded for GMP. A bigger gap lies between this signal and that of
GTP. Furthermore, cGMP increases the response of TEAPeB to 50%. As previously noted, it
requires the longest time to free HPTS presumably due to its bulky 3 D structure. A clear
distinction between all phosphates can be drawn here, resolution is at a good level. Yet the
slow response time constitutes a big obstacle in utilizing this approach for monitoring enzyme
activity.
0 300 600 900 1200 1500 18000,35
0,40
0,45
0,50
0,55
0,60
0,95
1,00
1,05
HPTS HPTS_TEAPeB HPTS_TEAPeB_GTP HPTS_TEAPeB_GDP HPTS_TEAPeB_GMP HPTS_TEAPeB_cGMP
I/I 0
(%)
t (s)
HPTS
GDP
GMP
GTP
cGMP
TEAPeB
Fig. 24. Effect of GTP, GDP, GMP and cGMP on sensing scheme PQV. The low signal at 47% caused by TEAPeB is increased. After 350 seconds the interaction of the phosphates, especially GDP and GMP, is strong enough to release most HPTS. Quenching by TEAPeB is decreased, entailing to a rise in fluorescence intensity.

76
AMP, cAMP and PPi
The response of AMP, cAMP and PPi is depicted in Fig. 25. Fluorescence intensity recovers
to a level of 58% when AMP is present. The signal for cAMP is of intermediate magnitude at
54%. PPi impacts TEAPeB the least, hence the signal only rises to 51% of the reference. A
clear distinction between the three phosphates involved can be drawn. This corresponds to the
results obtained in PQI and PQIII. A slow response time for all species, however, needs to be
taken into account. Hence, PQV is disadvantageous for possible application in sensing.
Adenosine Phosphates
Fig. 26 reveals the response of all adenosine carrying phosphates. ATP seems not to be
capable of releasing any HPTS from TEAPeB as no rise in fluorescence intensity is
0 300 600 900 1200 1500 18000,35
0,40
0,45
0,50
0,55
0,95
1,00
1,05
HPTS HPTS_TEAPeB HPTS_TEAPeB_AMP HPTS_TEAPeB_cAMP HPTS_TEAPeB_PP
i
I/I 0
t (s)
HPTS
AMP
cAMP
PPi
TEAPeB
Fig. 25 AMP, cAMP and PPi being exposed to PQV. The low signal at 47% from TEAPB is increased. More than 350 seconds are required for the signal to reach a stable level. Quenching by TEAPeB is decreased and causes to a rise in fluorescence intensity.

77
recorded.This finding is quite surprising as all other adenosine species recover the signal at
least partially. The only difference lies in the phosphate chain. Sufficient interaction between
the pyrene and the aromatic andenosine base, as well as the cations, should take place.
Resolution seems satisfying but the singals of cAMP and PPi suffer from close proximity and
cannot be discriminated with confidence (error bars).
0,30
0,35
0,40
0,45
0,50
0,55
0,95
1,00
1,05
ATP ADPAMP
cAMP
TEAPeB
HPTS
I/I 0
(%
)
Fig. 26. shows the response in fluorescence intensity of all adenosine phosphates in PQV after 350 seconds. The curve for ATP was omitted as it virtually remained at the low level of the quencher TEAPeB at 47%. Error bars are included.

78
4.1.6 APTS combined with TEAPeB as sensing design for the
detection of ATP and other phosphates
The potential of TEAPeB in PQVI as a quencher is depicted in Fig. 27. The fluorescence
intensity became stable after 300 seconds and yielded a drop to 60%.
Phosphates in ATPase Reaction
ATPase catalyzes the decomposition of ATP into ADP and Pi. Upon the addition of these
phosphates, being subjected to PQVI, again a rise in fluorescence intensity from the low level
of the quencher is expected (Fig. 28) ATP retains the level of fluorescence intensity to just
0 300 600 900 1200 1500 1800
0,50
0,55
0,60
0,90
0,95
1,00
1,05 APTS APTS_TEAPeB
I/I 0
(%
)
t (s)
Fig. 27 Quenching of APTS by TEAPeB. The fluorescence intensity of mere HPTS (solid) remains at 100%. The signal of APTS and TEAPeB is constant after 350 seconds and yields a quenching by over 40%.

79
below 70% of the reference. This is parallel to the results obtained through PQI. The signal
for ADP is of intermediate magnitude at 65% while Pi only reaches 60%. This order of
reactivity is not only in line with PQI but also with the assumption that molecules with an
aromatic compound (adenine) offer a broader variety of interactions (-, cation-) aside
from the electrostatic interactions that can be exercised by all phosphates. Contrary to PQI
(HPTS), the level of APTS could not be retained though. A clear distinction between all three
phosphates can be drawn. PQVI surpasses PQ III and PQV in that matter.
Guanosine Phosphates
Fig. 29 yields the response of the guanosine phosphates in PQVI. The fluorescence
0 300 600 900 1200 1500 1800
0,50
0,55
0,60
0,65
0,70
0,95
1,00
1,05
HPTS_TEAPeB HPTS_TEAPeB_Pi
HPTS HPTS_TEAPeB_ATP HPTS_TEAPeB_ADP
I/I 0
(%
)
t (s)
APTS
ATP
ADP
Pi
TEAPeB
Fig. 28. Response of ATP, ADP, and Pi upon exposure to system PQVI. After 300 second the signal became sufficiently stable. PQVI offers good resolution as all three phosphates can be well discriminated from the recovery of fluorescence intensity from the low level of TEAPeB.

80
intensity obtained for GMP and GTP stands at 63% of the level of the reference (APTS) each.
Thus discrimination is difficult, even more so considering the marginal rise in the signal as
well. GDP causes no substantial effect on TEAPeB as no recovery in fluorescence intensity
was recorded. cGMP, however, increases the signal to 70% of the reference. The number of
the phosphate groups constitutes the only feature by which GTP, GDP, and GMP are distinct.
Thus it can be argued that they should exercise a lesser impact on the viologen than cGMP.
Additionally to a difference in distribution and nature of charge, the latter possesses a very
bulky structure compared to the other phosphates.
AMP, cAMP, and PPi
Fig. 30 depicts the response of AMP, cAMP, and PPi in PQVI. Despite the different structure,
0 300 600 900 1200 1500 1800
0,50
0,55
0,60
0,65
0,70
0,95
1,00
1,05
APTS APTS_TEAPeB APTS_TEAPeB_GTP APTS_TEAPeB_GDP APTS_TEAPeB_GMP APTS_TEAPeB_cGMP
I/I 0
(%
)
t (s)
APTS
GDP
GMP
TEAPeBGTP
cGMP
Fig. 29. Overview of the guanosine phosphates investigated via PQVI. After 300 second the signal became sufficiently stable. GDP is not capable of recovering fluorescence intensity of the low level stemming from the quenching by TEAPeB.

81
charge and the fact that PPi carries no base, resolution of the three species is rather poor. The
signal for AMP barely exceeds that of PQVI without phosphates. PPi and cAMP settle at
roughly 65% each.
Adenosine Phosphates
Fig. 31 depicts the response of all adenosine phosphates being exposed to PQVI. A
distinction between all phosphates involved can be drawn to some extent. Standard deviation
(error bars) is somewhat acceptable but needs to be taken into account as well. Only cAMP
and ADP yield like signals. This fact is again surprising considering the difference in size,
structure and charge of these species.
0 300 600 900 1200 1500 1800
0,50
0,55
0,60
0,65
0,95
1,00
1,05
TEAPeB
APTS APTS_TEAPeB APTS_TEAPeB_AMP APTS_TEAPeB_cAMP APTS_TEAPeB_PP
iI/
I 0 (%
)
t (s)
cAMP
APTS
AMP
PPi
Fig. 30. PQVI exposed to AMP, cAMP, and PPi: Fluorsecence intensity is partly recovered from below 60%. AMP yields a rather small signal. PQVI suffers from poor resolution though.
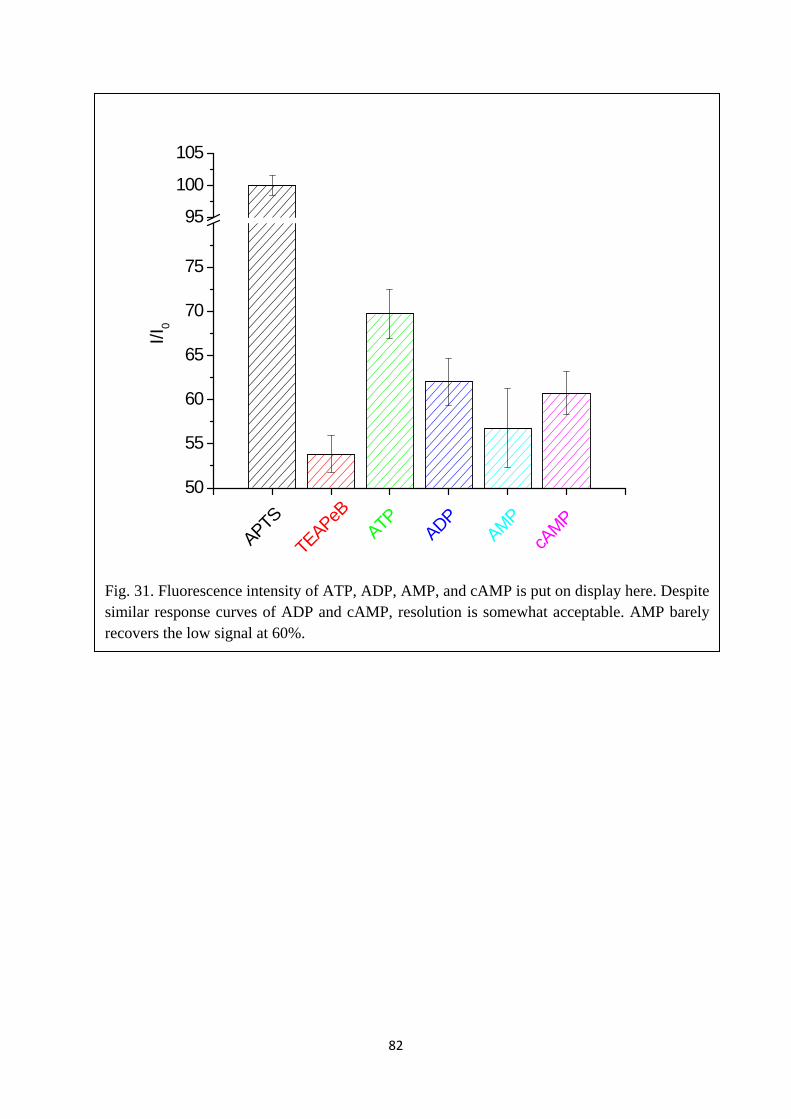
82
50
55
60
65
70
75
95
100
105
cAM
PAM
PADP
ATP
TEAPeB
APTS
I/I 0
Fig. 31. Fluorescence intensity of ATP, ADP, AMP, and cAMP is put on display here. Despite similar response curves of ADP and cAMP, resolution is somewhat acceptable. AMP barely recovers the low signal at 60%.

83
4.1.1 Summary
In this chapter, the results from the investigations of the sensing designs PQI-VI upon
treatment with various phosphates are summarized and compared regarding selectivity,
resolution, and response time. In all experiments, the pyrenes were combined with the
viologens first, thus forming PQI-VI according to Table1 in section 1.3. The quenching
efficiency of the diverse viologens varied from 20% to 50%. It is summarized in Table 1.
All experiments were carried out in TRIS buffer at pH 7.8 (see 1.2.3). This entails to an
almost complete deprotonation of the hydroxyl group of HPTS. Hence the viologens TEAPB,
TEABB, and TEAPeB can interact in two ways with it. Their positive charges are subjected to
electrostatic attraction and cation- interactions. Additionally, the aromatic part of the
viologen can form -stacks with the pyrene group (see 2.1, 2.2). While pH impacts HPTS
considerably, no change in the spectroscopic properties of APTS could be recorded, safe for
harsh acidic conditions. This limits the scope of possible modes of binding with the viologens
Table 1 Sensing designs PQI-VI, their response time and quenching of the luminescence of HPTS and APTS (I0) is listed here. Response time ranges between 0 and more than 350 seconds while quenching can be achieved from a minimum of 20% to a maximum of 50%.
Pyrene Viologen Notation Response time Quenching 100-
(I/I0*100)
HPTS TEAPB PQI 200 s 20%
HPTS TEABB PQIII 200 s 35%
HPTS TEAPeB PQV >350 s 50%
APTS TEAPB PQII 0 s 25%
APTS TEABB PQIV 300 s 30%
APTS TEAPeB PQVI 300 s 40%

84
to cation- interactions and -stacks with the pyrene group (see section 1.1). This corresponds
to the observation that TEAPB exercises a stronger quenching effect in PQI than in PQII and
so forth for all quenchers in PQIII-IV.
Apparently a longer alkyl chain causes to a more efficient quenching, especially in PQV
and PQVI. This is most probably due to more intimate interactions between the pyrenes and
the viologens. Hence it can be conjectured that a longer spacer (e.g. TEAPeB) enables more
effective binding. This is most probably due to a more effective separation - therefore a longer
distance - between the positive charges on the quaternary nitrogen atoms on the periphery and
those being situated on the rings. Thus the orientation of the 3 D structure of the quencher is
less restricted (see section 1.3). Moreover, response time increases with the length of the alkyl
chain. It can be surmised in this case as well, that a longer chain enables more possible
orientations (i.e. higher degree of freedom of mobility) of the viologens. Thus a longer time is
required for the equilibrium to become set.
The sensing designs PQI-VI strongly vary in their capabilities of discriminating
between the different phosphate species that were examined in this work. Tables 2-4 give an
overview of the results.
There are two cases that need to be taken into account in order to explain and assess the
deviations and differences between the three quenchers: first, the ability of the viologens to
interact with the pyrenes. That has been discussed above. Second, the different kinds of
phosphates can impact the quenchers in various ways. As has been hinted at previously (1.3),
there are three criteria for distinction of the phosphates investigated above: charge (and
number thereof), size and 3 D structure, type of base. Moreover, the pyrenes might not only
be quenched by the viologens. Nucleic bases can also form - interactions with pyrene as
well and thus decrease fluorescence intensity.
Table 2 lists the response of PQI and PQII upon the addition of numerous phosphates.
Despite the sometimes relatively long response time, a delay time of 200 seconds was
sufficent to distinguish the phosphates involved. Pi and cyclic phosphates have been identified
as species that require a substantially longer time periods in order for their response to
become stable. An explanation can be sought in the form of the bulky structure of for instance
cAMP. Phosphate on the other hand is less steric demanding. Yet it can undergo a series of
acid base reaction. Due to its basic nature it will deprotonate all species with an acidic group.

85
An equilibrium will be eventually formed of H3PO4/H2PO4-/HPO4
2-/PO43-. Thus many
reactions are possible that will delay the binding of phosphate with the viologens.
Most observations show the same trend for PQI and PQII. Differences in intensity and
other deviations have been discussed above. PQI offers a better sensitivity, resolution, and all
phosphates yield a signal above the level of PQI without analyte. Thus it is well suited for the
sensing of phosphates. PQII on the other hand is less expedient to apply.

86
Table 2 Response of PQI and PQII regarding different phosphate groups according to section 1.3
Notation Phosphate Group Phosphate Recovery Rate Response time
PQI ATPase reaction ATP 100% 200 s
ADP 92% 200 s
Pi 86% 600 s
Gunanines GTP 96% 200 s
GDP 86% 200 s
GMP 95% 200 s
cGMP 88% 450 s
AMP, cAMP, PPi AMP 85% 200 s
cAMP 96% 700 s
PPi 90% 200 s
Adenines ATP 100% 200 s
ADP 92% 200 s
AMP 85% 200 s
cAMP 96% 700 s
PQII ATPase reaction ATP 88% 200 s
ADP 85% 200 s
Pi 83% 700 s
Gunanines GTP 86% 200 s
GDP - -
GMP 81% 200 s
cGMP - -
AMP, cAMP, PPi AMP 85% 450 s
cAMP - -
PPi 83% 200 s
Adenines ATP 88% 200 s
ADP 85% 200 s
AMP 85% 450 s
cAMP - -

87
Table 3 Response of PQI and PQII regarding different phosphate groups according to section 1.3
Notation Phosphate Group Phosphate Recovery Rate Response time
PQIII ATPase reaction ATP 77% 450 s
ADP 73% 500 s
Pi 81% 200 s
Gunanines GTP 70% 200 s
GDP 92% 700 s
GMP 71% 200 s
cGMP 83% 700 s
AMP, cAMP, PPi AMP 76% 200 s
cAMP 71% 450 s
PPi 80% 200 s
Adenines ATP 77% 450 s
ADP 73% 500 s
AMP 76% 200 s
cAMP 71% 450 s
PQIV ATPase reaction ATP 86% 300 s
ADP 78% 300 s
Pi 76% 300 s
Gunanines GTP 75% 750 s
GDP 76% 300 s
GMP 84% 300 s
cGMP 81% 300 s
AMP, cAMP, PPi AMP 74% 300 s
cAMP 81% 300 s
PPi 81% 300 s
Adenines ATP 86% 300 s
ADP 78% 300 s
AMP 74% 300 s
cAMP 81% 300 s

88
Table 3 puts on display the response of PQIII and PQIV. In the former case, 200 seconds were
required in order to differentiate between all phosphate species that were investigated here,
while 300 seconds sufficed in the latter case. In PQIII, not only the bulky cAMP did require
longer time frames to become stable but also a number of other phosphates. PQIV yielded
only few such deviations.
As opposed to PQII, a response for all phosphates could be recorded in PQIV.
Resolution was at virtually the same level for both sensing designs. They are equally suited to
be harnessed for sensing phosphates. Yet PQI is much superior to them regarding resolution,
sensitivity, etc.
Table 4 depicts the response of PQV and PQVI upon being exposed to phosphates.
Again, phosphate and bulkier species required more time to yield a constant signal. Yet
evaluation could take place after 300 seconds in PQVI, while PQV demanded 350 seconds.
These long time frames are disadvantageous for the following reason. If such a sensing design
was to be applied to monitoring of enzyme activity a time of five minutes elapses before
detection can commence rendering this a rather inexpedient approach. Resolution for the
guanines is acceptable but rather poor for adenosines.
PQI and PQIII offer a fair resolution, relatively quick response time, and good
sensitivity. Thus they are well suited for monitoring enzyme activity, for instance, while the
other sensing designs suffer from drawbacks that disqualify them for such applications. PQI is
suitable for adenosines, while PQII is more convenient for guanosines. Cross-sensitivity
might be a problem. Hence reactions where only one phosphate species is present can ideally
be monitored. Further improvements are desirable in the field of reproducibility though.
Furthermore, LOD and dynamic range need to be validated. Thus far signals could be
obtained for concentrations of 1 µM or higher. Yet more experiments are required to confirm
these results, and to distinguish several different concentrations of the same phosphate
species.
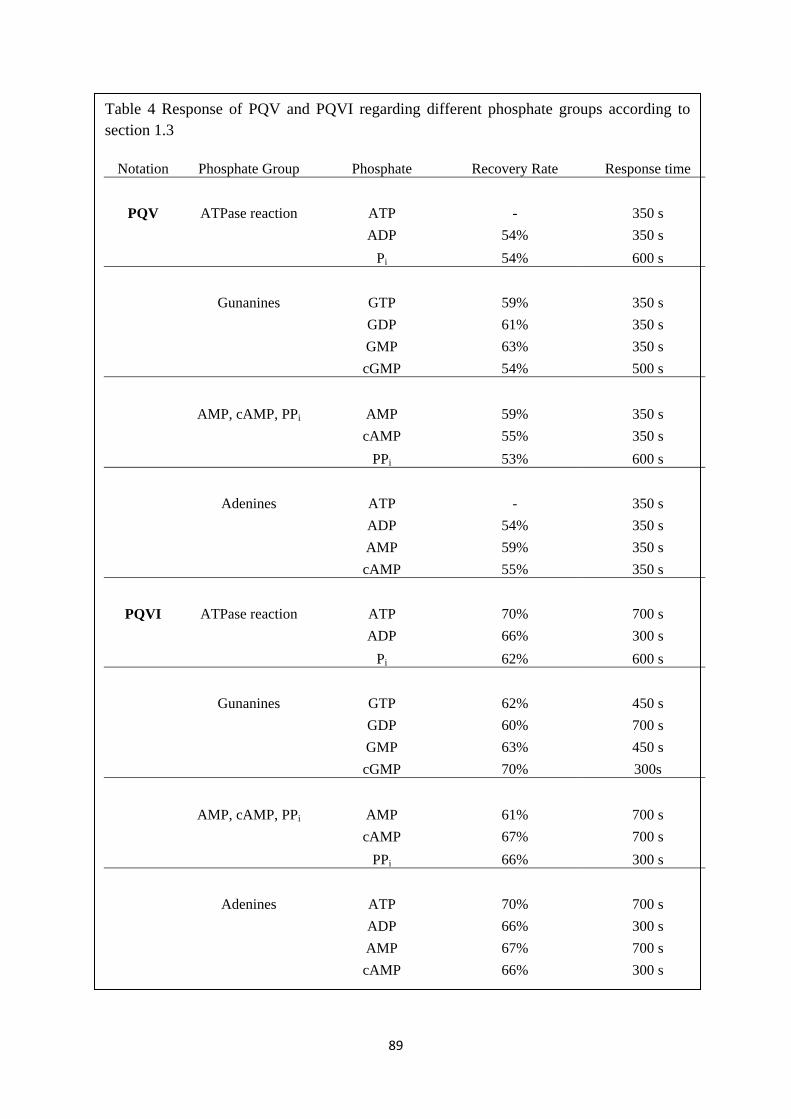
89
Table 4 Response of PQV and PQVI regarding different phosphate groups according to section 1.3
Notation Phosphate Group Phosphate Recovery Rate Response time
PQV ATPase reaction ATP - 350 s
ADP 54% 350 s
Pi 54% 600 s
Gunanines GTP 59% 350 s
GDP 61% 350 s
GMP 63% 350 s
cGMP 54% 500 s
AMP, cAMP, PPi AMP 59% 350 s
cAMP 55% 350 s
PPi 53% 600 s
Adenines ATP - 350 s
ADP 54% 350 s
AMP 59% 350 s
cAMP 55% 350 s
PQVI ATPase reaction ATP 70% 700 s
ADP 66% 300 s
Pi 62% 600 s
Gunanines GTP 62% 450 s
GDP 60% 700 s
GMP 63% 450 s
cGMP 70% 300s
AMP, cAMP, PPi AMP 61% 700 s
cAMP 67% 700 s
PPi 66% 300 s
Adenines ATP 70% 700 s
ADP 66% 300 s
AMP 67% 700 s
cAMP 66% 300 s

90
5. Cyanine-Type Probe for Phosphates
5.1 Results and Discussion
The spectroscopic properties of [Zn(FEW-L)] in the presence of various phosphates are
investigated in this chapter. Fluorescence intensity, excitation and emission spectra were
recorded in a quartz cuvette. The concentration of Zn2+ (5 µmol*L-1), FEW-L (1 µmol*L-1),
and phosphates (17.5 µmol*L-1) was constant in buffered aqueous solution (see 2.2). The ratio
Zn/FEW-L was optimized beforehand (see 2.3.3). For each sample, absorption at 670 nm and
emission at 740 nm were recorded. Fig. 1 displays these spectra for FEW-L.
625 650 675 700 725 750 7750
100
200
300
400
500Emission max 740 nm
FEW-L
[Zn(FEW-L)]
I (a
.u.)
(nm)
Absorption max 670 nm
FEW-L
[Zn(FEW-L)]
Fig 1 Absorption and emission spectra of FEW-L. The formation of [Zn(FEW-L)] diminishes intensity by 50% or 35% respectively.
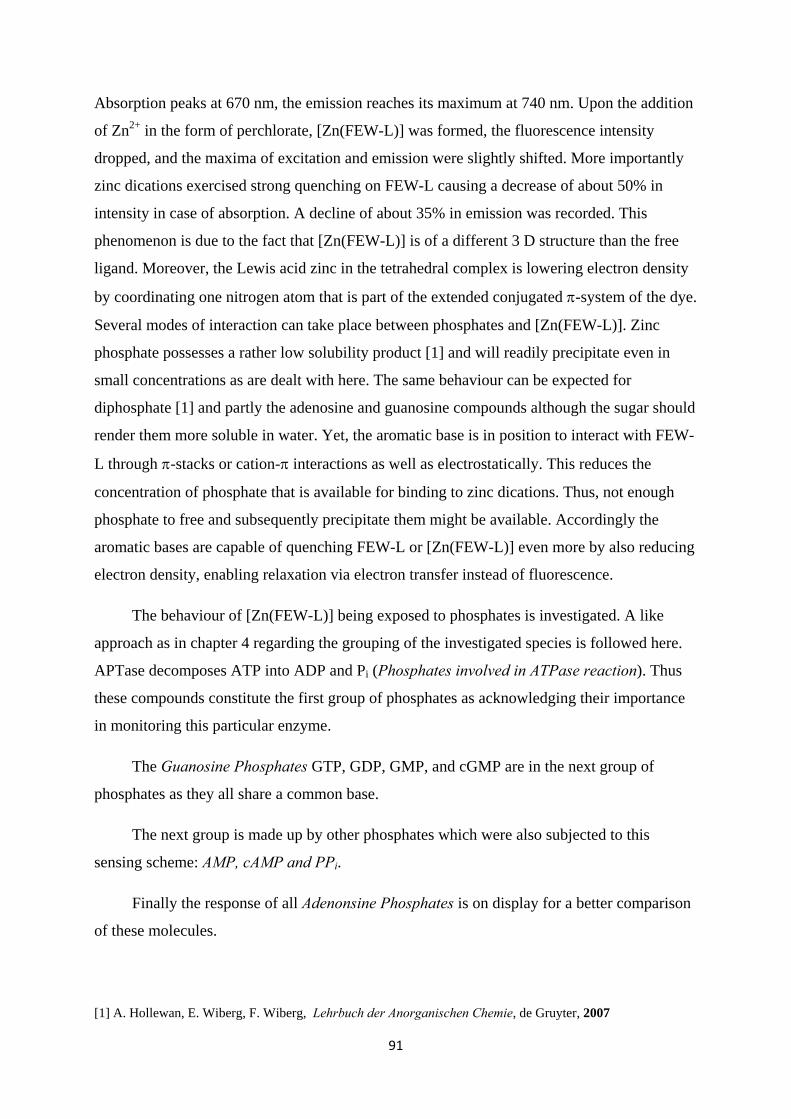
91
Absorption peaks at 670 nm, the emission reaches its maximum at 740 nm. Upon the addition
of Zn2+ in the form of perchlorate, [Zn(FEW-L)] was formed, the fluorescence intensity
dropped, and the maxima of excitation and emission were slightly shifted. More importantly
zinc dications exercised strong quenching on FEW-L causing a decrease of about 50% in
intensity in case of absorption. A decline of about 35% in emission was recorded. This
phenomenon is due to the fact that [Zn(FEW-L)] is of a different 3 D structure than the free
ligand. Moreover, the Lewis acid zinc in the tetrahedral complex is lowering electron density
by coordinating one nitrogen atom that is part of the extended conjugated -system of the dye.
Several modes of interaction can take place between phosphates and [Zn(FEW-L)]. Zinc
phosphate possesses a rather low solubility product [1] and will readily precipitate even in
small concentrations as are dealt with here. The same behaviour can be expected for
diphosphate [1] and partly the adenosine and guanosine compounds although the sugar should
render them more soluble in water. Yet, the aromatic base is in position to interact with FEW-
L through -stacks or cation- interactions as well as electrostatically. This reduces the
concentration of phosphate that is available for binding to zinc dications. Thus, not enough
phosphate to free and subsequently precipitate them might be available. Accordingly the
aromatic bases are capable of quenching FEW-L or [Zn(FEW-L)] even more by also reducing
electron density, enabling relaxation via electron transfer instead of fluorescence.
The behaviour of [Zn(FEW-L)] being exposed to phosphates is investigated. A like
approach as in chapter 4 regarding the grouping of the investigated species is followed here.
APTase decomposes ATP into ADP and Pi (Phosphates involved in ATPase reaction). Thus
these compounds constitute the first group of phosphates as acknowledging their importance
in monitoring this particular enzyme.
The Guanosine Phosphates GTP, GDP, GMP, and cGMP are in the next group of
phosphates as they all share a common base.
The next group is made up by other phosphates which were also subjected to this
sensing scheme: AMP, cAMP and PPi.
Finally the response of all Adenonsine Phosphates is on display for a better comparison
of these molecules.
[1] A. Hollewan, E. Wiberg, F. Wiberg, Lehrbuch der Anorganischen Chemie, de Gruyter, 2007

92
5.1.1 [Zn(FEW-L)]: Absorption-Based sensing of ATP and other
phosphate species
Phosphates in ATPase Reaction
Fig. 2 reveals the absorption spectrum of [Zn(FEW-L)] being exposed to ATP, ADP
and Pi. The complex [Zn(FEW-L)] yields a intensity of 50% of the reference FEW-L only. Pi
enhances the signal, according to the assumptions lined out above. Intensity is even
surpassing that of the FEW-L. A possible explanation can be sought in the form of an increase
in pH. A concentration of roughly 14 µmol*L-1 Pi remains in solution if it is assumed that
600 620 640 660 680 7000
50
100
150
200
250
300
350
400 FEW-L + Zn + ADP + ATP + P
i
I (a
.u.)
(nm)
Absorption
FEW-L
Pi
[Zn(FEW-L)]
ATP
ADP
Fig. 2. Absorption spectra of the phosphate probe upon exposure to ATP, ADP, and Pi. Intensity (I, in arbitrary units) of [Zn(FEW-L)] reaches only 50% of the level of FEW-L. The adenosine phosphates contribute to further quenching of the complex. Pi releases Zn2+ and is apparently able to increase intensity.

93
Zn2+, in the form of Zn3(PO4)2, will precipitate completely. This equals a pH of above 10. The
buffer contains TRIS at 24 mmol*L-1, a concentration overwhelmingly higher than 14
µmol*L-1. Yet it should exercise a considerable impact on pH as it was adjusted to pH 7.8 by
HCl prior to all experiments. Thus a rise in pH can be observed lowering the rate of
protonation on the secondary amino group or any basic moiety of FEW-L notably.
ATP exercises an additional quenching effect on [Zn(FEW-L)] and reduces the signal to
below 25%. A further decrease can be observed in the case of ADP that lowers the response
to roughly 10%. As was surmised above, this is most likely due to interaction of the aromatic
base and the conjugated -system of the FEW dye, opening electron transfer as an alternative
pathway to relaxation.
A clear distinction can be drawn between all phosphates involved. Thus this probe is
well suited for application in the monitoring of ATPase, for instance, considering the good
resolution. It might even be more advantageous that the sensing scheme based on viologens
(see 2.2) as Pi only enhances intensity while all phosphate species inhibit the bipyridinium
quenchers to a certain degree.
Guanosine Phosphates
Fig. 3 yields the response of all guanine carrying phosphates. GDP is decreasing the low
signal of [Zn(FEW-L)] to 10% of the level of FEW-L. All other guanosine phosphates raise
absorption intensity again. Addition of cGMP entails to a recovery of the signal to about55%.
In the case of GMP, a response of around 63% of FEW-L could be recorded. The signal for
GTP recovered at about 66%. Only GDP exercised a quenching effect on the probe, this
deviates from the behaviour of the adenosine phosphates investigated so far. Previously, a rise
in fluorescence intensity could be recorded for Pi only.
It seems reasonable that cGMP, GMP, and GTP should exhibit a response in that
particular order, regardless of the nature of the reaction or mode of interaction with [Zn(FEW-
L)]. This is due to the bulky structure of cyclic phosphates, while the others only differ in
length of phosphate groups, and thus in number of negative charges and size. Accordingly a
weaker interaction takes place in the former case, an increasingly better one in the latter case.
Surprisingly, the behaviour of GMP and GTP cannot be extrapolated to GDP although its
only element of distinction lies in the length of the phosphate chain.

94
All guanosines can be distinguished albeit on a smaller scale as in the case of the ATP, ADP
and Pi.
AMP, cAMP and PPi
Fig. 4 shows the response of AMP, cAMP and PPi. PPi recovers absorption intensity. Similar
results were obtained for Pi. The signal of PPi, however, does not exceed that of FEW-L. It
reaches 60% only. Diphosphoric acid is a stronger acid than phosphoric acid. The fourth
hydroxyl group features a pKa of 9.25 while HPO42- is of a pKa of 12.32 [1]. Thus PPi is less
acidic by a factor of 1,000. Obviously a much lesser impact on pH is expected. Hence
intensity is not enhanced but recovered to a certain degree upon the addition of PPi.
[1] A. Hollemann, E. Wiberg, F. Wiberg, Lehrbuch der Anorganischen Chemie, de Gruyter, 2007
600 620 640 660 680 7000
50
100
150
200
250
300
350
[Zn(FEW-L)]
FEW-L + Zn + GMP + cGMP + GTP + GDP
AbsorptionI
(a.u
.)
(nm)
FEW-L
GDP
cGMP
GTPGMP
Fig. 3. Absorption spectra of FEW-L, and [Zn(FEW-L)] upon exposure to guanosine phosphates. All species can be distinguished on a good level.

95
AMP decreases the response of [Zn(FEW-L)] by 15% to 35% of FEW-L. cAMP reduces the
signal to a mere 5%. Apparently it exercises the strongest impact on [Zn(FEW-L)] despite its
demanding structure.
Adenonsine Phosphates
Fig. 5 reveals the response of all adenosine phosphates. Decreasing absorption intensity can
be observed, from 35% in the case of AMP to 5% in the case of cAMP. All species can be
clearly distinguished. This behaviour corresponds well with theoretical concepts that a change
in charge and in size entails to a substantial change in signal intensity. Hence, [Zn(FEW-L)]
constitutes a convenient probe for phosphate sensing.
600 620 640 660 680 7000
50
100
150
200
250
300
350
[Zn(FEW-L)]
AbsorptionI
(a.u
.)
(nm)
FEW-L + Zn + PP
i
+ AMP + cAMP
AMP
cAMP
PPi
FEW-L
Fig. 4. Response of [Zn(FEW-L)] being exposed to AMP, cAMP and PPi. A like behaviour could be observed for the phosphates in the ATPase reaction section.
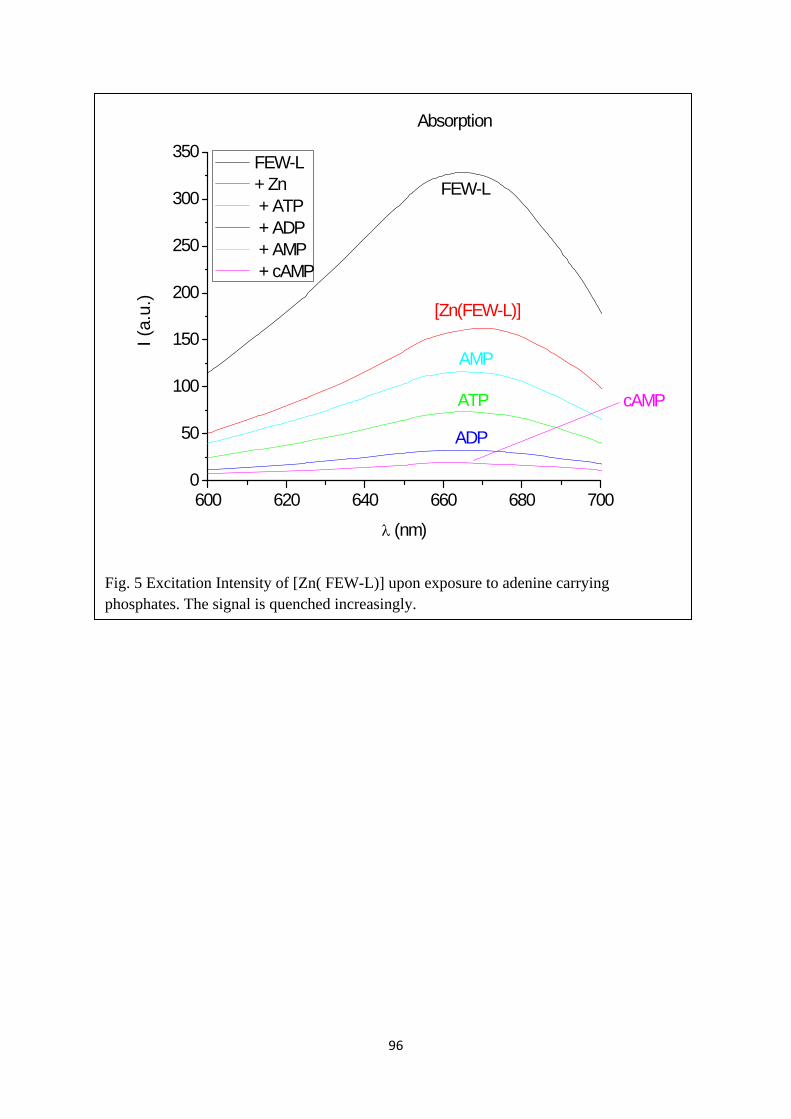
96
600 620 640 660 680 7000
50
100
150
200
250
300
350
[Zn(FEW-L)]
AbsorptionI
(a.u
.)
(nm)
FEW-L + Zn + ATP + ADP + AMP + cAMP
AMP
cAMP
ADP
FEW-L
ATP
Fig. 5 Excitation Intensity of [Zn( FEW-L)] upon exposure to adenine carrying phosphates. The signal is quenched increasingly.

97
5.1.2 [Zn(FEW-L)]: Emission-based sensing of ATP and other
phosphate species
Phosphates in ATPase Reaction
Fig. 8 reveals the emission spectrum of [Zn(FEW-L)] being exposed to ATP, ADP,
and Pi. [Zn(FEW-L)] quenches the fluorescence intensity of FEW-L by over 35%. ATP
reduces the signal even further to about 15%. ADP decreases fluorescence intensity to below
10%. A higher signal was recorded for Pi and [Zn(FEW-L)] than for FEW-L. This behaviour
is similar to that of the absorption and can be likewise explained. A good resolution could
also be observed.
700 720 740 760 780 8000
50
100
150
200
250
300
350
400
FEW-L
[Zn(FEW-L)]
I (a
.u.)
(nm)
FEW-L + Zn + ADP + ATP + P
i
Emission (exc 670)
Pi
ATP
ADP
Fig. 8. Fluorescence intensity of [Zn(FEW-L)] upon the addition of phosphates involved in the ATPase reaction. Pi increases fluorescence intensity while ATP and ADP decrease it. A like behaviour was observed for excitation.
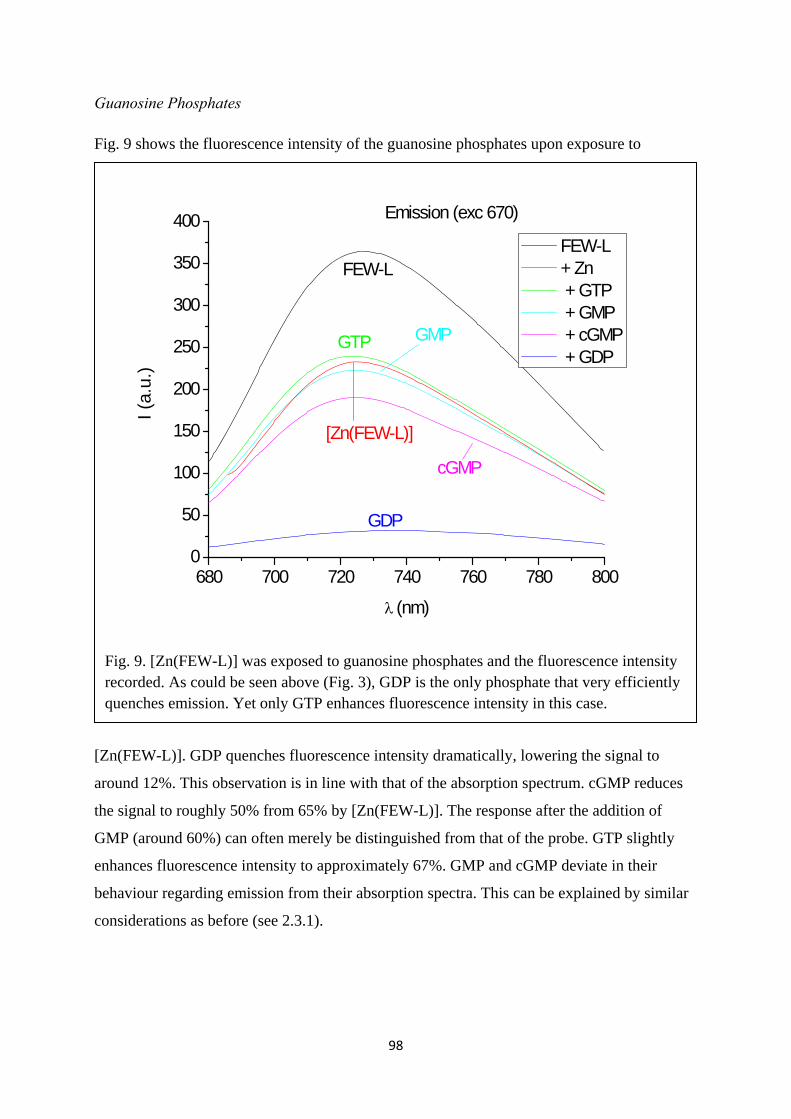
98
Guanosine Phosphates
Fig. 9 shows the fluorescence intensity of the guanosine phosphates upon exposure to
[Zn(FEW-L)]. GDP quenches fluorescence intensity dramatically, lowering the signal to
around 12%. This observation is in line with that of the absorption spectrum. cGMP reduces
the signal to roughly 50% from 65% by [Zn(FEW-L)]. The response after the addition of
GMP (around 60%) can often merely be distinguished from that of the probe. GTP slightly
enhances fluorescence intensity to approximately 67%. GMP and cGMP deviate in their
behaviour regarding emission from their absorption spectra. This can be explained by similar
considerations as before (see 2.3.1).
680 700 720 740 760 780 8000
50
100
150
200
250
300
350
400
[Zn(FEW-L)]
Emission (exc 670)
I (a
.u.)
(nm)
FEW-L + Zn + GTP + GMP + cGMP + GDP
cGMP
GDP
FEW-L
GTP GMP
Fig. 9. [Zn(FEW-L)] was exposed to guanosine phosphates and the fluorescence intensity recorded. As could be seen above (Fig. 3), GDP is the only phosphate that very efficiently quenches emission. Yet only GTP enhances fluorescence intensity in this case.

99
AMP, cAMP and PPi
Fig. 10 reveals the emission spectra of [Zn(FEW-L)] upon the addition of AMP, cAMP and
PPi. The adenosine phosphates quench the emission of the probe. Some increase in
fluorescence intensity (approximately 58%) occurs when PPi is added. A like behaviour was
attest to [Zn(FEW-L)] in the absorption spectra. AMP reduces the signal of FEW-L by
roughly 20% more than zinc. cAMP reduces fluorescence intensity to below 5%. Similar
considerations apply here as in section 2.3.1 for a possible explanation. A fair resolution could
be achieved as well.
680 700 720 740 760 780 8000
50
100
150
200
250
300
350
400
[Zn(FEW-L)]
Emission (exc 670)
I (a
.u.)
(nm)
FEW-L + Zn + AMP + cAMP + PP
i
FEW-L
AMP
cAMP
PPi
Fig. 10. displays the emission spectra of [Zn(FEW-L)] exposed to AMP, cAMP and PPi. AMP and cAMP quench the emission while a slight enhancement can be recorded in the case of PPi.

100
Adenosine Phosphates
Fig. 11 depicts the fluorescence intensity of [Zn(FEW-L)] being exposed to adenosine
phosphates. All species quench fluorescence intensity. A distinction can be drawn between all
phosphates, thus rendering this sensing design suitable for further applications in probing
phosphates.
700 720 740 760 780 8000
50
100
150
200
250
300
350
400
FEW-L
[Zn(FEW-L)]
I (a
.u.)
(nm)
FEW-L + Zn + ADP + ATP + AMP + cAMP
Emission (exc 670)
AMP
ATPADPcAMP
Fig. 11. reveals the response of [Zn(FEW-L)] upon the addition of adenosine phosphates. This sensing design offers a good discrimination of all species that were subjected to it.

101
5.1.3 [Zn(FEW-L)]: Optimization of composition of the complex
This section deals with the optimization of the composition, the ratio of Zn2+/FEW-L, in the
probe used herein. For this purpose the zinc content was varied and similar experiments as
lined out above were carried out. GDP, for instance, and adenosine phosphates were found to
quench [Zn(FEW-L)]. The fluorescence intensity of FEW-L is lowered upon the addition of
zinc cations. Thus it is reasonable to investigate whether the addition of a metal to form a
complex is essential for this sensing scheme. This was subsequently studied. Fig. 6 displays
the response of FEW-L being exposed to guanine phosphates. Resolution is much poorer than
for [Zn(FEW-L)] as probe. Furthermore, it was studied if a lower concentration of zinc ions
might suffice for this sensing scheme to be realized. Hence, a solution of 2.5 µmol*L-1 zinc
was used to form [Zn(FEW-L)] instead of 5 µmol*L-1. Fig. 7 offers a comparison of
600 620 640 660 680 70050
100
150
200
250
300
350
400Absorption
I (a
.u.)
(nm)
FEW-L + GTP + GDP + GMP + cGMP
GDP
FEW-L
GMP
GTP cGMP
Fig. 6. FEW-L as probe for guanosine phosphates. A distinction can be somehow drawn between the different species, yet it is surpassed by [Zn(FEW-L)].

102
[Zn(FEW-L)] prepared from different concentrations of zinc stock solution. A better
resolution can be achieved if the concentration of zinc stands at 5 µmol*L-1. A signal of
virtually the same intensity can be recorded for GTP and AMP. ATP can be discriminated,
though, albeit on a rather small scale. Hence, it is expedient to choose 5 µmol*L-1 zinc stock
solution to apply [Zn(FEW-L)] as a phosphate-sensitive probe.
700 720 740 760 780 800
50
100
150
200
250
300
350
400
Zn 2.5, AMP
Zn 2.5, GTP
AbsorptionI
(a.u
.)
(nm)
FEW-L + Zn 2,5 µM, GTP + Zn, GTP + Zn 2,5 µM, ATP + Zn, ATP + Zn 2,5 µM, AMP + Zn, AMP
FEW-L
GTP
Zn 2.5, ATP
AMP
ATP
Fig. 7. Comparison of [Zn(FEW-L)] prepared from 2.5 µM zinc stock solution and from 5.00 µM upon exposure to phosphates. Quenching (AMP, ATP) and increase of intensity (GTP) is diminished. A poor resolution can also be attested.

103
5.2 Summary
This chapter offers a summary of the results obtained from the investigation of [Zn(FEW-L)]
as a phosphate-sensitive probe. Table 1 lists the different phosphates that were probed herein
and their response. All adenines prompt signals that can clearly be distinguished from one
another. This is in line with theoretical considerations pertaining to their structure and number
of charge. While all species possess the same aromatic, nucleic base, they are distinct by their
size. Moreover, cAMP is rather sterically demanding, even more so than the already bulky
AMP, ADP, and ATP. The number of negative charges needs to be taken into account as well.
Thus many modes of binding to FEW-L are possible, i.e. electrostatically or through - or
cation- interaction. Yet free zinc cations and these in [Zn(FEW-L)] need to be considered as
well. Phosphates can precipitate zinc. The sugar and base should increase solubility though.
Thus the dominating factor is interaction with FEW-L and not that with zinc dications. While
all adenosines decrease intensity, Pi and PPi increase it. Pi is in position to precipitate
Zn3(PO4)2. A like behaviour can be expected of PPi. In both cases not enough zinc is available
to precipitate all phosphate. While PO43- will impact pH substantially, P2O7
4- will only be
capable of doing so by a much smaller degree as the pKa values differ by a factor of 1000.
Most guanines increase intensity while only GDP lowers it. The same considerations as for
the adenosines apply here, regarding structure etc. Yet interaction with zinc seems to be the
driving force here as the low signal from [Zn(FEW-L)] is recovered mostly.

104
Table 1 Change of Absorption of [Zn(FEW-L)] upon being exposed to these various phosphates. They are grouped according to the experiments from section 2.3.
Phosphate Intensity (a.u.) % of FEW-L
FEW-L - 328 0
[Zn(FEW-L)] - 164 50
ATPase reaction ATP 77 23
ADP 33 10
Pi 392 120
Gunanines GTP 222 68
GDP 31 9
GMP 206 63
cGMP 184 56
AMP, cAMP, PPi AMP 118 36
cAMP 20 6
PPi 200 61
Adenines ATP 77 23
ADP 33 10
AMP 118 36
cAMP 20 6

105
Table 2 lists the fluorescence intensity of all phosphates probed by [Zn(FEW-L)]. All
adenines cause a further quenching of the signal of the probe. Their response can clearly be
discriminated. The explanation for this behaviour is parallel to that offered for the absorption
spectra. PPi and Pi have been found to enhance fluorescence intensity. Again, this is due to a
change in pH and the solubility product, and thus precipitation, of these zinc phosphates. The
responses of the guanosine phosphates are also clearly distinct, for an explanation see above
(Table 1 and text).
It could be proved that [Zn(FEW-L)] is a convenient probe for numerous phosphates.
NIR probes hold advantages over other fluorescent probes. These include deep penetration of
tissue, non-destructive measurements, inexpensive set-ups among others. The [Zn(FEW-L)]
probe offers features most convenient for a sensing scheme, i.e. a good resolution and
sensitivity, up to 1 µM and below. Yet LOD needs to be validated. Thus [Zn(FEW-L)] can be
applied in probing phosphates and can possibly be used for monitoring enzyme activity. It
remains to be seen whether or not two or more phosphate species can be examined
simultaneously. Initial experiments have pointed in that direction though. Thus, further
studies should be carried out regarding limit of detection and reproducibility. Different
phosphate concentrations need to be probed which so far could not be discriminated.
Moreover interference from other metal ions needs to be taken into account.

106
Table 2 Intensity of Emission of [Zn(FEW-L)] upon being exposed to these various phosphates. They are grouped according to the experiments from section 2.3.
Phosphate Intensity (a.u.) % of FEW-L
FEW-L - 364 0
[Zn(FEW-L)] - 231 63
ATPase reaction ATP 54 15
ADP 35 10
Pi 405 111
Gunanines GTP 222 61
GDP 31 9
GMP 206 57
cGMP 184 51
AMP, cAMP, PPi AMP 118 32
cAMP 20 5
PPi 200 55
Adenines ATP 77 21
ADP 33 9
AMP 118 32
cAMP 20 5

107
6. Summary
6.1 English
Phosphate-sensitive probes have been synthesized and characterized. The focus was on the
(bio)phosphates ATP, ADP, AMP, cAMP, GTP, GDP, GMP, cGMP, Pi and PPi. One design
is utilizing the quenching of APTS or HPTS by viologen derivatives which is reversed upon
addition of phosphates. Three viologens were tested for their applicability. The compound
TEAPB in combination with HPTS yielded the most promising results. The probe allows for
discrimination between all phosphate species investigated. This analytical design offers good
resolution and sensitivity. It may be applied to monitoring enzyme activity, especially
enzymes dealing with adenosines (PQI) or guanosines (PQII). LOD is above 1µM. More
experiments and further characterization is required for future applications though. It is
disadvantageous for probing two phosphate species simultaneously.
The second detection scheme is based on a complex of zinc (2+) and a NIR dye FEW-L.
The probe [Zn(FEW-L)] is quenched by all phosphates (same species as above). Excitation
and emission spectra were recorded. In both cases all phosphates pertaining to possible
biological applications could be sensed. A good resolution coupled with good sensitivity
could be attested. Hence, this concept can be harnessed for future applications in monitoring
enzyme activity in general or ATPase in particular. It is most suitable for Pi and adenosines.
LOD is 1 µM and lower. Further characterization is needed in order to apply this sensing
scheme to the determination of enzyme activity. It remains to be seen if two or more
phosphate species can be probed simultaneously.

108
6.2 Deutsch
Phosphatsensitive Sonden wurden synthetisiert und charakterisiert. Der Fokus lag dabei auf
Biophosphaten ATP, ADP, AMP, cAMP, GTP, GDP, GMP, cGMP, Pi und PPi. Eine
Messanordnung macht sich das Quenchen von APTS oder HPTS durch Viologenderivate zu
nutzen welches bei Zugabe von Posphaten umgekehrt wird. Drei Viologene wurden auf ihre
Verwendbarkeit getestet. Die Verbindung TEAPB in Kombination mit HPTS lieferte die
vielversprechendsten Resultate. Die Sonde ermöglicht eine Unterscheidung zwischen allen
getesteten Phosphaten. Dieser analytische Aufbau bietet gute Auflösung und Sensitivität. Es
könnte möglicherweise dazu benutzt werden, Enzymaktivitäten zu verfolgen, besonders
solche Enzyme die mit Adenosinen (PQI) oder Guanosinen (PQII) zu tun haben. LOD ist
größer 1 µM. Mehr Experimente und eine weitere Charakterisierung sind für zukünftige
Anwendungen nötig. Es ist unvorteilhaft damit zwei Phosphatspezies gleichzeitig zu
detektieren.
Die zweite Messanordnung basiert auf einem Komplex aus Zink (+2) und einem NIR
Farbstoff FEW-L- Die Sonde [Zn(FEW-L)] wird von allen Phosphaten gequencht (die
gleichen wie oben wurden untersucht): Anregungs- und Emissionsspektren wurden
aufgenommen. In beiden Fällen konnten alle Phosphate die in biologischem Kontext wichtig
sind erkannt werden. Eine gute Auflösung zusammen mit einer guten Sensitivität konnte
attestiert werden. Deshalb kann dieses Konzept für zukünftige Anwendungen beim Verfolgen
von Enzymaktivität im Allgemeinen, oder ATPase im Besonderen, genutzt werden. Es ist am
besten geeignet für Pi und Adenosine. LOD ist 1 µM und kleiner. Weitere Charakterisierung
ist vonnöten um dieses Modell für die Bestimmung von Enzymaktivität zu nutzen. Es muß
noch gezeigt werden, ob zwei oder mehr Phosphatspezies nebeneinander bestimmt werden
können.

109
7. CURRICULUM VITAE
Personal Data
Name: Thomas Lang
Nationality: German
Date of birth: 17th June 1983
Education and Training
Sep 1989 – July 1993: Elemantary School Hirschau Jan 1993 – March 2002: Gregor-Mendel-Gymnasium Amberg
Oct 2003 – April 2009: University of Regensburg, Chemistry (diploma),
Nanostructured Surfaces for DNA Hybridisation
with V.M. Mirsky, O. S. Wolfbeis
May 2009 – May 2012: PhD at University of Regensburg, Institute of
Analytical Chemistry, Chemo- and Biosensors
Professional experience
Aug 1999 – Sep 2004: Three to six week stints at Depot of Amberger
Kaolinwerke, Eduard Kick GmbH & Co. KG
Aug 2005 – Sep 2007: Six week stints at Kaolin Refinement at Amberger
Kaolinwerke, Eduard Kick GmbH & Co. KG

110
21st - 28th of Jul 2011: Participation in Advanced Study Course on Optical
Sensors (ASCOS), Ireland
Languages German: native language
English: fluency
Latin: basic knowledge
Greek: basic knowledge

111
8. List of Publications
Journal Papers
I. R. Ali, T. Lang, S. M. Saleh, R. J. Meier, O. S. Wolfbeis, Optical Sensing Scheme for Carbon Dioxide Using a Solvatochromic Probe, Anal Chem, 2011, 83, 2846-2851
II. T. Lang, T. Hirsch, C. Fenzl, F. Brandl, O. S. Wolfbeis, Surface Plasmon Resonance Sensor for Dissolved and Gaseous Carbon Dioxide, submitted
III. C. Spangler, T. Lang, M. Schäferling, Spectral response of an Methylimidazolium-Derived Polythiophene to ATP and other Phosphates, Dyes and Pigments, accepted, available online ahead of print
IV. X. D. Wang, J. A. Stolwijk, T. Lang, R. J. Meier, J. Wegener, O. S. Wolfbeis, Ultra-Small, Highly Stable and Sensitive Dual Nanosensors for Measuring Intracellular Oxygen and pH Directly in Cytosol, in preparation
Poster Presentations
12th International Conference on Methods and Applications of Fluorescence: Spectroscopy, Imaging and Probes, September 2012, Straßburg, France: “ATP sensitive fluorescence based turn-on probe based on a pyrene-bipyridinium complex”
Oral Presentation
6th International Students Conference “Modern Analytical Chemistry”, September 2010, Prague, Czech Republic: “Luminescent ATPase Assay Using a Phosphate-sensitive Lanthanide Probe” (Print in Book of Abstracts)
6. Deutsches BioSensor Symposium, March/April 2009, Albert-Ludwigs-Universität, Freiburg, Germany: “A Technology of Molecular Tacking: A Control of Surface Density of Immobilized Oligonuleotides to Optimize Hybridization“ (Print in Book of Abstracts)

112
Erklärung
Hiermit versichere ich, daß ich die vorliegende Arbeit selbst verfaßt und keine anderen
Hilfsmittel und Quellen verwendet habe.
Regensburg, den 09.05.2012


![Gaussian Process Models - is.tuebingen.mpg.deis.tuebingen.mpg.de/fileadmin/user_upload/files/publications/ThesisMalte_[0].pdf · Zusammenfassung Die vorliegende Arbeit beschaftigt](https://static.fdocuments.us/doc/165x107/5d63094e88c993321a8ba56e/gaussian-process-models-is-0pdf-zusammenfassung-die-vorliegende-arbeit.jpg)


