New Farmers and Alternative Markets Within the … Farmers and Alternative Markets Within the Supply...
66
New Farmers and Alternative Markets Within the Supply- Managed System Metcalf Food Solutions FarmStart June 2010
Transcript of New Farmers and Alternative Markets Within the … Farmers and Alternative Markets Within the Supply...

New Farmers and Alternative Markets Within the Supply- Managed System
Metcalf Food Solutions
FarmStart
June 2010

Metcalf Foundation
The Metcalf Foundation helps Canadians imagine and build a just, healthy,
and creative society by supporting dynamic leaders who are strengthening their
communities, nurturing innovative approaches to persistent problems, and
encouraging dialogue and learning to inform action.
Authors
Lead authors from FarmStart include Christie Young and Melissa Watkins.
FarmStart is a not-for-profit organization that aims to encourage and support a
new generation of farmers to develop locally oriented, ecologically sound, and
economically viable enterprises. FarmStart provides new farmers with the
resources, tools, and support necessary to get their businesses off the ground
and to thrive.
The content of the paper was provided by the George Morris Centre, a Canada-
wide, not-for-profit charitable organization. As an independent think tank, the
Centre provides industry decision makers with information and analysis on
issues affecting the Canadian agri-products sector.
Acknowledgements
Thank you for the advice and feedback provided by the paper’s farmer review
committee. Thank you to Philippa Campsie for editing the paper.

New Farmers and Alternative Markets Within the Supply Managed System 3
Contents
Foreword .................................................................................................................. 4 Executive Summary ................................................................................................. 6 Introduction to Supply Management ...................................................................... 8
The Origins of Supply Management.................................................................... 9 How Supply Management Works........................................................................ 9
Growing Demand for Differentiation in Food Retailing and Food Products ........12 Consumer Segmentation: One Size Does Not Fit All .........................................12 Differentiation in Retailing.................................................................................13 Differentiated Food Products .............................................................................15
Organic products ............................................................................................16 Local food........................................................................................................ 17
A Trend, Not a Fad..............................................................................................19 Conventional and Alternative Production in Supply-Managed Products .............21
Production Costs for Generic Supply-Managed Products .................................21 Conventional broiler chicken production costs ............................................ 22 Conventional egg production costs ............................................................... 22 Conventional dairy production costs ............................................................ 23
Alternative Production....................................................................................... 24 Mixed operations: economies of scope ......................................................... 25 A lack of economies of size ............................................................................ 26 Differing costs of production......................................................................... 26 Greater marketing effort and customer interaction...................................... 27 Higher marketing risk ................................................................................... 28 Spin-off developments................................................................................... 28
The Price Difference between Conventional and Alternative Products ........... 28 Options for New Farmers and Alternative Markets within the
Supply-Managed System ................................................................................... 30 Increase Quota Exemption Levels ......................................................................31 Alternative Market Development .......................................................................31 Decrease Minimum Quota Holdings ................................................................. 32 Establish Specialty Market Quota ..................................................................... 33 Specialty Product Exemption ............................................................................ 34 Direct Marketing Exemption ............................................................................. 34 Target Specialty Markets in Allocating Processing ........................................... 34
Conclusion.............................................................................................................. 36 Appendix 1: Broiler Quota Exemption and Minimum Quota Requirements ....... 37 Appendix 2: Layer Quota Exemption and Minimum Quota Requirements......... 40 Appendix 3: Turkey Quota Exemption and Minimum Quota Requirements ...... 43 Appendix 4: Dairy Minimum Quota Requirements.............................................. 45 Appendix 5: New Entrant Programs for Supply-Managed Products ................... 46 Appendix 6: Demand for Organic Products .......................................................... 54 Appendix 7: Conventional Broiler Chicken Production Costs ...............................57 Appendix 8: Conventional Layer Production Costs .............................................. 59 Appendix 9: Conventional Dairy Production Costs ...............................................61 References .............................................................................................................. 63

New Farmers and Alternative Markets Within the Supply Managed System 4
Foreword
Food — how and where we grow, process, distribute, sell, and eat it — is a
fundamental human concern and central to the health of our communities,
economy, environment, and bodies. Food is elemental, yet the system we have
built around it is complex, rigid, and opaque.
There is growing concern that our current food system is not working well —
some would say it is broken. In Ontario, many farmers are facing an income
crisis. Too many people lack access to healthy food. And, despite growing
demand for local food, our centralized, large-scale food processors, distributors,
and retailers are unable to provide it.
Efforts to rebuild the local food supply chain and restructure Ontario’s food
and agriculture system have been building momentum in the last few years.
Ontario’s residents are expressing a burgeoning desire to create a food system
that is more sustainable, equitable, and economically viable.
For the past eight years, the Metcalf Foundation has been seeding and
supporting food- and agriculture-related initiatives across the province, from
agricultural land trusts to sustainable food certification, from new farm
incubators to low-income neighbourhood farmers’ markets, from diversified
forms of street food to new models for community food hubs.
Starting in 2007, we convened our funding partners who were working on the
supply and equitable distribution of local, sustainable food. We wanted to
explore the possibilities for cooperative, integrated efforts to transform Ontario’s
food and agriculture system. These gatherings led to the creation of Sustain
Ontario – the Alliance for Healthy Food and Farming which, after only one year
of operation, is already playing a central role in supporting the efforts of its
growing membership. The discussions also led to our publishing the paper Food
Connects Us All: Sustainable Local Food in Southern Ontario in February 2008,
which identified some of the barriers to a local, sustainable food system and the
many roads to change.
Building on that first paper, in 2009 we decided to focus on solutions, rather
than just the obstacles to progress. We have learned about innovators and
activists, academics and growers who are engaged in new ways of understanding
and engaging with food systems. Yet too little of this experimentation and
innovation has been entering the policy conversation. We issued a call for
proposals seeking tangible ways to advance a local, sustainable food system
agenda in Ontario over the next five to ten years.

New Farmers and Alternative Markets Within the Supply Managed System 5
The call inspired a strong response — and difficult choices for the Foundation.
We commissioned five papers, each authored collaboratively by NGOs,
academics, practitioners, and others representing a range of sectors and
perspectives. The papers are intended to be at once pragmatic and inspiring —
looking to craft responses that more meaningfully connect food to critical societal
issues such as health, urban sprawl, poverty and hunger, declining farm incomes,
and communities at risk.
We hope these papers will provide a platform for a more robust discussion of
the possibilities for food system reform in Ontario. But we also want to move
beyond discussion. Public interest, civil society engagement, academic focus, and
government awareness has never been higher on this issue. We want to stimulate
multi-sectoral cooperation in advancing credible, grounded solutions that can be
brought into action.
We recognize that there are multiple paths to change, and that innovation often
comes from bridging issues and sharing visions for the future. The Foundation
thanks the innovators whose ideas and actions are sowing a new vision for food
and farming in Ontario.
Sandy Houston, President
Metcalf Foundation

New Farmers and Alternative Markets Within the Supply Managed System 6
Executive Summary
The supply-management system for foods such as eggs, milk, and poultry was
created in the 1960s to correct a system in which processors and purchasers
were able to use their purchasing power to keep prices low at the expense of
producers. Supply-management organizations, under such names as the Ontario
Milk Marketing Board or the Egg Farmers of Ontario, act as intermediaries
between the producers of milk or eggs and the processors or retailers who
package, use, or sell those foods. They ensure that the farmers receive a fair
price for their products, and they carry out general marketing campaigns for
each type of food. They also regulate the supply of milk, eggs, or poultry by
setting quotas on the amount of each type of food that farmers may produce.
Regulating supply is a way of controlling the price of each food.
Supply management works well for conventional producers of these foods.
Most of these are farmers who specialize in one single kind of farming (dairy,
poultry, or eggs) and do it on a large scale. Farmers producing the same kinds of
food know they will all receive the same price for it; they do not have to worry
about finding customers, and they do not have to carry out their own individual
marketing campaigns. Farmers of supply-managed commodities have generally
had more consistent returns than those who are not subject to supply
management in Ontario, and this is a benefit of the system.
Supply management does not, however, work as well for those who engage in
non-conventional forms of farming and for new farmers. Non-conventional
farmers depend on their ability to differentiate themselves in the market, and
they do their own marketing to let customers know about what they do
differently. They do not benefit from economies of scale to the same degree, and
they cannot justify the market price for quota given the production methods they
use. Many of them sell their products through alternative markets, such as
farmers’ markets, farm shops, or Community Shared Agriculture (CSA). New
farmers, on the whole, cannot easily access the capital required to get into
supply-managed commodities. For this reason, those who do not have a family
farm operation to “buy” into over time generally tend to enter non-traditional
markets.
Today in Ontario, the production of poultry or eggs on a very small scale may
be exempt from the quotas, but there are no exemptions for milk. And even with
eggs and poultry, there is a large gap between the upper level of production
allowed under the exemption and the minimal level of production subject to a
quota (for example, a farmer who raises fewer than 300 broiler chickens a year

New Farmers and Alternative Markets Within the Supply Managed System 7
is exempt, but above that level, the minimum number of chickens that can be
raised under the quota system is 91,000 a year).
How can the needs of non-conventional farmers be accommodated within the
supply-management system for conventional farmers? Options include the
following:
• increasing quota exemptions
• developing alternative markets that are not subject to quotas
• decreasing minimum quota levels
• establishing separate quotas for specialty products
• offering exemptions for specialty products
• offering exemptions for producers who sell through direct marketing
• setting aside a certain amount of processing capacity for alternative
producers
Each of these options has benefits and drawbacks. However, the first step is to
recognize that alternative producers have needs and constraints that are not
currently well accommodated within the supply-management system, and
initiating discussions to reconcile these differences.
Farmer profile no. 1
Jane lives with her husband on a farm in Eastern Ontario. They both have off-
farm incomes. They raise 300 meat birds (in two flocks of 150 each) and 50
turkeys every year on pasture. Their investment has been minimal — about
$2,000 in hoop housing, watering systems, and brooding area materials. “At
best, right now, we can make $5,000, before labour costs, charging the organic
premium,” Jane says.
“At the very least, we would want to extend our season by one more batch of
150. It would cost us a minimal amount in labour and feed, and would only
mean better returns.” In Jane’s opinion, in the small-scale pasture business,
“time and energy is largely spent on figuring out the animal husbandry — how to
keep them alive and healthy, feed them so they put on weight, how to manage
your pasture, housing, and watering systems — that is what costs the time and
money in the start-up stage. Once you have that figured out, why would you not
scale up?” They have more demand than they can produce. “We bring them
home from the abattoir and they are all gone by the end of the day. ”
“We do this as a labour of love and for our community. This level of
agriculture would not provide enough income for farmers who are looking to
support a family.”

New Farmers and Alternative Markets Within the Supply Managed System 8
Introduction to Supply Management
Supply management is a regulated marketing system for farm products that
consists of controls on supply (in the form of quotas) that help ensure a fair
return to the producers of certain food commodities. The system operates
through farm marketing boards for milk, eggs, and poultry, which allocate
quotas both to farmers and to processors and administer measures to protect
Ontario farmers from having the prices of their goods undercut by imports.
The current model of supply management is designed for farmers who
produce large amounts of a single commodity. The marketing boards pool the
products of these producers, act as intermediaries between farmers and
processors, carry out marketing, and ensure that farmers earn a fair price for
their goods. The system allows independent owner-operated dairy, egg, and
poultry farms to stay in business, since it performs the same functions that in
other countries or jurisdictions are accomplished mainly by consolidation of
farmers under a corporate entity.
The system works well for large dairy, egg, and poultry operations that
produce a consistent and standard product in predictable amounts. It does not,
nor was it intended to, accommodate the needs of farmers who are producing
non-standardized food commodities, such as organic milk, free-range eggs, or
rare-breed poultry. All the things that make supply management successful for
conventional production are constraints on the production and marketing of
these differentiated products.
Demand for organic, local, and other distinctive foods is growing, and
consumers want to know more about the source of what they eat. Supply-
management boards regulate prices and maintain quality standards, but the
milk, eggs, and poultry they control are pooled products, anonymous and
standardized. They do not allow for the connection between producer and
consumer that many people are looking for.
In this paper, we will look at how the supply-management system works and
serves the farmers who participate. We will then consider the way in which
alternative producers and alternative markets work, in order to understand the
gap between the two types of markets. Finally, we will propose some ways to
bridge this gap.

New Farmers and Alternative Markets Within the Supply Managed System 9
The Origins of Supply Management
Supply management in Canada originated in the Ontario dairy industry in the
mid-1960s.1 At that point, the dairy industry was geographically scattered and
its markets fragmented (including cheese factories, creameries, and bottled-milk
companies). The prices received for milk differed sharply across markets and
across regions within the province. Producers had difficulty understanding the
size of their markets, and large processing companies effectively exerted market
power over smaller-scale producers.
Because of this situation, the Ontario Milk Marketing Board was created in
1965 under the Milk Act. It provided for the establishment of production quotas,
pricing based on the cost of production, milk classification and end-use pricing,
and price pooling. This move was followed by similar developments in other
provinces, and nationally under the Canadian Dairy Commission Act of 1966.
This framework still provides the basic elements of Canada’s milk supply
management.
Poultry supply management in Canada developed in the 1970s. Legislation for
poultry supply management in Canada lies in the Farm Products Marketing
Agencies Act of 1972, which sets controls on interprovincial trade in poultry and
restrictions on international trade. The legislation created a national supervisory
board, the National Farm Products Council. Under this legislation and the
Ontario Farm Products Marketing Act, supply-management authority was
established for Ontario industry associations representing broiler chicken
producers, egg producers, turkey producers, and chicken hatching egg
producers. Today, the Chicken Farmers of Ontario, Egg Farmers of Ontario,
Turkey Farmers of Ontario, and the Ontario Broiler Hatching Egg and Chick
Commission operate as supply-management authorities for broiler chicken, eggs
for human consumption, turkey, and broiler chicken hatching eggs respectively.
Supply-management agencies have been very successful in ensuring that
governments protect their farmer-members from adjustments caused by
international trade agreements. The agencies also support marketing strategies
that protect the value of the quota system.
How Supply Management Works
Farm marketing boards maintain fair prices for food commodities by ensuring
that supply does not exceed demand. Each farmer who participates in the system
buys the right to produce a certain quantity of a product and agrees to certain
standards and requirements, and in return receives the assurance of a market
for those products, combined with services such as marketing and trade
protection.
1 This section draws heavily from Biggs (1990) and Mestern (1972).

New Farmers and Alternative Markets Within the Supply Managed System 10
In addition to setting aggregate quota levels, establishing product standards,
and regulating certain production practices, the boards administer individual
producer quotas. This involves a range of policies including:
• exemptions from quotas
• minimum quota holdings
• maximum quota holdings
• quota access by new entrants
• quota assessments
• quota transfer fees
• quota price caps
• limitations on movement of quotas across properties
• rules associated with quota exchanges
• quota rental and leasing
• product standards
• certain production practices
Farmers usually buy (or inherit) the right to be allowed a certain quota.
Because quotas ensure fair prices, they have an important value for producers.
At the same time, the need to buy quota represents a barrier to new farmers who
want to establish a dairy or poultry farm. To offset this problem, most supply-
management agencies offer new entrant programs that allow for loans or grants
of quota over a specific period of time to new producers entering the industry. In
some cases, the allocation of quota to new entrants under these programs is
prioritized based on the region of the province or the nature of the product (e.g.,
organic producers or other specialty niches). Even with these programs,
however, it is difficult for new farmers to get established, because the quota
system is based on the assumption that producers are operating on a large scale,
and the start-up costs for large-scale operations can be prohibitive.
Small-scale production does not fit well within the supply-management
system because of the high levels of production required to qualify for quota. In
Ontario, there are exemptions for very small operations in the egg and poultry
industries,2 but a range of small and medium-sized operations are effectively
excluded from the system. This is because in Ontario and some other
jurisdictions, the minimum amount for quota exceeds the quantity that is
subject to an exemption from quota by a significant amount, so, in effect, a
particular range of farm sizes is ruled out. For example, in Ontario broilers, the
quota-exempt volume is 300 birds per year, but the minimum quota holding
requirement is 14,000 quota units (this represents an operation with
2 In the poultry industry, quota exemptions allow for very small-scale production or grandfather small-scale production that was already established when supply management was initiated. The dairy industry does not do this. Under rules administered by the Dairy Farmers of Ontario, there are no quota exemptions; that is, no production may occur without quota.

New Farmers and Alternative Markets Within the Supply Managed System 11
approximately 91,000 birds/year3). As a consequence, a farmer who wants to
keep, say, 700 birds or 5,000 birds cannot legally operate in Ontario. The reason
for this requirement appears to be transportation and administrative costs,
which entail a high unit cost of service for smaller flocks.
There are some important differences between the poultry sector and the dairy
sector. In the dairy industry, marketing boards perform the producer settlement
function, take ownership of milk in transit, and operate revenue pooling
schemes. In poultry, processors settle with producers, and no formal price-
pooling schemes are used.4 As well, pricing in the dairy industry involves not
only the cost of production, but also other considerations such as demand
response and milk utilization; in poultry, pricing is strictly based on production
costs. The dairy sector is different largely because the extent of regulation is
stricter in milk supply management. Dairy marketing boards also have the
authority to issue licenses, regulate transportation, and regulate milk quality.
Appendixes 1 to 4 provide an overview of quota policies across Canada for
various commodities; Appendix 5 contains policies relating to new farmers.
What is important to note is the range of different approaches across the
country. There is no single way of carrying out supply management, and a range
of policies exists for minimum quota amounts, exemptions from quota, and
programs for new farmers.
3 Calculation: One quota unit is equal to 13kg/yr. 14,000 quota units x 13kg/yr = 182,000kg. If each bird weighs approximately 2 kg, then this equals 91,000 birds. Each production cycle (or quota period) is 8 weeks. Therefore, in one year there are 6.5 cycles. 91,000 birds/6.5 cycles = 14,000 birds/production cycle. See Appendix A for more detail. 4 The levy scheme used to finance breaker egg sales could be considered an informal pool.

New Farmers and Alternative Markets Within the Supply Managed System 12
Growing Demand for Differentiation in Food Retailing and Food Products
Increasingly, consumers are interested in being able to choose from a greater
range of food products. Some consumers want inexpensive food. Some want
convenience. Some care about the environmental effects of production
processes. Some are motivated by health concerns. Some want food products
free of hormones or pesticides. Increasingly, consumers are looking for products
that are “local.” This term can mean a number of things, from the restrictive
“100-mile diet” to food that is produced within the province where the consumer
lives. But more important than the distance that food travels between farm and
plate is the fact that, more and more, consumers want to know where their food
comes from, who grew it, and the conditions under which it was grown. Many
people are turning away from anonymous, aggregated, standardized products
and looking for alternatives that allow them to feel more of a connection with
the farmer who produced the food.
The demand for “local” food comes from urban and rural consumers alike. An
Ontario poll conducted in June/July 2007 by Environics, in partnership with the
Friends of the Greenbelt Foundation, showed that 88% of respondents read the
origin labels on the foods they buy, 8 in 10 Ontario consumers prefer to buy
locally grown foods, and more than 50% say they do buy local at least once a
week (Friends of the Greenbelt Foundation 2007). Press coverage focusing on
alternative production methods and demand for its products, such as local,
natural, and organic, shows that interest in local food is rising.
The demand for differentiated products is not a fad, but a real trend. However,
the regulatory and business climates in which agri-food products are produced
in Canada do not always allow for differentiation to occur, especially among
supply-managed products.
Consumer Segmentation: One Size Does Not Fit All
Historically, food markets were driven by supply and the foods that producers
and food processors wanted to produce. Now the market is “consumer-oriented
and driven by demand, rather than by supply” (Commission 2008).
But there is no such thing as “the consumer.” Consumers and their
preferences are complex and unique; one size does not fit all. Market researchers
segment consumers into subgroups based on one or more characteristics or
values that cause them to prefer one product with certain attributes over

New Farmers and Alternative Markets Within the Supply Managed System 13
another. Consumer purchase decisions in all areas (not just food) are influenced
by a number of variables:
• geography: rural vs. urban location
• demographics: age, income, family size, ethnicity, education
• psychographics: values, lifestyle0, attitudes
• behaviours: rate of usage, loyalty to a brand or a place
When businesses or farm producers respond to these segmented consumer
demands, they define niche markets and create differentiated products and
services (BC Ministry of Agriculture, Food and Fisheries 2004). These
differentiated products and services reflect the differences in each market
segment’s demands and values.
Attributes that differentiate products may be related to service, design, cost or
price, or quality. When purchasing food products, consumers may value the
experience of buying food at a farmers’ market or directly at the farm gate, or the
knowledge that products are locally grown or raised, or do not contain traces of
pesticides or hormones. These experiences and this kind of knowledge represent
quality attributes. These attributes are becoming increasingly important to many
consumers.
Differentiation can take place anywhere along the value chain: on farm during
production, during processing, or at retail outlets. For example, organic carrots
are differentiated from conventionally produced carrots through on-farm
production practices; sliced apples or bagged salads are differentiated at the
processing plant; and purchasing produce through a Community Shared
Agriculture (CSA) program is an example of a differentiated retail experience.
Most processors, however, do not need or want differentiated products. They
want a predictable supply of a standard product. Under the regulated pooling
system, most supply-managed products are not differentiated and the source of
the raw milk, chicken, or eggs is irrelevant as long as they meet food safety
standards. However, as the food market becomes more consumer driven,
differentiated supply-managed products will likely become increasingly
important.
Differentiation in Retailing
Traditional grocery retailers include supermarkets (both independent and
supermarket chains), specialty food stores, and convenience stores. This retail
segment remains a strong and consolidated player within the grocery industry
(Dessureault and Grier 2006). The top three national supermarket chains in
Ontario are Loblaw, Metro, and Sobeys.
Despite strong sales growth in supermarkets, other types of retailers are
increasingly competing with them, including wholesale clubs, general
merchandisers, drugstores, and other non-traditional food stores. Alternative

New Farmers and Alternative Markets Within the Supply Managed System 14
retailers have gained market share mainly in the discount food business. For
example, Wal-Mart, Costco, and the Hudson’s Bay Company (HBC) under the
Zeller’s banner have been growing in the food retail business.
Canadian drugstore chains are also increasing their food offerings. For
example, Shoppers Drug Mart is renovating and expanding some of its stores to
offer more product choices, including food. Some of the new Shoppers stores
have grocery sections that account for 15 to 20 %of the sales area. The main
categories of food products sold at these locations are dry grocery products,
snacks, dairy, and some frozen products.
These, however, are generally markets for packaged and standardized
products. Consumers looking for organic or local food are increasingly turning
to farmers’ markets and farm-gate sales to make a connection with the people
who produce the food they eat.
In a farmers’ market or at the farm gate, farmers can sell differentiated
produce directly to the consumer. Differentiated produce means that farmers
are not selling simply a quart of strawberries or a basket of generic apples, but
they are selling the care and nurturing that they have put into that crop:
heirloom varieties, sustainable production practices, farm freshness, humane
animal care, or a personal link between the consumer and farmer.
Farmers’ markets are experiencing remarkable growth and popularity among
food shoppers in Canada, providing opportunities for many full- and part-time
farmers. The number of farmers’ markets in Ontario has grown to 154 in 2008
(Farmers’ Markets Ontario 2009), more than double the number of farmers’
markets operating in the late 1980s. Furthermore, sales at these markets are
growing at a rate of 7.3%, compounded annually (Farmers’ Markets Ontario
2009).
Farmers’ market customers want fresh, good-quality products. They value the
care and nurturing that farmers put into their operations and want to support
local farm production. Many also come for the social experience. Although most
Canadian consumers do not shop at farmers’ markets, the demand potential for
farmers’ markets is strong, because they are a vehicle for supporting local food
production (Farmers’ Markets Canada 2009).
On-farm sales and marketing activities in Ontario have also grown
significantly in the last four years. The Ontario Farm Fresh Marketing
Association recently released its On-Farm Marketing Report 2009 (Ontario
Farm Fresh Marketing Association 2009), an update to a report completed in
2005 (Ontario Farm Fresh Marketing Association 2005). Both reports surveyed
a representative sample of on-farm market managers, on-farm market
customers, and non-customers to analyze the importance of on-farm marketing
in Ontario.

New Farmers and Alternative Markets Within the Supply Managed System 15
In 2008, it was estimated that there were 750 on-farm markets with direct
sales in the range of $210 million. In just four years, the number of on-farm
markets in Ontario had grown 88% from approximately 400 in 2004, and sales
had grown by 80% from $116 million over the same period (Ontario Farm Fresh
Marketing Association 2009).
In 2008, on-farm markets reported significant growth in the last two years in
particular, with 72% reporting an increase in the number of customers visiting
the farms (Ontario Farm Fresh Marketing Association 2009). As a result of
growth in sales, over one-third of the farm markets surveyed are planning to
expand and/or renovate their on-farm markets.
Customers who visit on-farm markets are looking for a shopping experience
and a high level of service (Ontario Farm Fresh Marketing Association 2009).
When asked why they purchased products directly from a farm, 42% of the
surveyed customers responded that the products tasted better and were of
higher quality, and 30% stated that it was important to support local farms.
Other forms of direct farm marketing are also growing due to continued
interest in purchasing local foods, including the Community Shared Agriculture
(CSA) business model. The number of farms that offer CSA programs is not
formally tracked. However, the Ontario CSA Directory5 lists more than 100
farms, and there are likely many more that are not on the list.
CSA is a farm business model that directly connects farmers and consumers.
What makes this model unique from other on-farm marketing activities is that
consumers purchase “shares” of the farm’s harvest in advance of the season, in
order to provide capital support to the farmer and to share in the risk of the
year’s food production. In return, consumers receive a “share” of the harvest that
they pick up or have delivered on a regular basis. Each farm’s CSA program is
unique and varies according to the variety of products available (including fruits,
vegetables, meats, dairy, and baked goods), the quantity each shareholder
receives, on-farm production practices, and whether the products are delivered
or require pick-up. CSAs that offer delivery to urban centres provide an avenue
for consumers who cannot make their way to the farms themselves or visit a
farmers’ market to purchase local, fresh food.
Differentiated Food Products
Fifty years ago, a typical supermarket would have approximately 2,000
different items to sell. Today, the number is 25,000 (Commission 2007). This
expansion is due to the demand for specialty and differentiated products that
continues to grow in developed countries (Commission, 2007). As a result, in the
last half-century, food innovation and differentiation has increased to capture
that demand. According to the Canadian Council of Grocery Distributors
5 www.csafarms.ca

New Farmers and Alternative Markets Within the Supply Managed System 16
(CCGD), approximately 4,000 products are replaced every year with 4,000 new
products that attempt to meet ever-changing and varied consumer demands
(Commission, 2007).
Chicken and egg producers and processors, for example, have developed many
differentiated products to appeal to a wide range of preferences. Consumers can
now choose between conventional eggs: organic eggs; free-run, all-natural,
locally produced eggs; liquid eggs rather than shell eggs; already hard-boiled
eggs; or a combination of these attributes. The choices are just as broad when
purchasing chicken: organic; all natural; free-range; free-run, locally raised; or
some combination of these choices.
Two types of differentiated products in particular are currently gaining
attention — organic and “local” foods.
Organic products
The latest available data suggest that Canadian and Ontario producers are
responding to the growing consumer demand for organics. The number of
certified organic operations increased by more than 63% since 1999 and reached
3,782 operations in 2007 (Holmes and Macey 2008). Organic farms represent
approximately 1.5% of all farms in Canada and just over 556,000 hectares of
land. In the 2006 Census of Agriculture, 6.8% of farms reported that they were
producing either certified organic products, uncertified organic products, or
products on transitional lands.
According to the Canadian Organic Growers, the industry is growing at a rate
of 20% per year. The 2006 Census of Agriculture reported that Ontario had 593
certified organic farms, 150 farms in transition, and nearly 3,000 uncertified
organic farms (Organic Council of Ontario 2008). Further down the supply
chain, in 2007, there were approximately 90 certified organic food processors
and handlers in Ontario (Holmes and Macey 2008).6
Historically, organic foods largely comprised fresh fruits and vegetables
bought directly from farms or at farmers’ markets. More recently, along with
fruits and vegetables, organic meats, dairy products, and processed products
have made their way onto grocery shelves and into farm markets. Demand for
organic livestock is growing throughout the country (Canadian Organic Growers
2009). AC Nielsen retail sales data show that, between 2005 and 2006, sales of
organic raw meats increased 81% in national grocery stores; fresh vegetables
increased 38%, fresh fruit 28%, beverages 24%, and frozen foods 14%.7
6 There may be some data missing for 2007 in this field. In 2005 there were 155 processors and handlers in Ontario. (Canadian Organic Growers 2005). 7 Organic Agriculture Centre of Canada 2007. Retail sales of certified organic products in Canada in 2006, compiled by Anne Macey for OACC from ACNielsen Market Track Estimate for 52 weeks ending in August 2006 vs. 2005.

New Farmers and Alternative Markets Within the Supply Managed System 17
Holmes and Macey (2008) estimated that Canada’s organic food sales reached
$2 billion in 2008; this represents a doubling of sales in just two years. AC
Nielsen retail sales data indicates that major supermarket chains sell
approximately 40% of all organic food products in Canada. These sales represent
1% of total sales in these supermarkets. Figure 3.1 breaks down organic sales in
2006 by retail location. The majority of these organic food products (85%) are
imported, primarily from the United States (Commission 2007).
Figure 3.1: Sales of Organic Food by Retail Location
(Source: Holmes and Macey, 2008)
Organic dairy products represent one of the most rapidly growing segments of
the food market. In seven years of production (2000/2001–2006/2007) the sale
of organic milk in Canada has grown 525%.8 By comparison, the market for
conventional dairy products is stable. See Appendix 6 for data on the growing
demand for organic milk.
Local food
The definition of “local” food varies depending on the consumer’s views, the
market in which it is being sold, the commodity, and the growing season. Some
consumers define local food as food produced within 100 miles of its place of
purchase; some define it as regional, others as Ontario-produced and, in some
cases, as Product of Canada. The definition of local food can also be associated
with the supply chain through which such products are purchased and with a
sense of transparency — the sense that the consumer knows who grew the food
and under what conditions. Farmers’ markets are a common supply channel for
8 Historically, organic milk supply in Ontario could not meet demand, but recently, the industry has begun to deal with a surplus. Steve Cavell of Organic Meadow estimates that the surplus is at about 60,000 hl. This surplus of organic milk is put into the conventional milk pool.

New Farmers and Alternative Markets Within the Supply Managed System 18
local foods, along with Community-Shared Agriculture (CSA) programs,
roadside stands, small grocery stores, and direct marketing from farms.
The local food sector is often characterized by small and medium-sized
independent producers who seek to add value to their products and who direct-
market to local residents, restaurants, retailers, and tourists (through farmers’
markets, farm shops, and farm-gate sales). Most producers involved in this
market (though perhaps not all) have a deliberate strategy to sell their products
as locally produced and through defined avenues and outlets. Coincidently,
larger retailers are also promoting a greater range of local foods, both fresh and
processed, to meet consumer demand.
The Ontario government has strengthened its commitment to building
awareness of and demand for local food in the province. The 2008 Ontario
budget committed $56 million over four years for the Pick Ontario Freshness
Strategy (Foodland Ontario 2009) and the Ontario Farmers’ Markets Initiative
(Ministry of Finance 2008). The Pick Ontario Freshness marketing strategy,
launched in June 2007, was developed to promote interest in Ontario food
products through increased consumer demand (Foodland Ontario 2009). The
strategy includes:
• an advertising campaign to raise consumer awareness of Ontario
products and their availability
• an expansion of the Foodland Ontario program throughout the grocery
store, above and beyond the produce section
• support for the Savour Ontario program, which promotes Ontario foods
in dining establishments (Foodland Ontario 2009)
In July 2009, the government committed $24 million over three years to
“develop logistics that would enable Ontario-grown food to make its way into the
province’s schools and hospitals, increase sales to food service and other
institutions” (OMAFRA 2009). As part of this commitment, under the Ontario
Market Investment Fund (OMIF) the government has provided funding to six
new local food projects. These projects include buy-local initiatives for Windsor-
Essex, Chatham-Kent, Essex, and Haldimand, a local food-distribution network
for organic farmers in the Ottawa area, and a marketing campaign for Ontario
berries (OMAFRA 2009).
Local Food Plus (LFP) has also helped to manage and make local food more
visible in retail outlets across Ontario. LFP certifies local producers and
processors based on a number of sustainable production standards and then
links these stakeholders with local purchasers (Local Food Plus 2009). Other
stakeholders, including municipalities and industry, are also leading local food
initiatives and developing strategies that include action plans for increased
research and marketing efforts, including culinary and farm-gate road maps.
Some examples include the Niagara Culinary Trail, City of Hamilton

New Farmers and Alternative Markets Within the Supply Managed System 19
Agricultural Action Plan, Harvestin’ the County in Prince Edward County,
Foodlink in Waterloo Region, Direct from Norfolk County, Durham Farm
Fresh, Kawartha Choice FarmFresh, SAVOUR Muskoka, the Ottawa Buy Local
Food Guide, and the Guelph-Wellington Local Food initiative.
A Trend, Not a Fad
The data we have found strongly suggests that the demand for differentiated
products is not a fad but a trend with continued growth opportunities. Kohl
(2007) has estimated that, in the United States, these types of products have the
potential to capture 20% of the marketplace by 2020. We can assume that the
Canadian marketplace will follow suit.
While producers and processors provide differentiated products based on
consumer-valued attributes, they are also providing many substitute products
that compete against each other. When there are many substitutes for a product,
consumers can easily switch to another product. The supply-management
business model is based on the assumption that consumers want predictable
quantities of a standard product. This may have been the case 40 years ago, but
is no longer true in a food culture of increasing consumer choice.

New Farmers and Alternative Markets Within the Supply Managed System 20
Farmer profile no. 2
Sean is a young, enterprising farmer running a diversified farm business that
includes grains, flours, cereals, pastas, meats, and eggs. The farm produces corn,
soybeans, wheat, spelt, hay, rye, barley, oats, and field peas. Sean also raises
cattle, pigs, chickens, ducks, turkeys, and horses.
He runs an on-farm store where he sells most of his meats and eggs.
Sean currently produces 150 chickens twice a year. He wants to raise 1,000
birds a year, based on the scale his system could accommodate and the demand
for direct sales (estimated at selling 20 birds a week directly through their store
and through farmers’ markets). Right now, he sells about 1,000 birds through
his store. The 300 “organic ones get gobbled up so quickly we have nothing left
to sell,” so he buys the rest from a local quota holder who produces drug- and
hormone-free birds. Sean is able to cover the cost of labour involved in the bird
production and continue to raise birds, because they are an important part of the
his farm ecosystem, but if he had to pay for quota, he could not do so.
Sean has also had the tenacity to work out a unique arrangement with the Egg
Farmers of Ontario for the eggs he sells from his farm store. He raises a 500-hen
flock, which he thinks is a suitable size for an operation such as his. He splits
them into two 250-bird flocks and raises them on pasture in the summer and
indoors in the winter to produce eggs all year round.
He has managed to set up a quota account with the Egg Farmers where he
pays $5/year/bird into a holding account. When the account builds up to
enough money to allow him to purchase quota, it will be converted into quota (if
the quota is available). He is not aware of anyone else doing this and feels that
he was allowed to do this because he “lobbied the crap out of them and this was
the best way to get rid of me.”
Sean would get into small-scale dairy farming if he could and has already
developed a business plan for a 12-cow herd. He wants to sell bottled milk from
his farm store and at farmers’ market and use the excess milk to make cheese
and butter. This is his business plan:
• Cows: $24,000
• Equipment: $40,000 (on an existing farm)
• Operating costs: $24,000 a year ($2000/cow/year)
• Production: Each cow should produce $10,000 worth of milk (based on a
305-day lactation period, meaning he will always have some cows fresh and
some dry)
• Price: $2/litre
Sean believes he could make money right at the outset, especially since he has
an established customer base, but this would not be possible if he had to
purchase quota.

New Farmers and Alternative Markets Within the Supply Managed System 21
Conventional and Alternative Production in Supply-Managed Products
Production Costs for Generic Supply-Managed Products
The supply-management system sets prices for food commodities based on the
estimated cost of production for those commodities. This includes start-up costs
(such as building barns or buying equipment) and ongoing costs for running an
operation of a certain size. These costs must be fairly predictable and uniform
for producers to ensure that prices are appropriate.
By contrast, the costs of alternative forms of production are anything but
predictable. Farmers manage their risk in other ways — by diversification among
different products, for example. Because production costs in alternative
production systems differ from conventional production, pricing and marketing
conditions under supply management may be irrelevant for specialty products.
In this section, we will explain how costs are set in the conventional
production model, by looking at the costs for a broiler chicken facility, an egg
facility, and a dairy farm. In each case, the focus is on production costs for a new
facility. Production costs for a new facility tend to differ from those of older
facilities because of differences in scale, technology, and state of depreciation.
This distinction is relevant, as (depending on the commodity) the typical farm
currently in operation is not the same as one that would be newly built.
In these descriptions, we have included the cost of quota but omitted the costs
of the financing required for three reasons. First, allocating financial costs to
quota in a generic manner is difficult, because the underlying asset value does
not depreciate and has no obvious limit on its useful life. In other words,
budgeting the financial cost of quota relies on arbitrary assumptions. Second,
production costs used in forming prices in supply management must always
omit the costs of quota or its associated financing costs in order to avoid rapid
inflation in quota prices. Third, most current participants in supply-managed
industries obtained a portion of their quota when the system was established or
through family transfers at values far below existing values, or purchased quota
along with farm real estate at a discounted price. In practice, the total value of
quota for a new facility would not be realized as a lump sum cost at market
value; if this were assumed, new farm projects would either be only marginally
profitable or make a loss. Thus, we recognize the capital value of quota in the
discussions below but do not assign a financing cost to it.

New Farmers and Alternative Markets Within the Supply Managed System 22
Conventional broiler chicken production costs
A typical new conventional Ontario commercial broiler chicken operation
would be built around a broiler barn that has the capacity for just over 52,000
quota units. Assuming production of standard 2.1 kg broiler chickens and 6.5
cycles per year, each quota unit allows for production of 1.86 kg live weight, or a
total of 633,000 kg live weight output per year.
Appendix 7 contains the data and assumptions used to calculate the start-up
capital and operating costs of a facility of this size. Table 7A in Appendix 7 shows
that the start-up capital costs of a facility this size would be approximately $4.6
million, of which $3.9 million is the cost of quota to produce this quantity of
chickens per year.
The operating costs of broiler production are dominated by feed and chick
costs. Table 7C in Appendix 7 shows the estimated total costs to be about
$1.20/kg to supply a 2.1-kg broiler chicken priced at $1.46/kg.
Table 4.1: Summary of revenues, broiler production
Price per kg $1.46
Cost per kg (not including quota) $1.20
Profit per kg before quota cost $0.26
Kg produced per year 633,000
Total profit before quota cost $138,964
Chicken producers must find processors to purchase their chicken. However,
production of chicken in this quantity suggests that the quota was purchased
from another producer leaving the industry; therefore, the link to the processor
could already be made and essentially no marketing of the chicken is required.
Essentially, the marketing function for the producer would be quite rudimentary
and the processor would market the product to the end consumer. The chicken
producer will have a direct relationship with the processor in order to negotiate
transportation logistics.
Along with chicken production, many conventional chicken producers have a
cash crop operation. These crops are not grown to feed the chickens. Typically,
there is almost no on-farm feed manufacturing and most producers purchase
complete feeds.
Conventional egg production costs
A typical new conventional Ontario commercial layer operation would be built
around a layer barn that has the capacity for 60,000 hens (quota units). Pullets
are purchased and held one year in production, with a production level of 27
dozen eggs per hen per year. This equals a total production of just under 1.5
million eggs a year.

New Farmers and Alternative Markets Within the Supply Managed System 23
Appendix 8 contains the data and assumptions used to calculate the start-up
capital and operating costs of a facility of this size. Structurally, egg production
costs are similar to broiler production costs. The start-up cost component is
dominated by quota cost, and the operating cost has feed as its largest
component. Based on this model, Table 8A in Appendix 8 shows that the start-
up capital costs of a facility this size would be approximately $10.7 million, of
which $9.3 million is the cost of quota to produce this many eggs per year.
The operating costs of layer production are dominated by feed and pullet
costs. Table 8C in Appendix 8 shows the estimated total costs to be about
$1.12/dozen.
Table 4.2: Summary of revenues, egg production
Price per dozen eggs $1.37
Cost per dozen eggs (not including quota) $1.12
Profit per dozen eggs before quota cost $0.25
Eggs produced per year 1,500,000
Total profit before quota cost $363,755
Like chicken producers, egg producers have fairly limited marketing
requirements. Many layer operations also include a cash crop component.
Recently, the Egg Farmers of Ontario introduced a cap on purchases of quota
for new operations of 22,000 units. The cap does not apply to purchases of
existing farms as an ongoing entity, and, after the maximum purchase of 22,000
units, farmers can purchase up to 5,000 further units per year. Under this new
measure, the up-front quota cost for a new operation would be $3.41 million
(22,000 units at $155/unit), with a stream of investments over time in units of
5,000 a year to round out the capacity of the facility.
Conventional dairy production costs
Costs of a typical new Ontario conventional dairy operation would be based on
a 250-cow free-stall operation with 41 dry cows. Space for dry cows is included
in the allocation of 250 free stalls for the herd. At an average milk production
rate of 9,417 litres per cow per year, total milk production in this typical facility
would equal 1.78 million litres a year.
Appendix 9 contains the data and assumptions used to calculate the start-up
capital and operating costs of a facility of this size. Table 9A in Appendix 9
shows that total costs of the barn, manure storage, feed storage, and milking
parlour are estimated at $6,915 per stall, in addition to an initial stock of cows
valued at $2,300/head. This gives an initial investment in cows and facilities of
about $2.4 million. Based on a 3.9 kg/hl butterfat test, just over 1 kg milk quota

New Farmers and Alternative Markets Within the Supply Managed System 24
per cow is required, valued at $25,500/kg. This equals a total quota investment
of just over $6.4 million. In total, an investment of $8.8 million is required.
Table 9C in Appendix 9 summarizes key operating costs of the dairy farm
model. The biggest single component of total production cost was feed at
$.23/litre, followed by other variable costs and non-quota fixed costs. Given the
feed price environment of 2008, total production costs were about $.66/litre,
exclusive of quota.
Table 4.3: Summary of revenues, milk production
Price per litre $0.757
Cost per litre (not including quota) $0.660
Profit per litre before quota cost $0.097
Production per year in litres 1,780,000
Total profit before quota cost $231,186
Essentially, no marketing by individual farmers is involved. If a producer has
dairy quota, the milk board will find a customer for the milk produced from that
quota. The milk board arranges the collection and transportation of milk across
the province and takes ownership of the milk once the product is in transit.
Unlike chicken and egg producers, the dairy producer is paid by the milk board
rather than the processor. Dairy producers may not know where their milk goes
once it leaves the farm.
Typically, dairy producers grow their own forages. Some operations also have
a cash crop component, but this is usually minor compared to the dairy
operation.
Alternative Production
In essence, the descriptions above represent current conventional technology
to produce poultry, eggs, and milk in Ontario. There is, however, no
“representative” alternative production operation and therefore no average cost
of production that can be compared to the conventional cost of production
models. Not only are these alternative operations different from their
conventional counterparts, but they are also different from each other.
Here are three examples.
1. One alternative operation in Ontario produces pork, chicken, turkey,
and fresh vegetables. This operation sells all of its products directly to
consumers through a CSA program.
2. Another operation is a certified organic farm producing grain, meats,
poultry, eggs, and fresh vegetables. This operation has a meat CSA
program and also sells its products through farmers’ markets and
through direct relationships with restaurants and independent stores.

New Farmers and Alternative Markets Within the Supply Managed System 25
3. A third operation in Ontario produces a wide variety of grains that are
milled, processed, and sold on-site in various forms and packages.
Customers can also purchase meats, eggs, and other goods from the
same operation.
Some operations are based on adherence to specific production practices such
as free-range or free-run, while others organize themselves around a fixed land
base and grow their own feed for livestock and poultry. Others are based around
direct relationships with their customers and offer on-farm activities (livestock
displays, mazes, crafts, etc.) to attract customers. Still others are a combination
of all of the above.9
Although there is no “representative” alternative production system, some
characteristics of these systems are similar and clearly differentiate them from
conventional operations. These characteristics include:
• mixed operations: economies of scope
• a lack of economies of size
• different costs of production
• greater marketing efforts and customer interaction
• higher market risk
• spin-off enterprises
The following section describes these differences in detail.
Mixed operations: economies of scope
Alternative operations often include a variety of enterprises, such as chicken,
turkey, eggs, pork, and vegetables, in which no single enterprise accounts for the
majority of farm cash receipts, unlike conventional operations (see Table 4.4).
These farms are not specialized and generally have few economies of scale in
production; rather, they aim for economies of scope in direct marketing.
Each component (egg production or raising chicken) may be small compared
to its more specialized conventional counterpart, however, these alternative
operations as a whole can be commercial in both size and product scope. It is the
total package of products produced that is the value proposition of many of these
operations. For example, a customer can purchase fruits, vegetables, meats,
eggs, and even fresh flowers for the week in one bundle.
An important point to note is that due to the mixed offerings, these operations
are also diverse economically, and therefore the risk is spread across a number
of enterprises. Risk is mitigated by the variety of enterprises. If one enterprise
suffers a poor growing season or animal disease, the whole operation will not be
devastated by this setback.
9 Ontario farmers are restricted in some of their practices. For example, in the United States, rotational grazing has developed as an alternative approach to dairy farming (this means that different animals graze on certain areas of the farm at different times). In Canada, however, due to the need to fill quota year-round, rotational dairy grazing is restricted.

New Farmers and Alternative Markets Within the Supply Managed System 26
Table 4.4: Examples of Alternative Farm Cash Receipt Proportions
Farmer A Farmer B Farmer C
Chicken: 11% Grains: 75% Grains: 75%
Turkey: 36% Poultry, waterfowl, eggs: 15% Pork: 10%
Hogs: 40% Pork and beef: 5% Beef: 10%
Vegetables: 13% Vegetables: 5% Poultry: 5%
A lack of economies of size
Producers’ ability to realize economies of size or scale depends on the extent to
which they can spread their fixed costs over a larger number of units of
production. Because they operate at small or medium scales, alternative
production systems commonly struggle to attain economies of size in supply-
managed products.
There are three reasons for the lack of economies of size. First, many of the
alternative operations produce supply-managed commodities under personal or
small-lot exemptions. The exemption levels tend not to be consistent with full
utilization of equipment. Second, given the minimum quota-holding
requirements in chicken and turkey production, alternative operations may be
unable or unwilling to purchase quota that would otherwise allow for more
efficient use of facilities. Third, contemporary production technology is
commonly targeted towards enterprise specialization and scales of operation
larger than those used by producers supplying alternative markets, regardless of
the quota exemption. Thus, the unit production costs owing to fixed costs will
tend to be higher in alternative production.
At the same time, farmers who pursue alternative forms of production tend to
operate within a culture and philosophy that are land-based and ecological or
certified organic. These operations tend to be relatively small, not strongly
growth-oriented, and heavily involved in marketing as well as producing their
products.
Some farms also operate under the principle of balance, meaning no one
enterprise may grow significantly out of proportion relative to the others, as they
are integrated units of the farm. So while the farms may be large overall, with
many operations able to grow beyond the exemption levels, the scale required by
the minimum purchase requirements for quota would require excessive growth
in one area — which would be inconsistent with their farming approach.
Differing costs of production
Production costs commonly differ between alternative production systems and
conventional production, sometimes significantly, for three main reasons.

New Farmers and Alternative Markets Within the Supply Managed System 27
First, alternative production tends to be less mechanized than conventional
production. This difference relates to scale, as well as to the use of confinement
housing — by nature, the greater the use of outside access, the lower the use of
automatic feeders, cages, etc. Compared with conventional production, more
labour is used in the alternative production process, resulting in higher
production costs. Moreover, where outdoor housing is used in alternative
production in lieu of confinement housing, space requirements will affect the
cost structure.
Second, alternative production systems commonly employ techniques and
products which have lower yields compared with conventional production. For
example, many alternative farmers raise heritage animal breeds and reject some
forms of plant-genetic technology. Heritage-breed animals usually take longer to
fatten to market-ready weights, and heirloom vegetables and other types of
plants may take longer to grow. As a consequence, yields tend to be lower in
alternative production. Lower yields must be compensated for by increased
revenue through greater marketing efforts.
Third, there may be additional costs associated with certification of products
and with purchasing certified inputs. Producers who market certified organic
products (and thereby incur many of the cost disadvantages described above)
must pay for certification services that are not part of conventional production.
Within an organic program, feeds must be either purchased or grown that are
priced at a premium to conventional feeds.
Greater marketing effort and customer interaction
In most alternative operations, marketing is a central component of the farm
business. Producers must create their own base of customers through their own
marketing efforts. Many of these operations market their goods and services
through customer relationships, including sales at farmers’ markets, CSAs, on-
farm sales, or direct delivery. This marketing effort and investment significantly
reduces the margins producers receive until the market is fully developed.
Conversely, in conventional supply management, marketing boards promote
and sell the farm product. For example, a dairy farmer’s customer is the
processer, not the consumer. The farmer does no marketing whatsoever.
Moreover, the marketing of alternative products differs from conventional
marketing. In many instances it is the farm story, its production practices, and a
relationship of trust with the producer that is being marketed along with the
product. This approach differs from the marketing of commodity product in
terms of the interface with customers and the nature of market power
relationships.
Supply management has its origins in issues related to purchasers’ market
power, and its instruments strengthen farmers’ position relative to this market

New Farmers and Alternative Markets Within the Supply Managed System 28
power by selling product collectively under the authority of marketing boards. In
contrast, producers marketing alternative products do not need or want
collective protection from purchaser market power. By explicitly choosing to
produce and sell a product that can realize value only if it is sold as a
differentiated good, they need direct contact with customers.
Higher marketing risk
In addition to incurring higher marketing costs, by producing and marketing
new and alternative products, alternative producers assume a greater level of
marketing risk than their commodity-oriented counterparts. Commodity
products, by definition, are sold in liquid markets to a mass group of consumers.
Alternative products are targeted towards a subset of the market. Reaching the
relevant target market involves more costly marketing, the target market is
much less reliable or predictable, and the impact of purchase choices by a given
customer or segment is much more significant. Thus, the risk associated with
alternative products is higher.
Spin-off developments
Alternative product marketing allows for spin-off businesses to be developed.
For example, there is a natural synergy among farms in a region that market
directly to consumers to network together and market a “regional food
experience.” This, in turn, provides an incentive for processing alternative
products and developing an associated food-service component. The marketing
of commodity products does not facilitate these types of developments.
The Price Difference between Conventional and Alternative Products
The budget for a new conventional facility in a poultry or dairy enterprise
allows for production efficiencies related to the rational scale at which a new
facility must be constructed, although it represents very large capital
requirements, largely driven by the quota investments required. The prices
received for the products, however, are controlled, and although they are
intended to cover the costs of production, they are also low enough to ensure
consistent sales to processors and other customers.
Alternative production generally operates through smaller production units
that encompass a range of enterprises but lack the economies of scale available
to conventional production within any single enterprise. As well, alternative
producers operate under higher production costs, owing to differences in
technology choices and the costs of certification. However, they command a
much higher price for their products, partly because of the limited supply of
these differentiated products. Consumers are also willing to pay higher prices for

New Farmers and Alternative Markets Within the Supply Managed System 29
this food, because they value knowing where the food came from and how it was
grown.
The marketing of commodity products and that of alternative products also
differ sharply from one another. In conventional production, marketing is
rudimentary or absent, whereas in alternative forms of production, marketing is
an intrinsic aspect of the farm operation. The relative significance of marketing
creates an additional element of risk (and potential reward) in alternative
production and better allows for the prospect of spin-off developments.
Farmer profile no. 3
Red runs a new mixed-farm operation in central Ontario. He is developing a
community shared agriculture (CSA) program, as well as raising pasture pork,
turkeys, and chickens. His business model is based around an established
customer base in his 250-member CSA.
He raises 300 meat birds in two flocks of 150 birds each, on pasture in chicken
tractors.
Red’s chickens cost him $600 in start-up materials, $1,300 in annual expenses
for each 150-bird batch (including chicks, brooder costs, feed, mileage,
electricity, and slaughter), and $500 in labour for each batch (at $12/hour).
Each year he nets $1,700 after these expenses and labour costs.
He feels they could scale up easily from 300 birds. Ideally he would like to
raise 1,500 birds on pasture each season, based on what he could manage and
easily sell to his CSA members. While he feels he could make a little more per
unit on labour and material expense if he could scale up, he would primarily
save more per unit on fuel cost (trips to hatchery, feed mill, abattoir, customer
service, etc.).
While profits are minimal at the current scale, he raises the chickens and
turkeys for two reasons. First, he needs a sustainable source of fertility for his
soil (manure), and second, he sees a strong demand for the products he raises —
demand for the taste; demand for pastured, organic meats; and demand for
humanely raised meats — and having this demand met adds value for his CSA
customers.

New Farmers and Alternative Markets Within the Supply Managed System 30
Options for New Farmers and Alternative Markets within the Supply-Managed System
Before assessing potential alternatives for alternative products within the
supply-management system, we should summarize the main findings of this
study.
Supply management developed to protect the producers of conventional food
commodities from the power of processors and other customers and to ensure
that farmers received a fair price for their products. The system regulates supply
in order to control prices and is based on assumptions about how the food will
be produced and the quantities and costs of production. The supply-
management boards, often called marketing boards, do the marketing for the
sector as a whole, so that producers need to do little or no marketing of their
products.
The scale and cost structure of alternative operations differs from those of
commodity producers. Alternative production is generally less specialized than
commodity production, with many products produced on the farm, although in
much lower quantity. Marketing is an intrinsic part of alternative production.
Producers must create their own markets, with all the additional costs, risks,
and rewards this entails. However, their products can command much higher
prices.
Although the demand for commodities in supply management is stable or slow
growing, the demand for alternative products is growing rapidly and has
established itself as more than a fad.
Within this context, we have identified potential alternatives to the current
situation for supply management; the options are not listed in any particular
order. The options are explained and their apparent pros and cons discussed.
1. Raise quota exemption levels to facilitate additional alternative
production.
2. Phase alternative market development program into the supply-
managed system.
3. Decrease minimum quota holdings and allow for increased self-
marketing initiatives.
4. Establish separate quota for specialty product.
5. Create an exemption for specialty products.
6. Create an exemption for direct marketing.
7. Target specialty markets in allocating processing.

New Farmers and Alternative Markets Within the Supply Managed System 31
As Appendixes 1 to 4 make clear, there is no one single way to operate a
supply-management system, and variations are possible. The key is to determine
which variation would best support the needs of alternative producers while
continuing to serve the requirements of conventional food producers.
Increase Quota Exemption Levels
An obvious alternative to increase production opportunities for alternative
products is to increase quota exemption levels. Such exemptions would need to
allow for farmers to market their own products and to sell directly in a variety of
ways — from the farm, in farmers’ markets, and to restaurants and small-scale
processors. This could facilitate the growth of alternative production of supply-
managed products to a level that would make it a more meaningful and
profitable enterprise in a portfolio of enterprises for new farmers. Increasing the
quota exemption levels would allow producers who are currently raising 300
chickens, 100 layers, and/or 50 turkeys to increase their production and
experience some economies of scale.
The advantages of an increase in the quota exemption levels are that it is a
very simple change and also one that would not require any obvious changes in
the broader elements of supply management. The quota exemption could be
established at a sufficient level to make poultry a more feasible enterprise on a
specialty mixed farm. Quota cost would not be a barrier to entry for beginning
farmers.
The disadvantages are that it does not address alternative marketing in dairy
products (where there is no exemption), and it does not address processing and
market access issues. For example, an increase in the chicken exemption level
does not imply an increase in processing access, which can become an important
marketing constraint. Finally, any quota exemption level can be criticized as
arbitrary.
Alternative Market Development
A second option is to facilitate specialty market development, with an eventual
rollover into the conventional supply-management system. This process could
operate in the following way: Marketing boards would establish criteria to
evaluate specialty product projects, and farmers wishing to enter the industry
would apply for temporary quota credits based on specialty market enterprises.
Marketing boards would approve a certain number of these projects, issue quota
credits, and monitor the success of the projects. After a given period (for
example, five years) and subject to satisfactory evaluation, the projects would be
granted permanent quota.
For example, a producer could approach a marketing board with a proposal to
raise rare-breed poultry in an outdoor setting for a local restaurant. The volume

New Farmers and Alternative Markets Within the Supply Managed System 32
of product involved would be determined in conjunction with the restaurant,
and access to processing would be arranged. The marketing board could review
the proposal and allow for a temporary quota credit. This would be monitored
and later reviewed, and a decision would be made regarding permanent quota
allocation.
This approach would facilitate the entry of new farmers into specialty markets
within the supply-management system. It could apply to both dairy products
and poultry, and participating producers would eventually end up with quota
that is “earned” in a sense, rather than the quota cost being a barrier to new
entrants.
The disadvantages lie in establishing the volume eligible for specialty projects
and the criteria and evaluation of projects approved for quota — and following
this, maintaining complicated systems of oversight. Also, this option, through
the application process, would allow marketing boards to determine the
“success” of the ideas, rather than the market itself. The option also restricts the
number of farmers allowed to produce and market alternative products to some
arbitrary number decided by the boards. Ultimately, approved projects for
specialty producers would have the same quota as conventional producers, and
regulations related to product standard or production processes would need to
be dealt with.
Decrease Minimum Quota Holdings
Another way to increase opportunities for new producers in specialty
production is to decrease minimum quota holdings. The most drastic decrease
would be to lower the minimum quota holding requirements to the exemption
levels; in several cases, there are broad gaps between quota exemption levels and
minimum quota holdings. To stimulate specialty production, this change could
be coupled with an increase in the self-marketing quota that could give new
entrants access to processing at relatively low levels of production. Flexibility in
service fees could be implemented if small holder production materially
increased the costs of service.
The proposal to decrease the minimum quota is similar to the one to expand
the exemption, except that new producers would need to purchase quota. The
increased self-marketing quota combined with the decreased minimum could
open up opportunities for new farmers operating on a small scale with specialty
production, because it links production of the farm product with access to
processing that provides the producer with a saleable consumer food product. It
offers the prospect of building growth in supply management and could apply to
dairy and poultry.
However, this proposed system requires that new entrants purchase quota,
which is a financial barrier, and the value of the marketing function provided by

New Farmers and Alternative Markets Within the Supply Managed System 33
supply-management agencies to alternative products is likely to be minimal. It
may also be difficult to match access to self-marketing quota to new entrants
taking advantage of the lower minimum quota. Ultimately, the lower minimum
quota will be subject to the criticism that it is arbitrary.
It must also be noted that currently, “any person can ask for permission to
buy less than the minimum required in any commodity; however they would
have to ask permission in person before the Board and have a list of reasons to
do so” (Morrison 2009). The Board does not have to grant permission, however,
and currently such decisions are made ad hoc.
Within this alternative, there could also be the option to lease quota. The
ability to lease would make the option more financially viable for some
producers. For example, suppose a producer wanted to raise 2,000 broilers per
year. This producer could raise the 300 broilers allowed under the exemption
and lease quota for a set amount per bird or kg for the additional 1,700 birds.
Lease agreements could be renegotiated each year.
Establish Specialty Market Quota
Another option is to create a new class of quota dedicated to specialty
products. Essentially, marketing boards would estimate existing demand for
specialty products, and create and distribute quota to existing specialty
producers. The quota allotment would fluctuate over time with demand, and the
specialty quota could be exchanged among specialty producers. There would be
no transfer of quota between conventional production and specialty production.
For example, a marketing board could conduct a survey of the apparent
demand for specialty product. Based on this information, existing specialty
producers would be audited, to verify their specialty status and historic
production levels, and issued quota. The marketing board would then monitor
demand and adjust quotas on a pro rata basis or issue new quota based on
measured changes in demand.
The advantage of this approach is that it allows for specialty market growth
within the supply-managed system.
However, it requires quota purchase and thus presents a barrier to new
producers. It would require a very clear definition of specialty to keep it separate
from the conventional quota, and specialty tends to defy clear definition. To
operate effectively, the specialty quota would also need to be adjusted according
to market demands, and this would likely prove difficult for supply-management
agencies that deal in commodity markets. Also, extensive monitoring would be
required. Rapid growth in specialty demand might also be perceived as having
been achieved at the expense of conventional production, creating tension in
supply-management agencies.

New Farmers and Alternative Markets Within the Supply Managed System 34
Specialty Product Exemption
Specialty products — for example, organic, free-range, or product marketed
from a regional appellation — could simply be exempted from quota.
The advantage of this approach is that it would remove the barriers to entry
for specialty production, and specialty producers would have complete freedom
in marketing their product.
There are, however, important disadvantages. This approach requires a clear
definition of specialty product to prevent a flood of entrants under the
exemption, representing a threat to conventional production. Taken to its logical
extension, an exemption for specialties could create international trade issues if
specialty products were exported at a material level.
Direct Marketing Exemption
Dairy and poultry sold through direct farm marketing could be exempted from
quota. Similar to the option above, this approach would remove the barriers to
entry for direct-marketed production, and producers would have complete
freedom in marketing their product.
The most important task under this option would be to determine what exactly
a direct farm marketing channel is. For example, direct farm marketing could
include farm gate sales, farm stores, farmers’ markets, CSA operations, direct to
restaurant, and mail order and e-commerce direct to final consumer. Therefore,
the producer is allowed to produce whatever they can market directly from their
farm.
For example, a producer could produce milk to add to a vegetable CSA for 50
families, providing a certain amount of pasteurized milk with each CSA delivery
or pick-up. Another example would be a producer raising 600 chickens which he
or she could sell at farmers’ markets, to restaurants, and through on-farm sales.
However, there are questions about what can be considered direct marketing
— does it include farmers’ markets, restaurants, and small-scale processors?
Moreover, in such a system, a method of ensuring that farmers are selling only
directly would need to be developed. And, of course, the saftey of the products
sold would need to be ensured.
Target Specialty Markets in Allocating Processing
In order for specialty farm production to grow, appropriate processing plant
capacity must be available. Many smaller meat-processing plants have closed in
recent years, and access to these plants is regulated. In other cases, existing
plants are not well set up, or are not interested in processing alternative
products. Aligning specialty processing with farm production, therefore, is
important in growing the farm segment and would support any of the options
described above.
New Farmers and Alternative Markets Within the Supply Managed System 35
For example, if a set percentage of plant quota were allocated to processing
specialty or niche products, plants and/or marketing boards would need to
source the specialty product for processing from farmers. This arrangement
would naturally create opportunities for specialty products, either by itself or in
conjunction with some of the alternatives above.
The principal advantage of this concept is that it would create processing
access, which can be important to alternative production. Increased access to
processing could create an environment in which new specialty producers could
justify the cost of quota purchase, which would then allow for growth within the
supply-managed system.
The disadvantages include the fact that it depends on a clear definition of
specialty. However the farm production is controlled, if processing access were
allocated as a portion of total processing allocation, then the specialty market (in
terms of processing) could grow only at the same rate as the conventional
market, which is likely much too slow. Alternatively, supply-management
agencies would need to unilaterally adjust the processing allocation, which
requires knowledge of specialty markets that they may not have. As with the
separate quota option, very rapid growth in specialty product could be perceived
as coming at the expense of conventional product.

New Farmers and Alternative Markets Within the Supply Managed System 36
Conclusion
There is a growing segment of alternative production that is drawing new
farmers into the sector. The growing market demand for alternative food
products and food-purchasing experiences represents an opportunity to increase
these alternative farm operations in Ontario. However, farm operations
producing alternative products that include supply-managed enterprises face
regulated marketing constraints that limit their prospects. Broadly speaking, the
production costs associated with alternative production are expected to be
higher due to (intentionally) less efficient use of technology.
Supply management was developed to protect farmers from purchaser market
power by marketing farmers’ products collectively. However, alternative
products differ in ways that make collective marketing largely irrelevant, since
direct interaction with purchasers (rather than protection from them) is
essential. Today, when many commodity products in supply management face
stagnant growth but demand for alternative products is growing rapidly, the
current system is inflexible and limits consumer choice.
In this environment, supply management is not effectively making room for
new producers interested in alternative production. Additionally, new producers
struggle with barriers to entry into a market in which they want to operate at a
relatively small scale and do their own marketing. Supply management is
oriented to marketing commodities through a single channel to protect farmers
from customers and targets relatively homogeneous farms supplying
homogenous commodities. Reconciling these differences is challenging, as some
options that clearly benefit specialty production could disadvantage the supply-
management system and vice versa.
The first step in resolving these latent conflicts is recognizing the differences
and needs of new producers supplying alternative products and producers
supplying commodity products.

New Farmers and Alternative Markets Within the Supply Managed System 37
Appendix 1: Broiler Quota Exemption and Minimum Quota Requirements
Province Exemptions from Quota
Minimum Quota Holding Requirements
Cost of Quota
Definition of Quota Unit
British Columbia Personal Use: 200 chickens. Small Lot: 3,000 kg live weight.
No minimum.10 An estimate of $56/unit was provided.11
One unit of quota equals 1.929kg/production cycle.12
Alberta 2,000 chickens/year. There is an exemption for a communal group quota of 6,000 birds/yr.
No minimum13 In 2009 average quota price has been $82 per unit.14
1unit=8 x 0.4 x 0.7358 x percentage utilization, which is approx. 2.3 kg per cycle (6.5 cycles per year).15
Saskatchewan 999 birds/year.16 There is an exemption for communal group quota (e.g. Hutterite Colonies) of 5,000 birds/yr.
The Order states that the Board shall not grant a new license to a producer with less than 38,940 kg/lw per cycle (38,940 kg / 1.77 kg per bird = 22,000 birds per cycle).17
$42–$45/bird based on a 1.77kg bird. However, there is not a formal recording of this value and this is an estimate based on what has been heard throughout the industry.18
One unit of quota equals 11.51 kg/year.19
10 BC Chicken Marketing Board, General Orders, Section 35.1. 11 Personal communication, BC Chicken Marketing Board, September 3, 2009. 12 BC Chicken Marketing Board, General Orders, Section 1: Definitions. 13 Personal communication, Alberta Chicken Producers, June 25, 2009. 14 Personal communication, Karen Kirkwood, General Manager, Alberta Chicken Producers, August 31, 2009. 15 Personal communication, Karen Kirkwood, General Manager, Alberta Chicken Producers, August 31, 2009. 16 Chicken Farmers of Saskatchewan, FAQ webpage. http://www.saskatchewanchicken.ca/newsletters--more/faq.aspx 17 Personal communication, Clinton Monchuk, CEO, Chicken Farmers of Saskatchewan, June 25, 2009. The order also states that the Board can give a license for less quota if they deem it in the best interests of the industry. The CEO of CFS says it is in the best interests of the industry and has allowed the transfer of quota in smaller amounts. 18 Personal communication, Clinton Monchuk, CEO, Chicken Farmers of Saskatchewan, August 24, 2009. 19 Chicken Farmers of Saskatchewan. About Us Webpage. http://www.saskatchewanchicken.ca/about-us.aspx

New Farmers and Alternative Markets Within the Supply Managed System 38
Manitoba20 999 birds/year.21 30,000 kg/cycle; on average 15,000 birds/cycle with 6-7 production cycles per year.
During the last few exchanges of quota, the price paid has ranged from $38–42/kg.
One unit of quota means a basic allotment equal to 1 kg of chicken broiler of a category.22
Ontario Small Lot: 300 birds23
Must purchase 14,000 units.24 This is roughly an operation with 14,000 birds/cycle. The Board accepts applications for less than the minimum on a case by case basis – two applications were approved in 2003.25
$74/quota unit.
One unit of quota is roughly 13 kg/year.26
Quebec 100 birds.27
New Brunswick28 200 birds No minimum Not able to provide an estimate.
There is no specific definition of a quota unit, but one quota unit equals 1 kg live weight.
Nova Scotia29 200 birds.30 Minimum base quota of 235,000 kg lw/year to purchase to enter the industry and get a license (235,000 kg/2kg/6.5 production periods = roughly 18,077 birds per cycle).
The Chicken Farmers of Nova Scotia purposefully does not record or pay attention to the price of quota.
There is no specific definition of a quota unit. But one quota unit equals one kg live weight.
20 Personal communication, Karen Armstrong, Assistant Manager, Manitoba Chicken Producers, September 10, 2009. 21 Manitoba Chicken Broiler Producer Registration Order. Regulation 53/2005. 22 Manitoba Chicken Broiler Quota Order. Regulation 228/2006. 23 Chicken Famers of Ontario. Regulation No. 2228-2008 Small Flock and Farm Gate Marketing. 24 Chicken Farmers of Ontario, Quota Policy No. 170-2005. 25 BC Ministry of Agriculture, Food and Fisheries 2004. 26 Personal communication, Frank Fortuna, Chicken Farmers of Ontario, June 25, 2009. 27 BC Ministry of Agriculture, Food and Fisheries 2004. 28 Personal communication. Louis Martin, Chicken Farmers of New Brunswick, June 25, 2009/September 4, 2009. 29 Personal communication, Shelley Acker, General Manager of Chicken Farmers of Nova Scotia, September 2, 2009. 30 Chicken Famers of Nova Scotia Regulations. Section 9(2).

New Farmers and Alternative Markets Within the Supply Managed System 39
PEI 500 birds.31
Newfoundland32 99 birds. No minimum. Quota is not sold and purchased in NL.
1 quota unit equals 1kg of chicken.
31 Maritime Certified Organic Growers 2002.“Organic Poultry – Meat Birds.” 32 Personal communication, Ron Walsh, Newfoundland and Labrador Chicken Producers, June 25, 2009 and September 2, 2009.

New Farmers and Alternative Markets Within the Supply Managed System 40
Appendix 2: Layer Quota Exemption and Minimum Quota Requirements
Province Exemptions from Quota
Minimum Quota
Holding Requirements
Cost of Quota Definition of Quota Unit
British Columbia
Personal Use: 99 layers. Small Lot: 100–399 layers. The Board will limit the total small lot amount to 10,000 layers/yr, therefore a producer must apply to this program. Priority for this program was given to producing specialty eggs such as organic, free- range, free-run in regions outside the lower mainland.33 If required a waiting list for the Small Lot program will be started.
No minimum.34 One quota unit is equal to one layer.
Alberta35 300 layers.36 No minimum beyond 300 layers.
2009 Transfer Statistics show that laying hen quota is selling for on average $182.67 (<1,000 hens) and $180.25 (>1,000 hens).
One quota unit is equal to one layer.
Saskatchewan 299 layers37 No minimum.38
33 BC Egg Marketing Board Standing Order: Section 2: Licensing and Records of Exemption. 34 Personal communication, BC Egg Marketing Board, June 25, 2009. 35 Personal communication, Christina Robinson, Producer Services Coordinator, Alberta Egg Producers, June 26, 2009. 36 http://www.eggs.ab.ca/egg_industry/factsoneggindustry.htm 37 Bendig, E. 2002. Review of Saskatchewan Egg Producers Marketing Plan Regulations and Operations. 38 Personal communication, Saskatchewan Egg Producers, June 25, 2009.

New Farmers and Alternative Markets Within the Supply Managed System 41
Manitoba 99 layers. 499 layers: Designated Small Non-Registered Certificate.39 These certificates were grandfathered when the Board decided to lower the exemption to 99, therefore they have limited transferability. When a producer retires, his/her certificate can come up for auction.40
500 quota units.41
Between July 2008 and July 2009 laying hen quota on the Quota Exchange sold for $135.55–$140.99.42
One quota unit is equal to one layer.43
Ontario44 Small Lot: 100 layers for own use or farm gate sales.45 If graded, the eggs can be sold anywhere. “There are some quota-exempt producers with flocks of 500 because they were ‘grandfathered’ into the current regulation.”46
No minimum. Laying hen quota is currently being sold for about $170/unit.
One quota unit is equal to one layer.
Quebec47 100 hens48 No minimum. Quebec has an auction for layer quota. At the last auction on August 31, 2009, quota was sold for $250.
One quota unit is equal to one bird which is equal to approximately 24.99 dozen/yr.
New Brunswick 199 hens49 No minimum.50 Not able to provide an estimate.
One quota unit is equal to one layer.51
39 Manitoba Egg Producers. http://www.mbegg.mb.ca/industry_producer.html 40 Personal Communication, Penny Kelly, General Manager, Manitoba Egg Producers. 41 http://www.eggs.mb.ca/industry_producer.html 42 http://www.eggs.mb.ca/industry_quota.html. 43 Manitoba Laying Hen Quota Order. Definitions. http://web2.gov.mb.ca/laws/regs/pdf/f047-128.98.pdf 44 Personal communication, Harry Pelissero, General Manager, Egg Farmers of Ontario. 45 Chicken Farmers of Ontario. Regulation No. 2228-2008 Small Flock and Farm Gate Marketing. 46 Stoneman, D. 2006. 47 Personal communication, Serge Lebeau, Fédération des producteurs d'oeufs de consommation du Québec (FPOCQ), September 10, 2009. 48 BC Ministry of Agriculture, Food and Fisheries 2004. 49 Order 1 New Brunswick Egg Marketing Board. http://www.nbegg.ca/images/orders%20english.pdf 50 Personal communication, New Brunswick Egg Producers, June 26, 2009. 51 Personal communication, New Brunswick Egg Producers, September 2, 2009.

New Farmers and Alternative Markets Within the Supply Managed System 42
Nova Scotia52 99 hens No minimum purchase
Not able to provide an estimate.
One quota unit is equal to one layer.
PEI53 299 No minimum purchase
The last quota that was offered for sale was sold for $130.01/unit.
One quota unit is equal to one layer.
Newfoundland 9954
52 Personal communication, Nova Scotia Egg Producers, September 2, 2009. 53 Personal communication, Michael Cummiskey, General Manager, Egg Producers of PE., June 30, 2009. 54 Maritime Certified Organic Growers 2002, “Organic Poultry – Eggs.”

New Farmers and Alternative Markets Within the Supply Managed System 43
Appendix 3: Turkey Quota Exemption and Minimum Quota Requirements
Province Exemptions from Quota
Minimum Quota Holding Requirements
Cost of Quota Definition of Quota Unit
British Columbia55
Personal Use: 50 turkeys Direct Vendor Permit: 300 poults.56
No minimum. Not able to provide an estimate.
One unit of quota is equal to one kilogram of turkey.
Alberta57 300 turkeys.58 No minimum. The BC Turkey Producers estimate that turkey quota is currently selling for $4–$7/kg.
One unit of quota is equal to one kilogram of turkey.
Saskatchewan59 99 turkeys.60 No minimum. This changed from a minimum of 113,000 live kg/yr so that smaller operators could get into the business.
Estimated to be between $4.00– $4.75 per live kg.
One unit of quota when being purchased is equal to one live kg.
Manitoba61 99 turkeys/year.
Minimum requirement for a registered producer is 60,000 kg/yr.
The MTP set a price for quota every year based on the Bank of Canada Consumer Price Index. In 2009, the price was set at $3.08/kg.
One unit of quota is equal to one kilogram of turkey.
55 Personal communication, Michel Benoit, BC Turkey Producers. June 30,2009 and September 3, 2009. 56 Application for Direct Vendor Permit for the 2009/2010 Quota Year. http://www.bcturkey.com/publications/direct-vendorlicenseapplication.pdf 57 Personal communication, Jordan Broom, Marketing and Communications Coordinator, Alberta Turkey Producers, June 26, 2009 and September 3, 2009. 58 Alberta Regulation 113/98. Turkey Marketing Regulation. 59 Personal communication, Rose Olsen, Saskatchewan Turkey Producers’ Marketing Board. September 9, 2009. 60 Saskatchewan Turkey Producers’ Marketing Board Regulations. Order No. 02/02 Exemptions. 61 Personal communication, Helga Wheddon, General Manager, Manitoba Turkey Producers, September 2, 2009.

New Farmers and Alternative Markets Within the Supply Managed System 44
Ontario62 50 turkeys/year.
Minimum purchase is 2,000 kg per year. “Any person can ask for permission to buy less than the minimum required in any commodity; however they would have to ask permission in person before the Board and have a list of reasons to do so.”
Industry sources state that currently quota is valued at $7.00/kg.
TFO does not describe quota in units as in chicken and layers. Quota is by the kilogram per year and category of quota. For example, broilers average 5kg, hens average 7.6kg and toms average 15kg all live weight.
Quebec 25 birds/year.63
New Brunswick 25 birds/year. No minimum purchase.64
Nova Scotia65 25 birds/year.66 Minimum purchase is 75,000 kg live weight.
Not able to provide an estimate.
One unit of quota equals 4.76 kg live weight.
PEI N/A
Newfoundland N/A
62 Personal communication, Greg Morrison, Senior Field Inspector, Turkey Farmers of Ontario, September 30, 2009. 63 Personal communication, Sateesh Singh, Canadian Turkey Marketing Agency, June 26, 2009. 64 Personal communication, Chicken Farmers of New Brunswick, June 25, 2009. 65 Personal communication, Sonya Lorette, General Manager, Nova Scotia Turkey Producers Marketing Board, July 8, 2009. 66 Nova Scotia Turkey Producers’ Marketing Board Regulations. Section 10.

New Farmers and Alternative Markets Within the Supply Managed System 45
Appendix 4: Dairy Minimum Quota Requirements
Province Minimum Quota Holding
Requirements Cost of Quota
British Columbia 1,500kg/yr = 4kg/day67 $105/kg b.f./day = $38,325/yr
Alberta No minimum purchase, in the past you could lease quota. Alberta is in the process of changing to a Continuous Quota Model like ON, QC, and the Maritimes.68 Alberta allows farmers to produce and process up to 50L/day without quota.69
$90.10/kg b.f./day = $32,887/yr
Saskatchewan No minimum purchase requirements.70 $87.00/kg b.f./day = $31,755/yr
Manitoba 1 kg/day. $25,100/kg b.f./day
Ontario 10 kg/day.71 $28,300/kg b.f./day
Quebec 10 kg/day.72 $24,001/kg b.f./day
New Brunswick 10 kg of daily quota.73 $25,800/kg b.f./day
Nova Scotia Currently no minimum quota holding requirement, but starting August 1, 2009 this will change to 10kg/day. Any current producers under this will be grandfathered but new producers will require this minimum.74
$28,100/kg b.f./day
Prince Edward Island
A registered dairy producer must own a minimum of 0.1 kg of daily quota. In order for a producer to receive payments for milk deliveries on a two-week basis, a minimum of 5.0 kg of daily quota must be owned. The Board is considering changing the 5.0 kg minimum to 10.0 kg, but it has not been changed yet.75
$30,000/kg b.f./day
67 Personal communication, British Columbia Milk Producers, July 8, 2009. 68 Personal communication, Mike Southwood, General Manager, Alberta Milk, July 9, 2009. 69 Alberta Agriculture and Rural Development. 2003. Farm Direct Sales: Know the Regulations. Retrieved on September 30, 2009. http://www1.agric.gov.ab.ca/$department/deptdocs.nsf/all/agdex3485 70 Personal communication, Fonda Herman, Dairy Farmers of Saskatchewan, September 2, 2009. 71 Dairy Farmers of Ontario. DFO Policies, August 1, 2009. 72 Personal communication, Brian Cameron, General Manager, Dairy Farmers of Nova Scotia, July 9, 2009. 73 Dairy Farmers of New Brunswick, Daily Quota Order, Order 2009-04, Section 5, June 1, 2009. 74 Personal communication, Brian Cameron, General Manager, Dairy Farmers of Nova Scotia, July 9, 2009. 75 Personal communication, Dairy Farmers of PEI, July 8, 2009.

New Farmers and Alternative Markets Within the Supply Managed System 46
Appendix 5: New Entrant Programs for Supply-Managed Products
The following section lists some of the entrant programs for supply-managed
products across various provinces. The information was either taken directly
from the source literature or obtained through interviews.
British Columbia
BC Broiler Hatching Egg Commission
This new entrant program is funded by assessments on quota transfers. If
quota is transferred between producers, a 5% levy is taken by the Board (unless
the transfer occurs between family members or due to business reorganization).
Once the Board has built up a reserve of 5,000 units, then a new entrant is
chosen from a list of new producers looking to enter the market. This program
started April 1st, 2006.
BC Chicken Marketing Board
The New Entrant Program for Growers was implemented on January 1,
2005. The Board may issue quota to an applicant in any amount not exceeding
7,716 kg live weight per eight-week cycle. There are three geographic chicken-
producing areas in BC, and there is a new entrant list for each one. For each new
entrant list, there is a Primary Quota list and a Specialty Quota list. The current
lists show that, in two of the geographical areas, the number of producers
waiting for specialty quota is greater than the number waiting for conventional
quota.
BC Egg Marketing Board76
Programs for New Entrants are established as follows (from Section 7t):
(i) The Board may use the Market Responsive Allocation Pool (MRAP) of
quota that is set aside to allow, subject to FIRB approval, existing
TRLQ & Special Permit holders to increase to 5,000 layers if they so
wish, and to facilitate the New Entrant programs and the growth of
existing producers.
76 This information was taken directly from the BC Egg Marketing Board Standing Order, Section 7: Quota System.

New Farmers and Alternative Markets Within the Supply Managed System 47
(ii) There must be an identified market need that is not currently being
filled.
(iii) Subject to Section 2(k)(vii), invitations to acquire quota will be by New
Entrant Draw, subject to priority to meet unfilled specialty market
demand with priority being given to New Entrants outside the Lower
Mainland.
(iv) The new entrant must provide a business plan to the Board, in a form
acceptable to the Board, and be in operation within one year of
receiving the invitation to acquire quota.
(v) Business plans, in a form acceptable to the Board, must include the
product to be produced, the market requirement as indicated by a
grader agreement, and a demonstration of financial commitment.
(vi) Each year the BCEMB will issue an amount of New Entrant Quota to a
minimum of two New Entrants. Priority will be given to the New
Entrant Specialty Layer Program including producers willing to
produce new and innovative specialty products. New Entrant quota will
be issued on a graduated basis:
• 0–2yrs: up to 1,000 layers
• 3–5yrs: up to 1,000 additional layers
• 6–7yrs: up to 1,000 additional layers
(vii) The New Entrant must be actively engaged in the business of farming
and operate independently including:
• having the birds housed on the New Entrant's own property
• personally keeping and maintaining the birds
• providing a Statutory Declaration that their business is not
being financed by and the birds will not be kept or maintained
by any other person
(u) New Entrant Regular Layer Program: A program for New Entrants
wishing to produce for the non-specialty egg market. Persons wishing to
qualify for entry must meet the conditions in Section 7 (t).
(v) New Entrant Specialty Layer Program: A program for New Entrants
wishing to produce for the specialty egg market. In addition to the
conditions in Section 7 (t), the following conditions must also be met:
(i) There must be an identified specialty market need that is not currently
being filled.
(ii) The producer must meet the criteria defined under Section 7(p).
(iii) A producer must be 3rd party certified. Revocation may result from
loss of certification. If a producer loses certification, the Board may, at
its sole discretion revoke that producer’s New Entrant Specialty Layer
Quota. Note: Temporary loss of certification due to uncontrollable
circumstances such as having to use restricted remedies to protect the

New Farmers and Alternative Markets Within the Supply Managed System 48
welfare of an organic flock (when no effective organic treatment exists)
would not result in the revocation of specialty product quota.
(w) New Entrant Draw: As part of the BCEMB programs for New Entrants the
Board will from time to time make available New Entrant Quota through a
New Entrant Draw. The Draw will be operated with the following criteria:
(i) Eligibility for new entrant status includes:
• residency in BC.
• not having previously been a quota holder past or present, of
supply-managed quota, egg or any other type, and is not a
spouse of quota holder, past or present.
• a commitment by the applicant to be actively involved in the
farming operation.
(ii) The Draw will be operated by an independent third party.
(iii) There will be a non-refundable fee to participate of $250.
BC Milk Marketing Board77
Two new organic milk producers came on board in 2007–2008, but increased
demand by processors was greater. Therefore, the Board had to issue a
substantial sleeve for specialty milk production. In addition, more organic milk
producers were scheduled to start in 2008–2009. The Board expects to operate
a specialty milk pool soon to deal with this demand.
Graduated Entry Program
The Board has committed to invite three new entrants to the industry
annually. The priority will be to those producers who will produce specialty
products and to those outside of the Fraser Valley. When the Board invites a new
entrant, that entrant will receive 5,000 kg of quota. If that new entrant then
purchases an additional 2,000 kg of quota over the first five years, the Board will
match that acquisition. Currently, there are 74 persons on the waiting list for the
GEP (July, 1, 2008). Therefore, if three new entrants are allowed into the
industry annually, it will take 25 years for the last person on the list to get into
the industry.
Cottage Industry Program78
The Cottage Industry Program (CIP) was introduced as a means of allocating
temporary quota to a start-up producer/processor who wishes to produce milk
and process it into a manufactured milk product (excluding fluid milk) on the
farm.
77 http://www.milk-bc.com/calendar_news/index.php/download/639/0808co.pdf Schedule 1. 78 http://www.milk-bc.com/calendar_news/index.php/download/639/0808co.pdf Schedule 2.

New Farmers and Alternative Markets Within the Supply Managed System 49
The Board has agreed to provide for the establishment of one new CIP
producer annually. The CIP entrant will receive up to 10,000 kg of total
production quota or specialty total production quota (organic production).
BC Turkey Marketing Board
New Entrant Program
The Board will make available 30,000 kg of quota per year for two new
entrants to join the industry (15,000 kg of quota each). The Board restricts when
the new entrants can sell or transfer this quota. The priority is for those persons
planning to grow specialty turkey products (new, innovative products), followed
by certified organic turkey, followed by marketing in local/regional markets, and
lastly commercial, conventional turkey. In 2007, two new growers entered the
market under the New Entrant Program. Eleven producers remain on the new
entrant list. Of these, two want to produce only organic and five want to produce
both organic and commercial turkey. If two new entrants are offered quota every
year, it will take six years for the last person on the list to obtain quota.
Alberta
Alberta Egg Producers
Market Development Leasing Program for Organic Egg Production
The following is taken directly from the Operating and Policy Procedure 9.12
provided by the Alberta Egg Producers.
The program is aimed at promoting and facilitating certified organic egg
production and providing access for persons wishing to enter the industry. The
goal is to allow existing and new certified organic egg producers in Alberta to
accumulate purchased quota in a relatively short period of time.
The Board will set aside 5,000 birds of its next quota increase for lease to
certified organic producers.
The maximum number of birds for lease from this program is
1,000/production facility (legal land location).
Leases will be available on a first come, first served basis providing all
eligibility requirements have been met.
Eligibility Requirements
Certified Organic Producers who apply for lease must qualify for license and
become registered producers under the Board’s Plan/Regulation.

New Farmers and Alternative Markets Within the Supply Managed System 50
The producer must be certified for organic egg production by a recognized
certifying body and must provide a copy of a valid current organic certification
certificate annually as proof of certification.
The producer’s facilities must be located in Alberta.
The producer must maintain 100% of eggs being sold as certified organic.
Responsibilities of the Lessor and Lessee
1a. The Board will offer an initial lease term to a maximum of 3 years. During
the initial term (up to a maximum of three years), a lease rate of $3.65/hen/year
applies.
1b. Payment for the lease must be made to the AEP at least once per month as
a minimum.
2a. The lease is renewable on an annual basis at the current market average
lease (calculated as the previous 6 months weighted average lease rate for all
quota).
2b. The maximum amount of time the Board will lease quota under the
program is 7 years from the date of first lease.
The lease payments will be used by AEP to help defray the administrative costs
of the program (i.e. administration fund).
The lessee may terminate the lease upon 30 days notice and verification of
disposal.
In the event that the producer loses his/her organic certification or fails to sell
100% percentage of his eggs to the organic market, the AEP reserves the right to
cancel the lease in the event that the lessee is in contravention with policy
and/or Regulation.
Reporting Requirements
The producer will be expected to report the total number of eggs being
produced and a breakdown of how many are sold as certified organic and other
on a form developed by the AEP.
Manitoba
Dairy Farmers of Manitoba
New Entrant Program & Top-Up Program79
Annually, DFM will award successful applicants in the two programs with 15
kg of daily butterfat quota. This loaned 15 kg of quota must be added to an
79 Personal Communication, Dairy Farmers of Manitoba, July 9, 2009.

New Farmers and Alternative Markets Within the Supply Managed System 51
additional 15 kg of quota which the candidate must obtain through the
provincial quota exchange.
The allocated 15 kg of quota must be returned to DFM in three instalments at
the end of each dairy year in the 5th, 6th and 7th years of the program
This program has recently been updated. In the past, new entrants were
required to hold 12 kg of quota and would be loaned another 12 kg.
Manitoba Egg Producers
New Entrants Policy
When the Board receives allocated “overbase” quota, the Board sets aside 50%
of it and accumulates it. Once it reaches 6,000 units (approximately equal to
6,000 layers) new entrants can apply to receive it. Applicants are chosen by a
draw by a third party.
Since this program has been in place, all of the new entrants who received this
quota have expanded their operations.
Ontario
Dairy Farmers of Ontario80
New Entrant Quota Assistance Program
DFO launched this new program on April 30, 2009.
Successful applicants will be loaned a maximum of 12 kg of quota, which they
must match by purchasing 12 kg of quota. This means that a new farmer under
the program would be starting with between 25 and 30 cows.
Applications must include a business plan verified by a chartered accountant
and a letter from a lender agreeing to finance the operation outlined in the plan.
The program is set up to accommodate 10 new dairy farmers, who will be
loaned quota for 18 years. If there are more than 10 applicants per year, a third
party will conduct a random draw for all applicants that meet the program
criteria.
80 Dairy Farmers of Ontario. “Dairy Farmers of Ontario announce program to assist new dairy farmers.” April 30, 2009.

New Farmers and Alternative Markets Within the Supply Managed System 52
Quebec81
Quebec Egg Producers
The Fédération des producteurs d’œufs de consommation du Québec (FPOCQ
– Quebec Egg Producers) offers one free lifetime quota loan for 5,000 layers
every year. This quota is transferable only to one’s children. Regions with lower
egg- production density are advantaged.
How the Program Works
Applicants to FPOCQ Start-up Assistance Program for new egg producers must:
• be between 18 and 40 years of age
• intend to start a new egg-production operation in which they will be
fully involved
• live in Quebec and be permanent residents of Canada
• have a college-level education in agriculture or management
• have at least one year of work experience on a farm
• complete a business plan approved by a financial institution, covering
financial, technical, and environmental aspects
• demonstrate that the project meets environmental regulations
• have never owned quota in any agriculture production under supply
management or been a shareholder of a farm using quota
• not be an immediate family member of someone holding egg quota or
owning a layer farm
Quebec Poultry Producers
Les Éleveurs de volailles du Québec (Quebec Poultry Producers) give 50 m2 or
100 m2 of broiler quota to any new producer aged 18 to 40 who has never owned
more than 150 m2 of quota over more than five years. To get 50 m2, the
applicant must purchase 150 m2 or own 20 per cent of the farm. To get 100 m2,
the applicant must purchase 300 m2. The free quota comes from a reserve in
which les Éleveurs de volailles du Québec put 5% of the five-year average of
annual new quota allocations to Quebec by Chicken Farmers of Canada each
year.
Quebec Milk Farmers
The Fédération des producteurs de lait du Québec (FPLQ – Quebec Milk
Farmers) offers a five-kilogram quota loan to young producers joining an
existing farm. After five years, the quota must be reimbursed at a rate of one
kilogram per year. The FPLQ also offers a limited number of 10-kilogram quota
loans towards new milk farms.
81 This information is taken directly from http://www.canadianpoultrymag.com/content/view/1470/38/

New Farmers and Alternative Markets Within the Supply Managed System 53
New Brunswick
New Brunswick Egg Producers
New Entrant Program
Every time the New Brunswick Board receives an increase in allocated quota,
they put aside quota for two new producers (1,000 layer quotas each). Two years
ago, this program was initiated, and they will be providing quota to two more
producers this year. Due to the industry size in New Brunswick, the Board
decided that this size of operation would be good for niche markets and that the
demand was there. The Board advertises and sends any interested party an
information package. Interested parties are asked to come out to a meeting to
meet other chicken producers and ask any questions. If they are still interested
after attending an information session, they can then apply. All applications that
meet the criteria are then put into a draw to determine who gets the quota. One
requirement for the new entrants who receive the quota is that they cannot sell
or lease it for ten years, although they may expand.

New Farmers and Alternative Markets Within the Supply Managed System 54
Appendix 6: Demand for Organic Products
Although data on differentiated markets and products is not regularly tracked,
the Dairy Farmers of Canada and the provincial milk boards do collect organic
milk production data. Therefore, we can use organic milk production and pricing
data82 as a proxy for all differentiated products and compare the demand for
organic milk production to conventional milk production in the supply-managed
pool.
Product demand is indicated by a combination of price and quantity at one
point in time. The points on the graphs below are the years in which the
combination of price and volume occurred. That is, the points show the demand
for the commodity in any given year. Any movement or trend of the points
towards higher volumes and/or higher pricing is a sign of increasing demand.
Conversely, any movement or trend of the points towards lower volumes and/or
lower pricing suggests decreasing demand for the commodity. Finally, any
bunching or lack of movement shows stable or stagnant demand.
Figures 6A to 6C show the production volume/price combinations and the
years in which the combinations occurred since 2000/2001 for conventional
milk and organic milk production in both Canada and Ontario.
Figure 6A shows that processor demand for conventional milk over the last
decade has been stagnant or decreasing. In the last four years, prices have
increased while production has decreased. The demand points are clustered and
show no significant increasing trend. Conversely, Figures 6B and 6C show that
the demand for organic milk across Canada and in Ontario has increased
significantly. Production increased sixfold in Canada over the last decade and
quadrupled in Ontario, while prices increased at the same time. These figures
show that the demand for conventional milk in Canada is relatively stagnant and
maturing while demand for the differentiated product is on the rise.
82 Organic milk prices are not formally tracked by the Dairy Farmers of Canada, but a number of sources (Lotter 2003; AAFC 2006; Anderson 2006; Glauser 2007) state that the premium paid for organic milk over conventional milk ranges between 16% and 22%. Based on these sources, the organic milk price used in Figures 3.4 and 3.5 was the conventional milk price plus a 20% premium.

New Farmers and Alternative Markets Within the Supply Managed System 55
Figure 6A: Conventional Milk Demand, Canada
Source: Canadian Dairy Information Centre, 2009
Figure 6B: Organic Milk Demand, Canadian Production
Source: Canadian Dairy Information Centre, 2009

New Farmers and Alternative Markets Within the Supply Managed System 56
Figure 6C: Organic Milk Demand, Ontario Production
Source: Canadian Dairy Information Centre, 2009

New Farmers and Alternative Markets Within the Supply Managed System 57
Appendix 7: Conventional Broiler Chicken Production Costs
Table 7A: Initial Capital Costs, Broiler Model
Building Size (400x75 sq. ft.) 30,000
Building Cost/sq. ft. $20
Barn Equipment Cost/sq. ft. $6
Stocking Density sq. ft./Bird Shipped 0.649
Quota Unit Capacity 52,189
Quota Value/unit $74
Building Cost $600,000
Equipment Cost $180,000
Quota Cost $3,862,021
Total Initial Capital Required $4,642,021
Table 7B: Major Parameter and Price Assumptions, Broiler Model
Mortality Rate 4.20%
Condemnation Rate 1.25%
Birds Placed/Year 318,664
Weight, kg 2.1
Live Price, $/kg $1.46
Marketed kg 632,724
Total Feed (kg/bird)83 3.59
Average Feed Cost ($/tonne) $384
Chicks ($/bird)84 $0.563
83 Current feed costs, information on total feed requirements, and the feed price were obtained from Wallenstein Feed and Supply. 84 Chick costs were obtained from the Ontario Broiler Hatching Egg and Chick Commission.

New Farmers and Alternative Markets Within the Supply Managed System 58
Table 7C: Broiler Chicken Costs and Returns
Income: $/kg Total ($)
Chicken Sales 1.46 923,777
Expenses:
Chick 0.278 175,664
Feed 0.656 439,298
Catching 0.029 19,407
Utilities 0.044 29,578
Labour 0.041 27,638
Repairs 0.010 6,630
Veterinary 0.004 2,409
Litter 0.004 2,610
Marketing Board Levy 0.016 10,124
Total Variable 1.083 713,357 Contribution Margin 0.377 210,420
Fixed Costs:85
Barn Equipment 0.037 23,311
Barn 0.076 48,146
Total Cost 1.196 784,814
Net Profit 0.264 138,964
85 Fixed costs were calculated using the annuity cost method and assuming a 20-year life for the barn, a 10-year life for equipment, and a 5% interest rate.

New Farmers and Alternative Markets Within the Supply Managed System 59
Appendix 8: Conventional Layer Production Costs
Table 8A: Initial Capital Costs, Layer Model
Building Size (sq. ft.) 20,000
Building Cost/sq ft $20
Barn Equipment Cost/sq. ft. $50
Stocking Density Birds/sq. ft. Placed 3
Quota Units 60,000
Quota Value $/unit $155
Building Cost $400,000
Equipment Cost $1,000,000
Quota Cost $9,300,000
Total Initial Capital Required $10,700,000
Table 8B: Major Parameter and Price Assumptions, Layer Model
Mortality Rate 5.5%
Hens Housed 60,000
Egg Production/Hen (dozen) 27
Egg Price, inclusive of levy, $/dozen $1.37
Marketed Eggs, dozen 1,474,200
Total Feed (kg/bird)86 37
Average Feed Cost ($/tonne) $360
19-week old Pullets ($/bird) $6.00
86 Current feed costs and information on total feed requirements were obtained from Wallenstein Feed and Supply.
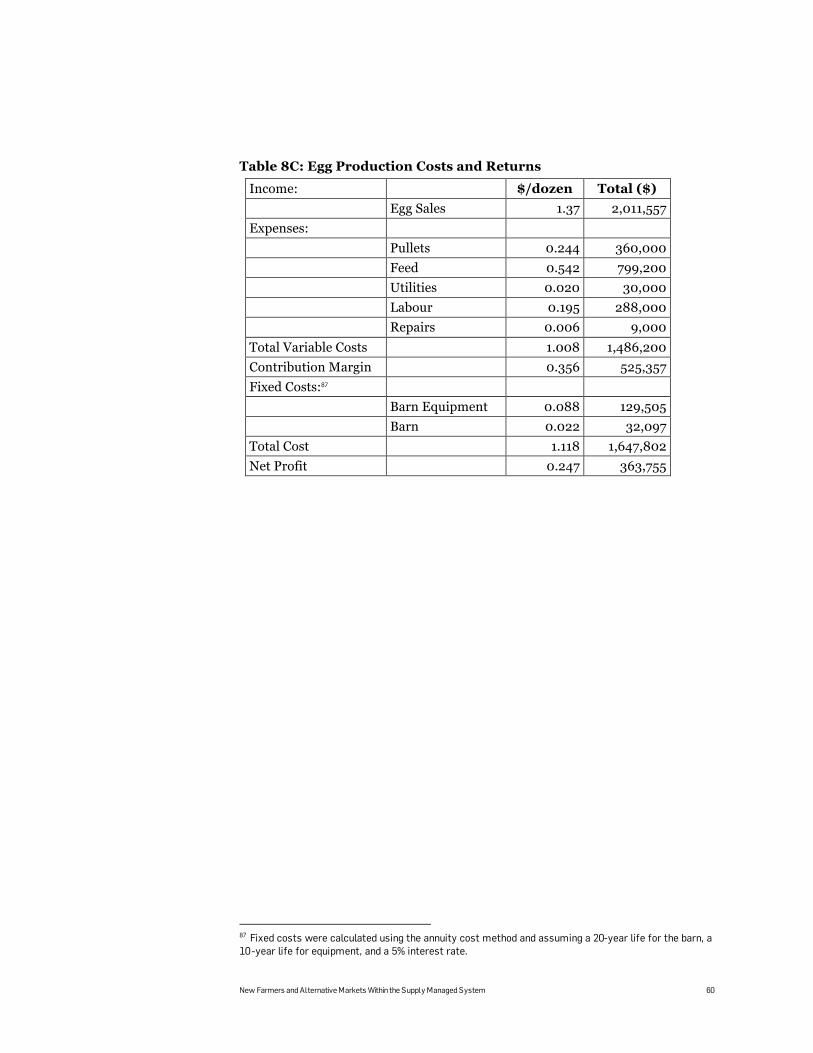
New Farmers and Alternative Markets Within the Supply Managed System 60
Table 8C: Egg Production Costs and Returns
Income: $/dozen Total ($)
Egg Sales 1.37 2,011,557
Expenses:
Pullets 0.244 360,000
Feed 0.542 799,200
Utilities 0.020 30,000
Labour 0.195 288,000
Repairs 0.006 9,000
Total Variable Costs 1.008 1,486,200
Contribution Margin 0.356 525,357
Fixed Costs:87
Barn Equipment 0.088 129,505
Barn 0.022 32,097
Total Cost 1.118 1,647,802
Net Profit 0.247 363,755
87 Fixed costs were calculated using the annuity cost method and assuming a 20-year life for the barn, a 10-year life for equipment, and a 5% interest rate.

New Farmers and Alternative Markets Within the Supply Managed System 61
Appendix 9: Conventional Dairy Production Costs
Table 9A: Initial Capital Costs, Dairy Model
Total Barn and Equipment Cost/stall $6,915
Initial Cow inventory, Dry and In-Lactation, $/head $2,300
Stalls 250
Cows In-Lactation 250
Dry Cows 41
Total Facility and Cow Investment $2,398,244
Milk Production litres/cow 9,417
Butterfat kg/litre milk 3.9
Quota Value $/kg/day $25,500
Total Quota, kg 252
Quota Investment $6,414,849
Total Capital $ 8,813,093
Table 9B: Major Parameter and Price Assumptions, Dairy Model
Milk Test, kg/HL (butterfat/protein/other solids) 3.9/3.3/5.7
Milk Price Received ($/L)88 $0.7572
Feed (kg/cow/day, wet basis):
Corn Silage 47
Corn 5.6
Soymeal 6.3
Vitamin and Mineral 0.3
Labour Wage ($/hour) $14.07
Cow Cull Rate 30%
Replacement Heifers ($/head) $2,300
Other Variable Costs ($/cow/year)89 $1,523
The ration in Table 9B is based on corn silage, corn, and soymeal and satisfies
the National Research Council (NRC) standards for dairy nutrition.
88 Dairy Farmers of Ontario. Producer Milk Prices, December 2008. http://www.milk.org/Corporate/Corp_Mnu_Item.aspx?MenuItem=PrdMilkPrc . 89 Other variable costs were obtained from averages in the 2007 Ontario Dairy Farm Accounting Project.

New Farmers and Alternative Markets Within the Supply Managed System 62
Table 9C presents the results of the above parameters and prices, based on
2008 monthly average values. A double 6 milking parlour configuration is used,
assuming milking 16 hours/day, with the cows milked three times per day. The
labour component assumes 2 full-time employees and one manager. Given the
feed price environment of 2008, total production costs were about $.66/litre,
exclusive of quota. The biggest single component of total production cost was
feed at $.23/litre, followed by other variable costs and non-quota fixed costs.
Table 9C: Milk Production Costs and Returns
Income: $/L Total ($)
Milk Sales 0.757 1,782,638 Expenses: Feed90 0.232 546,186 Labour91 0.094 221,300 Heifer Replacement 0.073 171,860 Other Variable 0.162 381,389 Total Variable Costs 0.561 1,320,735 Contribution Margin 0.127 461,903 Fixed Costs: Total Fixed Costs 0.098 230,717 Total Cost 0.659 1,551,452 Net Profit 0.029 231,186
90 Corn and soymeal are priced at 2008 monthly average values for Chatham and Hamilton for corn and soymeal, respectively. Corn silage is valued at 22.8% the price of corn/tonne, and mineral is valued at $700/tonne. 91 Labour costs were obtained from Human Resources and Skills Development Canada for livestock farm workers in the Waterloo-Perth-Huron region in Ontario. The wages equivalent of managers is assumed to be twice that of labour, and a benefit rate of 15% is assumed.

New Farmers and Alternative Markets Within the Supply Managed System 63
References
Alberta Agriculture, Food and Rural Development. 2009. “Farm Direct Sales:
Know the Regulations.”
http://www1.agric.gov.ab.ca/$department/deptdocs.nsf/all/agdex3485 (date
accessed: September 30, 2009).
Agriculture and Agri-Food Canada. 2006. “Sectoral Profile: Organic Dairy
Industry in Canada.”
http://www4.agr.gc.ca/resources/prod/doc/dairy/pdf/organic_dairy_e.pdf
———. 2007. Sector Profile: Organic Dairy Industry in Canada.
Anderson, F. 2006. “Organic Dairies get Production Incentive: Dairy Farmers of
Ontario is Trying to Encourage More Production to Meet the Demand.” Organic
Agriculture Centre of Canada.
http://www.organicagcentre.ca/MarketInfo/mkt_dairies_ont_of.asp
Biggs, E. 1990. The Challenge of Achievement: The Ontario Milk Marketing
Board’s First 25 Years of Operation – 1965 to 1990. Mississauga: Ontario Milk
Marketing Board.
B.C. Ministry of Agriculture, Food and Fisheries (author: G. Leroux). 2004.
“Recommendations for Managing Specialty Agri-Food Products in B.C.’s Supply
Managed System.”
http://www.firb.gov.bc.ca/reports/sup_decisions/leroux_sp_prod_rep_dec_04.pdf
Canadian Organic Growers. 2005. “Certified Organic Production in Canada.”
http://www.cog.ca/documents/certifiedorganicproduction05E-SUMMARYON.pdf
———. 2009. “Quick Facts on Organics in Canada.”
http://www.cog.ca/about_organics/organic-quick-facts/ (date accessed: May 2010)
Carpio, C.E. and O. Isengildina-Massa. 2008. “Consumer Willingness to Pay for
Locally Grown Products: The Case of South Carolina.” Presented at the Southern
Agricultural Economics Association Annual Meeting, Dallas, TX.
Commission sur l’avenir de l’agriculture et de l’agroalimentaire québécois. 2008.
“Agriculture and Agrifood: Securing and Building the Future. Proposals for
Sustainable and Healthy Agriculture.” Prepared for the Minister of Agriculture,
Fisheries, and Food (Quebec).
Dessureault, S. and K. Grier. 2006. “Canadian Food Retail Industry.” A George
Morris Centre publication prepared for Rabobank International.
Farm Credit Canada. 2009. “Consumer Trends 2009.” Knowledge Insider
Summer 2009. http://www.fcc-fac.ca/en/LearningCentre/Knowledge/doc/KI-
Consumer_Trends_e.pdf

New Farmers and Alternative Markets Within the Supply Managed System 64
Farmers’ Markets Canada. 2009. “National Farmers’ Markets Impact Study 2009
Report.”
http://www.farmersmarketscanada.ca/Upload/file/FMC%20FINAL%20Brochure%
202009-ENG.pdf
Farmers’ Markets Ontario. 2009. “Farmers’ Markets Ontario Impact Study 2009
Report.” Prepared for Farmers’ Markets Ontario.
http://www.farmersmarketsontario.com/Documents/FMO%20Impact%20Study%2
0-%20Overview%20and%20Highlights.pdf
Foodland Ontario. 2009. “The Pick Ontario Freshness Strategy.”
http://www.foodland.gov.on.ca/english/industry/ind-pickont.html (date accessed:
June 28, 2009)
Friends of the Greenbelt Foundation. 2007. Poll conducted by Environics
Research Group.
Glauser, W. 2007. “Organic Farmers Wanted.” Canadian Business Online. April
23.
http://www.canadianbusiness.com/markets/commodities/article.jsp?content=2007
0423_85421_85421 (date accessed: June 29, 2009)
Gooch, M. 2009. “Consumer Data for Farmers and the Agri-Food Industry: The
Complete Chicken Report on National Purchasing Panel Data.” A George Morris
Centre publication prepared for the Chicken Farmers of Ontario.
Holmes, M. and A. Macey. 2008. “Canada’s Organic Market.”
http://www.cog.ca/documents/CdnOrganicMkt2007.pdf (date accessed: March 4, 2009)
International Federation of Organic Agriculture Movements (IFOAM). 2009.
“Global Organic Agriculture: Continued Growth.” Press release.
http://www.ifoam.org/press/press/2008/Global_Organic_Agriculture_Continued_
Growth.php (date accessed: March 4, 2009).
International Food Economy Research Group (InFERG). 2008. “Local Food
Products: Who Buys them and Why?”
http://www.inferg.ca/workingpapers/Food_Panel_Local_Food_15_07_08.pdf
Kohl, D. 2007. “Agricultural Outlook 2008 and Beyond.” Canadian Farm Business
Management Council. Webinar, November 5.
Local Food Plus. 2009. http://www.localfoodplus.ca/about.htm (date accessed:
June 29, 2009)
Lotter, D. 2003. “The Good Life of a Small-scale Ontario Dairy Farmer Depends
on Being Part of a Dynamic Coop.” Kutztown, PA: Rodale Institute.
http://newfarm.rodaleinstitute.org/international/canada_don/ontario/index.shtml
Mallot Creek Strategies. 2008. “Local Food and the Niagara Region: An
Assessment of the Opportunity.”

New Farmers and Alternative Markets Within the Supply Managed System 65
Martime Certified Organic Growers (author: R. Henry) 2002. “Organic Poultry –
Meat Birds.” http://www.acornorganic.org/pdf/poultrymeatprofile.pdf
Martime Certified Organic Growers (author: R. Henry) 2002. “Organic Poultry –
Eggs.” http://www.acornorganic.org/pdf/poultryeggsprofile.pdf
Mestern, H.J. 1972. “The Evolution of Supply Management in the Canadian Dairy
Industry.” Canadian Farm Economics 7 (5) 12–16.
Ontario Farm Fresh Marketing Association. 2005. “On-Farm Marketing in Ontario
2005 Report.” (author: Jayeff Partners) http://www.ontariofarmfresh.com/about-
us/research/on-farm-marketing-in-ontario-2005/
———. 2009. “On-Farm Marketing in Ontario 2009 Report: Benchmarking and
Opportunities Study.” http://www.ontariofarmfresh.com/about-us/research/on-
farm-marketing-in-ontario-2009/
OMAFRA (Ontario Ministry of Agriculture, Food and Rural Affairs). 2008.
“Community Supported Agriculture – A Unique Business Model.” (author: D.
Collins). http://www.omafra.gov.on.ca/english/crops/organic/news/2008-
12a2.htm (date accessed: July 1, 2009)
———. 2009. “Province Invests in Local Food Initiatives. McGuinty Government
Puts Focus on Community Projects.” News release.
http://www.omafra.gov.on.ca/english/infores/releases/2009/070609.htm (date
accessed: July 25, 2009)
Ontario Ministry of Finance. 2008. “Budget 2008: Growing a Stronger Ontario.”
http://www.fin.gov.on.ca/english/budget/ontariobudgets/2008/pdf/papers_all.pdf
Organic Council of Ontario (OCO). 2008. “Ontario Organic Strategic Plan 2008–
2011.” http://www.organiccouncil.ca/download.sz?id=78
Painter, K. 2007. “An Analysis of Food-Chain Demand for Differentiated Farm
Commodities: Implications for the Farm Sector.” Report to Agriculture of the
Middle. Pullman, WA: Washington State University.
Stonemen, D. 2006. “Enforcing the Law on Illicit Producers Who ‘Sell Around’ the
Marketing Boards.” Better Farming. October.
http://www.betterfarming.com/2006/bf-oct/cover.htm
UK Cooperative Extension Service. 2007. “Glossary of Alternative Farming
Production and Marketing Terms.” University of Kentucky (College of Agriculture,
New Crop Opportunities Center).
http://www.uky.edu/Ag/NewCrops/introsheets/growerterms.pdf

New Farmers and Alternative Markets Within the Supply-Managed System Toronto: June 2010 This report was prepared by: FarmStart Published by: George Cedric Metcalf Charitable Foundation 174 Avenue Road Toronto, Ontario M5R 2J1 Phone: (416) 926-0366 Fax: (416) 926-0370 E-mail: [email protected] Website: www.metcalffoundation.com Copyright (c) 2010 by the Metcalf Foundation. This work is made available under the Creative Commons Attribution-Non-Commercial-No Derivative Works 2.5 Canada License. To view a copy of this license, visit http://creativecommons.org/licenses/by-nc-nd/2.5/ca/ Copies of this report can be downloaded from our website.