New Evidence on Classroom Computers and Pupil …ftp.iza.org/dp362.pdfIZA Discussion Paper No. 362...
47
IZA DP No. 362 New Evidence on Classroom Computers and Pupil Learning Joshua Angrist Victor Lavy DISCUSSION PAPER SERIES Forschungsinstitut zur Zukunft der Arbeit Institute for the Study of Labor September 2001
Transcript of New Evidence on Classroom Computers and Pupil …ftp.iza.org/dp362.pdfIZA Discussion Paper No. 362...

IZA DP No. 362
New Evidence on Classroom Computers andPupil LearningJoshua AngristVictor Lavy
DI
SC
US
SI
ON
PA
PE
R S
ER
IE
S
Forschungsinstitutzur Zukunft der ArbeitInstitute for the Studyof Labor
September 2001

New Evidence on Classroom Computers and Pupil Learning
Joshua Angrist MIT, NBER and IZA, Bonn
Victor Lavy Hebrew University
Discussion Paper No. 362 September 2001
IZA
P.O. Box 7240 D-53072 Bonn
Germany
Tel.: +49-228-3894-0 Fax: +49-228-3894-210
Email: [email protected]
This Discussion Paper is issued within the framework of IZA’s research area Project Evaluation. Any opinions expressed here are those of the author(s) and not those of the institute. Research disseminated by IZA may include views on policy, but the institute itself takes no institutional policy positions. The Institute for the Study of Labor (IZA) in Bonn is a local and virtual international research center and a place of communication between science, politics and business. IZA is an independent, nonprofit limited liability company (Gesellschaft mit beschränkter Haftung) supported by the Deutsche Post AG. The center is associated with the University of Bonn and offers a stimulating research environment through its research networks, research support, and visitors and doctoral programs. IZA engages in (i) original and internationally competitive research in all fields of labor economics, (ii) development of policy concepts, and (iii) dissemination of research results and concepts to the interested public. The current research program deals with (1) mobility and flexibility of labor markets, (2) internationalization of labor markets and European integration, (3) the welfare state and labor markets, (4) labor markets in transition, (5) the future of work, (6) project evaluation and (7) general labor economics. IZA Discussion Papers often represent preliminary work and are circulated to encourage discussion. Citation of such a paper should account for its provisional character.

IZA Discussion Paper No. 362 September 2001
ABSTRACT
New Evidence on Classroom Computers and Pupil Learning∗
The question of how technology affects learning has been at the center of recent debates over educational inputs. In 1994, the Israeli State Lottery sponsored the installation of computers in many elementary and middle schools. This program provides an opportunity to estimate the impact of computerization on both the instructional use of computers and pupil achievement. Results from a survey of Israeli school-teachers show that the influx of new computers increased teachers’ use of computer-aided instruction (CAI) in the 4th grade, with a smaller effect on CAI in 8th grade. Although many of the estimates are imprecise, on balance, CAI does not appear to have had educational benefits that translated into higher test scores. OLS estimates show no evidence of a relationship between CAI and test scores, except for a negative effect on 8th grade Math scores in models with town effects. IV estimates for 4th graders show lower Math scores in the group that was awarded computers, with smaller (insignificant) negative effects on language scores. JEL Classification: H41, I28, J24 Keywords: Education, schools, computer-aided instruction, program evaluation Joshua Angrist Department of Economics MIT E52-353 50 Memorial Drive Cambridge, MA 02139-437 Tel.: +1 617 253 8909 Fax: +1 617 253 1330 Email: [email protected]
∗ We thank Rema Hanna, David Matsa, and Analia Schlosser for outstanding research assistance, and the staff in the Chief Scientist’s Office, the Evaluation Division, and the Information Systems Division of the Israeli Ministry of Education for help with data. Thanks also go to the editor, 4 referees, Lex Borghans, Jeff Kling, Alan Krueger, Bas van ter Weel and seminar participants at Berkeley, MIT, SOLE, and the ASSA meetings for helpful discussions and comments. This is a revised version of NBER Working Paper 7424.

“That small miracle can be replicated in every school, rich and poor,across America . . . Every child in American deserves a chance toparticipate in the information revolution.” President Clinton, at theEast Somerville Community School, June 5, 1998.
“We could do so much to make education available 24 hours a day,seven days a week, that people could literally have a whole differentattitude toward learning.” Newt Gingrich talking to the RepublicanNational Committee (quoted in Oppenheimer, 1997).
“Netanyahu explained to a group of politicians and computerprofessionals how he wanted to provide a quarter-million of hiscountry’s toddlers with interconnected computers.” Recounted byMIT computer scientist Michael Dertouzos, September 1998.
Politicians, educators, parents, and researchers have long looked to technology to improve schools. One of
the earliest advocates for technology in the classroom was Thomas Edison, who predicted in 1922 that
motion pictures would revolutionize education and “be an epoch in the common school” (Israel, 1998).
Edison himself funded educational films, though he also complained about lack of teacher interest and high
production costs. In the 1950s Psychologist B.F. Skinner published a series of papers predicting that
“teaching machines” would make learning dramatically more efficient (see, e.g., Skinner, 1954, 1958).
Skinner’s writing reflects a modern-sounding emphasis on “the constant interchange between program and
student” and the value of “home instruction.” Recent years have seen renewed and even more intense
interest in classroom computer use, including interest in the use of computers in schools in less-developed
countries (see, e.g., Anandakirichnan, 1988).
The educational use of computers generally falls under two broad headings. The first is computer
skills training (CST), which teaches students how to use computers. The second is computer-aided
instruction (CAI), which “uses computers to teach things that may or may not have any relation to
technology” (President’s Committee of Advisors on Science and Technology, 1997). CST is essentially
vocational, and includes keyboarding skills, instruction in the use of word processing, database management,
the use of spreadsheets and other software tools, and the study of computer programming.
Basic familiarity with CST skills seems undeniably useful, just as typing was a useful skill taught
in American high schools earlier in the 20th century. But most of the recent interest in the educational use

1Oppenheimer (1997) surveys critical assessments. See also Cuban (1986).
2In 1998, for example, Massachusetts schools bought 40,000 computers, and the StateDepartment of Education urges schools to replace one-quarter of them annually at a cost of $250-$400per pupil (Seltz, 1999). Oppenheimer (1997) identifies some school districts where expenditure oncomputers appears to be crowding out expenditure on music, art, and traditional shop programs.
3Economists have looked at CAI in their own discipline. An early reference on CAI ineconomics teaching is Booms and Kaltreider (1974). Porter and Riley (1992) argue that CAI has notbeen shown to be effective in economics. A recent study by Wenglinsky (1998) using nationallyrepresentative samples finds both positive and negative effects. For other examples and surveys, see,
2
of computers focuses on CAI and not CST. This focus is reflected in the report of the President’s Committee
of Advisors on Science and Technology Panel on Education Technology, in Apple Computer’s “Classrooms
of Tomorrow” project (Baker, Gearhart, and Herman, 1993), and in the growing interest in “distance
learning” in schools and universities. In contrast with the apparent consensus regarding the value of at least
some level of computer literacy, the role of CAI remains controversial. Skinner’s claims notwithstanding,
the theoretical case for CAI is not well-developed, and there are good reasons to believe that computers can
actually be a diversion. One widely-cited proponent of this negative view is Stoll (1995), who compared
computers to the children’s television program Sesame Street, arguing that (p. 147) “Both give you the
sensation that merely by watching a screen, you can acquire information without work and discipline.”1
The question of CAI effectiveness is of much more than academic interest since CAI infrastructure
is expensive and may take resources from other educational uses.2 Perhaps the most important shortcoming
in the case for further investment in CAI infrastructure is the fact that the evidence for effectiveness is both
limited and mixed. Although CAI has been around for decades, there are few empirical studies that meet
a rigorous methodological standard. Many studies are qualitative, gathering impressions from participants
in demonstration projects, or quantitative but with no real comparison group. The results of those studies
that do attempt to compare outcomes between CAI-trained pupils and other pupils are hard to assess. A recent
review by Kirkpatrick and Cuban (1998) catalogs both individual studies and meta-analyses that find wide-
ranging effects.3

e.g., Knight, et al (1981), Kulik and Kulik (1991), Liao (1992), and Cuban (1986, 1993).
4Much of the software used in the program was from the Center for Educational Technology(CET), a private company that accounts for most of the educational software market in Israel. The CETsells educational software in the US and Europe though a number of well-known foreign partners.
3
In this paper, we provide new evidence on the educational consequences of CAI. Our study exploits
an episode in Israel that facilitates controlled comparisons. In 1994, the Israeli State lottery, which uses
lottery profits to sponsor various social programs, funded a large-scale computerization effort in many
elementary and middle schools. By June 1996, about 10 percent of the country’s elementary school pupils
and about 45 percent of the country’s middle schools pupils had received new computers as a consequence.4
We begin the empirical analysis by using this episode to estimate the effect of the new technology on both
teachers’ use of CAI and their pupils’ test scores. Following this “reduced form” estimation of program
impacts, we put the pieces together with two-stage least squares (2SLS) by using Tomorrow-98 deployment
as an instrument for the effect of CAI intensity on pupil achievement.
A variety of unique data sources facilitate our analysis of computers in schools, and allow us to
estimate the effects of CAI effects using a number of statistical methods. In addition to OLS estimates of
the effect of CAI, we use a dummy for program receipt as an instrument for CAI intensity, and we develop
a non-linear instrumental variables estimator that exploits information about applicants’ priority ranking for
program funding as determined by local authorities. These methods show that the influx of new computers
in 1994 and 1995 led to a substantial increase in the use of CAI in elementary schools, with smaller effects
on usage in middle schools. There is no evidence, however, that increased educational use of computers
actually raised pupil test scores. OLS estimates show no relationship between CAI and achievement except
for a negative effect on 8th grade math scores in models with town effects. And the IV results show a
(marginally) statistically significant decline in the test scores in 4th grade Math classes, where the new
computers had the largest impact on instructional techniques.

4
I. Data and background
A. The Tomorrow-98 program
As in the US, many Israeli schools have long had some sort of computer equipment for instructional
use, but the Tomorrow-98 program (in Hebrew, “Mahar”) allowed for a significant upgrade. The main focus
of this program was on the “computerization of the education system”, accomplished by “. . . creating a
supportive environment that can integrate information technologies in a range of activities within the school,”
“training teachers to integrate computers in teaching,” and “equipping schools with hardware and software,
and replacing outdated incompatible equipment” (Israel Ministry of Education, Culture and Sport, 1994, p.
36). The program included significant funding for teacher training as well as hardware and software.
Between 1994 and 1996, the first three years of the program, 35,000 computers were installed in 905 schools.
In 1994, 474 schools received computers and training. In 1995, schools received 16,000 computers through
the program. In 1996, more computers were installed and 2,100 primary-school Math teachers received
training in CAI (Israel Ministry of Education, Culture, and Sport, 1996) . The target student-computer ratio
was 10:1, to be achieved by 1998, the fifth and final year of the program. Most of the funding came from
the Israeli State Lottery, with additional money from the Ministry of Education and local authorities.
Funds for Tomorrow-98 were distributed through an application process. Individual towns and
regional authorities applied for funds by submitting a list of elementary and middle schools to be
computerized, ranked according to the municipalities’ assessment of the schools ability to make good use
of the computers. This generally meant the schools had some sort of pre-existing computer infrastructure
and some “need” and “ability” to make use of the computers. The Ministry of Education used a set of
guidelines to distribute the project money to schools in towns that applied. Priority was given to towns with
a high proportion of 7th and 8th grade enrollment in stand-alone middle schools (as opposed to combined
1-8 schools). After high-priority municipalities received an allocation for their middle schools in a 1:10
computer:pupil ratio, equipment was distributed down the municipalities priority list. In this process, each

5In 1998, there were roughly 2000 primary and 500 middle schools in Israel, of which %36received program computers. Most of the computers were installed in a special classroom or computerlab. Classes used the lab, according to a schedule, that allowed for both computer skills training andcomputer-aided instruction.
5
town received money to computerize their elementary and 1-8 schools in a 1:10 ratio up to a ceiling. The
ceiling was determined by the municipal grade 1-8 enrollment as a proportion of national grade 1-8
enrollment. The first computers funded by Tomorrow were delivered in September, 1994.5
B. Data
The main data source for this study is a test given to pupils attending a random sample of elementary
and middle schools in June 1996. Schools from different sectors (Arab/Jewish) and types (religious/secular)
were sampled, but we look only at Jewish schools (including religious and secular schools). The total
number of Jewish schools sampled was about 200, but only 122 of these applied for Tomorrow-98 program
money. The test was designed and conducted by the National Institute for Testing and Evaluation (NITE),
which runs college admissions testing in Israel.
Test score data were collected as follows: in each sampled school with at least one 4th grade class
(i.e., an elementary school or a 1-8 school), one class was chosen to take a test in Math and one class was
chosen to take a test in Hebrew. Similarly, in schools with 8th grade classes, one class was chosen to be
tested in Math and one class was chosen to be tested in Hebrew. Schools having both 4th and 8th grades (i.e.,
1-8 schools) contribute test scores for both grades. If there were more than two classes in a grade, two
classes were chosen for testing at random, with the subject assignment also randomized. The pupil data
consists of individual records with either a Math or Hebrew score, and pupil demographic data from school
records. The demographic data include age, sex, immigrant status, and special-education status. The tests
are grade-normed achievement tests, with scores measured as percent-right.
The NITE data on test scores is combined with data from a brief survey (also designed by NITE)

6
given to all the teachers of each sampled class. The teachers survey and pupil testing was done at the same
time. Because each 4th or 8th grade class is potentially taught by a number of teachers for a range of subjects
(i.e., Math, Hebrew, Science, Bible), we attempted to identify the principal Math and Hebrew teacher for
each class. Our analysis file uses data on these teachers only; that is, our analysis of Math scores includes
information for a teacher we identified as the main Math teacher for the class.
The teachers’ survey collected information about how teachers teach, including their use of
technology in the classroom, and their views on a variety of issues related to technology, teacher training,
and instructional methods. Data on CAI were collected in the following question:
Which of the following do you use when teaching?
a. xeroxed worksheetsb. instructional bookletsc. gamesd. computer software or instructional computer programse. TV programsf. Other audio-visual materials
Teachers responded to each item using a 4-point intensity scale:
not at all (0)sometimes (1)frequently (2)almost always (3)
The response to item (d) is our measure of CAI. In addition to these survey responses, we asked the Ministry
of Education to collect data on teacher demographic characteristics in a follow-up survey in Spring 1997.
The third component of our data base consists of information on Tomorrow implementation
schedules and computer infrastructure in schools collected for the purposes of our evaluation. In 1998, the
Ministry of Education obtained information from the contractors who installed the Tomorrow computers,
with verification and additional information collected from school principals. This information includes the
date of receipt of new equipment from Tomorrow, the extent and type of pre-1994 computer resources, and
information about non-program computers received between 1994 and 1996. Pre-existing computers are

7
described as either “sophisticated” (IBM XT or better), or “non-sophisticated” (Commodore-type machines).
Schools may have had no computers, non-sophisticated machines, or both types.
The fourth component of our data base contains information about schools in 1996 and 1991. The
1996 data come from Ministry of Education files, and includes the Israeli Pupil Disadvantaged (PD) index
and school size. The PD index is an important summary statistic used to categorize schools and to make
school funding decisions in Israel. The 1991 school-level data comes from the data set used in the Angrist
and Lavy (1999) study of class size. This data set provides information on lagged test scores. In the analysis
of 4th grade scores, we use the 1991 school average Math and Hebrew scores in 4th grade to control for
possible differences in performance across schools. In the analysis of 8th grade scores, we use a less direct
control for lagged scores since we have no early information on 8th grade scores. For 1-8 schools, the 8th
grade lagged scores are those of 4th and 5th graders in these same schools in 1991. For each 7-9 school, the
lagged scores are the averages of the 1991 4th and 5th grade scores from the elementary schools that feed
that school. A data appendix describes the procedures used to match the various data sources in greater
detail.
II. Descriptive statistics and OLS estimates
A. Descriptive statistics
Descriptive statistics are reported in Table 1 for three samples, separately for each combination of
grade and subject. The first sample for 4th grade Math scores consists of 4,779 pupils in 181 schools. This
is the full sample of Jewish 4th graders for whom we have 1996 Math scores. The second sample is limited
to pupils in schools that applied for Tomorrow funds, and includes 3271 pupils in 122 schools. The third
sample is the subset of the applicant sample for which we were able to obtain 1991 score data. This includes
2891 pupils in 107 schools. The three samples for other grades and subjects are organized similarly.
The average 4th grade test score ranges from 67-69 with a standard deviation of around 20. The

6The standard errors for differences in means in Table 2 and the regression estimates in Tables 3-6 are corrected for school-level clustering using equation (1) in Moulton (1986).
8
average 8th grade test score ranges from 57-66, also with a standard deviation around 20. There is little
evidence of differences in test scores across subsamples in any grade/subject category. Other variables
described in the table include an indicator for any use of CAI, and the computer-use intensity ranking, with
a mean of around .8 for 4th graders and .4 for eight graders. This ranking is the main regressor of interest.
The next line in the table shows the mean proportion of applicants that received Tomorrow program funding.
This proportion is .14-.17 for 4th graders and around .5 for 8th graders. The difference by grades reflects
the higher priority given to program funding for middle schools. Descriptive statistics for control variables
and lagged test scores are also shown in the table. The pupil disadvantage (PD) index is measured on a
standardized scale.
In addition to being more likely to get program funding, 8th graders also had the use of program
computers for longer: an average of 13 months versus about 9 months for 4th graders. Still, on average, 4th
graders had the use of computers for a full school year as of the test date in 1996. It is also noteworthy that
almost half of 4th grade and almost two-thirds of 8th grade pupils had access to some sort of computer
technology before the Tomorrow program.
Pupils in schools that use computers for instruction differ in a variety of ways from those that have
little or no usage. This can be seen in Table 2, which reports variable means by computer-use intensity and
Tomorrow program status.6 For both grades, pupils in schools with more intense use of CAI tend to be from
somewhat more disadvantaged backgrounds, though these differences are not all significant. This may reflect
a general tendency in the Israeli school system to direct resources and programs to schools on a remedial
basis (Lavy, 1995). Among 4th graders, heavier computer users are also more likely to have had some
(relatively) sophisticated computer equipment before 1994. Eighth graders tested in Math were less likely
to have had sophisticated computers but more likely to have had unsophisticated computers. There is no
9
relationship between the presence of previous computer equipment and computer use for 8th graders tested
in Hebrew. This may be because 8th grade schools were already relatively well-equiped, though it should
also be noted that the “previous computers” measures are retrospective reports by principals that may not
be very accurate. Lagged test score differences by CAI status are not significant.
Since our primary identification strategy uses Tomorrow-98 as a source of exogenous variation in
computer use, differences by Tomorrow-98 program status are more important for our purposes than
differences by computer-use. Fourth grade program participants are more likely to be disadvantaged, but this
difference is significant only for schools tested in Hebrew. Moreover, this is reversed for 8th graders. These
relationships are broadly consistent with features of the selection process for Tomorrow-98 funding that were
described to us. Among 8th graders, middle schools received priority over 1-8 schools; in Israel these
schools tend to be located in better areas. Among 4th graders, some preference was given to schools with
a higher proportion of disadvantaged students. In any case, it is clear that control for pupil background and
school type may be important when attempting to estimate the effect of the program. Another noteworthy
difference is an increased likelihood of having pre-program access to relatively sophisticated computers
among program participants, both in 4th and 8th grade.
Among 4th graders, there is little evidence of a difference in 1991 test scores by Tomorrow-98
program status, while for 8th graders the differences are positive and somewhat larger. Except for the scores
of 8th graders tested in math, however, none of the contrasts in lagged scores by program status is significant.
The similarity of lagged test scores between program and non-program groups increases the likelihood that
post-treatment differences in test scores are actually caused by T-98.
B. CAI and test scores
The estimation framework is based on a regression model, meant to capture the causal effect of
computer use for those whose usage was affected by the Tomorrow program. For the ith student in school

7Estimates for 4th graders control for sex, immigrant status, special education status, schoolenrollment, the pupil disadvantage index, whether schools had simple or sophisticated computers before1994, and the school priority ranking in the Tomorrow-98 allocation process. Estimates for 8th gradeHebrew scores include these controls plus dummies for school type. Estimates for 8th grade Math scoresomit controls for immigrant and special education status. Towns with only one school are dropped fromthe sample when town effects are included and the town-effects sample is not limited to applicants.
10
s, we assume that potential test scores with alternative levels of CAI are given by:
yis = WsNγ + XiNβ + cjsα + ηs + εis (1)
where yis is the test score for pupil i in school s, Ws is a vector of school characteristics, and Xi is a vector
of pupil characteristics. The regressor of interest, cjs, is either a dummy indicating whether the level of
computer-use intensity is greater than or equal to j (j=1,2,3), or the intensity ranking itself, which we denote
cs. The intensity ranking is coded from our teacher survey. Since all pupils tested in the same subject and
grade have the same teacher, in practice cjs and cs vary only with s. The other school characteristics, Ws,
include the proportion of disadvantaged pupils in the school and the school’s priority ranking in the
Tomorrow-98 allocation process. The pupil characteristics, Xi, include sex and immigrant status. The error
term ηs is an i.i.d. random school effect that is introduced to parameterize within-school correlation in scores.
The remaining error component, εis, is specific to pupils. The coefficient, α, is the parameter of primary
interest. The empirical analysis uses test scores in standard deviation units, so the estimates of α have an
‘effect size” interpretation.
Fourth graders in schools where teachers report using more CAI have slightly higher Math scores,
but there is less evidence of an association between CAI and 4th grade Hebrew scores. This can be seen in
Table 3, which reports OLS estimates of the relationship between CAI intensity and test scores for
applicants, for applicants with test score data, and for a sample of pupils in large towns. This last sample
is used to control for town fixed effects, and includes any pupil (whether or not their school applied for
Tomorrow funds) living in a town with at least two schools.7 Each row in the table shows results from a
different regression, according to whether the regressor of interest is a dummy variable or the intensity

11
ranking itself. For example, 4th grade applicants with CAI$1 (some use of CAI) have scores .045 above those
with no use of CAI, while the model with an ordinal regressor shows that a one unit increase in intensity is
associated with .047 higher scores. But the positive effects for 4th grade Math scores are not statistically
significant in the applicant samples, and control for town effects reduces the CAI effects for 4th graders
essentially to zero.
OLS results for 8th graders in the two applicant samples show little evidence of a relationship
between CAI intensity and test scores in either subject. In the town-effects sample for 8th grade Math scores,
however, there are marginally significant negative score effects for two out of three dummies and using the
ordinal ranking. Except for the Hebrew scores of 4th graders, Table 3 also shows a pattern of declining
effects as the models included larger sets of controls, i.e., progressing from a specification for applicants,
to applicants with lagged test scores, to control for town effects. This suggests that part of the positive
association in column 1 is due to omitted variables that are positively associated with test scores and
computer use. For example, since private fund-raising for public school activities is common in Israel,
schools in more prosperous neighborhoods probably have greater access to parental resources to fund
education technology. This possibility motivates the 2SLS estimation strategy discussed in the next section.
The 2SLS estimates exploit Tomorrow-98 program status as a source of exogenous variation in CAI
intensity.
III. Instrumental-variables estimates
A. Reduced-form program effects
We begin with a reduced-form analysis of program impacts since this does not require commitment
to a particular endogenous variable capturing all possible channels for the impact of CAI intensity. The first
four columns of Table 4 report the relationship between CAI intensity and the Tomorrow-98 program. CAI
intensity is measured using a series of dummies for levels of the ordinal ranking and with the ranking variable
itself. Estimates are reported for models with and without control for lagged scores, and the same covariates

8Rotin (1999) also concludes that the Tomorrow-98 program had an impact on the prevalence ofCAI, though he does not present separate estimates for elementary and middle school grades.
12
as in Table 3. All of the estimates show that 4th grade pupils in schools that received funding from the
Tomorrow program were more likely to be exposed to CAI when studying both Math and Hebrew than pupils
in schools that did not receive funding. The estimates for Math show a shift at all levels of intensity while
those for Hebrew show a shift only from “no use” to “some use” of CAI (i.e., an effect on CAI$1 or c1s). Of
course, these shifts may reflect pre-program differences, but controls for the presence of computers in the
school before the program should mitigate pre-program differences. In contrast with the results for 4th
graders, program funding had relatively little effect on 8th grade teaching methods in either subject. The
difference in program impact on CAI across grades is consistent with the fact that CAI is generally less
widely used in upper grades.8
In addition to estimating program effects on CAI intensity, we used the teachers’ survey to explore
the relationship between program status and other aspects of the school environment. In particular, we used
equation (1) to estimate the effect of program status on class size, subject coverage, hours of instruction,
frequency of teacher training, use of non-computer audio-visual or TV equipment, and teacher satisfaction
with the level of training and class size. None of these variables were related to program status, so the
Tomorrow-98 program appears to have increased the use of CAI in 4th grade, without otherwise changing
the observed school environment.
The reduced form estimates of program effects on test scores are reported in the last column of Table
4. For 4th graders, there is a substantial and at least marginally significant negative relationship between
Tomorrow program status and test scores, with pupils in the Tomorrow group scoring .2 to .25 standard
deviations lower than other pupils. Fourth grade Hebrew scores and 8th grade Math scores are also lower
in the program group; these differences are not significant. Eighth-grade Hebrew scores are slightly higher
for program participants, though here too the difference is not significant. Thus, while there is clear evidence
that computers funded by Tomorrow-98 led to an increase in CAI at least in 4th grade, there is no evidence

9Similar results are obtained when the dummy for Tomorrow-98 is replaced with a variablemeasuring the number of months Tomorrow-98 computers were in schools. The absence of a significantreduced effect on eight grade scores can be seen as a specification check since there are no first-stageeffects on CAI intensity for eight graders.
10We also briefly explore specifications using dummies for months of program exposure asmultiple instruments. In practice, this approach is not powerful enough to identify the effects of multipledummies.
13
that this translated into higher test scores. The only statistically significant test score difference is the
negative effect on 4th grade Math scores, and two out of three of the other groups show negative effects.9
B. 2SLS
The reduced-form effects on test scores capture program impacts without specifying the specific
channel whereby new computers affect scores. But it is also of interest to scale these reduced-form effects
into the effects of an increase in CAI. For the purposes of 2SLS estimation, we focus on models treating the
ordinal ranking variable as the single endogenous regressor of interest. One reason for focusing on the
ranking is that it seems most natural to think of Tomorrow-98 program award status (Ts) as providing a single
instrument for cs. Models with more than one endogenous regressor (i.e., multiple intensity dummies) would
require more than one instrument.10 Moreover, in spite of the fact that cs is ordinal, conventional 2SLS
estimates of the effect of cs using a single binary instrument can be interpreted as estimating the average
effect of a unit increase in the intensity ranking for those whose intensity was increased by the program
(Angrist and Imbens, 1995; Theorem 1). Finally, note that the reduced form estimates show the program
shifted the intensity distribution at more than one point in the intensity distribution.. This implies that 2SLS
estimates replacing cs with a single dummy variable for, say, any computer use (c1s), will be “too big” in the
sense that they over-estimate the causal effect of interest (Angrist and Imbens, 1995; p. 436). These
considerations, discussed in greater detail in the appendix, lead us to treat cs as the endogenous variable in
a 2SLS setup.
We report 2SLS results for the 4th grade sample only. 2SLS results for 8th graders are omitted since

11The t-statistics for 2SLS estimates are lower than the corresponding t-statistics for the reduced-form effects because the 2SLS residuals are more highly correlated within schools than are the reduced-form residuals.
14
there is no significant reduced form effect in the 8th grade sample. The sign of the 2SLS estimates is
necessarily the same as the sign of the reduced-form estimate in Table 4; the only change from the reduced
form is a re-scaling. The first-stage equation for this procedure is
cs = WsNπ1 + XiNπ2 + Tsπ0 + ξis, (2)
where π0 is the first-stage effect. Estimates of π0 in this equation were reported in column 4 of Table 4 (the
standard errors in that table allow for school-level clustering in ξis). The list of control variables is the same
as for the OLS and reduced-form estimates reported in Tables 3 and 4, and includes schools’ Tomorrow-98
priority ranking.
The results of 2SLS estimation using samples of all applicants and samples of those with lagged test
scores, reported in columns 1-4 of Table 5, suggest that increasing the intensity of CAI by one unit reduces
the Math test scores of 4th graders by about .3 or .4 standard deviations. Not surprisingly given the reduced-
form results, only the Math estimates are significant.11 The negative effects for 4th grade Hebrew scores
are on the order of .25 standard deviations. Importantly, the contrast between columns 1 and 3 and columns
2 and 4 shows that the 2SLS results are not sensitive to control for towns’ priority ranking in the Tomorrow-
98 allocation process.
Table 5 also reports the results of three simple checks on the basic 2SLS specification. First, the
estimates in columns 5 and 6 use samples composed entirely of pupils in schools that received Tomorrow-98
funding and for whom we have data on 1991 scores. As before, the instrument in this case is a dummy
indicating whether the pupil is in a school that received funding before June 1996. But here the comparison
group consists solely of pupils who received Tomorrow-98 computers after June 1996 (and before the end
of December 1997, the last date we have information for). This strategy controls for the possibility that
Tomorrow-98 winners differ in some unobserved way from Tomorrow-98 losers, thereby biasing 2SLS

15
estimates of program effects. In fact, results using the “T-98/will-get-T-98" sample are remarkably similar
to those in the full sample.
Second, columns 7 and 8 report the results of adding controls for the instructional use of computers
(as opposed to possession of hardware) by 4th graders in 1991. This school-level variables provides an
additional control for pre-existing differences between program winners and losers. The data on lagged
computer use come from the same source as lagged test scores. Only a subset of schools have this
information, which consists of the school average of indicators for whether teachers in the relevant grade in
the school used computers for instruction. Control for lagged computer use has little effect on the estimates
of the impact of computer use on 4th grade test scores.
Finally, columns 9 and 10 of Table 5 reports the results of replacing a single T-98 dummy with up
to 20 dummies indicating the number of months T-98 computers were used (the number of dummies depends
on the subject and grade). The idea here is that the more time a school had access to the Tomorrow-98
computers, the more of an impact should be expected on CAI intensity and test scores. Moreover, if the
instruments satisfy the exclusion restriction motivating 2SLS estimation, this specification should generate
similar but more precise estimates than those generated by the basic single-dummy specification. Results
using months dummies as instruments are considerably more precise than estimates using a single dummy,
though somewhat smaller than results from the basic specification. The differences in estimates across
models is not statistically significant, however.
C. Assessing instrument validity
The Tomorrow-98 instrument arises from a funding process that involved a number of bureaucratic
guidelines and idiosyncratic elements. As we noted earlier, the most important factor determining resource
allocation was town ranking of schools, modified to some extent by central government intervention in cases
where Ministry of Education officials felt local assessments were biased by political considerations. A
second consideration was grade structure and school organization, with priority given to those towns having

16
more stand-alone middle schools. Although these factors were certainly not randomly assigned, Table 2
shows little evidence for a systematic association between Tomorrow-98 award status and either pupil
characteristics or schools’ average test scores in 1991, three years before the program. This supports a causal
interpretation of the IV estimates.
Important additional evidence for instrument validity comes from the pattern of 2SLS results. If
computers were especially likely to have been awarded to low-achieving schools, we might have expected
lower test scores in award schools for all subjects and grades. The results instead show a significant negative
association only for the grade/subject combination where Tomorrow-98 awards were associated with a
change in computer use. Thus, the first- and second-stage estimates are consistent with a causal chain linking
program computers to changes in computer use and, ultimately, to changes in achievement. Of course, it is
impossible to prove that the 2SLS estimates have the interpretation we would like. As a further specification
check, we therefore turn to a modified 2SLS strategy that exploits the Tomorrow-98 allocation mechanism
directly. This strategy is robust to some of the sources of omitted variables bias that may affect the estimates
in Table 5.
D. Non-linear instrumental variables
The 2SLS estimates discussed above may be biased if schools that received Tomorrow-98 computers
differ in some way from those that didn’t, even after controlling for observed covariates. As a further check
on the previous results, we explored an instrumental variables strategy related to the regression-discontinuity
method used recently by Angrist and Lavy (1999) to estimate the effects of class size on test scores. This
method exploits the fact that, within towns, priority for Tomorrow-98 funding was determined largely on the
basis of the towns’ ranking of applicant schools. Although there is no sharp discontinuity in the relationship
between ranking and funding, we can use the fact that funding is a nonlinear and non-monotonic function
of rank to construct instruments for computer use while controlling for parametric functions of rank.

12We determined Ns by counting applicants in Tomorrow-98 program data provided by theMinistry of Education. The town ranking of schools is also reported in this file. In some cases themaximum rank recorded in the data falls short of the apparent number of applicants, probably becauseschools were incorrectly grouped or identified. In such cases we set schools deemed ineligible forfunding (i.e., ranked by the town at 0) to have rs = max(rank recorded for the town)+1. Rs is the rankingvariable included as a control in the OLS and 2SLS estimates.
17
To motivate this approach, let rs denote the school s rank on the list for the town where this school
is located. That is, rs=1 if the school is first on the priority list in the town, rs=2 for the second school in the
town, and so on, up to Ns, the number of schools on the town list. To adjust for the fact that the likelihood
of being highly ranked may have varied with the number of applicants, we work with a normalized rank:
Rs = ((Ns+1-rs)/Ns). (3)
Note that not all schools were ranked, i.e., some schools were deemed ineligible for program funds by the
towns. For schools ineligible for funding, we set rs=Ns+1 so Rs=0.12 Thus, Rs ranges from 0 (ineligible for
funds) to 1 (highest priority for funding). Rs provides a potential instrumental variable that can be used to
identify the effects of Tomorrow-98 computers or CAI on outcomes. The identification in this case turns on
the fact that E[Ts| Rs] is a highly nonlinear and non-monotonic function of Rs. We can therefore control for
linear and even polynomial functions of Rs while using E[Ts| Rs] as an instrument for cs.
What sort of omitted variables bias does this strategy mitigate? A concern with the 2SLS estimates
discussed in the previous section is bias from correlation between Ts and unobserved school-level
characteristics, represented by the error term, ηs. Ts can be viewed as determined by town rank, Rs, town size,
Ns, and other school-level random factors, denoted by νs, that are likely correlated with ηs. These other
(random) factors include the town-specific ranking threshold and anything else used by the town or central
authorities to make allocation decisions. For example, the assignment mechanism could be modeled as Ts
= 1[h(Rs) > νs]. Note that necessarily, we have
Rs z (ηs- E[ηs| Rs, Ns]),
by iterated expectations. The town rank is therefore available as a potential instrument after controlling for

13Results using linear and third-order polynomial controls were similar. As the degree ofpolynomial control increases, identification breaks down and the estimates become increasinglyimprecise.
14The Cleveland (1979) estimator is called LOWESS (see, e.g. Fan and Gijbels, 1995). We usethe version of this estimator implemented in Stata.
18
E[ηs| Rs, Ns]. This requires sufficient variation in the relationship between Rs and Ts. We therefore make
the following identifying assumption:
A1. (i) E[ηs| Rs, Ns] = gp(Rs) + δ0Ns, where gp(Rs) is polynomial function of order p; (ii) The
matrix formed from the columns {Ws gp(Rs) Ns E[Ts| Rs]} is of full column rank.
Given A1, the effect of interest is identified even if unobserved components of program award status (νs) are
correlated with unobserved school-level determinants of test scores (ηs).
A natural estimator given assumption A1 is 2SLS using a modified version of equation (1), where
the term WsNγ is augmented by inclusion of Ns and the control function, gp(Rs), which we take to be
quadratic.13 The resulting equation is:
yis = WsNγ + δ0Ns + δ1Rs + δ2Rs2 + XiNβ + csα + η~ s + εis, (4)
where η~ s / ηs- E[ηs| Rs, Ns]. The quadratic function of Rs controls for possible effects of the ranking that
operate through mechanisms other than the likelihood of receiving new computers.
Implementation of the non-linear IV strategy requires an estimate of E[Ts| Rs] since this is unknown.
Following an idea developed by Hahn, Todd, and van der Klaauw (2001) for a related problem, we use local
linear regression to estimate this conditional expectation function nonparametrically. Hahn, Todd, and van
der Klauuw (2001) incorporate prior information on the location of discontinuities in their nonparametric
estimates. Since there are no discontinuities in our case, E[Ts| Rs] was modeled using the entire support of
Rs. In particular, we used the Cleveland (1979) local linear regression smoother to construct and estimate
E[Ts| Rs], for every Rs.14
The population of Tomorrow-98 applicants was used to construct E[Ts| Rs], so the first-step fitted
value can be treated as known for inference purposes. On the other hand, an important source of uncertainty

19
is the appropriate amount of smoothing when constructing fitted values. Because there is uncertainty about
bandwidth, we experimented with a number of choices.
The estimated E[Ts| Rs] is plotted in Figure 1 for elementary schools and Figure 2 for middle schools.
Both figures show estimates for bandwidth choices of .2, .3, and .4. As the bandwidth gets wider, the
estimated E[Ts| Rs] gets smoother. At the other extreme, very narrow bandwidths lead to an estimator that
interpolates every point. The points themselves, zeros and ones since Ts is binary, also appear in the figure.
Figures 1 and 2 both show that schools with normalized rank below about .7 were much less likely
to receive Tomorrow-98 computers than schools with higher rankings. For ranks of .7 and higher, the
likelihood of receiving computers increases steeply with rank, though it flattens out below ranks of .9 for
elementary schools. Interestingly, schools given a very low ranking by municipal authorities (i.e, below
about .2) are more likely to have been given computers than schools with ranks between .2 and .6. This is
probably because Ministry of Education authorities over-ruled some low town-based rankings, apparently
out of concern that towns’ preferences over schools were influenced by local political considerations.
Figures 3 and 4 show local linear regression estimates of the relationship between the normalized
town ranking and test scores, parallel to those in Figures 1 and 2 (using a bandwidth of .4). The top half of
Figure 3, for 4th grade Math scores, exhibits a pattern that is in some respects the mirror image of Figure 1.
In particular, test scores begin to fall with rank for towns with ranks above about .7. Although there is some
evidence of a decline for 4th grade Hebrew scores, the pattern is less clear cut than for Math scores,
consistent with the insignificant but negative estimates for Hebrew scores in Tables 4 and 5. For 8th graders,
however, the only semblance of a pattern is slightly lower scores for low ranked schools and slightly higher
scores for highly ranked schools. Both groups were more likely to receive Tomorrow-98 computers, so this
pattern may be due to chance. Neither figure shows strong up or down “trend variation” in scores with rank.
The non-linear instrumental variables estimates are broadly consistent with the 2SLS estimates
reported in Table 5. This can be seen in Table 6, which reports estimates for 4th graders using three
bandwidth choices in the first-stage. As before, the clearest results are for 4th grade Math scores, with

20
estimates ranging mostly around .2 standard deviations in samples of applicants and applicants with lagged
scores. One of the estimates in column 2 is marginally significant. Estimates for 4th grade Hebrew scores
are also mostly negative, though none are significant. The estimates in column 3 of the table are based on
a sample limited to pupils in schools that had a normalized rank above .5. These estimates involve a
comparison that exploits variation in E[Ts| Rs] close to the level where the probability of receiving computers
sharply increased. This limited sample may lead to better control for any omitted Rs effects. In practice,
these results are larger in magnitude and less precise than the other results.
IV. Conclusions
Israel’s Tomorrow-98 program provides a unique opportunity to assess the short-run consequences
of increased computer technology in schools. The program had a clear impact on the use of computers in
elementary school instruction, with a much weaker effect on teaching methods in middle schools. This is
in spite of the fact that program operators hoped to promote the use of CAI at higher grade levels, where it
is generally less pervasive. The results reported here do not support the view that CAI improves learning,
at least as measured by pupil test scores. Using a variety of estimation strategies, we find a consistently
negative and marginally significant relationship between the program-induced use of computers and 4th
grade math scores. For other grades and subjects, the estimates are not significant, though also mostly
negative. And simpler OLS strategies generate only one significant estimate for the relationship between
CAI and test scores, a negative effect of CAI on 8th grade math scores in models with town effects.
A possible explanation for our findings is that CAI is no better and may even be less effective than
other teaching methods. Alternately, CAI may have consumed school resources or displaced educational
activities which, had they been maintained, would have prevented a decline in achievement. Our teacher
survey included questions that we used to explore possible program-related changes in teaching methods and
educational inputs. As noted earlier, we found no evidence of a significant change in educational inputs,
instructional methods, or teacher training in Tomorrow-98 schools. This suggest there was no displacement.

21
On the other hand, while tomorrow-98 included a training component, CAI strategies implemented with a
large increase in teacher training may prove to be more effective than the Tomorrow-98 program, though also
more costly.
Another possible explanation for the findings reported here is that the transition to CAI is disruptive,
and any benefits of CAI take time develop. The schools in our sample had Tomorrow-98 computers for an
average of one full school year. This may not be long enough for any benefits to appear. Also relevant for
an overall assessment are any spillovers from the use of CAI on computer skills for which there is a direct
payoff. The computer-skills benefit may not be reflected in Math and language scores. It should be
emphasized, however, that the results reported here show that enough time had passed by the test date for
the new computers to have had a large and statistically significant impact on instructional methods for 4th
graders. Although other issues are also important, the short-term impact of this change is of immediate
policy interest. At a minimum, this short-run decline in test scores is an extra hurdle to overcome if the
transition to CAI is ultimately to be justified by pupil achievement.
Finally, an important feature of Israel’s computerization program, and an element that is by no
means unique to Israel, is the large cost of a broad move to CAI. As noted in the introduction, the
Tomorrow-98 program deployed about 35,000 computers in the first three years of the program. The
Ministry of Education budgets this deployment at $3,000 per machine, include the cost of hardware,
software, and set-up (but not including wiring or other physical infrastructure). Program schools received
an average of about 40 computers, for a cost of $120,000 per school. In Israel, this amount would pay the
wages of up to 4 teachers. Assuming a depreciation rate of 25% on hardware and software and ignoring any
training costs, the flow cost of the computers is about one teacher per year per school.
Recent years have seen similarly ambitious computerization efforts in US schools, where education
technology is thought to have cost 5.2 billion dollars in 1998, and the proportion of elementary school
classrooms with internet access jumped from 30 percent in 1994 to 75 percent in 1997 (National Center for
Education Statistics, 1998). The question of future impacts remains open, but this significant and ongoing

22
expenditure on education technology does not appear to be justified by pupil performance results to date.
In addition to the evidence presented here, our skeptical view of the value of expenditure on education
technology is reinforced by our earlier findings using Israeli data (reported in Angrist and Lavy, 1999, 2001)
suggesting traditional inputs -- reductions in class size and increased teacher training -- do have substantial
achievement benefits. Although the labor market consequences of educational expenditures is difficult to
assess, these results have clear implications for education production isoquants. On balance, it seems, money
spent on CAI in Israel would have been better spent on other inputs.

23
APPENDIX
1. Data
A. Test score data
Four data files from the Ministry of Education contain the pupil's characteristics and test scores (in Math andHebrew, for 4th and 8th grade) from the June 1996 national testing program. These files were given to usby the Ministry of Education. Our analysis is limited to the Jewish schools in the sample. The 4th grade Mathsample included 213 schools (5584 pupils). The 8th grade Math sample included 177 schools (4172 pupils).The 4th grade Hebrew sample included 209 schools (5466 pupils). The 8th grade Hebrew sample included176 schools (4695 pupils).
B. Computer-use intensity data
The June 1996 testing program included a brief survey given to all teachers of each sampled class. Thissurvey included a question on the intensity of computer use in the classroom. Teachers are identified as Mathor Hebrew teachers. Fourth grade pupils were assigned the answers of their (unique) teacher. For the 8thHebrew sample, there are up to four different teachers who taught the same class different Hebrew-relatedsubjects. In such cases we assigned pupils the answers of their reading teacher.
Teachers’ answers on the intensity of computer use were non-missing for 183 schools (4833 pupils)in the 4th grade Math sample, 142 (3290 pupils) schools in the 8th grade Math sample, 166 schools (4180pupils) in the 4th grade Hebrew sample and for 140 schools (3675 pupils) in the 8th grade Hebrew sample.The observation counts were further reduced to those in Table 1 because of missing data on other variables.
C. Data on Tomorrow-98 applicants
The Ministry of Education provided a file containing information on the 1994 applicants to the Tomorrow-98program and their ranking within municipalities. This file was merged with pupil test scores data using theschool id. The 4th and 8th grade applicant Math samples with test score data included 146 schools. The 4thand 8th grade applicant Hebrew samples with test score data included 144 and 140 schools, respectively.
The Ministry of Education also provided files with information on the Tomorrow implementationschedules and existing computer infrastructure (collected for the purposes of this evaluation), along withother school level variables, such as the Pupil Disadvantage index, school size, town code and type of school(secular or religious). We were able to match all of the pupils in the table above to this school-level data.
D. Lagged test score and computer use data
Lagged scores for 4th grade Math and Hebrew scores were obtained from the 1991 national test program dataused by Angrist and Lavy (1999). Lagged scores were available for 189 schools in the 4th grade Math sample(of which 131 were program applicants), for 130 schools in the 8th grade Math sample (110 programapplicants), for 188 schools in the 4th grade Hebrew sample (150 program applicants) and for 119 schoolsin the 8th grade Hebrew sample (97 program applicants). The estimates controlling for lagged computer usein Table 5 also rely on matched data for a subsample of schools from the 1991 testing program. The datacome from a survey of teachers that was done along with the 1991 testing. The lagged use variable in ouranalyses measures the proportion of teachers at each school in 4th grade using computers for instruction in1991. The 8th grade lagged use variable is the average lagged use dummy for 4th grade in elementaryschools that feed the relevant middle schools.

24
2. 2SLS estimates of ordinal-response models
To simplify notation, we drop subscripts indexing individuals and schools, and use the upper caseto denote random variables with the same distribution as for a randomly chosen pupil or school. Supposethat a pupil would have average test score Yj when exposed to intensity level j, where j can take on values0-3. Yj is a potential outcome; that is, we imagine that for each pupil all of the elements of {Y0,Y1, Y2, Y3}are well-defined, though only one is ever observed. The average causal effect of increasing intensity by oneunit is E[Yj-Yj-1]. We could learn about these average effects in an experiment where pupils are randomlyexposed to different intensities. Similarly, let Ct be the potential intensity that would be realized when thebinary instrument T equals t, for t=0,1 The difference in means, E[C| T=1]-E[C| T=0] = E[C1-C0], is theaverage causal effect of T on CAI intensity in a randomized trial.
The empirical work is motivated by a model where potential outcomes vary with intensity accordingto a linear model that is the same for all pupils, but this is almost certainly not an accurate description of thecausal effect of changing computer use. Angrist and Imbens (1995) discuss the interpretation of linear IVestimators in models where the underlying causal response function is both heterogeneous and nonlinear.The simplest characterization is for a Wald estimator, i.e., using T as an instrument for a regression of Y onC with no covariates. Extensions are conceptually straightforward, though the notation is more involved.
The Wald estimator using T as an instrument can be written in terms of potential outcomes as:
E[Y| T=1] - E[Y|T=0] 3 E[Yj-Yj-1| C1 $ j > C0]P[C1 $ j > C0] (A2.1))))))))))))))))))))))) = ))))))))))))))))))))))))))))))))))))))) ,
E[C| T=1] - E[C|T=0] 3P[C1 $ j > C0]
where the summation is from j=1 to j=3. Formula (A2.1) describes the sense in which 2SLS captures anaverage causal response. This interpretation applies to Wald estimates of causal effects for any orderedtreatment of variable intensity, provided the intensities satisfy C1$C0 for all pupils (“monotonicity”).
Table A1 reports the marginal distribution of CAI intensity for Math and Hebrew. The weightingfunction underlying the average causal effect in (A2.1) is described in text Table 4, which reports the impactof T on the distribution of C. For example, the effect on the probability CAI $ 1 is an estimate ofP[C1$1>C0]. Using 4th grade Math data, the table shows significant positive weights for effects of this kindat j=1, 2, and 3, for 4th grade Hebrew data, the intensity distribution is shifted only for j=1.
Suppose now that instead of using C as the endogenous regressor, we use a single dummy indicatingCAI intensity greater than j as the endogenous regressor. Denote this regressor by d(j)/1[CAI$j]. Usingthe fact that P[C1$j>C0] is a difference in CDFs, we have:
E[C| T=1] - E[C| T=0] = 3j P[C1$j>C0].Now, since
E[d(j)| T=1] - E[d(j)| T=0] = P[C1$j>C0],
it follows immediately that IV estimates using d(j) as the endogenous will generally be “too big” in the sensethat they over-estimate the causal effect of a unit increase in intensity. The scaling factor is,
{3j P[C1$j>C0]}/3j P[C1$j>C0] /φ $1.
This equals 1 only if the instrument shifts the distribution of CAI intensity at a single point (as appears tobe true for the impact on CAI use for Hebrew). For fourth grade math scores, however, estimates using d(1)as the endogenous regressor can expected to be approximately 2-3 times as large as the 2SLS estimatestreating C as the endogenous regressor. This is confirmed in Table A2, which reports estimates usingalternate dummy-variable specifications, comparable to those reported in Table 5.

25
REFERENCES
Anandakrishan, M., J.F. Cardenas, P. Galaz-Fontes, and P. Robles-Perez, “Microcomputers in Schools inDeveloping Countries,” pp. 112-126 in New Technologies and Development: Experiences ofTechnology Blending, A.S. Bhalla and J. Dilmus, eds., London: Rienner, 1988.
Cuban, L. Teachers and Machines: The Classroom Use of Technology Since 1920, New York: Teacher’sCollege Press, 1986.
Angrist, J., and G. Imbens, "Two-Stage Least Squares Estimates of Average Causal Response in Modelswith Variable Treatment Intensity," Journal of the American Statistical Association, June 1995.
Angrist, J., and V. Lavy, "Using Maimonides' Rule to Estimate the Effect of Class Size on StudentAchievement," Quarterly Journal of Economics, May 1999.
Angrist, J., and V. Lavy, “Does Teacher Training Affect Pupil Learning? Evidence From MatchedComparisons in Jerusalem Public Schools,” Journal of Labor Economics, forthcoming, April 2001.
Baker, Eva L., M. Gearhart, and J.L. Herman, “The Apple Classrooms of Tomorrow: The UCLA EvaluationStudies, CSE technical report 353, Center for the Study of Evaluation/Center for TechnologyAssessment, Graduate School of Education, UCLA, January 1993.
Booms, B.H., and D.L. Kaltreider, “Computer-Aided Instruction for Large Elementary Courses,” AmericanEconomic Review 64 (May 1974), 408-413.
Cleveland, W., “Robust Locally Weighted Regression and Smoothing Scatterplots,” Journal of the AmericanStatistical Association 74 (1979), 829-836.
Cuban, L., Teachers and Machines: the Classroom Use of Technology Since 1920, New York: Teacher’sCollege Press, 1986.
Cuban, L., “Computers Meet Classroom: Classroom Wins,” Teacher’s College Record 95 (1993), 185-210.Dertouzos, Michael, “Wire All Schools? Not So Fast . . .,” Technology Review (September-October 1998),
20.Fan, J., and I. Gijbels, Local Polynomial Modeling and Its Applications, London: Chapman and Hall, 1995.Hahn, Jinyong, P. Todd, and Wilbert van der Klaauw, “Identification and Estimation of Treatment Effects
with a Regression-Discontinuity Design,” Econometrica 69 (January 2001), 201-210.Henry, Mark, and D. Ramsett, “The Effects of Computer-Aided Instruction on Learning and Attitudes in
Economic Principles Courses,” Journal of Economic Education 10 (Fall 1978), 26-34.Israel, Paul, Edison: A Life of Invention, New York: John Wiley and Sons, 1998 (p. 442).Israel Ministry of Education, Culture, and Sport, Economics and Budgeting Administration, Facts and
Figures About Education and Culture in Israel, Jerusalem: 1994.Israel Ministry of Education, Culture, and Sport, Economics and Budgeting Administration, Facts and
Figures About Education and Culture in Israel, Jerusalem: 1996.Kirkpatrick, Heather, and L. Cuban, “Computers Make Kids Smarter -- Right?,” Technos Quarterly for
Education and Technology 7 (Summer 1998), No. 2.Knight, Patricia Burns, and W.C. Bozeman, “Computer-Assisted Instruction and Mathematics Achievement:
Is There a Relationship?,” Educational Technology (October 1981), 32-39.Kulik, C.C., and J.A. Kulik, “Effectiveness of Computer-Based Instruction: An Updated Analysis,”
Computers in Human Behavior 7 (1991), 75-94.Lavy, Victor, "Endogenous School Resources and Cognitive Achievement in Primary Schools in Israel,"
Hebrew University, Falk Institute Discussion Paper No. 95.03, 1995.Lewis, Darrell R., James C. Hearn, and Eric Zilbert, “Keyboarding as General Education: Post-School
Employment and Earnings Effects,” Economics of Education Review 10 (1991), 333-342.Liao, Y.K., “Effects of Computer-Assisted Instruction on Cognitive Outcomes: A Meta-Analysis,” Journal
of Research on Computing in Education 24 (1992), 367-380.Moulton, Brent, “Random Group Effects and the Precision of Regression Estimates,” Journal of
Econometrics 32 (1986), pp. 385-97.

26
Oppenheimer, Todd, “The Computer Delusion,” The Atlantic Monthly (July 1997), 45-63.National Center for Education Statistics, The Condition of Education 1998, US Department of Education,
Office of Educational Research and Improvement (NCES 98-013), Washington, DC: US GPO,October 1998.
President’s Committee of Advisors on Science and Technology, Panel on Educational Technology, Reportto the President on the Use of Technology to Strengthen K-12 Education in the United States,”Washington DC: Office of the President, March 1997.
Rotin, Joshua, “The Contribution of the Mahar 98 Project to the Advancement of the Use of Computers andSoftware in Schools,” Working Paper 6, The Gordon College of Education, Haifa, 1999 (in Hebrew).
Seltz, Johanna, ‘Some Educators Question Value of School Computers,” The Boston Sunday Globe (May9, 1999), p. F5.
Skinner, B.F., “The Science of Learning and the Art of Teaching,” Harvard Educational Review 24 (1954),86-97.
Skinner, B.F., “Teaching Machines,” Science 128 (October 24, 1958), 969-977.Stoll, Clifford, Silicon Snake Oil: Second Thoughts on the Information Highway, New York: Doubleday,
1995.Wenglinsky, Harold, Does It Compute? The Relationship Between Educational Technology and Student
Achievement in Mathematics, Policy Information Center, Research Division, Educational TestingService, Princeton, NJ: September 1998.
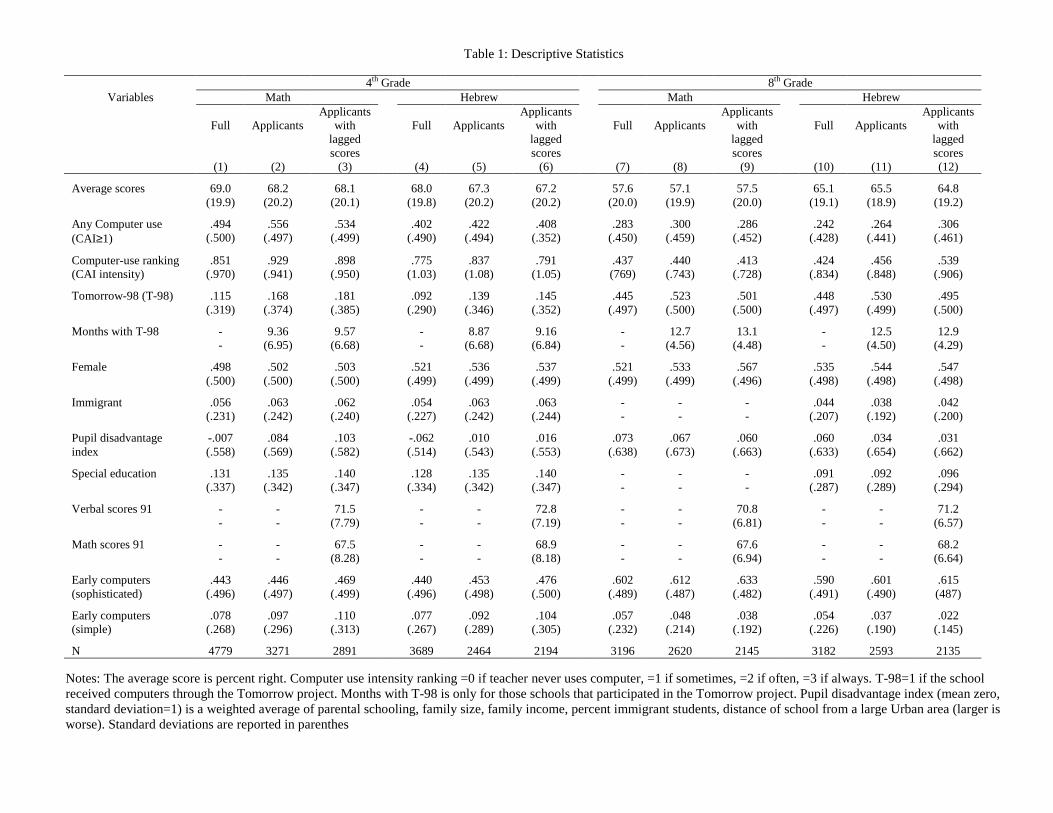
Table 1: Descriptive Statistics
4th Grade 8th Grade Variables Math Hebrew Math Hebrew
Full
(1)
Applicants
(2)
Applicants with
lagged scores
(3)
Full
(4)
Applicants
(5)
Applicants with
lagged scores
(6)
Full
(7)
Applicants
(8)
Applicants with
lagged scores
(9)
Full
(10)
Applicants
(11)
Applicants with
lagged scores (12)
Average scores 69.0 (19.9)
68.2 (20.2)
68.1 (20.1)
68.0 (19.8)
67.3 (20.2)
67.2 (20.2)
57.6 (20.0)
57.1 (19.9)
57.5 (20.0)
65.1 (19.1)
65.5 (18.9)
64.8 (19.2)
Any Computer use (CAI≥1)
.494 (.500)
.556 (.497)
.534 (.499)
.402 (.490)
.422 (.494)
.408 (.352)
.283 (.450)
.300 (.459)
.286 (.452)
.242 (.428)
.264 (.441)
.306 (.461)
Computer-use ranking (CAI intensity)
.851 (.970)
.929 (.941)
.898 (.950)
.775 (1.03)
.837 (1.08)
.791 (1.05)
.437 (769)
.440 (.743)
.413 (.728)
.424 (.834)
.456 (.848)
.539 (.906)
Tomorrow-98 (T-98) .115 (.319)
.168 (.374)
.181 (.385)
.092 (.290)
.139 (.346)
.145 (.352)
.445 (.497)
.523 (.500)
.501 (.500)
.448 (.497)
.530 (.499)
.495 (.500)
Months with T-98 - -
9.36 (6.95)
9.57 (6.68)
- -
8.87 (6.68)
9.16 (6.84)
- -
12.7 (4.56)
13.1 (4.48)
- -
12.5 (4.50)
12.9 (4.29)
Female .498 (.500)
.502 (.500)
.503 (.500)
.521 (.499)
.536 (.499)
.537 (.499)
.521 (.499)
.533 (.499)
.567 (.496)
.535 (.498)
.544 (.498)
.547 (.498)
Immigrant .056 (.231)
.063 (.242)
.062 (.240)
.054 (.227)
.063 (.242)
.063 (.244)
- -
- -
- -
.044 (.207)
.038 (.192)
.042 (.200)
Pupil disadvantage index
-.007 (.558)
.084 (.569)
.103 (.582)
-.062 (.514)
.010 (.543)
.016 (.553)
.073 (.638)
.067 (.673)
.060 (.663)
.060 (.633)
.034 (.654)
.031 (.662)
Special education
.131 (.337)
.135 (.342)
.140 (.347)
.128 (.334)
.135 (.342)
.140 (.347)
- -
- -
- -
.091 (.287)
.092 (.289)
.096 (.294)
Verbal scores 91 - -
- -
71.5 (7.79)
- -
- -
72.8 (7.19)
- -
- -
70.8 (6.81)
- -
- -
71.2 (6.57)
Math scores 91 - -
- -
67.5 (8.28)
- -
- -
68.9 (8.18)
- -
- -
67.6 (6.94)
- -
- -
68.2 (6.64)
Early computers (sophisticated)
.443 (.496)
.446 (.497)
.469 (.499)
.440 (.496)
.453 (.498)
.476 (.500)
.602 (.489)
.612 (.487)
.633 (.482)
.590 (.491)
.601 (.490)
.615 (487)
Early computers (simple)
.078 (.268)
.097 (.296)
.110 (.313)
.077 (.267)
.092 (.289)
.104 (.305)
.057 (.232)
.048 (.214)
.038 (.192)
.054 (.226)
.037 (.190)
.022 (.145)
N 4779 3271 2891 3689 2464 2194 3196 2620 2145 3182 2593 2135 Notes: The average score is percent right. Computer use intensity ranking =0 if teacher never uses computer, =1 if sometimes, =2 if often, =3 if always. T-98=1 if the school received computers through the Tomorrow project. Months with T-98 is only for those schools that participated in the Tomorrow project. Pupil disadvantage index (mean zero, standard deviation=1) is a weighted average of parental schooling, family size, family income, percent immigrant students, distance of school from a large Urban area (larger is worse). Standard deviations are reported in parenthes

Table 2: Differences by Computer Use (C1) and Tomorrow-98 (T-98) program status
4th Grade 8th Grade Variables Math Hebrew Math Hebrew
Mean
(1)
Dif. by CAI ≥ 1
(2)
Dif. by T-98 (3)
Mean
(4)
Dif. by CAI ≥ 1
(5)
Dif. by T-98 (6)
Mean
(7)
Dif. by CAI ≥ 1
(8)
Dif. by T-98 (9)
Mean
(10)
Dif. by CAI ≥ 1
(11)
Dif. by T-98 (12)
A. All Applicants
Any Computer Use (CAI≥1)
.556 (.497)
- -
.240 (.122)
.422 (.494)
- -
.451 (.139)
.300 (.459)
- -
.003 (.090)
.264 (.441)
- -
.020 (.097)
Computer-use ranking (CAI intensity)
.929 (.941)
- -
.558 (.225)
.837 (1.08)
- -
.708 (.318)
.440 (.743)
- -
-.090 (.142)
.456 (.848)
- -
-.023 (.184)
Female .502 (.500)
-.027 (.039)
.056 (.050)
.536 (.499)
.078 (.039)
.047 (.057)
.533 (.499)
-.076 (.055)
-.046 (.053)
.544 (.498)
.008 (.063)
.061 (.054)
Immigrant .063 (.242)
.005 (.012)
-.012 (.017)
.063 (.242)
.002 (.014)
.019 (.020)
- -
- -
- -
.038 (.192)
-.014 (.012)
-.004 (.012)
Pupil disadvantage index
.084 (.569)
.112 (.102)
.150 (.133)
.010 (.543)
.297 (.107)
.358 (.156)
.067 (.673)
.262 (.135)
-.389 (.121)
.034 (.654)
.138 (.178)
-.203 (.140)
Special education
.135 (.342)
.031 (.016)
-.001 (.022)
.135 (.342)
-.017 (.021)
.040 (.030)
- -
- -
- -
.092 (.289)
-.018 (.021)
-.035 (.019)
Early comp/sophisticate .446 (.497)
.157 (.090)
.115 (.121)
.453 (.498)
.295 (.104)
.180 (.150)
.612 (.487)
-.246 (.097)
.211 (.094)
.601 (.490)
-.007 (.106)
.222 (.101)
Early comp/simple .097 (.296)
.010 (.055)
-.051 (.061)
.092 (.289)
.032 (.065)
-.025 (.091)
.048 (.214)
.064 (.043)
-.012 (.038)
.037 (.190)
-.013 (.040)
-.042 (.040)
N 3271 2464 2620 2593
B. Applicants with lagged scores
Verbal scores 91 71.5 (7.79)
-1.78 (1.48)
.367 (1.93)
72.8 (7.19)
-1.34 (1.51)
-1.6 (2.16)
70.8 (6.82)
-.213 (1.59)
3.53 (1.40)
71.2 (6.57)
1.40 (1.58)
2.10 (1.50)
Math scores 91 67.5 (8.28)
-1.46 (1.59)
-.260 (2.08)
68.9 (8.18)
-1.46 (1.81)
-2.10 (2.51)
67.6 (6.94)
2.08 (1.59)
2.10 (1.46)
68.2 (6.64)
2.01 (1.64)
1.30 (1.54)
N 2891 2194 2145 2135 Notes: See notes to Table 1 for variable definitions. The columns labeled “dif. By C1” show differences in covariate means by whether computers are used at all for instruction. The columns labeled “dif. by T-98” show differences in covariate means by whether Tomorrow-98 computers were received. Standard deviations reported in parentheses for levels. Standard errors are reported in parentheses for differences. The standard errors for differences are corrected for school-level clustering.

Table 3: OLS Estimates of the Effect of CAI Intensity Grade Regressor Math Hebrew Applicants Applicants Town fixed Applicants Applicants Town fixed with effects: Full with effects: Full lagged scores sample with lagged scores sample with lagged score lagged score (1) (2) (3) (4) (5) (6) 4th CAI ≥ 1 .045 .069 -.005 -.012 -.018 .031 (.068) (.072) (.056) (.063) (.067) (.056) CAI ≥ 2 .105 .080 -.010 -.008 -.0004 .003 (.072) (.076) (.074) (.066) (.068) (.059) CAI ≥ 3 .194 .193 .187 -.142 -.126 -.077 (.174) (.168) (.137) (.100) (.109) (.285) CAI Intensity .047 .047 .007 -.016 -.007 .009 (.035) (.038) (.034) (.028) (.031) (.030) N 3271 2891 2947 2464 2194 2237 8th CAI ≥ 1 .037 -.055 -.267 .072 -.017 -.063 (.092) (.100) (.138) (.073) (.073) (.062) CAI ≥ 2 .168 .176 -.111 .037 -.008 -.064 (.133) (.147) (.182) (.094) (.086) (.077) CAI ≥ 3 -.396 -.873 -.715 .205 .203 .281 (.356) (.338) (.254) (.163) (.149) (.143) CAI Intensity .039 -.0014 -.136 .038 .006 -.014 (.059) (.064) (.070) (.039) (.037) (.032) N 2621 2145 1883 2593 2135 1910 Other included controls Pre-existing computers X X X X X X Basic controls X X X X X X 1991 test scores X X X X Town effects X X Town Rank X X X X
Notes: Row entries are for separate models, each with the covariates listed. Basic controls: Female, Immigrant, Special education, Pupil disadvantage index, total school enrollment. Models for 8th graders also include controls for school types (grades K-8, 7-9). Lagged test scores: For 4th graders, these are school average of scores for 4th grades in 1991. For 8th graders, these are the average of 4th and 5th grade scores in 1991 for the elementary schools that feed these middle schools. The samples used for columns 3 and 6 are not limited to applicants. These samples include all pupils in towns with at least two schools and with data on lagged test scores. Standard errors are reported in parentheses. The standard errors are corrected for school-level clustering.

Table 4: Reduced-Form Program Effects CAI Indicators Grade Subject Controls CAI ≥ 1 CAI ≥ 2 CAI ≥ 3 CAI Intensity Score (1) (2) (3) (4) (5) 4th Math Basic Controls .234 .282 .083 .599 -.204 (.121) (.116) (.044) (.224) (.089) With Lagged Score .228 .252 .083 .563 -.241 (.120) (.115) (.049) (.227) (.088) Hebrew Basic Controls .335 .116 -.005 .446 -.052 (.134) (.136) (.094) (.310) (.088) With Lagged Score .285 .052 .015 .352 -.079 (.131) (.134) (.087) (.291) (.088) 8th Math Basic Controls .118 .015 -.014 .118 -.080 (.098) (.069) (.022) (.152) (.095) With Lagged Score .104 .001 -.018 .087 -.051 (.103) (.069) (.022) (.157) (.096) Hebrew Basic Controls .043 -.068 .071 .046 .055 (.102) (.082) (.043) (.400) (.072) With Lagged Score .080 -.056 .101 .125 .070 (.111) (.097) (.053) (.224) (.072)
Notes: Basic Controls and lagged test scores: as in Table 3. The standard errors are corrected for school-level clustering.

Table 5: 2SLS Estimates of the Effects of CAI Intensity for 4th Graders
Applicants Applicants with lagged scores
T-98 / will get T-98 with lagged scores
Control for lagged computer use
Use dummy instruments
(1) (2) (3) (4) (5) (6) (7) (8) (9) (10) A. Math
CAI intensity -.340 (.214)
-.341 (.212)
-.427 (.252)
-.435 (.245)
-.417 (.251)
-.427 (.251)
-.309 (.187)
-.317 (.184)
-.236 (.106)
-.244 (.106)
Over-id test(df) 8.8 (12) 8.8 (12) N 3271 2891 2035 2430 2891
B. Hebrew
CAI intensity -.116 (.208)
-.134 (.194)
-.224 (.307)
-.265 (.279)
-.208 (.214)
-.284 (.255)
-.064 (.168)
-.079 (.139)
-.104 (.086)
-.128 (.085)
Over-id test(df) 15.2 (9) 14.7 (9)
N 2464 2194 1496 1823 2194
Other included controls
Pre-existing computers X X X X X
Basic controls X X X X X
1991 test scores X X X X
Computer usage in 1991 X
Town Rank X X X X X
Notes: The endogeneous regressor is the 0-3 CAI intensity ranking. Basic controls and lagged test scores as in Table 3. The samples in columns 3 are limited to pupils in schools that received T-98 funding, including those that received funding after the June 1996 test date (as of 1998). The instrument for all columns except 5 is a T-98 program dummy. The instruments in columns 5 are up to 14 dummies for months of program operation. Standard errors are reported in parentheses. The standard errors are corrected for school-level clustering.

Applicants with Town rank>.5 Applicants lagged scores with lagged scores
Bandwidth (1) (2) (3)A. Math
CAI intensity 0.2 -0.151 -0.266 -0.588(.131) (.170) (.262)
0.3 -0.121 -0.214 -0.629(.121) (.142) (.310)
0.4 -0.142 -0.212 -0.572(0.119) (0.125) (.263)
N 3271 2891 1550
B. Hebrew
CAI intensity 0.2 -0.088 -0.202 3.024(.189) (.329) (18.248)
0.3 -0.074 -0.153 2.930(0.145) (.248) (12.310)
0.4 -0.060 -0.118 -4.401(.112) (.165) (27.243)
N 2464 2194 1281
Other included controls
Pre-existing computers X X X
Basic controls X X X
1991 test scores X X
Sample
Table 6: Non-linear IV Estimates for 4th Graders
Notes: The table reports IV estimates using the predicted probability of receiving T-98 program support as an instrument. The predicted probability is a nonparametrically estimated function of the normalized town rank for funding. Estimates use the bandwidth shown. All models control for a quadratic function of the normalized rank and for the number of applicants in the town. Basic controls: as in Table 3. The samples in columns 3 are limited to pupils in schools with normalized town ranking for Tomorrow-98 funding above .5. Standard errors are reported in parentheses. The standard errors are corrected for school-level clustering.

Figure 1. The relationship between within-town rank and the probability of funding for elementary schools.
Bandwidth=.2
fund
ed
rank0 .2 .4 .6 .8 1
0
.2
.4
.6
.8
1
Bandwidth=.3
fund
ed
rank0 .2 .4 .6 .8 1
0
.2
.4
.6
.8
1
Bandwidth=.4
fund
ed
rank0 .2 .4 .6 .8 1
0
.2
.4
.6
.8
1

Figure 2. The relationship between within-town rank and the probability of funding for middle schools.
Bandwidth=.2
fund
ed
rank0 .2 .4 .6 .8 1
0
.2
.4
.6
.8
1
Bandwidth=.3
fund
ed
rank0 .2 .4 .6 .8 1
0
.2
.4
.6
.8
1
Bandwidth=.4
fund
ed
rank0 .2 .4 .6 .8 1
0
.2
.4
.6
.8
1

4th Grade Math
4th Grade Hebrew
Figure 3. The relationship between within-town rank and test scores for 4th graders, bandwidth=.4.
scor
e
rank .1 .2 .3 .4 .5 .6 .7 .8 .9 1
20
30
40
50
60
70
80
90
scor
e
rank .1 .2 .3 .4 .5 .6 .7 .8 .9 1
20
30
40
50
60
70
80
90

8th Grade Math
8th Grade Hebrew
Figure 4. The relationship between within-town rank and test scores for 8th graders, bandwidth=.4.
scor
e
rank .1 .2 .3 .4 .5 .6 .7 .8 .9 1
20
30
40
50
60
70
80
90 sc
ore
rank .1 .2 .3 .4 .5 .6 .7 .8 .9 1
20
30
40
50
60
70
80
90
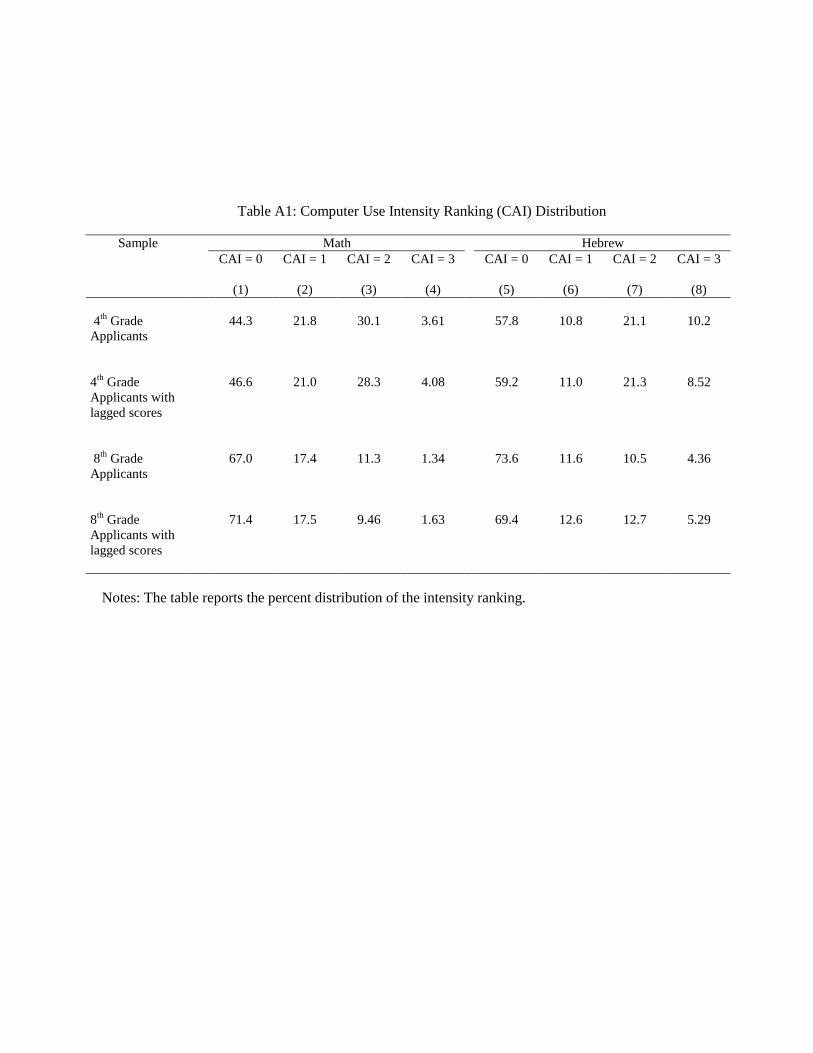
Table A1: Computer Use Intensity Ranking (CAI) Distribution
Sample Math Hebrew CAI = 0
(1)
CAI = 1
(2)
CAI = 2
(3)
CAI = 3
(4)
CAI = 0
(5)
CAI = 1
(6)
CAI = 2
(7)
CAI = 3
(8) 4th Grade Applicants
44.3 21.8 30.1 3.61 57.8 10.8 21.1 10.2
4th Grade Applicants with lagged scores
46.6 21.0 28.3 4.08 59.2 11.0 21.3 8.52
8th Grade Applicants
67.0 17.4 11.3 1.34 73.6 11.6 10.5 4.36
8th Grade Applicants with lagged scores
71.4 17.5 9.46 1.63 69.4 12.6 12.7 5.29
Notes: The table reports the percent distribution of the intensity ranking.
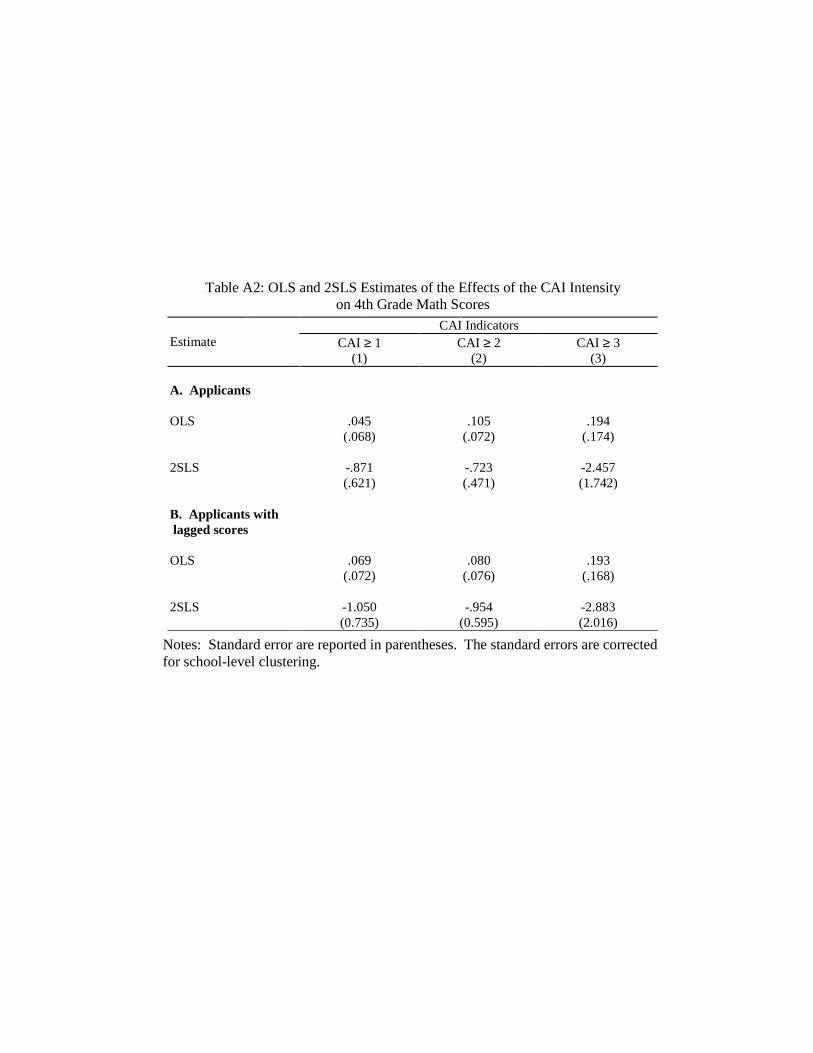
Table A2: OLS and 2SLS Estimates of the Effects of the CAI Intensity on 4th Grade Math Scores
CAI Indicators Estimate CAI ≥ 1 CAI ≥ 2 CAI ≥ 3 (1) (2) (3) A. Applicants OLS .045 .105 .194 (.068) (.072) (.174) 2SLS -.871 -.723 -2.457 (.621) (.471) (1.742) B. Applicants with lagged scores OLS .069 .080 .193 (.072) (.076) (.168) 2SLS -1.050 -.954 -2.883 (0.735) (0.595) (2.016)
Notes: Standard error are reported in parentheses. The standard errors are corrected for school-level clustering.

IZA Discussion Papers No.
Author(s) Title
Area Date
280 P. Apps R. Rees
Household Saving and Full Consumption over the Life Cycle
7 04/01
281 G. Saint-Paul
Information Technology and the Knowledge Elites
5 04/01
282 J. Albrecht A. Björklund S. Vroman
Is There a Glass Ceiling in Sweden?
5 04/01
283 M. Hagedorn A. Kaul V. Reinthaler
Welfare Analysis in a Schumpeterian Growth Model with Capital
7 04/01
284 H. Rapoport A. Weiss
The Optimal Size for a Minority
1 04/01
285 J. Jerger C. Pohnke A. Spermann
Gut betreut in den Arbeitsmarkt? Eine mikroökonometrische Evaluation der Mannheimer Arbeitsvermittlungsagentur
5 04/01
286 M. Fertig C. M. Schmidt
First- and Second-Generation Migrants in Germany – What Do We Know and What Do People Think
1 04/01
287
P. Guggenberger A. Kaul M. Kolmar
Efficiency Properties of Labor Taxation in a Spatial Model of Restricted Labor Mobility
3 04/01
288
D. A. Cobb-Clark
Getting Ahead: The Determinants of and Payoffs to Internal Promotion for Young U.S. Men and Women
5 04/01
289
L. Cameron D. A. Cobb-Clark
Old-Age Support in Developing Countries: Labor Supply, Intergenerational Transfers and Living Arrangements
3 04/01
290 D. A. Cobb-Clark M. D. Connolly C. Worswick
The Job Search and Education Investments of Immigrant Families
1 04/01
291 R. T. Riphahn Cohort Effects in the Educational Attainment of Second Generation Immigrants in Germany: An Analysis of Census Data
1 05/01

292 E. Wasmer Between-group Competition in the Labor Market and the Rising Returns to Skill: US and France 1964-2000
5 05/01
293 D. Cobb-Clark T. F. Crossley
Gender, Comparative Advantage and Labor Market Activity in Immigrant Families
1 05/01
294 Š. Jurajda Estimating the Effect of Unemployment Insurance Compensation on the Labor Market Histories of Displaced Workers
3 05/01
295 F. Duffy P. P. Walsh
Individual Pay and Outside Options: Evidence from the Polish Labour Force Survey
4 05/01
296 H. S. Nielsen M. Rosholm N. Smith L. Husted
Intergenerational Transmissions and the School-to-Work Transition of 2nd Generation Immigrants
1 05/01
297 J. C. van Ours J. Veenman
The Educational Attainment of Second Generation Immigrants in The Netherlands
1 05/01
298 P. Telhado Pereira P. Silva Martins
Returns to Education and Wage Equations 5 06/01
299 G. Brunello C. Lucifora R. Winter-Ebmer
The Wage Expectations of European College Students
5 06/01
300 A. Stutzer R. Lalive
The Role of Social Work Norms in Job Searching and Subjective Well-Being
5 06/01
301
J. R. Frick G. G. Wagner
Economic and Social Perspectives of Immigrant Children in Germany
1 06/01
302
G. S. Epstein A. Weiss
A Theory of Immigration Amnesties
1 06/01
303
G. A. Pfann B. F. Blumberg
Social Capital and the Uncertainty Reduction of Self-Employment
5 06/01
304
P. Cahuc E. Wasmer
Labour Market Efficiency, Wages and Employ-ment when Search Frictions Interact with Intra-firm Bargaining
2 06/01
305
H. Bonin
Fiskalische Effekte der Zuwanderung nach Deutschland: Eine Generationenbilanz
1 06/01

306
H. Bonin G. Abío E. Berenguer J. Gil C. Patxot
Is the Deficit under Control? A Generational Accounting Perspective on Fiscal Policy and Labour Market Trends in Spain
2 06/01
307
G. A. Pfann
Downsizing
1/5 06/01
308
G. A. Pfann D. S. Hamermesh
Two-Sided Learning, Labor Turnover and Worker Displacement
1 06/01
309
G. Brunello On the Complementarity between Education and Training in Europe
5 06/01
310
U. Sunde Human Capital Accumulation, Education and Earnings Inequality
5 06/01
311
G. Brunello Unemployment, Education and Earnings Growth
3 06/01
312
C. Furnée M. Kemler G. A. Pfann
The Value of Pain Relief
5 06/01
313
A. Ferrer-i-Carbonell B. M.S. van Praag
The Subjective Costs of Health Losses due to Chronic Diseases: An Alternative Model for Monetary Appraisal
7 06/01
314
B. M.S. van Praag A. Ferrer-i-Carbonell
Age-Differentiated QALY Losses
7 06/01
315
W. H. J. Hassink R. Schettkat
On Price-Setting for Identical Products in Markets without Formal Trade Barriers
7 06/01
316
M. Frondel C. M. Schmidt
Rejecting Capital-Skill Complementarity at all Costs
5 06/01
317
R. Winkelmann
Health Care Reform and the Number of Doctor Visits – An Econometric Analysis
7 06/01
318
M. Pannenberg G. G. Wagner
Overtime Work, Overtime Compensation and the Distribution of Economic Well-Being: Evidence for West Germany and Great Britain
1 06/01
319
R. Euwals R. Winkelmann
Why do Firms Train? Empirical Evidence on the First Labour Market Outcomes of Graduated Apprentices
1 06/01

320
R. Fahr U. Sunde
Strategic Hiring Behavior in Empirical Matching Functions
1 06/01
321
P. Telhado Pereira P. Silva Martins
Is there a Return – Risk Link in Education?
5 07/01
322
O. Hübler U. Jirjahn
Works Councils and Collective Bargaining in Germany: The Impact on Productivity and Wages
1 07/01
323
A. Frederiksen E. K. Graversen N. Smith
Overtime Work, Dual Job Holding and Taxation
1 07/01
324
M. Pflüger
Trade, Technology and Labour Markets: Empirical Controversies in the Light of the Jones Model
2 07/01
325
R. A. Hart J. R. Malley U. Woitek
Real Wages and the Cycle: The View from the Frequency Domain
1 07/01
326
J. S. Earle Á. Telegdy
Privatization and Productivity in Romanian Industry: Evidence from a Comprehensive Enterprise Panel
4 07/01
327
H. Gersbach A. Schmutzler
A Product Market Theory of Training and Turnover in Firms
5 07/01
328
F. Breyer Why Funding is not a Solution to the “Social Security Crisis”
3 07/01
329
X. Gong A. van Soest
Wage Differentials and Mobility in the Urban Labor Market: A Panel Data Analysis for Mexico
1 07/01
330
D. N. Margolis K. G. Salvanes
Do Firms Really Share Rents with Their Workers?
5 07/01
331
R. Winkelmann
Why Do Firms Recruit Internationally? Results from the IZA International Employer Survey 2000
5 07/01
332
M. Rosholm An Analysis of the Processes of Labour Market Exclusion and (Re-) Inclusion
3 07/01
333
W. Arulampalam R. A. Naylor J. P. Smith
A Hazard Model of the Probability of Medical School Dropout in the United Kingdom
5 07/01
334
P. A. Puhani
Wage Rigidities in Western Germany? Microeconometric Evidence from the 1990s
1 07/01
335
R. Fahr U. Sunde
Disaggregate Matching Functions
1 07/01
336
F. Lima P. Telhado Pereira
Careers and Wage Growth within Large Firms 5 07/01
337 F. Büchel M. Pollmann-Schult
Overeducation and Skill Endowments: The Role of School Achievement and Vocational Training Quality
5 08/01
338 C. Bell H. Gersbach
Child Labor and the Education of a Society
5 08/01
339 A. Ibourk B. Maillard S. Perelman H. R. Sneessens
The Matching Efficiency of Regional Labour Markets: A Stochastic Production Frontier Estimation, France 1990-1995
1 08/01
340 X. Wauthy Y. Zenou
How Does Imperfect Competition in the Labor Market Affect Unemployment Policies?
3 08/01
341 S. Kohns Testing for Asymmetry in British, German and US Unemployment Data
1 08/01
342 W. Schnedler
The Virtue of Being Underestimated: A Note on Discriminatory Contracts in Hidden Information Models
5 08/01
343 H. Bonin
Will it Last? An Assessment of the 2001 German Pension Reform
3 08/01
344 E. Plug P. Berkhout
Effects of Sexual Preferences on Earnings in the Netherlands
5 08/01
345 J. Hampe M. Steininger
Survival, Growth, and Interfirm Collaboration of Start-Up Companies in High-Technology Industries: A Case Study of Upper Bavaria
5 08/01
346 L. Locher
The Determination of a Migration Wave Using Ethnicity and Community Ties
1 08/01
347 M. Lofstrom F. D. Bean
Labor Market Conditions and Post-Reform Declines in Welfare Receipt Among Immigrants
3 08/01
348 S. Neuman A. Ziderman
Can Vocational Education Improve the Wages of Minorities and Disadvantaged Groups? The Case of Israel
5 08/01

349 J. T. Addison P. Portugal
Job Search Methods and Outcomes
1 08/01
350 J. T. Addison P. Portugal
Unemployment Duration: Competing and Defective Risks
1 08/01
351 J. D. Brown J. S. Earle
Gross Job Flows in Russian Industry Before and After Reforms: Has Destruction Become More Creative?
4 08/01
352 J. T. Addison J. S. Heywood X. Wei
Unions and Plant Closings in Britain: New Evidence from the 1990/98 WERS
1 08/01
353 T. Bauer S. Bender
Flexible Work Systems and the Structure of Wages: Evidence from Matched Employer-Employee Data
5 08/01
354 J. Kluve
On the Role of Counterfactuals in Inferring Causal Effects of Treatments
6 09/01
355 J. Kluve H. Lehmann C. M. Schmidt
Disentangling Treatment Effects of Polish Active Labor Market Policies: Evidence from Matched Samples
4/6 09/01
356 C. Heady T. Mitrakos P. Tsakloglou
The Distributional Impact of Social Transfers in the European Union: Evidence from the ECHP
3 09/01
357 C. Knoppik T. Beissinger
How Rigid are Nominal Wages? Evidence and Implications for Germany
1 09/01
358 T. Beissinger O. Buesse
Bismarck versus Beveridge: Which Unemploy-ment Compensation System is More Prone to Labor Market Shocks?
3 09/01
359 M. Pflüger
A Simple, Analytically Solvable Chamberlinian Agglomeration Model
2 09/01
360 J. Hansen M. Lofstrom
The Dynamics of Immigrant Welfare and Labor Market Behavior
1/3 09/01
361 M. C. Berger J. S. Earle K. Z. Sabirianova
Worker Training in a Restructuring Economy: Evidence from the Russian Transition
4 09/01
362 J. Angrist V. Lavy
New Evidence on Classroom Computers and Pupil Learning
6 09/01
An updated list of IZA Discussion Papers is available on the center‘s homepage www.iza.org.