New England’s Energy Mix - Microsoft · New England’s Energy Mix: Clean, Diverse, Responsive...
8
New England’s Energy Mix: Clean, Diverse, Responsive and Getting Even Better
Transcript of New England’s Energy Mix - Microsoft · New England’s Energy Mix: Clean, Diverse, Responsive...

New England’s Energy Mix:Clean, Diverse, Responsive and Getting Even Better
ENGIE’s Distrigas subsidiary is proud
of its 45-year history of supplying New
England with LNG – a critical component
of its energy portfolio – and critical LNG
infrastructure. LNG continues to be the
ideal complement to pipeline supplies.
Today, LNG is not only satisfying winter
peak demand, but is also bridging the
way to a future of increasing energy
efficiencies and growing renewable
energy supplies.
Here’s a look at the energy landscape of
New England, at the region’s objectives
of expanding renewable energy and
improving energy efficiencies, at how
this renewable commitment is changing
the energy landscape and at the role
LNG can and will play in achieving
those goals.
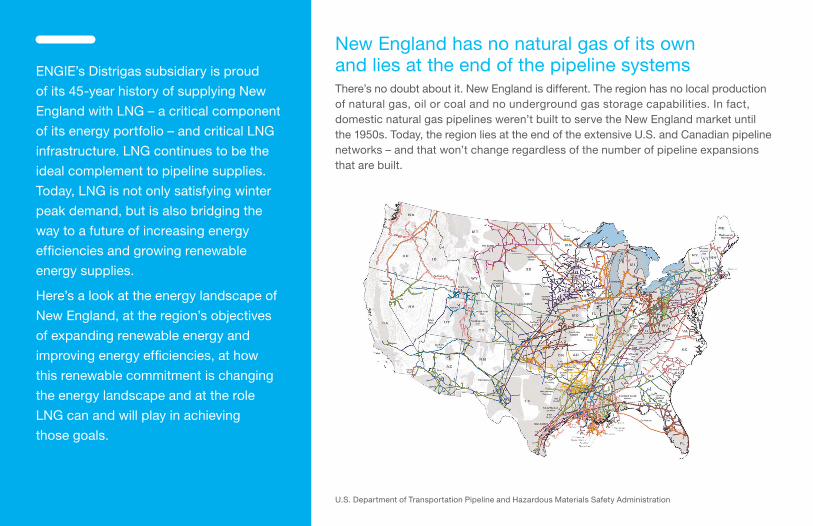
New England has no natural gas of its own and lies at the end of the pipeline systemsThere’s no doubt about it. New England is different. The region has no local production of natural gas, oil or coal and no underground gas storage capabilities. In fact, domestic natural gas pipelines weren’t built to serve the New England market until the 1950s. Today, the region lies at the end of the extensive U.S. and Canadian pipeline networks – and that won’t change regardless of the number of pipeline expansions that are built.
U.S. Department of Transportation Pipeline and Hazardous Materials Safety Administration

New England has a very heat-sensitive energy consumer baseNew England’s energy consumer composition is unique as well. The region has few heavy industries that use substantial volumes of energy year round. Instead, energy consumers are primarily residential and commercial, with temperature-sensitive demand. Combine that with cold New England winters and the result is natural gas demand that spikes during the heating season, when gas-fired power plants are also competing for pipeline capacity. This demand profile is what drove the development of the natural gas pipelines to the region to serve base-load demand in the 1950s, and the subsequent development of LNG infrastructure during the 1970s to supplement pipeline supplies and supply peak demand. It is inefficient to build a pipeline to satisfy a few weeks of peak demand. LNG, on the other hand, can be available in the quantities needed and vaporized into New England’s pipeline grid when and where it’s needed most.
Monthly Natural Gas Consumption for New England
140
120
100
80
60
40
20
0
Bill
ion
Cub
ic F
eet
(Bcf
)
Jun Jul Aug Sep Oct Nov Dec Jan Feb Mar Apr May Jun
NE
Energy Consumption by Sector
35
30
25
20
15
10
5
0P
erce
ntag
eResidential Commercial Industrial Transportation
U.S.
Data source: U.S. Energy Information Administration, 2014 (most recent data available)Data source: U.S. Energy Information Administration, 2014-15 (most recent data available)

New England has a strong environmental commitmentNew England’s demographics are very environmentally focused, and therefore, the region has adopted aggressive clean-air mandates and energy-saving initiatives. Take, for instance, the region’s focus on energy efficiency. In an American Council for an Energy-Efficient Economy (ACEEE) ranking of states based on their energy-efficiency policy and program efforts, four of the five top rankings went to New England states, with Maine coming in 11th. Collectively, the six New England states accounted for almost 20 percent of the $1.4 billion spent nationwide on natural gas energy-efficiency programs in 2015.
The region also embraces cleaner energy alternatives. With respect to primary energy consumption, New England’s energy portfolio is cleaner by far than the rest of the United States; only six percent of the region’s electric generation is sourced from oil and coal.
Primary Energy Consumption
45
40
35
30
25
20
15
10
5
0
Per
cent
age
Coal Natural Gas Nuclear Oil Renewables
NE
U.S.
Data source: U.S. Energy Information Administration, 2014 (most recent data available)
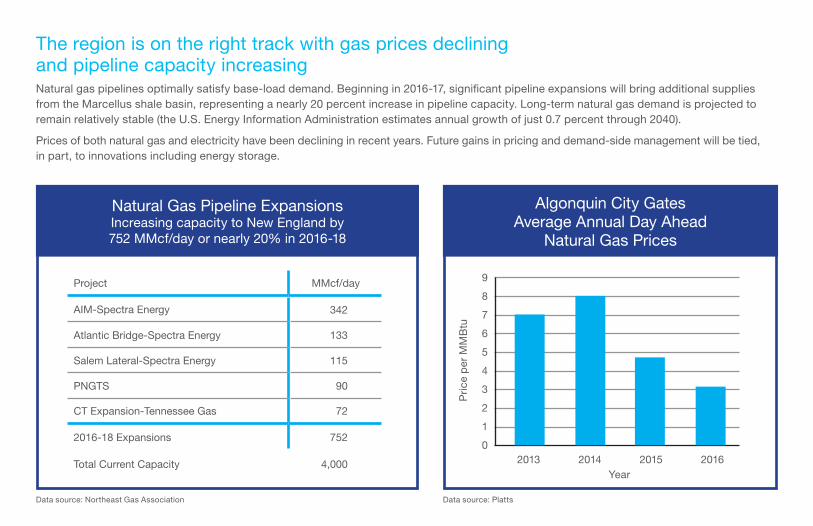
The region is on the right track with gas prices declining and pipeline capacity increasingNatural gas pipelines optimally satisfy base-load demand. Beginning in 2016-17, significant pipeline expansions will bring additional supplies from the Marcellus shale basin, representing a nearly 20 percent increase in pipeline capacity. Long-term natural gas demand is projected to remain relatively stable (the U.S. Energy Information Administration estimates annual growth of just 0.7 percent through 2040).
Prices of both natural gas and electricity have been declining in recent years. Future gains in pricing and demand-side management will be tied, in part, to innovations including energy storage.
Natural Gas Pipeline Expansions Increasing capacity to New England by 752 MMcf/day or nearly 20% in 2016-18
Algonquin City Gates Average Annual Day Ahead
Natural Gas Prices
9
8
7
6
5
4
3
2
1
0
Pri
ce p
er M
MB
tuYear
2013 2014 2015 2016
Data source: Northeast Gas Association Data source: Platts
Project MMcf/day
AIM-Spectra Energy 342
Atlantic Bridge-Spectra Energy 133
Salem Lateral-Spectra Energy 115
PNGTS 90
CT Expansion-Tennessee Gas 72
2016-18 Expansions 752
Total Current Capacity 4,000
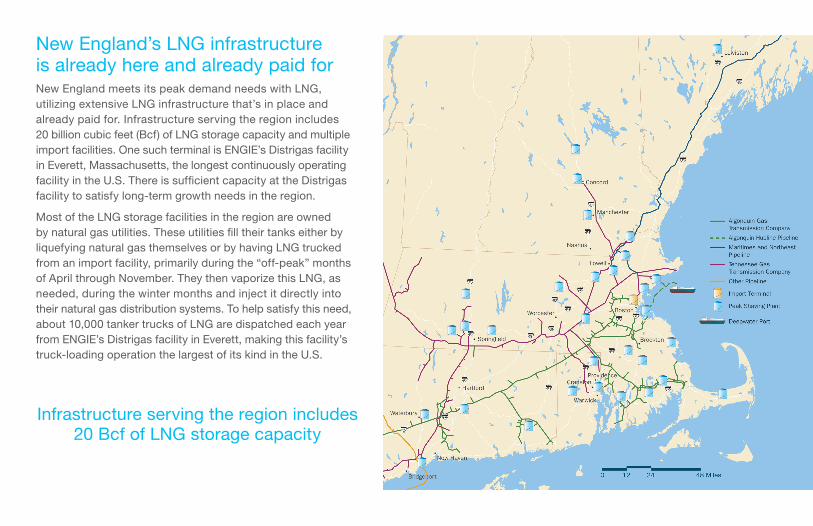
New England’s LNG infrastructure is already here and already paid forNew England meets its peak demand needs with LNG, utilizing extensive LNG infrastructure that’s in place and already paid for. Infrastructure serving the region includes 20 billion cubic feet (Bcf) of LNG storage capacity and multiple import facilities. One such terminal is ENGIE’s Distrigas facility in Everett, Massachusetts, the longest continuously operating facility in the U.S. There is sufficient capacity at the Distrigas facility to satisfy long-term growth needs in the region.
Most of the LNG storage facilities in the region are owned by natural gas utilities. These utilities fill their tanks either by liquefying natural gas themselves or by having LNG trucked from an import facility, primarily during the “off-peak” months of April through November. They then vaporize this LNG, as needed, during the winter months and inject it directly into their natural gas distribution systems. To help satisfy this need, about 10,000 tanker trucks of LNG are dispatched each year from ENGIE’s Distrigas facility in Everett, making this facility’s truck-loading operation the largest of its kind in the U.S.
Infrastructure serving the region includes 20 Bcf of LNG storage capacity

The Everett facility is well positioned and strategically located to meet New England’s demandPeak natural gas consumption can and should be met with peak natural gas supplies. The volume of LNG needed to meet these winter peaks is equivalent to between one and four LNG cargoes a year.
The Everett terminal is strategically located within the region. In addition to its ability to load LNG trucks for delivery throughout New England, the facility has been the sole provider of natural gas to the region’s largest electric generator since it began producing up to 1,550 megawatts a day in 2003. The facility also interconnects directly with New England’s two primary interstate pipeline systems and the largest natural gas distribution system in the region.
Peak Consumption Days*
Winter Period
Peak Consumption (Bcf)
Approximate LNG Cargoes
Nov-Mar 2010-11
10.2
Nov-Mar 2011-12
3.5
Nov-Mar 2012-13
3.3
Nov-Mar 2013-14
6.6
Nov-Mar 2014-15
3.7
Nov-Mar 2015-16
.8
49
17 1937
217
Distrigas peak send-out of 0.5 Bcf/day could easily accommodate additional volumes during winter periods.*Defined as the number of days that New England demand exceeds 3.5 Bcf/day.
All-time peak pipeline daily send-outs: National Grid, 233,293 MMBtu;Algonquin, 276,309 MMBtu; Tennessee, 162,188 MMBtu
Tennessee Gas Pipeline Connection 150 MMScf/day @750 PSIG 15-20% of terminal output is typical
LNG (liquid) deliveries via truck 100 MMScf/day 1 million gallons/day 8-10% of terminal output is typical
Algonquin Gas Pipeline Connection 150 MMScf/day @433 PSIG 15-20% of terminal output is typical
1550 MW Power Station Connection 300 MMScf/day @750 PSIG 30-40% of terminal output is typical
National Grid Distribution System Connection 135 MMScf/day @220 PSIG 10-20% of terminal output is typical
Boil-off connection to gas utility distribution system 50 MMScf/day @22 PSIG 1-2% of terminal output is typical

Advantages of LNG• Has a proven track record spanning 50 years.
• Enhances supply diversity in the region.
• Provides reliable and flexible peaking supplies.
• Doesn’t lock the region into one long-term energy solution.
• Has sufficient unused infrastructure capacity to meet increases in demand today and in the future.
• Demand increases can be met without the environmental disruptions of a pipeline expansion.