New Employee Survey at MGM Springfield
82
New Employee Survey at MGM Springfield: March 2018 through December 2019 Prepared by the UMass Donahue Institute’s Economic & Public Policy Research Group June 2020 Project Leader Andrew Hall, Senior Research Analyst Project Staff Kazmiera Breest, Research Assistant Ellen Aron, Research Assistant Ian Dinnie, Research Assistant Gerhard Kola, Research Assistant Unit Director Mark Melnik, Director of Economic & Public Policy Research
Transcript of New Employee Survey at MGM Springfield

Page | i
New Employee Survey at MGM Springfield: March 2018 through December 2019 Prepared by the UMass Donahue Institute’s Economic & Public Policy Research Group June 2020 Project Leader Andrew Hall, Senior Research Analyst Project Staff Kazmiera Breest, Research Assistant Ellen Aron, Research Assistant Ian Dinnie, Research Assistant Gerhard Kola, Research Assistant Unit Director Mark Melnik, Director of Economic & Public Policy Research

Page | ii
Table of Contents Acknowledgements ........................................................................................................................................... iv
Executive Summary ............................................................................................................................................ v
Introduction ........................................................................................................................................................ 1
Background to the Research Project .............................................................................................................. 1
Regional Context: Springfield and the Surrounding Communities ................................................................. 3
COVID-19 ........................................................................................................................................................ 5
Analysis of the New Employee Survey at MGM Springfield ............................................................................... 6
Description of the Surveyed Employees at MGM Springfield ........................................................................ 6
Reasons for Seeking Employment at the Casino ...................................................................................... 10
Stable Work Opportunities ........................................................................................................................... 12
Previous Employment Status .................................................................................................................... 12
Employees’ Longevity at Previous Jobs .................................................................................................... 13
Employment Status at the Casino and Employees’ Desire for Full-Time Work........................................ 13
Casino Employment and Current Job Portfolios ....................................................................................... 16
Income Opportunities and Benefits ............................................................................................................. 18
Employees’ Previous Income and Benefits ............................................................................................... 18
Employees’ Receiving Salaries and Wages in Their Previous Jobs ........................................................... 20
Opportunities for Local Workers .................................................................................................................. 21
Current Residence by Municipality and Neighborhood ........................................................................... 21
Established Residents and Movers ........................................................................................................... 25
Educational Opportunities and Training ....................................................................................................... 28
Previous Training and Experience ............................................................................................................ 28
Experience from Previous Industry and Occupation ................................................................................ 29
Sources of Training ................................................................................................................................... 31
Interest in Training and Career Development .......................................................................................... 32
Conclusion and Next Steps ............................................................................................................................... 35
Appendix A: Methodology ................................................................................................................................ 37
Licensing, Hiring and the Survey Process ..................................................................................................... 37
Methodology ................................................................................................................................................ 38
Appendix B: Representativeness ...................................................................................................................... 41
Appendix C: Survey Responses by Question .................................................................................................... 44
Appendix D: Survey Instrument........................................................................................................................ 60

Page | iii
List of Tables Table 1. Survey Respondents by Gender ............................................................................................................ 6 Table 2. Survey Respondents by Foreign-Born Status ........................................................................................ 8 Table 3. Survey Respondents by Military Status ................................................................................................ 9 Table 4. Length of Time New Employees Were Employed at Their Most Recent Jobs .................................... 13 Table 5. Previous Employment Status and Casino Employment Status ........................................................... 15 Table 6. Wanting to Work Full-Time at the Casino by Casino Employment Status .......................................... 15 Table 7. Plan to Continue Working at Previous Jobs ........................................................................................ 16 Table 8. Location of Previous Job in Massachusetts by Expectation of Keeping Previous Job ........................ 17 Table 9. Hourly and Salary Wages at MGM Springfield by Previous Employment Status ............................... 20 Table 10. Hourly and Salary Wage Status by Casino Employment Status ........................................................ 20 Table 11. Current Residence by Massachusetts Municipality Type ................................................................. 22 Table 12. Length of Time Employees Have Lived in Current Residence ........................................................... 26 Table 13. Time at Current Residence for Host Community, Surrounding Communities, and All Others ......... 26 Table 14. State of Future Residence ................................................................................................................. 27 Table 15. Top 10 Previous Industries................................................................................................................ 29 Table 16. Top 10 Previous Occupations ........................................................................................................... 30 Table 17. Casino Department ........................................................................................................................... 30 Table 18. Sources of Training ........................................................................................................................... 31 Table 19. Interest in a Career in the Casino Industry ....................................................................................... 32 Table 20. Casino-Related Training by Casino Department Employment ......................................................... 34 Table 21. Interest in Other Types of Training ................................................................................................... 34
List of Figures Figure 1. Massachusetts Gaming Commission Regions...................................................................................... 2 Figure 2. Host and Surrounding Communities ................................................................................................... 3 Figure 3. Unemployment Rates in Springfield, the Surrounding Communities, and Massachusetts ................ 5 Figure 4. Survey Respondents by Age ................................................................................................................ 7 Figure 5. Race and Ethnicity Shares from New Employee Survey Respondents and Springfield Population .... 8 Figure 6. Survey Respondents by Educational Attainment Level ..................................................................... 10 Figure 7. Reasons for Seeking Employment at the Casino ............................................................................... 11 Figure 8. Previous Employment Status ............................................................................................................. 12 Figure 9. Current Employment Status at MGM Springfield .............................................................................. 14 Figure 10. Current Employment Portfolio while Working at the Casino .......................................................... 17 Figure 11. Previous Income of New Employees by Income Category .............................................................. 18 Figure 12. Benefits Received in Casino Jobs Compared to Previous Jobs ........................................................ 19 Figure 13. Current Residence by Municipality .................................................................................................. 23 Figure 14. Residents of the Host and Surrounding Communities by Postal Code and Commuting Distance from the Casino ................................................................................................................................................ 24 Figure 15. Median Gross Rent by Census Tract ($2018) .................................................................................. 25 Figure 16. Previous Casino Experience and Training Prior to Hire ................................................................... 28 Figure 17. Interest in Casino-Related Training ................................................................................................. 33 Figure 18. The Process for Licensing Casino Employees .................................................................................. 38 Figure 19. Survey Respondents by Month........................................................................................................ 39

Page | iv
Acknowledgements Support for this study came from the Massachusetts Gaming Commission under ISA MGC10500003UMS15A establishing the Social and Economic Impacts of Gambling in Massachusetts study. This multi-year project was competitively bid via the Massachusetts Gaming Commission Request for Response (MGC-RA-2012) for Research Services and awarded to the University of Massachusetts Amherst in April 2013. In June 2019 the Massachusetts Gaming Commission issued a subsequent Request for Response (BD-19-1068-1700-1-40973) for Research Services and the University of Massachusetts Amherst was awarded the contract effective January 2020. We would like to thank Mark Vander Linden, Director of Research and Responsible Gaming, Teresa Fiore, Program Manager of Research and Responsible Gaming, Paul Connelly, Former Director of Licensing, Jill Griffin, Director of Workforce, Supplier, and Diversity Development, and Commissioner Bruce Stebbins of the Massachusetts Gaming Commission, all of whose insight and oversight of the New Employee Survey contributed to its clarity and utility as an instrument for data collection. SUGGESTED CITATION: Hall, A., Breest, K., Aron, E. (2020). New Employee Survey at MGM Springfield: March 2018 through December 2019. Hadley, MA: University of Massachusetts Donahue Institute, Economic and Public Policy Research Group. A PDF OF THIS REPORT CAN BE DOWNLOADED AT: umass.edu/seigma/reports

Page | v
Executive Summary Through the establishment of the casino industry in Massachusetts, lawmakers provided avenues for the creation of new jobs, revenue, and economic growth in the state. The Social and Economic Impacts of Gambling in Massachusetts (SEIGMA) study, of which the Economic and Public Policy Research team at the University of Massachusetts Donahue Institute (UMDI) is a part, strives to understand the impact of the casinos on the people and economy of the Commonwealth. This report analyzes the results of a survey administered by the Massachusetts Gaming Commission with incoming employees and profiles the workforce at MGM Springfield. The New Employee Survey was designed to gather a range of information on work-related characteristics of new employees that could not be collected from any other source. Over time, survey data from all three casinos will help workforce development providers and policymakers understand the demographic characteristics of the casino workforce, types of employees applying to work at the casinos, how much pre-employment experience employees have, the extent to which they receive training, and the number of employees drawn from the local labor supply. The purpose of the New Employee Survey is to document new employee characteristics as they are on-boarded into their casino jobs. This study examines new employee survey data through the first year and a half of MGM Springfield’s operation (March 2018-December 2019). To gain insight into how casino jobs fulfill needs for work, the survey asks new employees about their previous employment, residency, experience, and other economic factors. These details give us a baseline view of the types of workers that are applying to MGM Springfield, so that we may properly explore the effects that casino employment might have on them and others in the Commonwealth. Survey data also provide insight into the economic choices that employees face when making the decision to work at a Massachusetts casino as well as the opportunities that they believe employment at the casino can afford them. While all employees were invited to take the survey, not all employees elected to participate in it. These findings reflect a sample of all employees at MGM Springfield. In analyzing the survey data, it became clear that the casino provides opportunities for a wide range of workers. This includes workers, who, by virtue of their previous employment history, income, and residency, are vulnerable to economic hardship. For these workers, MGM Springfield offers economic opportunity beyond their current economic situation. With its downtown location, MGM Springfield employment has provided the following enhanced economic opportunities:
Stable work opportunities • The top reasons why employees wanted to work at MGM Springfield included the opportunity for
career advancement, excitement for working at a casino, and improved pay. • Most employees who were hired in MGM Springfield’s first year and a half of operations worked
full time or more in their previous jobs. Of those who worked less than full-time in their previous jobs, 12 percent had multiple jobs and 10 percent had been unemployed.
• Most of those who had been previously unemployed experienced long-term unemployment and most worked in full-time positions at MGM Springfield.
o More than half of employees who had been previously unemployed had been unemployed for 12 months or longer. Twenty percent of the previously unemployed had been unemployed for 36 months or more.
o Out of all the formerly unemployed workers, 54 percent had a full-time job at MGM Springfield and 42 percent worked part-time at the casino.
• The majority of MGM Springfield’s jobs were full-time, but those jobs were predominantly held by employees who had been full-time in their previous jobs.

Page | vi
o Of those workers who wanted full-time employment at the casino, 60 percent filled full-time positions, while almost 35 percent filled part-time positions.
o Nine percent of respondents expect to be working multiple jobs while employed at MGM Springfield.
Income opportunities and benefits • Most employees were low-wage earners before joining the casino, and many still earned low wages
at the casino. o More than 73 percent of survey respondents earned less than $40,000 in their previous
jobs. 78 percent of respondents earn less than $40,000 at the casino, but some of them are using their positions at the casino as a second job. However, employees expected to earn more tips at MGM Springfield than they had in their previous jobs.
• In addition to income, most employees at MGM Springfield earn benefits, such as paid time off, retirement benefits, or health benefits.
o The most common types of benefits that employees had at MGM Springfield were health benefits and paid time off.
o Over 35 percent of respondents did not have any benefits in their previous jobs, but substantially more of them had benefits in their casino positions regardless of their employment status.
• Though most employees were full-time at MGM Springfield, very few of them were salaried. • Most employees at MGM Springfield earned an hourly wage, regardless of their full-time or part-
time employment status. o Nearly 90 percent of employees were hourly workers at MGM Springfield, while only 17
percent of respondents reported earned salaried wages in their previous jobs. This may be explained by more employees accepting tips in addition to wages, employees foregoing higher wages for more benefits, or employees using their casino job for supplementary income while they keep their previous jobs.
Opportunities for local workers • Jobs at MGM Springfield were filled primarily by Massachusetts residents. Most employees lived in
Massachusetts though a substantial proportion commuted from Connecticut. o Three quarters of survey respondents reported that their current residence was in
Massachusetts, but 21 percent of employees lived in Connecticut. • Of those employees who lived in Massachusetts, the majority lived in either Springfield or the
Surrounding Communities and within a short commuting distance from the casino. o Thirty-nine percent of survey respondents lived in Springfield and another 22 percent lived
in the Surrounding Communities. o The vast majority of employees who lived in Springfield indicated they were established
residents of Springfield, living there one year or more prior to working at the casino. o Among those who lived in Springfield or the Surrounding Communities, many tended to live
in neighborhoods that were within a 10-minute driving distance from the casino and in areas where the median rent was lower than the Springfield or state median rent.
• Sixteen percent of survey respondents moved to take their jobs at the casino and previously worked for MGM Resorts International or another casino operator. The most common states of origin for movers were states with well-established casino industries, including Maryland, New York, Nevada, and Connecticut.

Page | vii
Educational opportunities and training • Most employees did not have direct previous experience working at a casino, but it appears that
this incoming workforce may have been well prepared by virtue of their prior experience that related to positions throughout the casino.
o Over 75 percent of respondents reported that they did not have experience working at a casino prior to hire.
o Even though this suggests that the workforce is new to this industry, the majority of employees previously worked in industries that related to their positions at MGM Springfield, including food services, retail, transportation and warehousing, and security services.
• More than three quarters of respondents claimed to have already received training or expected to receive training prior to hire, and the most common source of casino training was MGM Springfield itself.
• Most employees at MGM Springfield saw training as a way to build a career in the casino industry, but many people sought training in areas that were not specifically related to the casino.
o Employment at MGM Springfield was concentrated in its casino operations and food and beverage operations departments. Many casino employees at MGM Springfield wanted training in their own departments as well as other departments at the casino.
o Beyond the casino, 48 percent of respondents reported having interest in leadership or management training, 20 percent sought higher education, and another 16 percent were interested in adult basic work skills.
Overall, most employees sought jobs at MGM Springfield for career advancement and improved pay. Casino employment offered more opportunities for full-time work and greater access to benefits to a lot of different people in or around Springfield. Casino jobs were more likely to be hourly than salaried positions and most employees earned low wages but more tips. Massachusetts’ casino industry has low barriers to entry because people can work at the casino without needing high levels of educational attainment, specialized training, or experience. Casino employees also probably utilized transferable skills from their previous experiences in similar industries such as food and beverage, retail, and hotel and accommodations. Employees expressed interest in building careers at MGM Springfield, training in casino-related functions, and non-casino-related training, all of which suggests that casino employment offered workers the potential to gain skills that they could use in the casino industry and beyond.

Page | 1
Introduction
Background to the Research Project In November of 2011, Governor Deval Patrick signed the Expanded Gaming Act into law, an act tasked with establishing the grounds for gambling legalization in the Commonwealth. Through the expansion of the casino industry in Massachusetts, lawmakers provided avenues for the creation of new jobs, revenue, and economic growth in the state. To ensure these needs are met, the Massachusetts Gaming Commission (MGC)–established to oversee the implementation of the Expanded Gaming Act–organizes protective measures for communities threatened by potential social and economic impacts of gaming establishments. The UMass Donahue Institute (UMDI), as a part of the Social and Economic Impacts of Gambling in Massachusetts (SEIGMA) research team, is tasked with producing various analyses of economic and fiscal impacts in fulfillment of the MGC’s research agenda and mandates. Jill Griffin, the Director of Workforce, Supplier and Diversity Development at the MGC defines this as follows: “Our legislative mandate is clear: Develop a blueprint to build a gaming industry that creates a more diverse and skilled workforce, and provides opportunities for minority, women, and veteran-owned businesses, ultimately enhancing economic opportunity for all Massachusetts residents. What better way to demonstrate the industry’s long-term commitment to diversity than to start literally with the foundation upon which it is built?”1 The gaming legislation allows for the creation of up to three commercial resort-style casinos in the state and one slots parlor. To reduce internal competition among casinos and maximize their potential benefits, the Commonwealth was divided into three licensing regions, shown in Figure 1 below, with each region able to obtain no more than one full resort-style casino license. Slots-parlor licenses are not geographically limited. To date, two full resort-style licenses and one slots-parlor license have been awarded. In Region A, Plainridge Park Casino–the state’s singular slots-parlor–launched the casino industry with its opening in Plainville, Massachusetts in July of 2015. MGM Springfield, located in Springfield, Massachusetts, rings in as the first resort-style casino in the state, having opened in Region B in August of 2018. Encore Boston Harbor opened in Everett, Massachusetts, in June of 2019, joining Plainridge Park Casino as the second casino in Region A and MGM Springfield as the second resort-style casino in the Commonwealth.
1 Griffin, Jill; Vogel, Mary; Moir, Susan; and Skidmore, Liz; “Building a Diverse Casino Industry”. The Boston Globe, June 19, 2019, https://www.bostonglobe.com/opinion/2019/06/19/building-diverse-casino-industry/OC8DQalIEQroxZIZDDdCWM/story.html

Page | 2
Figure 1. Massachusetts Gaming Commission Regions
Source: Massachusetts Gaming Commission This report aims to capture the condition of the workforce at MGM Springfield by gathering data from the casino’s incoming employees. This qualitative assessment creates a profile of MGM Springfield’s new employees through a survey which asks participants to share information on their employment status and wages prior to hire; whether the applicant currently works for the casino operator or is a new hire; whether they plan to still work at their previous job while working at the casino and the locations of their previous job; how long they were previously employed or unemployed; reasons for seeking the job; previous industry and occupation; salary or wages for the position at the casino as well as whether they will receive tips and have received tips in the past; whether the applicant moved to take the position; the origin and destination of movers; where they currently reside; training received in preparation for work at the casino; level of educational attainment; types and sources of casino-related training received; interest in seeking different types of training; and basic demographic characteristics (see Appendix C and Appendix D). The period for survey data collection comprises the mass-hiring phases that took place from March 2018, leading up to the casino’s opening in August 2018, through the first year and a half of operation at MGM Springfield, which ended in December 2019. With these data, UMDI hopes to characterize the workforce at MGM Springfield and examine the employment impacts of the casino on workers in its host community, surrounding communities, and region. Casino employees are invited to take the MGC New Employee Survey during the I-9 verification step of the hiring process, while they wait to receive their employee badges. All casino employees passed through this process and were given the opportunity to take the survey; however not all employees elected to participate in it. From March 2018 to December 2019, a total of 2,468 employees out of a cumulative total of 4,017 people hired took the survey, representing a 61.4 percent response rate. The total numbers of survey responses or people hired do not reflect the average employment at MGM Springfield at a single point in time. For context, we found that MGM Springfield employed an average of 2,538 people in its first 12 months of operation (September 2018 through August 2019).2 The pool of survey respondents includes newcomers and seasonal employees of the gaming industry, those who are applying to work at MGM Springfield’s vendors on site, employees of the MassMutual Center in Springfield, and those who were
2 Peake, T., Breest, K., Aron, E. (2020). MGM Springfield First Year of Operation: Economic Impact Report. Hadley, MA: University of Massachusetts Donahue Institute, Economic and Public Policy Research Group. https://www.umass.edu/seigma/reports

Page | 3
permanently transferred from other gaming properties owned by MGM Resorts International. For more information about our methodology, please see Appendix A.
Regional Context: Springfield and the Surrounding Communities MGM Springfield is one of many gambling establishments owned by of MGM Resorts International, a global company with 30 properties worldwide, employing 83,000 people globally. MGM Springfield is open 24 hours a day and every day per week, including holidays and weekends. Patrons are entertained by the 2,500 slot machines, 93 gaming tables, and 23 poker tables found at MGM Springfield. Located off of East Columbus Avenue in the heart of downtown Springfield, this facility offers a variety of non-gambling services and amenities, including a 251-room hotel, spa, several restaurants, bars, shops, convention space, movie theater, bowling alley, seasonal ice-skating rink, farmers’ market, and live entertainment. Valet parking and free self-parking are available at their multi-level parking garage on MGM Way. The city of Springfield is located in Hampden County, which is in the southern part of the Pioneer Valley in Western Massachusetts. Bordering the city are municipalities with Surrounding-Community designations from the MGC,3 namely: Agawam, Chicopee, East Longmeadow, Holyoke, Longmeadow, Ludlow, West Springfield, Wilbraham, seen in Figure 2 below. Figure 2. Host and Surrounding Communities
3 The MGC defines a Surrounding Community as “a municipality in proximity to a host community that the Commission determines experiences or is likely to experience impacts from the development or operation of a gaming establishment”. For more information about Surrounding Communities, please see https://massgaming.com/about/community-mitigation-fund/host-surrounding-communities/surrounding-community-agreements//

Page | 4
The 2018 population of Springfield was estimated at 155,032 residents, which makes it the largest city in Western Massachusetts, and the third largest city in the Commonwealth. As the most populous city in the area, Springfield is an important hub in the Western Massachusetts and Northern Connecticut economy. Sixty percent of the jobs in Springfield are held by residents from other towns.4 Over half of workers who reside in Springfield also work there, while most of the rest commute to municipalities adjacent to Springfield.5 Springfield is recognized by the state as a Gateway City, a designation given to cities experiencing economic hardships from the decline in industries that used to be “a ‘gateway’ to the American Dream”.6 Ongoing challenges that face Springfield include poverty rates higher than the state average and a lack of employment opportunities for its residents.7 At the height of the Great Recession, unemployment rates in Springfield and Holyoke were consistently in the double digits and have declined steadily since then, following statewide trends toward historically low unemployment levels. However, Springfield’s unemployment rates have typically exceeded those of the Surrounding Communities and the state for the past 30 years and continue to do so through the present (Figure 3). The median household income in Springfield was $36,730, compared to $77,378 for Massachusetts as a whole between 2014 and 2018. A high school diploma is the most common educational level among residents 25 years of age and over, while only one quarter holds an Associate’s, Bachelor’s, graduate, or professional degree. The wages, education levels, and English-language proficiency of Springfield residents are also lower than the state average. As discussed in earlier baseline community reports, 8 across Host and Surrounding Communities, socio-economic conditions in Springfield have stood out as most challenging, along with those in two other of Hampden County’s Gateway Cities, Chicopee and Holyoke. Against this backdrop of the region’s economic conditions, the state aimed for the new casino industry to be a vehicle for enabling further economic recovery efforts following the Great Recession. For these reasons—and the high unemployment rates particularly—Springfield has been the site of many new economic development endeavors. Investment in employment opportunities in Springfield and Hampden County is all the more relevant now, as the coronavirus pandemic may induce an economic recession. 4 U.S. Census Bureau, 2011-2015 5-Year American Community Survey Commuting Flows, Table 3 (Residence MCD/County to Workplace MCD/County Flows for the United States and Puerto Rico Sorted by Residence Geography: 5-Year ACS, 2011-2015) 5 Ibid. 6 The Massachusetts Gateway City Program description can be found here: https://www.masshousing.com/portal/server.pt/community/home/217/supporting_gateway_cities/4495 7 Quick facts on Springfield compared to Massachusetts as a whole can be found here: https://www.census.gov/quickfacts/fact/table/MA,springfieldcitymassachusetts/INC910218 8 Economic Profiles of Host and Surrounding Communities: Springfield Host Community Profile. Surrounding Community Socioeconomic Indicators. SEIGMA. October 20, 2015. See: https://www.umass.edu/seigma/reports

Page | 5
Figure 3. Unemployment Rates in Springfield, the Surrounding Communities, and Massachusetts
Source: Massachusetts Executive Office of Labor and Workforce Development, Local Area Unemployment Note: Not seasonally adjusted The location of Springfield for the Commonwealth’s first resort casino is part of a recent wave of public- and private-sector investment in the city. According to a recent report by MassDevelopment,9 projects such as the $95 million renovation of Springfield Union Station, the Silverbrick apartment project, the Springfield Innovation Center, and MGM Springfield are illustrative of this investment and are contributing to the revitalization of the city by drawing economic activity back into the region. MGM Springfield itself represents the largest private-sector investment in Springfield’s history.
COVID-19 This study covers the period of MGM Springfield’s operations prior to March of 2020, when the coronavirus (COVID-19) outbreak began to affect businesses and economic conditions in Massachusetts. In response to the COVID-19 pandemic and for the safety of casino employees and patrons, the MGC voted unanimously on March 14, 2020, to temporarily suspend operations of the state’s three casinos, Plainridge Park Casino, MGM Springfield, and Encore Boston Harbor.10 Ten days later, on March 23, 2020, Governor Charlie Baker’s Executive Order required all “non-essential businesses to cease in person operation” and issued a stay-at-home advisory for all residents of the Commonwealth.11 As of early May, Hampden County had the sixth highest rate of confirmed cases of—and the highest number of deaths from—the coronavirus in the state.12 It is in this context that this report is being released. This continues to be a time of great uncertainty, not only related to the health of the region during the pandemic, but also for MGM Springfield and its employees. As of the publication of this report, most casino employees have been furloughed13 and there is
9 https://www.massdevelopment.com/assets/pdfs/annual-reports/TDI_report_2018.pdf 10 https://massgaming.com/blog-post/mgc-temporarily-suspends-operations-at-encore-mgm-springfield-and-plainridge-park/ 11 https://www.mass.gov/news/governor-charlie-baker-orders-all-non-essential-businesses-to-cease-in-person-operation 12 https://www.nepr.net/post/race-income-nursing-homes-why-does-hampden-county-have-states-highest-rate-covid-19-deaths#stream/0 13 https://www.westernmassnews.com/news/mgm-resorts-reports-many-furloughed-employees-might-be-laid-off/article_4f29bb90-90c8-11ea-8583-6b17e5f8e422.html

Page | 6
now the potential for layoffs.14 Since this study reports on business conditions prior to the onset of COVID-19, it does not include any of the employment effects related to public health measures or resulting business closures. We will continue to monitor the effects of these new developments on casino employees in future reports.
Analysis of the New Employee Survey at MGM Springfield In this section, we present the findings of our analysis of the New Employee Survey at MGM Springfield by first contextualizing the demographics of survey respondents to that of the surrounding Springfield area and state using public data sources. This comparison is helpful in understanding the diversity of the MGM Springfield employees in relation to the Springfield region and the state.
Description of the Surveyed Employees at MGM Springfield The workforce at MGM Springfield can be viewed as reflecting a subset of a wider population of residents from Springfield and the neighboring region. Given the MGC’s goal to use casino employment to help expand economic opportunity in the Commonwealth, it is important to assess how the population of MGM Springfield’s new employees compares to demographic data collected by the U.S. Census Bureau on the residents of Springfield and the Surrounding Communities as a whole.15 This section profiles the survey respondents and serves to call attention to several demographic groups that MGM Springfield’s Host Community Agreement with Springfield stipulates the casino is committed to hiring, specifically minorities, women, and veterans.16 In terms of gender, the new employees surveyed are made up of nearly even parts female and male with a slightly higher proportion of employees identifying as male compared to the resident population aged 20 to 79 years of age in Springfield and Massachusetts. The distribution of responses compared to Springfield and the state can be seen in Table 1. Table 1. Survey Respondents by Gender
Gender Survey Data1 U.S. Census Data for
the City of Springfield U.S. Census Data for
Massachusetts N % N % N %
Female 1,151 48.2% 56,039 53.4% 2,551,886 51.5% Male 1,239 51.8% 48,932 46.6% 2,400,431 48.5% Total 2,390 100.0% 104,971 100.0% 4,952,317 100.0%
1Eight survey respondents (0.3%) preferred not to answer the gender question. Source: MGC New Employee Survey; U.S. Census Bureau, 5-Year 2018 American Community Survey, Table S0101 (Age and Sex) Note: Census data represent the resident population 20 to 79 years of age in order to reflect the age profile of the survey population. Figure 4 below shows the full age distribution of the survey respondents and the median ages of the survey population and the working-age populations (18-65) of Springfield and the state for context. With a median
14 https://www.nepr.net/post/mgm-springfield-warns-almost-1900-layoffs-possible-amid-pandemic#stream/0 15 Data from the U.S. Census Bureau’s American Community Survey represent data on the residents of the Host and Surrounding Community region and do not necessarily describe all of the people who work there. However, comparing the demographics of the casino workforce to the resident populations can still be illustrative because most of the casino workforce is drawn from the regional population and local hiring is a priority of MGM Springfield. 16 http://massgaming.com/wp-content/uploads/Springfield-Host-Agreement-Summary.pdf

Page | 7
age of 34, employees at MGM Springfield tended to be fairly young. This is lower than the working-age population of Springfield, where the median age was 37, according to the latest Census data. The state population, in contrast, skews slightly older with the median working-age being 40. The younger age profile of the new casino employees suggests that most are in the early stages of their careers. Figure 4. Survey Respondents by Age
Source: MGC New Employee Survey; Steven Ruggles, Sarah Flood, Ronald Goeken, Josiah Grover, Erin Meyer, Jose Pacas and Matthew Sobek. IPUMS USA: Version 10.0 [ACS]. Minneapolis, MN: IPUMS, 2020. https://doi.org/10.18128/D010.V10.0 Note: The median ages of the working-age populations of Springfield and Massachusetts are based on calculations from 2018 Census data available through IPUMS USA, https://usa.ipums.org/usa/. Census data represent the resident population aged 16-64 in order to reflect the working-age population and the age profile of the respondents in the survey population. Figure 5 displays the racial and ethnic composition of the employees at MGM Springfield, showing the share that each racial or ethnic group makes up at the casino. A comparison of the shares of the racial and ethnic composition of the MGM Springfield employees shows that the casino employee population appears to be different from that of the Massachusetts working-age population (defined here as residents 18 years of age and older), specifically in regards to the presence of racial minorities. The MGM Springfield workforce is majority-minority, with only 44 percent of survey respondents reporting their race as White, compared to 71 percent in Massachusetts as a whole. Though it differs from the state at large, the share of racial and ethnic minorities at MGM Springfield is more similar to Springfield’s working-age population. In Springfield, only 33 percent of the population is White, while 19 percent is Black and 42 percent is Hispanic; shares that are more similar to those found in MGM Springfield’s employees than in the state as a whole.
Survey Median: 34 State Median: 40
Springfield Median: 37
0
20
40
60
80
100
120
140
19 21 23 25 27 29 31 33 35 37 39 41 43 45 47 49 51 53 55 57 59 61 63 65 67 69 72 74 76
Num
ber o
f Res
pond
ents
Age

Page | 8
Figure 5. Race and Ethnicity Shares from New Employee Survey Respondents and Springfield Population
Source: MGC New Employee Survey; U.S. Census Bureau, 5-Year 2018 American Community Survey, Table B01001 (Sex by Age by Race & Ethnicity) Note: The Springfield total excludes the category Some Other Race because we did not have a similar category in the survey data. The Springfield data also represent the resident population aged 18 years and over in order to reflect the working-age population and the age profile of the respondents in the survey population. Thirteen percent of casino surveyed employees reported being born outside of the United States, according to Table 2 below. This statistic is slightly higher than that of Springfield, where the percentage of the foreign-born population aged 18 years of age and over is 12 percent, but lower than that of the state, which is over 19 percent. In contrast, the foreign born range from six percent of the population aged 18 and over in East Longmeadow to 17 percent in West Springfield.
Table 2. Survey Respondents by Foreign-Born Status
Source: MGC New Employee Survey; U.S. Census Bureau, 5-Year 2018 American Community Survey, Table B05003 (Sex by Age by Nativity and Citizenship Status) Note: Census data represent the resident population aged 18 years and over in order to reflect the working-age population and the age profile of the respondents in the survey population. The MGC is specifically interested in seeing whether people who have been in the military are taking advantage of employment opportunities at the casino and so the survey asks respondents about veteran status. The survey responses compared to Census data for Springfield and the state are presented in Table 3. The overwhelming majority of survey respondents reported that they have never served in the U.S. Military or Reserves. The share of the casino employee population that identified as being a veteran is
Foreign-Born Status Survey Data U.S. Census Data for
the City of Springfield
U.S. Census Data for Massachusetts
N % N % N % Foreign-born 308 12.9% 13,948 12.1% 1,060,811 19.5% Native-born 2,074 87.1% 101,563 87.9% 4,389,485 80.5% Total 2,382 100.0% 115,511 100.0% 5,450,296 100.0%
44%
29%
15%8%
4% 0.3%
White or Caucasian Only
Hispanic or Latino
Black or African AmericanOnly
Asian, Native Hawaiian orOther Pacific IslanderOnlyTwo or More Races
Native American orAlaskan Native Only
New Employee Survey Respondents
N = 2,284
33%42%
19%
2%3% 1%
N = 121,337
Springfield

Page | 9
slightly higher than that of Springfield and closer to the share of veterans at the state level which is over five percent of residents aged 18 years and over. Table 3. Survey Respondents by Military Status
Veteran Status Survey Data
U.S. Census Data for the City of Springfield
U.S. Census Data for Massachusetts
N % N % N % Veteran 127 5.3% 5,666 4.9% 315,859 5.8% Non-veteran 2,262 94.7% 109,787 95.1% 5,129,516 94.2% Total 2,389 100.0% 115,453 100.0% 5,445,375 100.0%
Source: MGC New Employee Survey; U.S. Census Bureau, 5-Year 2018 American Community Survey, Table B21001 (Sex by Age by Veteran Status for the Civilian Population 18 Years and over) Note: Census data represent the resident population aged 18 years and over in order to reflect the working-age population and the age profile of the respondents in the survey population. Figure 6 below compares the pool of survey respondents from MGM Springfield with the population of people 25 and over from Springfield according to their educational levels. The percentage of people with at least a Bachelor’s degree is a common measure of a highly educated population, and it is shown in grey in Figure 6. The other categories of educational attainment are shown in blue. Only 20.5 percent of all MGM Springfield employees had a Bachelor’s degree or higher. This statistic is low compared to the average educational profiles of people at the state and national levels in 2018. For residents aged 25 and over in Massachusetts and the nation, the percentages of people with at least a Bachelor’s degree were 43 percent and 32 percent, respectively. It is also low compared to most of the casino’s Surrounding Communities, where the shares of the population aged 25 and over with at least a Bachelor’s degree ranges from 19 percent in Chicopee to 65 percent in Longmeadow. Still, this figure is on par with educational attainment levels for the residents of Springfield, of whom 19 percent had at least a Bachelor’s degree in 2018.17 The most common educational level completed among MGM Springfield’s survey respondents was a high school diploma or GED, with 31 percent of employees selecting this response. The number of employees with some college coursework completed but no formal degree received comprised a similar share, with 30 percent of all respondents. This criterion captures both those who were pursuing a degree and stopped before receiving it and those who were not pursuing a degree at all. The ages of employees in this category ranged from 20 to 76, with 41 percent being under 30 and 59 percent being 30 or over, suggesting that most employees in this category were not of traditional college age. Educational requirements varied by casino job title with some positions requiring at least a high school diploma or a college degree while others did not have a minimum educational requirement. The vast majority of MGM Springfield’s workforce having less than a Bachelor’s degree, as indicated in blue in Figure 6, could reflect the minimum educational levels that casino jobs required. It could also suggest the unavailability—or unaffordability—of educational opportunities among a largely vulnerable labor force. It is possible that some workers may be using their employment at the casino to follow an alternative path to gain the knowledge and skills needed to achieve their work goals.
17 2018 5-Year American Community Survey Estimates, Table B15003 (Educational Attainment for the Population 25 Years and over)

Page | 10
Figure 6. Survey Respondents by Educational Attainment Level
New Employee Survey Respondents Springfield Population 25 Years and over
Source: MGC New Employee Survey; U.S. Census Bureau, 2018 5-Year American Community Survey, Table B15003 (Educational Attainment for the Population 25 Years and over) Note: The Census data reflect the resident population aged 25 years and over, whereas the survey population includes individuals between the ages of 19 and 24. Moreover, the Census data do not separate trade or vocational schools from its other educational attainment categories.
Reasons for Seeking Employment at the Casino The survey asks new employees about their reasons for working at the casino in the first place; and these details give us a baseline of the types of workers that are seeking employment at MGM Springfield. Their responses also provide insight into the economic choices that employees faced when making the decision to work at MGM Springfield as well as the opportunities that they believed employment at the casino could afford them. The top reasons why employees wanted to work at MGM Springfield included the opportunity for career advancement, excitement for working at a casino, and improved pay. The full range of employees’ reasons for seeking employment are listed in Figure 7 below. These findings are consistent with the most popular reasons reported by new employees at the Commonwealth’s first casino, Plainridge Park Casino.18 New casino employees show a lot of interest in using their jobs at the casino to improve their careers, whether that means that they start or continue a career in the casino industry or gain critical skills that they can use to transition into another field. Sixty-five percent of survey respondents reported that they wanted to work at MGM Springfield for the opportunity of career advancement. Forty-seven percent of respondents saw casino employment as an opportunity to learn new skills, while 17 percent reported that their casino positions represented a higher role or more responsibilities than their previous jobs. Less than four percent of respondents reported that not needing a college degree or specialized training attracted them to their jobs at MGM Springfield; this underscores the general view that the casino industry is very accessible in that a great number of jobs in this industry do not require high levels of educational attainment, previous experience, or relevant training.
18 Hall, A. (2019). New Employee Survey at Plainridge Park Casino: Analysis of Fiscal Year 2018. Hadley, MA: University of Massachusetts Donahue Institute, Economic and Public Policy Research Group, https://www.umass.edu/seigma/sites/default/files/FY18%20PPC%20New%20Employee%20Survey%20Report%20%28final%29.pdf
Less than high school
diploma23%
High school graduate or
GED31%
Trade or technical high school graduate,*
0%
Some college, no degree
19%
Associate's degree
8%Bachelor's degree
12%
Master's degree or higher7% N = 95,266
Less than high school
diploma3%
High school graduate or
GED31%
Trade or technical high school graduate4%
Some college, no degree
30%
Associate's degree
11%
Bachelor's degree17%
Master's degree or higher4% N = 2,409

Page | 11
Figure 7. Reasons for Seeking Employment at the Casino
Source: MGC New Employee Survey Note: Survey respondents were allowed to select multiple responses so the totals will not sum to the total of respondents for this question.
Another motivation that resonated strongly with new employees at MGM Springfield relates to their economic vulnerability in general and their need for primary—and secondary—sources of income in particular. Improved pay was the third most common response among employees at MGM Springfield and was reported by 51 percent of survey respondents as at least one of their reasons for wanting to work at the casino. This finding captures the sentiments of a range of employees, including those who sought more advanced positions as well as those who needed additional income. In fact, 13 percent of survey respondents cited wanting to work at the casino because they needed supplementary income. There are other indications that the new casino workforce may be economically vulnerable. Over 37 percent of new employees sought employment at MGM Springfield for improved benefits, suggesting that their previous employment situations did not provide them with sufficient retirement, paid-time-off, health, or other benefits—or that the employees lacked benefits altogether. Moreover, 15 percent of respondents reported that they were previously unemployed and needed work while only four percent looked for part-time opportunities and were not interested in full-time work. While a relatively small proportion, the respondents selecting this reason for employment may be expressing that they prefer part-time employment because they may already be working part-time or full-time elsewhere. Alternatively, these respondents may not have been available for full-time work due to being in school, taking care of family members, or because they were retired. A small percentage of employees noted that they pursued a job at MGM Springfield because it offered them a job that was more stable and secure, thereby suggesting that casino employment was contributing to economic stability in their lives. All of these findings suggest that the new casino workforce at MGM Springfield is eager to use casino employment to benefit their careers but many may be economically vulnerable. These findings also show that some new employees perceive their jobs at MGM Springfield to be a potential pathway to a career or a way to fulfill a previously unmet need for work or income. In the next section, we will further address the actual impacts of the new employees’ casino jobs on their overall economic conditions.
65.1%55.6%
50.9%47.1%
37.3%33.4%
20.3%17.1%
15.1%13.4%
7.1%4.1%3.8%
2.0%0.5%0.2%
0% 10% 20% 30% 40% 50% 60% 70%
Opportunity for career advancementExcitement for working at a casino
Improved payOpportunity to learn new skills
Improved benefitsCloser to home
Flexible hoursJob is at a higher role
Have been unemployed and needed workNeed supplementary income
It offers me jobs that are more stable and secureNeed part-time work, no interest in full-time
No college degree neededNo specialized training needed
Already worked for the operator or another casinoOther N = 2,418

Page | 12
Stable Work Opportunities Casino employment attracted workers from different backgrounds and employment types. We saw earlier that career advancement, being previously unemployed or underemployed, and the need for more work and employment stability were some of the reasons that new employees sought positions at MGM Springfield. The unemployed and those who are working part-time for economic reasons but would prefer full-time employment are two particularly vulnerable groups of workers that are in need of greater economic opportunities. However, the casino also provided economic opportunities to people who had been employed full-time in their previous jobs and saw casino employment as a way to transition into a different field of work or advance their careers in a similar field. In this section, we look at employees’ previous employment status, their overall portfolio of work across any and all jobs they have at one time, and assess how their jobs at the casino may be fulfilling their employment needs.
Previous Employment Status Figure 8 below shows employees’ previous employment status and highlights the diverse employment history of people for whom MGM Springfield is providing employment opportunities. Prior to working at MGM Springfield, 62.5 percent of employees worked full-time or more and 37.3 percent reported working less than full-time. More than half (53 percent) of respondents reported having a full-time job, while 25 percent reported having a part-time job. Ten percent of employees (N = 251) were previously unemployed. Increasing the engagement of segments of the labor force that previously did participate in the labor market is one major way in which MGM Springfield is creating more economic opportunities in the Commonwealth. The majority of those who reported being previously unemployed were looking for a job but could not find employment. The long-term unemployed is a particularly vulnerable group in Massachusetts—and Springfield—and there is evidence that casino jobs are fulfilling this group’s need for employment. Fifty-three percent of those previously unemployed indicated that their unemployment had lasted 12 months or more and 20 percent reported a period of unemployment lasting 36 months or more (see Appendix C, Q9). A much smaller share of the previously unemployed (N = 27) were actually first-time jobseekers whose first employer was MGM Springfield. For this group of younger adults, employment at the casino is serving as the first job for those entering the workforce.
Figure 8. Previous Employment Status
Source: MGC Employee Survey Another 12 percent worked multiple jobs at once, with the majority (nine percent) reporting that these jobs totaled full-time or more. The fact that this subgroup of individuals worked in a full-time position and a
Full-time job53%
Multiple jobs totaling full-time
or more9%
Multiple jobs totaling less than full-time
3%Part-time job
25% Unemployed10%
N = 2,463

Page | 13
part-time position or in multiple part-time positions suggests that a single job alone could not support them financially. This reveals another important dimension of economic vulnerability and underscores an implied need for more stable work and higher wages.
Employees’ Longevity at Previous Jobs The New Employee Survey asked respondents about how long they had been employed in their previous jobs. This question helps to shed light on the possible impacts that casino employment had on local jobs and long-term employees and speaks to how far along new casino employees were in their careers before working at MGM Springfield. New employees at MGM Springfield had various levels of longevity at their previous postions, as indicated in Table 4 below. While the survey asks respondents to report how long they were employed at their most recent positions and does not capture the length of experience that an individual had throughout their job history, this question can highlight some level of job experience that employees brought with them to their new jobs. This question can also help to illuminate how many new employees were long-time employees at their most recent jobs before working at MGM Springfield. Overall, 63.4 percent of respondents stated that they worked at their previous jobs for less than three years. Nearly one quarter of survey respondents reported working at their most recent jobs for less than one year while almost 40 percent of respondents said that they worked in their previous jobs for more than a year but less than three years. Almost 19 percent of respondents worked at their most recent jobs for more than three years but less than six years; and nearly 18 percent were at their previous jobs for six years or more. As mentioned earler, there is a high concentration of younger workers in the surveyed population, so it could be argued that the most recent job referenced in the question could have been many employees’ first job and, even if it were not their first job, many new employees did not have a substantial amount of work experience prior to working at MGM Springfield. The argument that many workers were likely in the entry- or mid-level stages of their careers before working at MGM Springfield is supported by the analysis of survey respondents’ ages combined with their stated experience. In total, 82 percent of survey respondents worked in their previous positions for fewer than six years. Table 4. Length of Time New Employees Were Employed at Their Most Recent Jobs
Length of Time Employed at Most Recent Job Response Count
Response Percent
Less than one year 419 23.9% More than 1 year but less than 3 years 692 39.5% More than 3 three years but less than 6 years 330 18.8% More than 6 years but less than 10 years 123 7.0% 10 years or more 188 10.7% Total valid responses 1,752 71.0% Missing responses 716 29.0% Total 2,468
Source: MGC New Employee Survey
Employment Status at the Casino and Employees’ Desire for Full-Time Work Most employees at MGM Springfield had full-time positions, according to the survey data. Sixty-four percent of survey respondents reported working one full-time job (Figure 9). Full-time positions provide jobholders with economic stability by affording them with stable hours, steady income, and frequently

Page | 14
access paid leave or other benefits. Part-time employment at the casino can also provide some economic stability for people who are seeking more work or a way to supplement their income despite the potential for seasonal fluctuations in their hours. Employees working one part-time job at the casino made up the next largest group of respondents (32 percent). On-call workers and those working multiple part-time jobs across departments at the casino represented a combined four percent of all survey respondents. Figure 9. Current Employment Status at MGM Springfield
Source: MGC Employee Survey An examination of the outcome of employees’ employment status is incomplete without also considering their previous employment and whether they wanted more work. To assess the ability of MGM Springfield to provide enhanced economic opportunity in the Commonwealth, we also sought to address the critical question of underemployment, or “labor underutilization”. Underemployment views discouraged workers and people who want full-time work but have found only part-time work in addition to the “officially” unemployed, or people who are not employed but have looked for work in the past four weeks.19 Table 5 below compares responses to questions about previous employment status and current employment status at MGM Springfield. In general, jobs at MGM Springfield seem to be addressing some labor underutilization that exists in the Commonwealth but there are still some areas of need. Seventy-eight percent (N = 837) of employees who had worked full-time and 46 percent (N = 229) of those who worked part-time in their previous jobs found full-time employment at the casino. Among those who used to work multiple jobs, 52 percent (N = 101) of people whose combined jobs totaled full-time or more and 38 percent (N = 20) of people who worked less than full-time found full-time employment at the casino. Perhaps the greatest qualitative gains in employment status occurred among those who had been previously unemployed. The opportunity for employment at MGM Springfield, regardless of their employment status at the casino, has provided formerly unemployed respondents with economic opportunities that they did not have before. Table 5 shows that, out of a total of 224 formerly unemployed workers, 54 percent had a full-time job at MGM Springfield (N = 121) and 42 percent were working there part-time (N = 95). However, it cannot be assumed that all workers wanted to work full-time hours at the casino, or conversely, that workers were content with their employment status at the casino. Almost 20 percent of
19 https://massbudget.org/reports/swma/wages-income.php
One full-time job64%
One part-time job32%
Multiple part-time jobs
1%
On-call job3%
N = 2,049

Page | 15
those who had previously worked full-time and more than 49 percent of formerly part-time workers held part-time jobs at the casino. Also, about 40 percent those who previously had multiple jobs worked in part-time jobs at MGM Springfield. These workers may not necessarily have been interested in full-time positions due to being a full-time student or retired, caring for children or a family member, already having another job elsewhere, or other reasons. Table 5. Previous Employment Status and Casino Employment Status
Source: MGC Employee Survey Note: *Other includes On-Call jobs (N = 56) and multiple part-time jobs (N = 29) at the casino. Table shows valid responses only as some respondents answered one, both, or neither of the two questions that asked about their previous employment status and their employment status at the casino. In total, there were 376 people who took the survey but did not provide information about their current casino employment status and there were five who did not provide informaiton about their previous employment status. To explore this question further, the survey asks respondents to express whether they wanted—or did not want—to work full-time at the casino in order to hone in on those workers who might not have been satisfied with the opportunities they had for work and wanted more work. Table 6 below spotlights just those workers who reported that they wanted full-time positions at the casino in terms of their employment status at the casino. Not all of those who wished to work full-time at the casino were able to obtain full-time employment. Slightly over 60 percent (N = 373) of respondents who indicated that they preferred a full-time position at MGM Springfield secured full-time jobs. Less than 35 percent, or 216, of respondents who wanted full-time work found only part-time employment at the casino. The remaining respondents who sought full-time positions either worked in an on-call job or worked in more than one of the casino’s departments on a part-time basis. Table 6 also provides further evidence that some employees preferred to work less than full-time at MGM Springfield as illustrated by the 134 respondents who reported that they did not want to work full-time. Table 6. Wanting to Work Full-Time at the Casino by Casino Employment Status
Source: MGC Employee Survey Note: Response counts fewer than six have been suppressed in order to ensure respondents’ anonymity. “ND” indicates “Not Disclosed”.
Previous Employment Status
Employment Status at the Casino
One Full-Time Job One Part-Time Job Other* Total Valid Responses
N % N % N % N % Full-time job 837 78.1% 213 19.9% 22 2.1% 1,072 100% Part-time job 229 45.8% 248 49.6% 23 4.6% 500 100% Multiple jobs totaling full-time or more 101 51.8% 74 37.9% 20 10.3% 195 100% Multiple jobs totaling less than full-time 20 37.7% 21 39.6% 12 22.6% 53 100% Unemployed 121 54.0% 95 42.4% 8 3.6% 224 100% Total Valid Responses 1,308 651 85 2,044
Employment Status at the Casino
Wanted Full-Time at the Casino
Did Not Want Full-Time at the Casino
N % N % One full-time job 373 60.2% <6 ND One part-time job 216 34.8% 99 73.9% Multiple part-time jobs 6 1.0% <6 ND On-call job 25 4.0% 32 23.9% Total Valid Responses 620 100% 134 ND

Page | 16
Casino Employment and Current Job Portfolios Working at the casino may not necessarily replace or fulfill employees’ need for more work so an examination of casino workers’ employment status at the casino does not tell the whole story. Here, we look at the outcome of casino employment on the employees’ overall employment needs, according to the total portfolio of jobs that they may have at one time. In particular, we look at whether new casino employees intended to keep their previous job or jobs, what their employment status was after obtaining their jobs at MGM Springfield, and how their casino jobs fit into this portfolio of jobs. The New Employee Survey asks respondents whether they planned to keep working at their previous job or jobs while working at the casino. The survey responses are summarized in Table 7 below. The high number of missing responses might indicate that some respondents felt that they could not answer because they might have already left their previous jobs. Missing responses could also derive from confusion about the question or just skipping the question altogether. Among those who did answer the question, nearly as many people indicated they would continue working at their previous job or jobs as would not. Thus, for some new employees, the casino job did not necessarily replace their previous job and might not have fulfilled all their needs in terms of hours, pay, or other reasons. Since MGM Springfield is open 24 hours a day and seven days per week, its operating hours are conducive to employees combining their casino jobs with jobs with hours restricted to first or second shifts. Table 7. Plan to Continue Working at Previous Jobs
Source: MGC New Employee Survey Table 8 below summarizes the location of previous jobs in Massachusetts by respondents’ plans to keep working at—or leave—their previous jobs. Many respondents reported their previous jobs to be in Springfield, the Surrounding Communities, and other municipalities elsewhere in Massachusetts; many others planned to add their casino job to an existing local job in the Host and Surrounding Communities. Among respondents who expected to keep working in their previous jobs, 57 percent worked in Springfield and 24 percent worked in the Surrounding Communities. Less than 20 percent were located in other Massachusetts municipalities. Jobs that workers were leaving were also concentrated in the Host and Surrounding Communities. For respondents who planned to leave their previous jobs, nearly 48 percent of those jobs were reported to be in Springfield and 27 percent were located in the Surrounding Communities. One quarter of those respondents stated that their previous jobs were located in other cities or towns across the state.
Plans to keep working in this job/these jobs after being hired by the casino
Response Count
Response Percent
Yes 314 43.0% No 320 43.8% Not sure 96 13.2% Total valid respondents 730 29.6% Missing responses 1,738 70.4% Total 2,468 100.0%

Page | 17
Table 8. Location of Previous Job in Massachusetts by Expectation of Keeping Previous Job
Source: MGC New Employee Survey This discussion about employees keeping or leaving their previous jobs informs our glimpse into their current portfolio of jobs while working at the casino. As Figure 10 below illustrates, the survey asks respondents how much they expect to work after they are hired, including the job at the casino for which they have been hired. Sixty percent of respondents reported that they expected to work only one full-time job while 31 percent responded that they would have one part-time job. Less than 10 percent of survey respondents reported that they intended to have multiple jobs. This shows that casino employment may be fulfilling many people’s needs for more work, but there are still some for whom casino employment is one of a larger portfolio of overall jobs that they have. Figure 10. Current Employment Portfolio while Working at the Casino
Source: MGC New Employee Survey
Location of Previous Job in Massachusetts
Plan to Keep Previous Job
Plans to Leave Previous Job
Not Sure about Keeping or
Leaving Previous Job
Total
N % N % N % N % Host Community (Springfield) 125 56.8% 104 47.5% 40 54.8% 269 52.5% Surrounding Communities 52 23.6% 60 27.4% 18 24.7% 130 25.4% Neither Host or Surrounding Communities 43 19.5% 55 25.1% 15 20.5% 113 22.1%
Total valid responses 220 100.0% 219 100.0% 73 100.0% 512 100.0% Missing responses 3 2 1 6
Total 223 221 74 518
Multiple jobs9.2%
One full-time job
59.9%
One part-time job
30.9%
N = 758

Page | 18
Income Opportunities and Benefits As discussed in the previous section, casino employment presented people with an opportunity for full-time work or increased hours compared to what they had before. The third most common reason why new employees wanted to work at MGM Springfield was improved pay, as seen in Figure 7 above. This includes people for whom their positions at the casino were a higher role than they had before, a position in a new field, or a source of supplementary income. Individuals who earn close to minimum wage or work for an hourly wage represent an economically vulnerable segment of the labor force in Massachusetts, especially since hourly workers’ income is based on the number of hours that they are able to work and this is not always consistent from week to week. For this reason, employment at MGM Springfield could serve as an opportunity for some workers to obtain more stable work and higher pay, and in so doing, improve their economic situations. Here, we discuss the role of casino jobs for MGM Springfield’s employees as they relate to pay, benefits, and hours.
Employees’ Previous Income and Benefits Illustrating the self-reported income of survey respondents, Figure 11 below suggests that most new employees at MGM Springfield previously worked in jobs paying relatively low wages. The majority of workers (73.4 percent) earned less than $40,000 in their previous job, with over 40 percent of workers making under $20,000 a year. For context, Massachusetts’ hourly minimum wage was $11.00 per hour ($22,880 annually) in 2018 and $12.00 per hour ($24,960 annually) in 2019.20 Wages in the form of tips were not common among respondents’ previous jobs, as 72.7 percent of workers reported that they did not receive tips in their most recent primary jobs (see Appendix C, Q18). Substantially more new employees were expecting to receive tips as part of their income from MGM Springfield than from their previous job, with 41.2 percent reporting that they expected to receive tips from the casino job as opposed to 27.3 percent who reported receiving tips from their most recent previous job (see Appendix C, Q18 and Q23). Figure 11. Previous Income of New Employees by Income Category
Source: MGC Employee Survey
20 In Rhode Island and Connecticut, where some commuting casino workers live, the minimum wage was $10.10 per hour ($21,014 annually) in 2018. Connecticut’s minimum wage increased to $11.00 per hour ($22,880 annually) in 2019 while Rhode Island’s increased to $10.50 per hour ($21,840 annually).
23.5%
20.0%
17.3%
12.6%
9.5%
6.2%4.8%
1.8% 1.1% 1.1% 1.5% 0.5% 0.2%0%
5%
10%
15%
20%
25%
Resp
onse
Per
cent

Page | 19
Based on survey responses, over three quarters of workers (78.3 percent) at MGM Springfield earned less than $40,000, which is substantially lower than the state’s annual median household income of $77,378.21 Given that the 2019 poverty threshold in Massachusetts was $25,750 annually for a family of four,22 it appears that the majority of workers could be classified as needing enhanced economic opportunity, depending on their family size and other factors that were not covered in the survey. Assessing wage data from survey responses must be done with caution, as the wages reported by new employees represent respondents’ speculations about what they expected to earn at the casino rather than data on what they actually earned. For an analysis of the actual wage data provided by the casino, please see the First Year Operating Report for MGM Springfield.23 Providing employees with the access to medical insurance, saving for retirement, and paid leave so that they can still be paid when they are sick is another important way in which casino employment could help jobholders increase their economic security. In addition to a paycheck, all but 879 (36 percent of respondents) reported receiving some form of benefits provided by their most recent previous job. Though many received a combination of paid time off, health benefits, and retirement benefits, the largest proportion of workers received paid time off (54 percent) and health benefits (53 percent) while fewer workers received retirement benefits (38 percent) (see Appendix C, Q19). Once in their casino jobs, employees’ receipt of benefits improved across different employee types and categories. As seen in Figure 12 below, 75 percent of survey respondents reported receiving health benefits and 72 percent reported receiving paid time off for sick or vacation time in their jobs at the casino. Retirement benefits still had lower levels of responses compared to health benefits or paid time off, but more employees reported having them at the casino than they had with previous employment. The number of workers who did not have any benefits also decreased from 36 percent of respondents in their previous jobs to only 16 percent at the casino. Increased access to benefits appeared to be available for employees who were part time and full time as well as hourly and salaried. Figure 12. Benefits Received in Casino Jobs Compared to Previous Jobs
Source: MGC Employee Surrvey Note: Survey respondents were allowed to select multiple responses so the totals will not sum to the total of respondents for this question (N = 2,412 for benefits at previous job; N = 2,362 for benefits at casino jobs). 21 https://www.census.gov/quickfacts/fact/table/MA/INC110218 22 https://aspe.hhs.gov/prior-hhs-poverty-guidelines-and-federal-register-references 23 Peake, T., Breest, K., Aron, E. (2020). MGM Springfield First Year of Operation: Economic Impact Report. Hadley, MA: University of Massachusetts Donahue Institute, Economic and Public Policy Research Group. https://www.umass.edu/seigma/reports
52.5%
38.0%
53.6%
36.4%
75.0%
58.7%
72.2%
15.5%
0%10%20%30%40%50%60%70%80%
Health benefits Retirement benefits Paid time off for sickor vacation
None
Shar
e of
Tot
al S
urve
y Re
spon
ses
Previous Job Casino Job

Page | 20
Employees’ Receiving Salaries and Wages in Their Previous Jobs Though ‘full-time’ was the most common response, very few of those full-time workers had salaried positions at MGM Springfield. Only 414, or 17 percent of respondents, reported having salaried wages in their job before working at MGM Springfield. Of the 1,296 formerly full-time workers, 988 (76 percent) relied on hourly wages (Table 9). Full-time work is not always associated with receiving a salary and the vast majority of MGM Springfield’s full-time workers were paid hourly.
Table 9. Hourly and Salary Wages at MGM Springfield by Previous Employment Status
Source: MGC New Employee Survey Note: Not Reported for Hourly/Salary Status: 44; Total Responses for Hourly/Salary Status: 2,468 Survey respondents overwhelmingly expected to earn an hourly wage at the casino, with only 11.7 percent reporting that they expected to work for a salary (Table 10). This may be explained by more employees accepting tips in addition to wages, employees foregoing higher wages for more benefits than they had previously, or employees using their casino job for supplementary income while they keep their previous jobs. MGM Springfield’s 24-hour per day operating hours might suggest the prevalence of hourly workers over salaried workers since this would provide flexibility for those who might have made working at MGM Springfield their second job. Table 10. Hourly and Salary Wage Status by Casino Employment Status
Casino Employment Status Hourly Wage Salary Wage Total Valid Responses
One full-time job 1,070 240 1,310 One part-time job 638 13 651 Multiple part-time jobs 28 0 28 On-call job 55 <6 56 Missing responses 351 30 419 Total valid responses 1,791 254 2,049 Total 2,142 284 2,468
Source: MGC Employee Survey
Hourly and Salary Wages by Employment Status
Hourly Wage Salaried Wage Total Valid Respondents N % N %
Full-time job 988 49.3% 308 74.4% 1,296 Part-time job 567 28.3% 34 8.2% 601 Multiple jobs totaling full-time or more 200 10.0% 26 6.3% 226 Multiple jobs totaling less than full-time 61 3.0% 1 0.2% 62 Unemployed 189 9.4% 45 10.9% 234 Total valid respondents 2,005 99.8% 414 100.0% 2,419 Missing responses 5 0.2% 0 0.0% 5 Total 2,010 100.0% 414 100.0% 2,424

Page | 21
Opportunities for Local Workers Hiring locally benefits the economic prospects of existing residents, and, by extension, households, neighborhoods, and the community. In the cases of Springfield, the Surrounding Communities, and the broader region, many residents may not have had access to these employment opportunities before and seek to benefit directly from jobs at MGM Springfield. This is especially true for long-term residents who may have lived in the local area during the Great Recession and may still be recovering economically. New workers who move from areas outside of the region can bring economic benefits too. However, depending on their job and income levels, new people and families moving into the area for work can actually become competitors to locals for jobs, services, and housing. If these newcomers obtain higher-paid work and purchase more valuable homes, it may cause housing prices and other costs of living to rise, which may displace lower income residents.24 Thus, tracking the experience and economic prospects of local workers is essential. In this section, we examine the geographic areas from which MGM Springfield draws its employees with a particular look at employment among residents of Springfield and the Surrounding Communities, residents of the broader region, and long-term or established residents. MGM Springfield’s Host Community Agreement with the City of Springfield describes its commitment to hiring employees from the local region, and Springfield in particular. Residents are defined as individuals whose primary place of residence is Springfield (with examples of proof of residence including their driver’s license, addresses on bills, or proof of voter registration).25 This stipulation in the Host Community Agreement demonstrates MGM’s recognition of the importance of employing local workers.
Current Residence by Municipality and Neighborhood Three-quarters of the surveyed population of casino employees at MGM Springfield reported living in Massachusetts, and another 21 percent lived in Connecticut with the remaining respondents living in states such as New York, Pennsylvania, Rhode Island, Maryland, and New Jersey (see Appendix C, Q29). The 75 percent of all respondents who reported that their current residence was in Massachusetts (over 1,800 survey respondents) lived in 71 of the Commonwealth’s 351 cities and towns. The Massachusetts municipality with the highest number of casino employees is Springfield, although there are high numbers of employees in many of the Surrounding Communities as well, including Chicopee, Holyoke and West Springfield. In fact, 39 percent of all survey respondents reported that their current residence was in Springfield, and another 22 percent of all respondents reported living in the casino’s Surrounding Communities. Among just those respondents who were current Massachusetts residents, a total of 83 percent lived in either the Host Community or Surrounding Communities, illustrating that employees at MGM Springfield are predominantly local (Table 11). This degree of representation from the Host and Surrounding Communities could be explained by employees seeking jobs in the vicinity of where they live or MGM Springfield’s efforts to recruit new hires from the surrounding municipalities.26 Respondents also lived
24 For a deeper analysis on how MGM Springfield effects real estate in the area, please reference: Renski, H., Peake, T., Hall, A., McAuliffe, D., & Astor, J. (2019). Real Estate Impacts of MGM Springfield in Springfield and Surrounding Communities. Hadley, MA: University of Massachusetts Donahue Institute, Economic and Public Policy Research Group. https://www.umass.edu/seigma/sites/default/files/MGM%20Real%20Estate%20Report_Final_10.22.19.pdf 25 “Fourth Amendment to the Host Community Agreement by and between City of Springfield, Massachusetts and Blue Tarp Redevelopment, LLC”, https://massgaming.com/wp-content/uploads/Springfield-HCA-4th-Amendment-7-24-18.pdf 26 According to MGM Springfield’s license agreement, “MGM Springfield expects to bring 3,000 permanent jobs and 2,000 construction jobs to Downtown Springfield. MGM has established a hiring goal of 35 percent of the workforce

Page | 22
elsewhere in Hampden County, such as Westfield, or in Hampshire County in municipalities such as Belchertown and South Hadley. A much smaller percentage of survey respondents reported living in counties outside of the Springfield metropolitan area, ranging from Berkshire County to Suffolk and Bristol counties. Table 11. Current Residence by Massachusetts Municipality Type
Source: MGC Employee Survey The spread of employee residencies can also be seen in Figure 13, where the darkest colors represent higher concentrations of employees. Just across the border in Connecticut, casino employees also resided in a wide swath of municipalities, with some of the largest numbers living in Enfield. This is not surprising given the location of the casino so close to the Massachusetts-Connecticut border and the commuting shed—the area that workers might or are known to commute for employment27—that overlays the Springfield, Enfield, and Hartford region. There is another large pocket of employees residing in Norwich (New London County), Connecticut, which is in the vicinity of Mohegan Sun Casino & Resort and Foxwoods Resort Casino. This finding demonstrates that the vast majority of casino jobs at MGM Springfield were held by Massachusetts residents, but a sizeable, albeit much smaller, portion of MGM Springfield’s workforce lives in Connecticut.
from the City of Springfield and 90 percent from a combination of Springfield and the region.” https://massgaming.com/about/mgm-springfield/ 27 Greenbelt Alliance. Land-Use Planning Dictionary. Accessed 4_15_20. https://www.greenbelt.org/land-use-planning-dictionary/
Current Residence by Massachusetts Municipality
Response Count
Response Percent
Host Community 959 53.3% Springfield 959 53.3%
Surrounding Communities 541 30.1% Chicopee 158 8.8%
West Springfield 89 4.9% Holyoke 82 4.6% Agawam 71 3.9%
East Longmeadow 45 2.5% Longmeadow 41 2.3%
Ludlow 28 1.6% Wilbraham 27 1.5%
Other Hampden County 121 6.7% Hampshire County 109 6.1% Worcester County 36 2.0% Franklin County 19 1.1% All Other Massachusetts Counties 14 0.8% Total valid respondents 1,799 99.3% Missing responses 12 0.7% Total 1,811

Page | 23
Figure 13. Current Residence by Municipality
Source: MGC New Employee Survey As mentioned earlier, the shorter commuting distances from some communities to MGM Springfield could be a factor that helps explain the large numbers of employees living in the surrounding and adjacent municipalities. Figure 14 below delves deeper into this question by examining concentrations of employees living in the Host and Surrounding Communities by postal code, which we use as a proxy for neighborhood. The map also shows fill patterns indicating commuting distances from MGM Springfield in five-minute intervals. We can see that neighborhoods with the darkest shading, indicating the highest number of casino employees live there, generally overlap with the areas within a 10-minute travel time from the casino. Neighborhoods and communities with distances that are slightly farther away—at least a 15-minute commute from the casino—generally have fewer employees as represented by the lighter shades.

Page | 24
Figure 14. Residents of the Host and Surrounding Communities by Postal Code and Commuting Distance from the Casino
Source: MGC New Employee Survey Another important consideration regarding the high numbers of casino employees living in the neighborhoods surrounding the casino, could be the lower cost of living in those neighborhoods. Data collected by the U.S. Census Bureau on median gross rents, or the actual rent paid by tenants, can help describe the cost of living in an area and make another convincing case about the economic need of many of the casino employees. Median gross rent data are not available by zip code, but they are available by census tract,28 which can serve as another proxy of neighborhoods. Figure 15 below shows median gross rent for the census tracts in Springfield and the surrounding municipalities. The darker shades represent higher gross rent whereas the lighter shades represent lower gross rent. Areas with hatched lines denote the lack of available data. The tracts that surround and include MGM Springfield, which we saw in the maps above, have the largest concentrations of casino employees and, according to the map below, have some of the lowest median gross rents in the city. Most of these tracts have rents that range from $600 to $900 per month, which is reflective of the city’s median gross rent of $847 per month but less than the state’s median gross rent of $1,225. This suggests that areas of Springfield and the communities surrounding MGM Springfield with the highest concentrations of employees also happen to be communities where rents are more affordable. Together, these data show that MGM Springfield is providing jobs to local residents that may improve local economic conditions.
28 Census tracts are sub-county geographic designations that usually comprise between 1,200 and 8,000 residents, https://www2.census.gov/geo/pdfs/education/CensusTracts.pdf.

Page | 25
Figure 15. Median Gross Rent by Census Tract ($2018)
Source: U.S. Census Bureau, 2018 5-Year American Community Survey, Table B225064 (Median Gross Rent) Note: Dollars are expressed in nominal 2018 dollars and not adjusted for inflation. One dot represents one individual survey respondent. Hatched census tracts represent areas where data on median gross rent were not available.
Established Residents and Movers MGM Springfield’s Host Community Agreement with Springfield does not explicitly distinguish between established residents of Springfield and those who recently moved for their jobs at the casino.29 However, these are important distinctions in our analysis of determining how many local residents are filling casino jobs and how long they have lived in their current residence. Recent movers from other areas are likely to be in a different economic situation than many longer-term or established residents of economically distressed neighborhoods of Springfield, and, for this reason, it is critical to be able to differentiate between these two groups of workers. The New Employee Survey asks employees about the length of time that they have lived in their current residences in order to determine whether they were established residents (defined here as, living in their current residence for one year or more) or more recent residents (living in their current residence for less than one year). As can be seen in Table 12 below, the vast majority of survey respondents were established residents with 77 percent indicating that they had lived in their current residence for one year or more. Nearly 23 percent of respondents claimed that they had lived at their current addresses for less than a year. 29 “Fourth Amendment to the Host Community Agreement by and between City of Springfield, Massachusetts and Blue Tarp Redevelopment, LLC”, https://massgaming.com/wp-content/uploads/Springfield-HCA-4th-Amendment-7-24-18.pdf

Page | 26
Table 12. Length of Time Employees Have Lived in Current Residence
Length of Time in Current Residence
Response Count
Response Percent
One year or more 1,745 77.4%
Less than one year 509 22.6%
Total valid respondents 2,254 91.3%
Missing responses 214 8.7%
Total 2,468
Source: MGC Employee Survey In Springfield and the casino’s Surrounding Communities, established residents were the most common group employed by the casino (Table 13). Among all of the respondents who answered this question, 39 percent (N = 875) indicated that they lived in Springfield, and 78 percent of those respondents (N = 685) reported that they had lived in Springfield for one year or more. The same is true for the Surrounding Communities, where 513 respondents reporting living in those municipalities and 78 percent were established residents of those communities. Those who lived in other municipalities followed the same pattern. More than three quarters of these workers had lived in their residences for one year or more. These findings provide evidence that, regardless of where they lived, most new casino employees have been established residents of their communities. Table 13. Time at Current Residence for Host Community, Surrounding Communities, and All Others
Length of Time at Current Residences for Host Community, Surrounding Communities, and All Others
Response Count
Response Percent
Host Community 875
Less than one year 190 21.7% One year or more 685 78.3%
Surrounding Communities 513 Less than one year 115 22.4% One year or more 398 77.6%
Neither the Host or Surrounding Communities 866
Less than one year 204 23.6% One year or more 662 76.4%
Total valid responses 2,254
Source: MGC Employee Survey In addition to attracting workers within the region, employment opportunities at MGM Springfield are prompting individuals to move their residencies, mostly from outside Massachusetts but also from around the state. More than one quarter of respondents (N = 621) either indicated having already moved or having plans to move to work at MGM Springfield. Most of this group—16 percent of all survey respondents—had moved, while the remaining 10 percent was still in the planning phases of moving and may not have moved at all. Only a small part of MGM Springfield’s workforce moved from one Massachusetts residence to another, accounting for 21 percent of those who had already moved. Having a job that was closer to home was also an important consideration for new employees with nearly one third of survey respondents choosing to work at MGM Springfield for this reason (Figure 7). Taken together, these data paint a picture

Page | 27
of a casino workforce that was mostly local and comprised largely of established resdents who lived in Springfield or the neighboring region well before they began employment at MGM Springfield. For movers from other states, many relocated from states with well-established casino industries. Of the states that MGM Springfield workers moved from, Maryland (13.7 percent of movers), New York (10.4 percent of movers), Nevada (9.8 percent of movers), and Connecticut (5.7 percent of movers), were the top four, collectively accounting for 39.6 percent of movers. The presence of large casino industries in those states is likely one explanation that these are the most common states of origin among movers. Notably, 31 of the 36 respondents who reported moving from Nevada reported previously living in Las Vegas. Of these 31 respondents, 22 indicated that they previously worked for the same casino operator, while five respondents indicated they worked for a different casino operator. Of the 22 who previously worked for MGM Resorts International, 17 were salaried employees, while the remaining five were hourly. We suspect that these individuals were transferred from Las Vegas to Springfield to help open the location and provide training to new hires, given their experience within MGM and their salaried positions. Similarly, of the 50 respondents who moved from Maryland, 24 previously worked for MGM Resorts International, and 12 of them were salaried suggesting that they might have also been transferred to assist with the opening of MGM Springfield. Of the remaining 26 respondents from Maryland, 18 worked for a different casino. This high level of casino industry experience amongst respondents from Nevada and Maryland explains why a significant number of workers came from such far distances (Appendix C, Q35, and Q36). The New Employee Survey also asks whether employees intend to move sometime in the future to accommodate their positions at the casino and, if so, to identify the city and state to which they think they might relocate. These questions were intended to help clarify the extent to which the casino is attracting workers to the region and identifying where these workers might ultimately settle. The responses to these questions are presented in Table 14 below. Only 10 percent of all survey respondents (N = 248) indicated that they planned to move to a new residence but had not moved yet. The top states of their future residence were Massachusetts and Connecticut with a small number indicating other states. Out of the respondents who wished to move to Massachusetts, 67.1 percent planned to move from another state, including Connecticut. Almost 33 percent of respondents who intended to move to Massachusetts already lived elsewhere in the state. More than half of those who wished to move elsewhere in Massachusetts indicated that they would move to Springfield and another 15 percent indicated that they would live in one of the Surrounding Communities. Of those who planned to move to Connecticut, 65.7 percent were current Connecticut residents. While these questions could provide evidence that casino employment at MGM Springfield is attracting movers to the Commonwealth, the New Employee Survey is taken only once and there is no guarantee that the employees will follow through with their stated plans to move or will still move to the same designated location if they do move. Table 14. State of Future Residence
Source: MGC Employee Survey Note: Response counts fewer than six have been suppressed in order to ensure respondents’ anonymity. “ND” indicates “Not Disclosed”.
Workers Who Planned to Move
Future State of Residence Total
Massachusetts Connecticut Other Current State of Residence N % N % N % N Massachusetts 57 32.9% <6 ND <6 ND 63 Connecticut 67 38.7% 46 65.7% <6 ND 113 Other 49 28.3% 21 30.0% <6 ND 72 Total 173 100.0% 70 100.0% <6 ND 248

Page | 28
Educational Opportunities and Training Another important way in which casino employment was intended to benefit workers in the Commonwealth was by offering training and educational opportunities to employees of all experience levels to improve economic opportunities among Massachusetts residents with limited or no training, no relevant experience, or lower levels of educational attainment. As stated earlier, 79.5 percent of MGM Springfield’s employees had less than a Bachelor’s degree and the highest level of educational attainment most common among them was a high school diploma or equivalent. We also saw that many new employees were attracted to employment at MGM Springfield for reasons related to career advancement and learning new skills. In this section, we discuss opportunities for skill development and career advancement at MGM Springfield with a particular focus on employees’ experiences from previous jobs and sources of—and interest in—training. Jobs that do not require specialized training or prior relevant experience could provide the opportunity to gain valuable training and job experience, open avenues for further education or certification, and possibly develop skills needed for professional growth.
Previous Training and Experience Earlier, we discussed a possible association between the length of time new employees worked at their most recent jobs and their overall job experience and time spent in the workforce (see Table 4). However, neither can reveal the types of experience that new employees brought with them—nor how relevant that experience was—to their new jobs at MGM Springfield. An interesting aspect of the casino workforce at MGM Springfield has to do with the level of related experience and training that employees had before working there. Figure 15 below explores both. When asked whether they had previous experience in the gaming industry, most employees surveyed responded in the negative. Slightly more than 75 percent of respondents indicated that they did not have casino experience prior to hire. Since MGM Springfield was the second of the Commonwealth’s casinos to open, and the first resort casino in Massachusetts, it is not surprising that so few employees would have experience working in a casino, especially if they were not originally from states that had casinos. Employees were similarly asked if they received or expected to receive pre-employment training (Figure 16). Seventy-six percent of employees indicated that they had received (or would receive) some sort of training before being hired by MGM Springfield. The nature of this training was not specific, but it could potentially range from modules of computer training or coursework to on-the-job training or shadowing a more senior employee with more experience. Figure 16. Previous Casino Experience and Training Prior to Hire
Source: MGC New Employee Survey
24.4%
75.6%
0%10%20%30%40%50%60%70%80%
Had previous casinoexperience
Did not have previouscasino experience
Resp
onse
Per
cent
N = 2,035
76.1%
23.9%
0%10%20%30%40%50%60%70%80%
Received Training Did not receiveTraining
Resp
onse
Per
cent
N = 2,410
Had Previous Casino Experience Received Training

Page | 29
Experience from Previous Industry and Occupation Many employees had backgrounds in retail or food services, and it is likely that they had some level of relevant experience for their casino positions despite never working in the casino industry before. Among the top industries that respondents worked in previously (Table 15), seven are related to MGM Springfield work areas across the resort casino suggesting that incoming employees were drawing on their previous work for transferrable skills. The most common industries that employed nearly 53 percent of survey respondents included food services, the casino industry, and retail. Coming in at a close 11th place was the accommodations (hotels; B&B; inns; motels; etc.) industry (not shown), which is relevant to MGM Springfield because it has a hotel. Other less common, but still relevant, previous industries included transportation and warehousing, finance and insurance, and security services. Given that 66 percent of MGM Springfield’s new hires came from the top 10 industries, it appears that this incoming workforce could be well equipped with prior experience that related to positions throughout the facility. Table 15. Top 10 Previous Industries
Top 10 Industries Prior to Working at the Casino Response Count
Response Percent
Food Services (food and drinking establishments; catering; etc.) 576 23.6% Casino/gambling Industries 426 17.4% Retail 282 11.5% Health Care (including hospitals and EMS) 145 5.9% Arts, Entertainment, and Recreation 105 4.3% Transportation and Warehousing 87 3.6% Finance and Insurance (including banking) 81 3.3% Education (primary; secondary; higher ed.) 77 3.2% Manufacturing 75 3.1% Security Services (surveillance; guarding, etc.) 73 3.0%
Source: MGC Employee Survey Similar to the results above relating to employees’ previous industries, the top three categories of previous occupations also related to resort casino work, including food and beverage operations, casino operations, and retail sales (Table 16). Together, these top three previous occupation categories make up about 51 percent of the previous occupations of all respondents. Casino operations was the second highest previous occupation among casino employees as those employees potentially had the most directly relatable experience to bring to MGM Springfield. The fourth and fifth employing occupations were Finance and Administration, and Security, which make up 7.1 percent and 6.0 percent, respectively, of all respondents’ previous occupations and are both important positions at MGM Springfield. Each of the remaining previous occupations included less than five percent of the respondents but still involved skill sets that could have been relevant to positions at MGM Springfield.

Page | 30
Table 16. Top 10 Previous Occupations
Source: MGC Employee Survey Employment at MGM Springfield seems to be concentrated within its casino operations and food and beverage operations departments. Though hourly workers made up the majority of MGM Springfield’s new employees overall, a breakdown of these workers by department shows that the trend tends to differ by group (Table 17). Finance, accounting & IT appears to have the most amount of workers that will be working for a salaried wage, followed by casino administration and then casino marketing. However, these workers make up only 35, 30, and 23 percent of employees in these departments, respectively. Some of the largest groups such as casino operations and food and beverage operations tended to have the smallest percentage of salaried employees, with a mere eight and five percent, respectively. These trends suggest that salaried wages are correlated with the type of work that is being done at the casino, and that MGM Springfield tends to reserve salaries for those in more back-of-house positions than guest-facing, front-of-house ones. Table 17. Casino Department
Source: MGC Employee Survey Note: Response counts fewer than six have been suppressed in order to ensure respondents’ anonymity. “ND” indicates “Not Disclosed”.
Top 10 Occupations Prior to Working at the Casino Response Count
Response Percent
Food and Beverage Operations (bartending, busing, serving, cooking, supervising) 536 22.0% Casino Operations (slots, table games, poker, cashiering, count rooms) 379 15.6% Retail Sales (cashier, retail store manager, customer service) 326 13.4% Finance and Administration (accounting, financial analysis, purchasing, MIS/IT, auditing) 173 7.1%
Security (security guard, surveillance, correctional officer, police) 146 6.0% Hotel and Facility Operations (housekeeping, front desk, valet) 103 4.2% Production Worker (machinist, welder, plant operator, food processing) 89 3.7% Building and Grounds/Maintenance 82 3.4% Personal and Home-based Services (hairdresser, home health aide, childcare, fitness trainer) 81 3.3%
Health Worker (physician, nurse, physical therapist, EMT) 66 2.7%
Salaried or Hourly Status by Casino Department Salary Hourly Not Reported Total
N % N % N N Casino Administration 15 30% 34 68% 1 50 Casino Marketing 16 23% 54 77% 0 70 Casino Operations 55 8% 595 91% 3 653 Entertainment & Event Production 6 8% 74 93% 0 80 Facility Maintenance 8 6% 118 94% 0 126 Finance, Accounting and IT 12 35% 22 65% 0 34 Food & Beverage Operations 34 5% 678 95% 2 714 Hotel Operations 10 5% 210 95% 1 221 Recreation <6 ND 13 87% 1 ND Retail 0 0% 13 100% 0 13 Security Services 13 7% 176 93% 1 190 Transportation 0 0% 25 100% 0 25 Warehouse Operations <6 ND 13 93% 0 ND No Response 113 43% 117 44% 33 263 Total 284 12% 2,142 87% 42 2,468

Page | 31
Sources of Training In another question, the New Employee Survey asked respondents to report on the sources of training that they had already received or sources of training that they expected to receive. These responses are summarized in Table 18 below. The majority of employees, 65 percent, reported that they received training from another casino or expected to receive training from MGM Springfield itself. Some other sources of training included employees’ previous, non-casino employers, other trade, technical or vocational schools, and other community colleges. The second most popular source of training (N = 158) was the Massachusetts Casino Career Training Institute (MCCTI), which is a partnership among the state’s Workforce Investment Boards (WIBs), Regional Employment Boards (REBs), 15 community colleges, educators, unions, and training providers to offer casino-related education, training, and certification programs.30 Several of the participating schools are located in Springfield (e.g., Springfield Technical Community College, American International College, and Western New England University), the surrounding communities (e.g., Holyoke Community College), or elsewhere in the Pioneer Valley (e.g., UMass Amherst’s Isenberg School of Management). MCCTI features a Gaming School that focuses on card games as well as specialized training for workers in food and beverage, hotel operations, and other related occupations. Training also includes courses for “foundational” skills, or basic job skills for adults, including resources for workers pursuing a GED, English-language acquisition for non-English or limited-English speakers, and basic math skills. The Gaming School is neither free nor inexpensive with prerequisite Level 1 classes ranging from $399 for Blackjack or Roulette to $599 for Craps.31 Moreover, completion of the program does not guarantee successfully obtaining at job at MGM Springfield, although people who are hired receive reimbursements.32 MGM Springfield has partnered with different organizations to help enrollees find scholarships and financial aid and the MCCTI reports that the Gaming School is free to veterans.33 Table 18. Sources of Training
Sources of Training already Received (or Anticipated Training)
Response Count
Response Percent
From this casino or another casino 1,559 64.5% Massachusetts Casino Career Training Institute (MCCTI) 158 6.5% Holyoke Community College 71 2.9% Springfield Technical Community College 43 1.8% Previous company 21 0.9% Other trade, technical or vocational school 20 0.8% Other community college/university 17 0.7% Other 18 0.7% Total 2,417
Source: MGC New Employee Survey Note: Survey respondents were allowed to select multiple responses so the response and response percent total will not sum to the total of respondents for this question.
30 http://www.mccti.org/home.html 31 https://www.mccti.org/descriptions.html 32 https://www.bostonglobe.com/business/2018/04/01/mgm-springfield-embarks-hiring-spree/fLAXdBSOIul4ydsobAfKqK/story.html 33 https://www.mccti.org/scholarships.html

Page | 32
Interest in Training and Career Development In this final section, we explore the career development ambitions of this new workforce, specifically related to training and skills development. This section seeks to provide information about areas of training that new employees expressed interest in pursuing in an effort to identify types of training for local or regional workforce development organizations or the casino itself that may benefit the new casino employees’ career aspirations. Workers were optimistic about their new jobs and the potential they could offer. As discussed earlier, most new employees wanted to work at MGM Springfield because they sought career advancement and were enthusiastic about working at a casino. This finding highlights the aspirational motivations characterizing many of MGM Springfield’s new employees. Not only do many new employees aspire to career advancement, but, as Table 19 below illustrates, they more specifically hope to build a career in the casino industry. When asked directly about their interest in having a career in the casino industry, over 93 percent of employees surveyed reported that they are at least “somewhat interested.” The most common response was “very interested,” with more than 81 percent of respondents selecting this option. Table 19. Interest in a Career in the Casino Industry
How interested are you in a career in the casino industry?
Response Count
Response Percent
Very interested 1,955 81.4% Somewhat interested 284 11.8% Neutral (neither interested nor disinterested) 145 6.0% Somewhat disinterested 8 0.3% Very disinterested 10 0.4% Total valid respondents 2,402 97.3% Missing responses 66 2.7% Total 2,468
Source: MGC Employee Survey Given that most of MGM Springfield’s surveyed employees had less than a Bachelor’s degree and pursued casino employment for reasons related to career advancement, we aimed to explore the nature of training as it relates to the casino workforce. The New Employee Survey asked employees about their interest in casino- and non-casino-related training and invited them to indicate the types of training that they would like to receive. As can be seen in Figure 17 below, there was a high demand for training in casino operations and food and beverage operations, which also happen to be departments with the largest concentrations of casino employees.

Page | 33
Figure 17. Interest in Casino-Related Training
Source: MGC New Employee Survey Note: Survey respondents were allowed to select multiple responses so the response and response percent total will not sum to the total of respondents for this question. There is further evidence that MGM Springfield employees hoped to build careers in the casino industry and wanted training in the departments in which they worked as well as in other departments at the casino. Table 20 below explores employees’ interest in different types of casino-related training by their department at MGM Springfield. Darker shading in the table indicates the highest concentrations of response counts for each type of training. For instance, large numbers of employees in Casino Operations and Food and Beverage Operations are interested in training in Finance and Administration and General Management. The greatest number of respondents indicating their interest in training in Hotel and Facility Operations already work in the casino’s Hotel Operations department but a substantial number of Food and Beverage workers would also like training in that field. These examples could suggest employees’ interest in career growth within the casino as well as interest in the acquisition of skills or experience in order to transition to other departments within MGM Springfield. It is also possible that casino training at MGM Springfield could help employees gain specific skills necessary to pivot to jobs at other casinos or other industries altogether.
37.4%
31.4%
25.5%
22.0%
16.2%
12.1%
11.9%
11.0%
7.9%
3.6%
Casino Operations (slots, table games, poker, cashiering, countrooms, security)
Food and Beverage Operations (bartending, busing, serving,cooking, supervising)
Customer Service
General Management, Supervisor
Hotel and Facility Operations (housekeeping, front desk, valet,grounds keeping, maintenance, facilities, retail)
Security
Sales and Marketing (advertising, box office, promotions,public relations)
Human Resources Administration (human resources,personnel)
Finance and Administration (accounting, financial analysis,purchasing, MIS/IT, auditing)
None N = 2,468
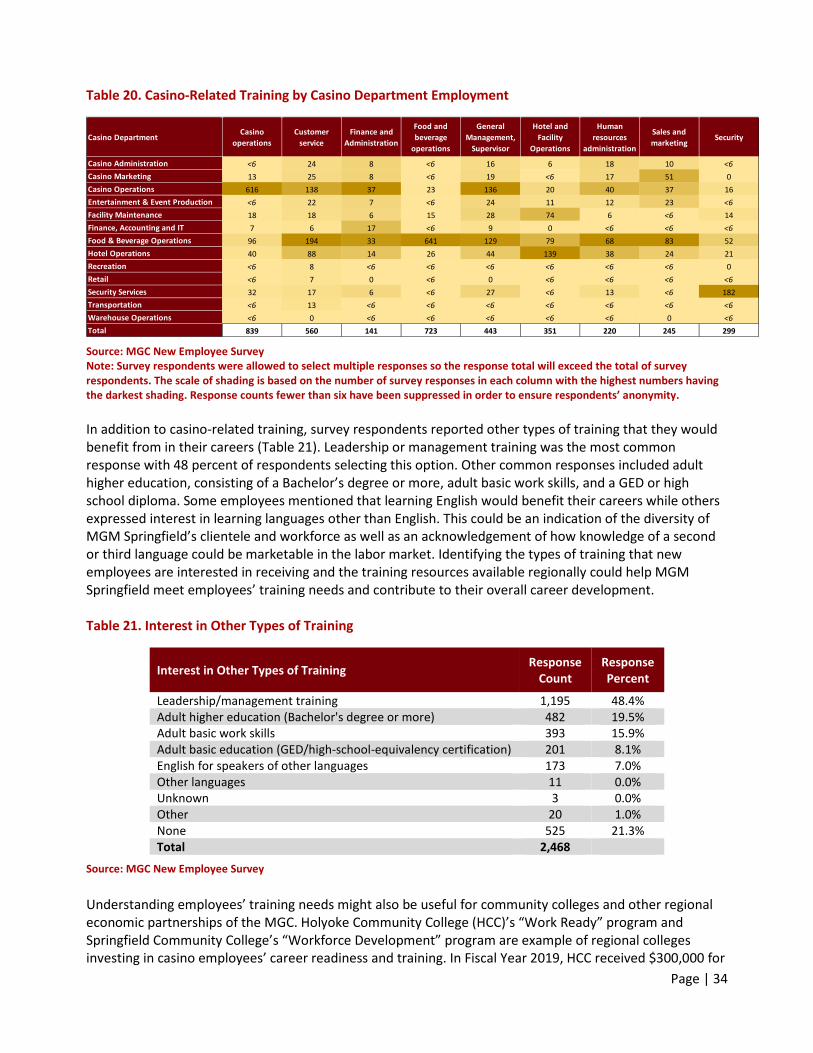
Page | 34
Table 20. Casino-Related Training by Casino Department Employment
Source: MGC New Employee Survey Note: Survey respondents were allowed to select multiple responses so the response total will exceed the total of survey respondents. The scale of shading is based on the number of survey responses in each column with the highest numbers having the darkest shading. Response counts fewer than six have been suppressed in order to ensure respondents’ anonymity. In addition to casino-related training, survey respondents reported other types of training that they would benefit from in their careers (Table 21). Leadership or management training was the most common response with 48 percent of respondents selecting this option. Other common responses included adult higher education, consisting of a Bachelor’s degree or more, adult basic work skills, and a GED or high school diploma. Some employees mentioned that learning English would benefit their careers while others expressed interest in learning languages other than English. This could be an indication of the diversity of MGM Springfield’s clientele and workforce as well as an acknowledgement of how knowledge of a second or third language could be marketable in the labor market. Identifying the types of training that new employees are interested in receiving and the training resources available regionally could help MGM Springfield meet employees’ training needs and contribute to their overall career development. Table 21. Interest in Other Types of Training
Interest in Other Types of Training Response Count
Response Percent
Leadership/management training 1,195 48.4% Adult higher education (Bachelor's degree or more) 482 19.5% Adult basic work skills 393 15.9% Adult basic education (GED/high-school-equivalency certification) 201 8.1% English for speakers of other languages 173 7.0% Other languages 11 0.0% Unknown 3 0.0% Other 20 1.0% None 525 21.3% Total 2,468
Source: MGC New Employee Survey Understanding employees’ training needs might also be useful for community colleges and other regional economic partnerships of the MGC. Holyoke Community College (HCC)’s “Work Ready” program and Springfield Community College’s “Workforce Development” program are example of regional colleges investing in casino employees’ career readiness and training. In Fiscal Year 2019, HCC received $300,000 for
Casino DepartmentCasino
operationsCustomer
serviceFinance and
Administration
Food and beverage
operations
General Management,
Supervisor
Hotel and Facility
Operations
Human resources
administration
Sales and marketing
Security
Casino Administration <6 24 8 <6 16 6 18 10 <6Casino Marketing 13 25 8 <6 19 <6 17 51 0Casino Operations 616 138 37 23 136 20 40 37 16Entertainment & Event Production <6 22 7 <6 24 11 12 23 <6Facility Maintenance 18 18 6 15 28 74 6 <6 14Finance, Accounting and IT 7 6 17 <6 9 0 <6 <6 <6Food & Beverage Operations 96 194 33 641 129 79 68 83 52Hotel Operations 40 88 14 26 44 139 38 24 21Recreation <6 8 <6 <6 <6 <6 <6 <6 0Retail <6 7 0 <6 0 <6 <6 <6 <6Security Services 32 17 6 <6 27 <6 13 <6 182Transportation <6 13 <6 <6 <6 <6 <6 <6 <6Warehouse Operations <6 0 <6 <6 <6 <6 <6 0 <6Total 839 560 141 723 443 351 220 245 299
Page | 35
workforce development through the MGC’s Community Mitigation Fund, a fund that was statutorily established to compensate cities and towns for any negative effects experienced from the construction and operations of the resort casinos. Through this award, the “Work Ready” program would “enroll up to 200 people in its gaming schools through scholarships, up to 70 in certificate training, 180 in English literacy for the workplace, and 100 in Adult Basic Education classes.”34 Programs like this demonstrate new resources available to casino employees to enhance their job skills and provide examples of new workforce development initiatives in the area that would likely not have existed without the presence of MGM Springfield.
Conclusion and Next Steps
A central focus of the expanded gaming legislation was to provide employment opportunities for communities and regions throughout the Commonwealth that were still recovering from the Great Recession. MGM Springfield’s status as the Commonwealth’s first resort-style casino and location in one of Massachusetts’ largest Gateway Cities uniquely positioned the casino to create multiple career pathways for a variety of local workers facing challenges in the labor market—including the long-term unemployed, people with lower levels of educational attainment, those who lack basic or casino-related work experience, and people born abroad. By facilitating these populations’ integration into the larger labor market through employment, one clear economic benefit of MGM Springfield on the community is the availability of accessible jobs that allow workers to gain job skills and training. By the end of 2019, more than 4,000 employees had passed through MGM Springfield’s I-9 process and the MGC New Employee Survey collected important data about many of these employees from all walks of life who came to work at the casino. We have learned a great deal about who these employees were before becoming casino employees and who they are now, after being hired by the casino. Our analysis of MGM Springfield’s workforce before and at the moment of hire can help us assemble a picture of this population and track improvements to its access to economic and employment opportunities, which is a core goal of the expanded gaming legislation. Before working at MGM Springfield, many of the pool of employees came from disadvantaged economic situations, especially in terms of their employment status and earned income. Nearly half of the casino employees were previously employed part-time or in multiple jobs or they were unemployed. A substantially larger share of them earned average annual wages that were approximately half of the state’s median in their previous positions. They tended to have jobs in industries that are associated with lower-than-average wages but that gave them transferrable skills that were relevant to their positions at the casino. Since being hired by MGM Springfield, many employees work in part-time positions although some wish that they were working full-time at the casino. The wage distribution across all employees seems to resemble that of their pre-casino positions. This does not describe all employees as some intend to work at MGM Springfield as a supplementary source of income. There have been strides made in increasing employment opportunities among those who were previously unemployed or working part-time for economic reasons and among people who have less than a Bachelor’s degree. Moreover, the casino’s presence seems to be generating interest in careers in the larger casino industry among employees, and casino employees express interest in both casino-related training and other types of
34 https://www.masslive.com/mgmspringfield/2019/07/massachusetts-gaming-commission-awards-4m-to-communities-organizations-impacted-by-casinos.html

Page | 36
training. MGM Springfield is cited as being the primary source for training that employees have received or expect to receive. This suggests that the employees may see casino employment as an opportunity to gain different types of training and exposure to other experiences that could be beneficial to their careers. The casino’s presence has also mobilized the efforts of local community colleges that have put forward programs aimed at giving new casino employees the tools that they need to succeed in this industry—and possibly other industries later down the line. As a new economic crisis from the global pandemic looms, one major challenge facing Massachusetts will be how businesses that rely on tourism and in-person interactions (e.g., casinos) can enhance employment opportunities while limiting employees and patrons’ exposure to the coronavirus. The threat of layoffs makes the outlook of casinos and their employees even more uncertain. We will continue to monitor the casino workforce in the state and use the MGC New Employee Survey to help policymakers understand the impacts that casino employment is having on the economic livelihoods of its workers.

Page | 37
Appendix A: Methodology
Licensing, Hiring and the Survey Process The original gaming legislation automatically disqualified individuals with felony records or particular types of fraud- or theft-related convictions from applying to any casino position before proving rehabilitation and within 10 years from the date of conviction.35 In May of 2018, three months after MGM Springfield opened, certain categories of service employees became exempt from the MGC’s background check so as to increase the accessibility of casino employment. These exempt employees are generally characterized as having limited to no interaction with the gaming-related activities of the casino and include such jobs as administrative assistants, graphic designers, bartenders, barbers and hair stylists, cooks, prep cooks, chefs, sous chefs, hosts/hostesses, bussers, servers, stewards, valet attendants, receptionists, groundskeepers, and restaurant managers.36 As per Massachusetts law, casinos would still perform their own background checks on all applicants but candidates for these types of positions would no longer be required to obtain registration with the MGC and would no longer be automatically disqualified on the basis of having a criminal record. The MGC estimates that exempt casino service employees generally represent approximately one third of all casino employees,37 though that exact figure varies by casino. The MGC’s New Employee Survey is distributed through the online tool SurveyMonkey on tablet computers during the I-9 verification phase in the hiring process, illustrated in Figure 18 below. In previous analyses of the new casino workforce, the survey was administered during the fingerprinting process, which posed two major issues concerning the population being surveying compared to the actual pool of employees working at the casino. If the survey continued to be distributed at the fingerprinting process, then responses would only be captured from licensed gaming employees and registered non-exempt service employees and would miss collecting information from exempt service employees, who do not pass through the fingerprinting process at all. Secondly, job candidates at the fingerprinting stage would not be offered a position if they failed to pass the background check. That would mean that the universe of survey respondents might have included people who did not end up working at the casino after all. In previous reports, we compared the number of people going through the licensing process to the total number of employees currently working at the casino. Those numbers were slightly different, suggesting that the vast majority of applicants passed the background check and were offered a position at the casino. At the I-9 phase, candidates are officially employees rather than job applicants or candidates. Moreover, the I-9 phase is the only point in the entire hiring and on-boarding process when employees were required to appear in person so this phase was selected as the obvious choice for the point at which the surveys could be administered to all applicants, gaming and service employees alike.
35 https://www.mass.gov/files/documents/2018/08/15/205cmr134.pdf 36 https://massgaming.com/wp-content/uploads/SER-Exemptions-MGM-Springfield.pdf 37 https://massgaming.com/about/frequently-asked-questions/

Page | 38
Figure 18. The Process for Licensing Casino Employees
Source: MGC
Methodology Data-collection responsibilities for the New Employee Survey reside exclusively with the MGC, and the survey data are shared with the SEIGMA research team as secondary data. The research team collaborated with the MGC to create the survey instrument and is responsible for analyzing the results of the survey. Respondents were informed about the purpose of the study, the MGC’s role in the project, and the types of information that they would be asked both verbally by the staff of the MGM Career Center and in writing in the first section of the survey itself. During the mass hiring events leading up to MGM Springfield’s grand opening, paper versions of the survey were used when bottlenecks arose in the Career Center’s processing of hundreds of employees per day. The survey was presented to everyone and did not involve a random sample of employees, so there was the possibility of selection bias in the pool of survey respondents. How the survey data compared to the actual population of casino employees is discussed in more detail in Appendix B: Representativeness. The survey was available in English and Spanish, and future iterations of the survey will be translated into other languages to expand its accessibility to non-English speakers. Respondents were not provided with an incentive to start or complete the survey and they were free to skip questions if they chose or exit the survey at any time. This was intended to increase the response rates so that respondents would not stop taking the survey if they could not answer—or felt uncomfortable answering—any particular question. The research team recognizes that there may exist some socially implied incentive to take and complete a survey provided by one’s employer. The survey text and accompanying script used by the Career Center attempted to overcome some of those concerns by assuring employees that their participation was completely voluntary and anonymous. The actual text explaining the background and use of the survey, as well as the survey questions themselves, can be found in Appendix D: Survey Instrument. The earliest versions of the survey were substantially more limited in the information that was collected and asked respondents only about whether they already work for the casino operator, previous employment status, reasons for seeking the job at the casino, whether they have experience or moved to take the position (and, if so, to and from where they moved), and whether they received pre-employment training. The current survey collects a wider range of information from new casino employees, items that could not be acquired from other sources, including: employment status and wages prior to hire; whether the applicant currently works for the casino operator or is a new hire; whether they plan to still work at their previous job while working at the casino and the locations of their previous job; how long they were previously employed or unemployed; reasons for seeking the job; previous industry and occupation; salary or wages for the position at the casino as well as whether they will receive tips and have received tips in the

Page | 39
past; whether the applicant moved to take the position; the origin and destination of movers; current residence of non-movers; training received in preparation for work at the casino; level of educational attainment; types and sources of casino-related training received; and interest in seeking different types of training (see Appendix C and Appendix D for a copy of the survey questions). The survey also asks respondents about demographic information, which is mostly used to assess diversity in the employee population and evaluate how the employee data from the casino itself compares to the survey data. The analysis in this report covers the period of March 2018 to December 2019, which captures the mass hiring activities during the ramp-up phase of hiring, transition to steady-state hiring, and first full year of operations (Figure 19 below). This report is also the first of many SEIGMA products that will begin to report on a calendar year cycle, from January to December. Figure 19. Survey Respondents by Month
Source: MGC New Employee Survey Survey respondents include:
1) people who are new to the gaming industry and are being hired for gaming positions at MGM Springfield,
2) employees of MGM Springfield’s South End Market (Bill’s Diner, Gelato and Expresso, Hearth Grill, Jack’s Lobster Shack, Raw Bar, and Wicked Noodles),38 TAP Arcade & Bowling, salon, spa, fitness center, and pool,
3) employees of the MassMutual Center, 4) seasonal employees, and 5) gaming employees who were permanently transferred from other gaming properties owned by
MGM Resorts International. There are several types of employees who do not take the survey and whose characteristics are not reflected in this analysis. The survey does not capture MGM Resorts International employees who temporarily helped to coordinate the grand opening, as these employees did not go through the traditional licensing process (Figure 18) and were not fingerprinted.39 The survey also excludes MGM Springfield’s
38 https://mgmspringfield.mgmresorts.com/en/restaurants/south-end-market.html 39 MGM personnel who were temporarily borrowed from other properties to help during the grand opening of MGM Springfield go through an abbreviated process outlined in 2015 CMR 134.03 (2), https://massgaming.com/wp-content/uploads/205CMR134.03-EMERGENCY-5-11-18.pdf.
MGM Opening: August 2018
0100200300400500600700800900
1,000
Num
ber o
f Sur
vey
Resp
onde
nts

Page | 40
construction workers whose employment impacts are discussed in our October 2019 construction report.40 Lastly, several companies lease space from—but are not owned and operated by—MGM Springfield, such as Regal Cinemas, Hannoush Jewelers, Kringle Emporium, Western Mass News, and the FedEx Office Business Center. The employees at these tenant businesses do not take the MGC New Employee Survey and are therefore excluded from the survey analysis. The survey data included in this report reflect 2,468 cleaned, de-duplicated, and completed cases of survey respondents. In this instance, “completed cases” refers to the number of surveys that completed at least the first five questions. From the original survey data, there were 2,599 completed survey records. Upon further examination, we realized that some records appeared to be duplicates based on identical Massachusetts Gaming License Numbers, Employee ID Numbers or a concatenation of over 10 fields of survey responses across economic and demographic questions appearing more than once in the data set. One source of this duplication anomaly could be that a version of the MGC New Employee Survey was e-mailed to salaried employees and there was no mechanism that could prevent the survey link from being shared or the same individual taking the survey more than once on multiple computers. We identified 131 duplicate records, which were removed from the data set, resulting in the final survey response count of 2,468 records. While the survey is considered administrative in nature, in keeping with research guidelines, the MGC New Employee Survey was strongly encouraged but not mandatory, and within the survey instrument itself, respondents were permitted to skip questions and end the survey at any time. This meant that the total survey count for each question was not consistent across the entire survey. The findings of this report are based on the valid responses for each question, or the responses that were answered completely and excluding blank responses. Questions skipped by a respondent were included in the missing responses category, and those counts were not included in calculations of survey response percentages or reported findings. Appendix D below includes tables showing the responses for each question, including the valid response total, missing responses, and total number of survey records. The total number of survey responses (N = 2,468) reflects the cumulative total of survey responses collected from people hired between March 2018 and December 2019 at MGM Springfield rather than a headcount of employees at any point in time. During this same period, MGM Springfield hired 4,017 employees, yielding a 61.4 percent response rate for the MGC New Employee Survey. MGM Springfield payroll employment data show that the casino averaged 2,538 employees in its first year of operation (September 2018 through August 2019).41 Since the survey is administered to each applicant only once, it can neither reveal whether the respondent continues employment at the gaming establishment nor the duration of that employment. For this reason, it may be more useful to interpret the number of survey responses as a total pool of employees in a given period rather than a headcount of employment in real time.
40 Motamedi, R., Hall, A., Aron, E., Dinnie, I., & Swotes, J. (2019). The Construction of MGM Springfield: Spending, Employment, and Economic Impacts. Hadley, MA: University of Massachusetts Donahue Institute, Economic and Public Policy Research Group. https://www.umass.edu/seigma/sites/default/files/MGM%20Springfield%20Construction%20-%20Revised%20Draft%20-%20102119_Final.pdf. 41 Peake, T., Breest, K., Aron, E. (2020). MGM Springfield First Year of Operation: Economic Impact Report. Hadley, MA: University of Massachusetts Donahue Institute, Economic and Public Policy Research Group. https://www.umass.edu/seigma/reports

Page | 41
Appendix B: Representativeness In the past, when the MGC New Employee Survey was distributed at the fingerprinting process, a near census of all applicants to casino positions was obtained. However, new rules made certain categories of service employees in positions with nearly no contact with the gaming-related activities of the casino exempt from the MGC’s background check process. In effect, this change increased the accessibility of casino jobs because people would no longer be automatically disqualified from casino employment if they had prior felony charges or fraud or theft convictions.42 Continuing to intercept hirees at the fingerprinting stage would have left exempt employees out of our study entirely so the I-9 process was the logical choice for the purposes of capturing the greatest numbers of both exempt and non-exempt employees. Since a census of all new hires would not be guaranteed or practical at any stage in the hiring process, the survey data would reflect a sample of the universe of casino employees and there would be the possibility for certain categories of employees to be over- or undersampled in the survey data. The MGC New Employee Survey’s overall response rate was 61.4 percent of the 4,017 employees hired between March 2018 and December 2019. To evaluate the how similar the cumulative total of survey responses collected from March 2018 to December 2019 to MGM Springfield’s employee data on all hires from the same time period, the proportions in the populations were compared across several variables, including gender, race and ethnicity, employment status, hourly or salaried category, and casino department. These were all areas in which we determined there could be potential for over- or undersampling in the survey data. MGM Springfield provided data on their actual employees, and these operator data served as the employee population against which we could compare the survey data. In these most basic categories of casino employees, the sampled groups appeared to be fairly similar to the known universe of casino employees at MGM Springfield in terms of the proportional sizes of those subgroups to the population. The two data sets differed by only a few percentage points in just a handful of categories. In future iterations of this survey instrument and data collection process, we will continue to monitor the potential for over- and undersampling in the survey data. The results of this comparison between the casino operator data and the New Employee Survey data are shown in the tables below. The survey data reflect similar distributions when compared to the employee data provided by MGM Springfield for the same period. In terms of gender, 48.0 percent of survey respondents identified as being female compared to 48.7 percent of the employees in the operator data.
Gender Operating Data Survey Data N % N %
Female 1,951 48.7% 1,151 48.0% Male 2,039 50.9% 1,239 51.7% Prefer not to answer/I decline to self-identify 19 0.5% 8 0.3% Total 4,009 100.0% 2,398 100.0%
Source: MGC New Employee Survey Note: Totals exclude missing responses. Race and ethnicity data generally demonstrated a similar level of consistency. Looking at the comparison of the survey data according to race and ethnicity yielded similar findings. Employees who identified as Asian, or Black or African American were slightly underrepresented in the survey data (6.9 percent and 15.2 percent compared to 7.3 percent and 17.9 percent, respectively); whereas employees identifying as White were slightly overrepresented in the survey data (43.2 percent versus 39.1 percent). Still the differences in
42 https://www.mass.gov/files/documents/2018/08/15/205cmr134.pdf

Page | 42
these percentages did not appear to be substantial and the data were still considered to be fairly representative of the operator data on the whole.
Source: MGC New Employee Survey Note: Totals exclude missing responses. In terms of employment status, employees in the survey data generally appeared to be similar to the employees in the operator data, respectively: 63.9 percent compared to 60.4 percent for full-time employees and 36.1 percent and 39.6 percent for part-time employees.
Employment Status Operating Data Survey Data
N % N % Full-time 2,424 60.4% 1,310 63.9% Part-time 1,592 39.6% 739 36.1% Total 4,016 100.0% 2,049 100.0%
Source: MGC New Employee Survey Note: Totals exclude missing responses. Employees in the survey data were slightly less similar to the employees in the operator data in their hourly or salaried status. We think that this is largely due to the high recruitment of survey responses among respondents who took the e-mailed survey, most of whom were salaried. This issue was discussed in Appendix A above. Almost 12 percent of survey respondents were salaried employees while less than seven percent of the employees hired at MGM Springfield were salaried. Eighty-eight percent of employees in the survey data reported being hourly while almost 94 percent of employees in the operator data are classified as hourly.
Hourly/Salaried Operating Data Survey Data
N % N % Salaried 263 6.5% 284 11.7% Hourly 3,754 93.5% 2,142 88.3% Total 4,017 100.0% 2,426 100.0%
Source: MGC New Employee Survey Note: Totals exclude missing responses. The survey data generally reflected the operator data in terms of their casino department for all departments except for the Hotel. That category represented 10 percent of the employees in the survey data but only 5 percent of employees in the operator data.
Race/Ethnicity Operating Data Survey Data N % N %
American Indian or Alaska Native (Not Hispanic or Latino) 37 0.9% 6 0.3% Asian (Not Hispanic or Latino) 291 7.3% 165 6.9% Black or African American (Not Hispanic or Latino) 719 17.9% 364 15.2% Hispanic or Latino 1,139 28.4% 693 28.9% Native Hawaiian or Other Pacific Islander (Not Hispanic or Latino) 13 0.3% 18 0.8% White (Not Hispanic or Latino) 1,569 39.1% 1,035 43.2% Two or More Races (Not Hispanic or Latino) 148 3.7% 103 4.3% Other 93 2.3% 13 0.5% Total 4,009 100.0% 2,397 100.0%

Page | 43
Source: MGC New Employee Survey Note: Totals exclude missing responses.
Department Operating Data Survey Data N % N %
Entertainment 184 4.6% 80 3.6% Food & Beverage 1,380 34.4% 714 32.4% Gaming and Recreation 1,431 35.6% 693 31.4% General & Administrative 788 19.6% 484 22.0% Hotel 218 5.4% 221 10.0% Retail 15 0.4% 13 0.6% Total 4,016 100.0% 2,205 100.0%

Page | 44
Appendix C: Survey Responses by Question
Q2. In your latest job, did you work at a casino? If so, where?
Response Count
Response Percent
Yes, for this casino operator 279 11.3% Yes, for a different casino operator in Massachusetts 11 0.4% Yes, for a different casino operator outside of Massachusetts 323 13.1%
No 1,847 74.8% Total valid respondents 2,460 99.7% Missing response 8 0.3% Total 2,468
Q3. Does your position require you to have a Massachusetts Gaming License?
Response Count
Response Percent
Yes 1,447 58.6% No, I am not required to have a gaming license number 901 36.5% I do not know 120 4.9% Total valid respondents 2,468 100.0% Missing responses 0 0.0% Total 2,468
Q7. How much did you work before your new job at the casino?
Response Count
Response Percent
Full-time job 1,313 53.2% Part-time job 608 24.6% Multiple jobs totaling full-time or more 229 9.3% Multiple jobs totaling less than full-time 62 2.5% Unemployed 251 10.2% Total valid respondents 2,463 99.8% Missing responses 5 0.2% Total 2,468
Q8. Do you plan to keep working in this job/these jobs after you are hired by the casino?
Response Count
Response Percent
Yes 314 43.0% No 320 43.8% Not sure 96 13.2% Total valid respondents 730 29.6% Missing responses 1,738 70.4% Total 2,468

Page | 45
Q9. Please indicate how long you were unemployed.
Response Count
Response Percent
Less than 12 months 87 46.5% 12-23 months 57 30.5% 24-35 months 6 3.2% 36 months or more 37 19.8% Total valid respondents 187 7.6% Missing responses 2,281 92.4% Total 2,468
Q10. What type of job did you have prior to applying to this casino? Response Count
Response Percent
Food and Beverage Operations (bartending, busing, serving, cooking, supervising) 536 22.0%
Casino Operations (slots, table games, poker, cashiering, count rooms) 379 15.6% Retail Sales (cashier, retail store manager, customer service) 326 13.4% Finance and Administration (accounting, financial analysis, purchasing, MIS/IT, auditing) 173 7.1%
Security (security guard, surveillance, correctional officer, police) 146 6.0% Hotel and Facility Operations (housekeeping, front desk, valet) 103 4.2% Production Worker (machinist, welder, plant operator, food processing) 89 3.7% Building and Grounds/Maintenance 82 3.4% Personal and Home-based Services (hairdresser, home health aide, childcare, fitness trainer) 81 3.3%
Health Worker (physician, nurse, physical therapist, EMT) 66 2.7% Teacher or Education Administration 63 2.6% Construction Worker or Building Trades (carpenter, plumber, electrician, HVAC) 52 2.1%
Marketing (advertising, box office, promotions, public relations) 51 2.1% Artist, Designer, Entertainer 47 1.9% Human Resources 45 1.8% Trucker or Driver (long-distance trucking, towing, taxis, Uber) 38 1.6% Computer or IT-related Jobs (software developer, programmer, systems administrator) 30 1.2%
Architect or Engineer 14 0.6% Military 11 0.5% Lawyer or Paralegal 8 0.3% Managers, Directors, and Supervisors 7 0.3% Transportation and Material Moving 6 0.2% Self-employed 2 0.1% None, this will be my first job. 49 2.0% Unknown 33 1.4% Total valid respondents 2,437 98.7% Missing responses 31 1.3% Total 2,468

Page | 46
Q11. What industry did you work in before applying to the casino? If multiple jobs, answer for your primary job.
Response Count
Response Percent
Food Services (food and drinking establishments; catering; etc.) 576 23.6% Casino/gambling Industries 426 17.4% Retail 282 11.5% Health Care (including hospitals and EMS) 145 5.9% Arts, Entertainment, and Recreation 105 4.3% Transportation and Warehousing 87 3.6% Finance and Insurance (including banking) 81 3.3% Education (primary; secondary; higher ed.) 77 3.2% Manufacturing 75 3.1% Security Services (surveillance; guarding, etc.) 73 3.0% Accommodations (Hotels; B&B; Inns; Motels; etc.) 62 2.5% Administrative and Support Services 54 2.2% Professional, Scientific, and Technical Services 53 2.2% Construction 52 2.1% Services to Buildings 48 2.0% Government (including Military but not Education) 47 1.9% Social Assistance 36 1.5% Information (telecommunications; software design; publishing; etc.) 31 1.3% Personal Services 18 0.7% Real Estate, Rentals, and Leasing 18 0.7% Repair and Maintenance 13 0.5% Wholesale Trade 13 0.5% Agriculture, Forestry, Fishing, and Hunting 7 0.3% None, this will be my first job. 60 2.5% Unknown 4 0.2% Total valid respondents 2,443 99.0% Missing responses 25 1.0% Total 2,468

Page | 47
Q12. Location of recent job (Top 10) Response Count
Response Percent
Massachusetts 1,549 63.6% Connecticut 438 18.0% Maryland 89 3.7% New York 63 2.6% Rhode Island 54 2.2% Nevada 38 1.6% Pennsylvania 30 1.2% Florida 27 1.1% Outside the U.S. 19 0.8% Puerto Rico 17 0.7% Total valid responses 2,434 98.6% Missing responses 34 1.4% Total 2,468
Q13. Location of recent job (Top 10) Response Count
Response Percent
Springfield, MA 772 32.1% Holyoke, MA 105 4.4% Chicopee, MA 89 3.7% West Springfield, MA 79 3.3% Agawam, MA 76 3.2% Uncasville, CT 67 2.8% Westfield, MA 59 2.5% Enfield, CT 52 2.2% East Longmeadow, MA 44 1.8% Lincoln, RI 44 1.8% Total valid responses 2,404 97.4% Missing responses 64 2.6% Total 2,468
Q15. How long were you employed at your most recent job?
Response Count
Response Percent
Less than one year 419 23.9% More than 1 year but less than 3 years 692 39.5% More than 3 three years but less than 6 years 330 18.8% More than 6 years but less than 10 years 123 7.0% 10 years or more 188 10.7% Total valid responses 1,752 71.0% Missing responses 716 29.0% Total 2,468

Page | 48
Q16. Did you receive a salary or hourly wage from your most recent job before working at the casino?
Response Count
Response Percent
Hourly wage 2,010 82.9% Salary 414 17.1% Total valid respondents 2,424 98.2% Missing responses 44 1.8% Total 2,468
Q17. What was the annual income from your most recent primary job before working at the casino?
Response Count
Response Percent
Less than $10,000 560 23.5% $10,000-$19,999 475 20.0% $20,000-$29,999 411 17.3% $30,000-$39,999 300 12.6% $40,000-$49,999 226 9.5% $50,000-$59,999 148 6.2% $60,000-$69,999 114 4.8% $70,000-$79,999 42 1.8% $80,000-$89,999 26 1.1% $90,000-$99,999 25 1.1% $100,000-$149,999 35 1.5% $150,000-$199,999 11 0.5% $200,000 and over 5 0.2% Total valid response 2,378 96.4% Missing responses 90 3.6% Grand Total 2,468
Q18. Did you receive tips in your most recent primary job?
Response Count
Response Percent
No 1,756 72.7% Yes 658 27.3% Total valid respondents 2,414 97.8% Missing responses 54 2.2% Total 2,468

Page | 49
Q19. Did your most recent primary job provide benefits?
Response Count
Response Percent
Paid Time Off 1,292 52.4% Health Benefits 1,266 51.3% Retirement Benefits 916 37.1% None 879 35.6% Total valid respondents 2,468 100.0% Missing responses 0 0.0% Total 2,468
Q20. Please characterize your job at the casino?
Response Count
Response Percent
Food & Beverage Operations 714 32.4% Casino Operations 653 29.6% Hotel Operations 221 10.0% Security Services 190 8.6% Facility Maintenance 126 5.7% Entertainment & Event Production 80 3.6% Casino Marketing 70 3.2% Casino Administration 50 2.3% Finance, Accounting and IT 34 1.5% Transportation 25 1.1% Recreation 15 0.7% Warehouse Operations 14 0.6% Retail 13 0.6% Total valid respondents 2,205 89.3% Missing responses 263 10.7% Total 2,468
Q21. Will you receive a salary or hourly wage from your new job at the casino?
Response Count Response Percent
Hourly wage 2,142 88.3% Salary 284 11.7% Total valid respondents 2,426 98.3% Missing responses 42 1.7% Total 2,468

Page | 50
Q22. What is the annual wage and salary pay of your new job at the casino?
Response Count
Response Percent
Less than $10,000 470 20.1% $10,000-$19,999 559 23.9% $20,000-$29,999 518 22.1% $30,000-$39,999 288 12.3% $40,000-$49,999 148 6.3% $50,000-$59,999 133 5.7% $60,000-$69,999 110 4.7% $70,000-$79,999 46 2.0% $80,000-$89,999 20 0.9% $90,000-$99,999 18 0.8% $100,000-$149,999 18 0.8% $150,000-$199,999 10 0.4% $200,000 and over 5 0.2% Total valid respondents 2,343 94.9% Missing responses 125 5.1% Total 2,468
Q23. Will you receive tips in your job at the casino?
Response Count
Response Percent
Yes 989 41.2% No 1,413 58.8% Total valid respondents 2,402 97.3% Missing responses 66 2.7% Total 2,468
Q24. Does your job at the casino provide benefits? If yes, please check all that apply.
Response Count
Response Percent
Health benefits 1,772 71.8% Paid time off for sick or vacation 1,706 69.1% Retirements benefits 1,387 56.2% None 367 14.9% Total 2,468 100.0%
Note: Survey respondents could select multiple responses so the sum of response counts will exceed the total number of respondents.

Page | 51
Q25. Casino Employment Status
Response Count
Response Percent
One full-time job 1,310 63.9% One part-time job 654 31.9% On-call job 56 2.7% Multiple part-time jobs 29 1.4% Total valid respondents 2,049 83.0% Missing responses 419 17.0% Total 2,468
Q26. How much do you expect to work after you are hired at the casino?
Response Count
Response Percent
One full-time job 454 59.9% One part-time job 234 30.9% Multiple jobs 70 9.2% Total valid respondents 758 30.7% Missing responses 1,710 69.3% Total 2,468
Q27. Would you prefer to work full-time at the casino?
Response Count
Response Percent
Yes 620 82.2% No 134 17.8% Total valid respondents 754 30.6% Missing responses 1,714 69.4% Total 2,468

Page | 52
28. What are your reason(s) for seeking a job at this casino? Please check all that apply.
Response Count
Response Percent
Opportunity for career advancement 1,574 63.8% Excitement/enthusiasm for working at a casino 1,344 54.5% Improved Pay 1,230 49.8% Opportunity to learn and use new skills or training 1,139 46.2% Improved Benefits 903 36.6% Jobs closer to home 807 32.7% Flexible hours 490 19.9% Job is a higher role or has more responsibilities 414 16.8% Have been unemployed and need work 365 14.8% It offers me additional supplementary income or benefits 325 13.2% It offers jobs that are more stable and secure 171 6.9% It offers me part-time work, not interested in full-time 99 4.0% No college degree 92 3.7% No specialized training needed 48 1.9% Other 20 0.8% Total 2,468
Note: Total is total of all responses, not unique individuals as question allowed for multiple selections
Q.29 Where do you currently live? Current State
Response Count
Response Percent
Massachusetts 1,811 75.3% Connecticut 497 20.7% New York 31 1.3% Pennsylvania 22 0.9% Rhode Island 14 0.6% Maryland 6 0.2% New Jersey 6 0.2% All Other States 19 0.8% Total valid respondents 2,406 97.5% Missing responses 62 2.5% Total 2,468
Note: Responses fewer than 6 have not been disclosed to prevent identifying individuals.

Page | 53
Q30. Current City/Town (Top 10)
Response Count
Response Percent
Springfield, MA 961 40.2% Chicopee, MA 158 6.6% West Springfield, MA 89 3.7% Holyoke, MA 82 3.4% Enfield, CT 76 3.2% Agawam, MA 68 2.8% Norwich, CT 67 2.8% Westfield, MA 64 2.7% East Longmeadow, MA 45 1.9% Longmeadow, MA 41 1.7% All Other 741 31.0% Total valid responses 2,392 96.9% Missing responses 76 3.1% Total 2,468
Q33. How long have you lived at current residence?
Response Count
Response Percent
One year or more 1,745 77.4% Less than one year 509 22.6% Total valid respondents 2,254 91.3% Missing responses 214 8.7% Total 2,468
Q34. Have you moved or do you plan to move to take this job at this casino?
Response Count
Response Percent
No, I have not moved and do not plan to move to take this job. 1,782 74.2%
Yes, I have already moved to take this job. 372 15.5% Yes, I plan to move to take this job but have not moved yet 249 10.4%
Total valid respondents 2,403 97.4% Missing responses 65 2.6% Total 2,468

Page | 54
Q35. Where did you move from? (Top 10 showing)
Response Count
Response Percent
Massachusetts 77 21.0% Maryland 50 13.7% New York 38 10.4% Nevada 36 9.8% Connecticut 21 5.7% Virginia 21 5.7% Florida 15 4.1% Puerto Rico 14 3.8% New Jersey 11 3.0% Pennsylvania 11 3.0% All Other States 67 18.3% Outside the U.S. <6 ND Total valid responses 366 14.8% Missing responses 2,102 85.2% Total 2,468
Q36. City/Town you moved from
Response Count
Response Percent
Springfield, MA 44 12.2% Las Vegas, NV 31 8.6% Alexandria, VA 18 5.0% New York City, NY 12 3.3% All Other 255 70.8% Total valid respondents 360 14.6% Missing responses 2,108 85.4% Total 2,468
Q39. What state do you plan to move to?
Response Count
Response Percent
Massachusetts 173 69.8% Connecticut 70 28.2% Other <6 ND Total valid respondents 248 10.0% Missing responses 2,220 90.0% Total 2,468

Page | 55
Q40. City/Town you plan to move to
Response Count
Response Percent
Springfield, MA 106 48.8% Enfield, CT 23 10.6% Agawam, MA 8 3.7% West Springfield, MA 7 3.2% Manchester, CT 6 2.8% All Other 67 30.9% Total valid respondents 217 8.8% Missing responses 2,251 91.2% Total 2,468
Q43. Do you have previous experience working at a casino?
Response Count
Response Percent
Yes 496 24.4% No 1,539 75.6% Total valid respondents 2,035 82.5% Missing responses 433 17.5% Total 2,468
Q 44. What is the highest level of education you have completed?
Response Count
Response Percent
Did not attend high school 11 0.5% Attended some high school 55 2.3% High school graduate or equivalent (e.g., GED, etc.) 760 31.5%
Trade or technical high school graduate 92 3.8% Some college, no degree 732 30.4% Associate's degree 265 11.0% Bachelor's degree 402 16.7% Master's degree or more education 92 3.8% Total valid respondents 2,409 97.6% Missing responses 59 2.4% Total 2,468

Page | 56
Q45. Have you received training or do you anticipate any orientation or training in preparation for your job at the casino (e.g., casino operations, food and beverage operations, hotel operations, etc.?
Response Count
Response Percent
Yes 1,833 76.1% No 577 23.9% Total valid respondents 2,410 97.6% Missing responses 58 2.4% Total 2,468
Q46. Where did you receive training (or anticipate training)? Please check all that apply.
Response Count
Response Percent
From this casino or another casino 1,559 63.2% Massachusetts Casino Career Training Institute (MCCTI) 158 6.4% Holyoke Community College 71 2.9% Springfield Technical Community College 43 1.7% Previous company 21 0.9% Trade, technical or vocational school 20 0.8% Other community college/university 17 0.7% Other 18 0.7% Total 2,468
Q47. How interested are you in a career in the casino industry?
Response Count
Response Percent
Very interested 1,955 81.4% Somewhat interested 284 11.8% Neutral (neither interested nor disinterested) 145 6.0%
Very disinterested 10 0.4% Somewhat disinterested 8 0.3% Total valid respondents 2,402 97.3% Missing responses 66 2.7% Total 2,468

Page | 57
Q48. Please indicate which types of casino career training you are obtaining or are interested in obtaining for your job. Please check all that apply.
Response Count
Response Percent
Casino Operations (slots, table games, poker, cashiering, count rooms, security) 924 37.4% Food and Beverage Operations (bartending, busing, serving, cooking, supervising) 774 31.4% Customer Service 629 25.5% General Management, Supervisor 543 22.0% Hotel and Facility Operations (housekeeping, front desk, valet, grounds keeping, maintenance, facilities, retail) 401 16.2%
Security 299 12.1% Sales and Marketing (advertising, box office, promotions, public relations) 293 11.9% Human Resources Administration (human resources, personnel) 271 11.0% Finance and Administration (accounting, financial analysis, purchasing, MIS/IT, auditing) 195 7.9% None 89 3.6% Total 2,468
Q49. Please indicate which other types of training you might benefit from in your career. Please check all that apply.
Response Count
Response Percent
Leadership/management training 1,195 48.4% Adult higher education (Bachelor's degree or more) 482 19.5% Adult basic work skills 393 15.9% Adult basic education (GED/high-school-equivalency certification) 201 8.1%
English for speakers of other languages 173 7.0% Other languages 11 0% Unknown 3 0.1% Other 20 1% None 525 21.3% Total 2,468
Q50. What is your age?
Response Count
Response Percent
19-29 863 36.0% 30-39 638 26.6% 40-49 390 16.3% 50-59 340 14.2% 60-69 147 6.1% 70+ 16 0.7% Unknown <6 0.1% Total valid respondents 2,396 97.1% Missing responses 72 2.9% Total 2,468

Page | 58
Q51. What is your gender? Response Count Response
Percent Male 1,239 51.7% Female 1,151 48.0% Prefer not to answer 8 0.3% Total valid respondents 2,398 97.2% Missing responses 70 2.8% Total 2,468
Q52. Are you Hispanic or Latino?
Response Count
Response Percent
Yes 709 32.2% No 1,495 67.8% Total valid respondents 2,204 89.3% Missing responses 264 10.7% Total 2,468
Q53. Which one or more of the following would you say is your race?
Response Count
Response Percent
White or Caucasian Only 1,035 43.2% Hispanic/Latino 693 28.9% Black or African American 364 15.2% Asian 165 7% Two or More Races 103 4.3% Native Hawaiian or Other Pacific Islander 18 1% Unknown 13 0.5% Native American or Alaskan Native 6 0% Total valid respondents 2,397 97.1% Missing responses 71 3% Total 2,468
Q54. Were you born in the United States? Response Count
Response Percent
Yes, born in the United States 1,903 80.0% Yes, born in Puerto Rico, Guam, the U.S. Virgin Islands, or Northern Marianas 171 7.2%
No, born outside of the United States 306 12.9% Total valid respondents 2,380 96.4% Missing responses 88 3.6% Total 2,468

Page | 59
Q55. Have you ever served in the Military or reserves of the United States?
Response Count
Response Percent
Yes 127 5.3% No 2,262 94.7% Total valid respondents 2,389 96.8% Missing responses 79 3.2% Total 2,468

Page | 60
Appendix D: Survey Instrument Please fill out this survey which is required by the Massachusetts Gaming Commission. You will need your MGC license, registration or employee number to complete the survey. All responses are kept strictly confidential and will not affect your employment in any way. Thank you for your participation.
1. At what casino will you be working? o Encore Boston Harbor o MGM Springfield o Plainridge Park Casino
2. In your latest job, did you work at a casino? If so, where? o Yes, for this casino operator o Yes, for a different casino operator in Massachusetts o Yes, for a different casino operator outside of Massachusetts o No
3. Does your position require you to have a Massachusetts Gaming License? o Yes o No, I am not required to have a gaming license o I do not know

Page | 61
The information is for survey purposes only and your survey responses will not affect your employment at this casino.
What is your Massachusetts Gaming Commission registration or license number? 4. 6-digit Prefix (e.g., RSER18) o LGEL18 o TGEL18 o LGKE18 o TGKE18 o LGKS18 o TGKS18 o LSER18 o RSER18 o TSER18 o LGEL19 o TGEL19 o LGKE19 o TGKE19 o LGKS19 o TGKS19 o LSER19 o RSER19 o TSER19 o LGEL20 o TGEL20 o LGKE20 o TGKE20 o LGKS20 o TGKS20 o LSER20 o RSER20 o TSER20 o It has not been issued o I cannot remember my number

Page | 62
5. 4-digit Number (e.g., 1234)
The information is for survey purposes only and your survey responses will not affect your employment at this casino. 6. What is your employee ID number at this casino?
o I can’t remember my number
7. How much did you work before your new job at the casino? o Full-time job GO TO QUESTION 8 o Part-time job GO TO QUESTION 8 o Multiple jobs totaling full-time or more GO TO QUESTION 8 o Multiple jobs totaling less than full-time GO TO QUESTION 8
o Unemployed GO TO QUESTION 9 8. Do you plan to keep working in this job/these jobs after you are hired by the casino?
Yes GO TO QUESTION 10
No GO TO QUESTION 10 Not sure
9. Please indicate how long you were unemployed.
_______ Years and _______ Months

Page | 63
10. What type of job did you have prior to applying to this casino? o None, this will be my first job. o Casino Operations (slots, table games, poker, cashiering, count rooms) o Food and Beverage Operations (bartending, busing, serving, cooking, supervising) o Hotel and Facility Operations (housekeeping, front desk, valet) o Marketing (advertising, box office, promotions, public relations) o Retail Sales (cashier, retail store manager, customer service) o Security (security guard, surveillance, correctional officer, police) o Finance and Administration (accounting, financial analysis, purchasing, MIS/IT, auditing) o Human Resources o Building and Grounds/Maintenance o Computer or IT-related Jobs (software developer, programmer, systems administrator) o Construction Worker or Building Trades (carpenter, plumber, electrician, HVAC) o Teacher or Education Administration o Health Worker (physician, nurse, physical therapist, EMT) o Military o Personal and Home-based Services (hairdresser, home health aide, childcare, fitness trainer) o Production Worker (machinist, welder, plant operator, food processing) o Trucker or Driver (long-distance trucking, towing, taxis, Uber) o Artist, Designer, Entertainer o Architect or Engineer o Lawyer or Paralegal o Other, please specify: _______________________________________________________________

Page | 64
11. What industry did you work in before applying to this casino? If multiple jobs, answer for your primary job. o None, this will be my first job. o Casino/gambling Industries o Accommodations (hotels; B&Bs; inns; motels; etc.) o Administrative and Support Services o Agriculture, Forestry, Fishing, and Hunting o Construction o Education (primary; secondary; higher ed.) o Security Services (surveillance; guarding, etc.) o Finance and Insurance (including banking) o Food Services (food and drinking establishments; catering; etc.) o Government (Including military but not education) o Health Care (including hospitals and EMS) o Information (telecommunications; software design; publishing; etc.) o Manufacturing o Arts, Entertainment, and Recreation o Professional, Scientific, and Technical Services o Real Estate, Rentals, and Leasing o Retail o Social Assistance o Transportation and Warehousing o Wholesale Trade o Other, please specify: _______________________________________________________________

Page | 65
Where was your most recent job located? Please provide details below.
12. State or territory. Please circle one.
13. City or town:__________________________________________________________________ 14. If you worked outside of the United States, please enter the name of that country.
15. How long were you employed at your most recent job? _______ Years and _______ Months
Outside the U.S. PR Puerto Rico AK Alaska AL Alabama AR Arkansas AZ Arizona CA California CO Colorado CT Connecticut DC District of Columbia DE Delaware FL Florida GA Georgia HI Hawaii IA Iowa ID Idaho IL Illinois IN Indiana KS Kansas KY Kentucky LA Louisiana MA Massachusetts MD Maryland ME Maine MI Michigan MN Minnesota MO Missouri MS Mississippi MT Montana NC North Carolina ND North Dakota NE Nebraska NH New Hampshire NJ New Jersey NM New Mexico NV Nevada NY New York OH Ohio OK Oklahoma OR Oregon PA Pennsylvania RI Rhode Island SC South Carolina SD South Dakota TN Tennessee TX Texas UT Utah VA Virginia VT Vermont WA Washington WI Wisconsin WV West Virginia WY Wyoming

Page | 66
16. Did you receive a salary or hourly wage from your most recent job before working at the casino? o Salary o Hourly wage
17. What was the annual income from your most recent primary job (salary or total wages) before working
at the casino? Please do not include tips in the total. If you are unsure, please estimate to the closest dollar range. o Less than $10,000 o $10,000-$19,999 o $20,000-$29,999 o $30,000-$39,999 o $40,000-$49,999 o $50,000-$59,999 o $60,000-$69,999 o $70,000-$79,999 o $80,000-$89,999 o $90,000-$99,999 o $100,000-$149,999 o $150,000-$199,999 o $200,000 and over
18. Did you receive tips in your most recent primary job? o Yes o No
19. Did your most recent primary job provide benefits? Please check all that apply. Health benefits Retirement benefits Paid time off for sick or vacation None

Page | 67
20. Please characterize your new job at the casino. o Casino Operations (slots, table games, poker, cashiering, count rooms, surveillance) o Hotel Operations (housekeeping, front desk, valet) o Security Services o Recreation (salon, spa, arcade, movie theatre) o Food & Beverage Operations (bartending, busing, serving, cooking, supervising) o Entertainment/Event Production (box office, audio-visual production, facility changeover) o Facility Maintenance (grounds keeping, cleaning, other maintenance) o Retail o Casino Marketing (advertising, promotions, public relations) o Finance, Accounting and IT (accounting, financial analysis, purchasing, MIS/IT, auditing) o Casino Administration (executive team, management, human resources, personnel) o Transportation o Warehouse Operations o Other, please specify: _______________________________________________________________
21. Will you receive a salary or hourly wage from your new job at the casino? o Salary o Hourly wage
22. What is the annual wage and salary pay of your new job at the casino? Please do not include tips in the
total. If you are unsure, please estimate to the closest dollar range. o Less than $10,000 o $10,000-$19,999 o $20,000-$29,999 o $30,000-$39,999 o $40,000-$49,999 o $50,000-$59,999 o $60,000-$69,999 o $70,000-$79,999 o $80,000-$89,999 o $90,000-$99,999 o $100,000-$149,999 o $150,000-$199,999 o $200,000 and over
23. Will you receive tips in your job at the casino? o Yes o No

Page | 68
24. Does your job at the casino provide benefits? If yes, please check all that apply. Health benefits Retirement benefits Paid time off for sick or vacation None
25. Will your job at the casino be: o One full-time job o One part-time job o Multiple part-time jobs o On-call job
26. How much do you expect to work after you are hired at the casino? o Full-time job o Part-time job o Multiple jobs totaling full-time or more o Multiple jobs totaling less than full-time
27. Would you prefer to work full-time at the casino? o Yes o No
28. What are your reason(s) for seeking a job at this casino? Please check all that apply. o Improved pay o Improved benefits (e.g., health insurance) o Excitement/enthusiasm for working at a casino o Opportunity for career advancement o Flexible hours o It offers jobs that are more stable and secure o Job closer to home o Have been unemployed and need work o It offers me additional supplementary income or benefits o It offers me part-time work, not interested in full-time o Job is a higher role or has more responsibilities o Opportunity to learn and use new skills or training (professional development) o No college degree (Associate’s, Bachelor’s, etc.) needed o No specialized training needed o Other, please specify: _______________________________________________________________

Page | 69
29. State or territory. Please circle one.
30. City or town:_____________________________________________________________________
31. Zip code or postal code:
32. If you live outside of the United States, please enter the name of that country.
Outside the U.S. PR Puerto Rico AK Alaska AL Alabama AR Arkansas AZ Arizona CA California CO Colorado CT Connecticut DC District of Columbia DE Delaware FL Florida GA Georgia HI Hawaii IA Iowa ID Idaho IL Illinois IN Indiana KS Kansas KY Kentucky LA Louisiana MA Massachusetts MD Maryland ME Maine MI Michigan MN Minnesota MO Missouri MS Mississippi MT Montana NC North Carolina ND North Dakota NE Nebraska NH New Hampshire NJ New Jersey NM New Mexico NV Nevada NY New York OH Ohio OK Oklahoma OR Oregon PA Pennsylvania RI Rhode Island SC South Carolina SD South Dakota TN Tennessee TX Texas UT Utah VA Virginia VT Vermont WA Washington WI Wisconsin WV West Virginia WY Wyoming

Page | 70
33. How long have you lived there? o Less than one year o One year or more
34. Have you moved or do you plan to move to take this job at this casino? o Yes, I have already moved to take this job. GO TO QUESTION 35 o Yes, I plan to move to take this job but have not moved yet. GO TO QUESTION 39 o No, I have not moved and do not plan to move to take this job. GO TO QUESTION 43

Page | 71
35. State or territory. Please circle one.
36. City or town:_____________________________________________________________________
37. Zip code or postal code:
38. If you moved from outside of the United States, please enter the name of that country.
GO TO QUESTION 43
Outside the U.S. PR Puerto Rico AK Alaska AL Alabama AR Arkansas AZ Arizona CA California CO Colorado CT Connecticut DC District of Columbia DE Delaware FL Florida GA Georgia HI Hawaii IA Iowa ID Idaho IL Illinois IN Indiana KS Kansas KY Kentucky LA Louisiana MA Massachusetts MD Maryland ME Maine MI Michigan MN Minnesota MO Missouri MS Mississippi MT Montana NC North Carolina ND North Dakota NE Nebraska NH New Hampshire NJ New Jersey NM New Mexico NV Nevada NY New York OH Ohio OK Oklahoma OR Oregon PA Pennsylvania RI Rhode Island SC South Carolina SD South Dakota TN Tennessee TX Texas UT Utah VA Virginia VT Vermont WA Washington WI Wisconsin WV West Virginia WY Wyoming

Page | 72
39. State or territory. Please circle one.
40. City or town: ______________________________________________________________________
41. Zip code or postal code:
42. If you are moving outside of the United States, please enter the name of that country.
Outside the U.S. PR Puerto Rico AK Alaska AL Alabama AR Arkansas AZ Arizona CA California CO Colorado CT Connecticut DC District of Columbia DE Delaware FL Florida GA Georgia HI Hawaii IA Iowa ID Idaho IL Illinois IN Indiana KS Kansas KY Kentucky LA Louisiana MA Massachusetts MD Maryland ME Maine MI Michigan MN Minnesota MO Missouri MS Mississippi MT Montana NC North Carolina ND North Dakota NE Nebraska NH New Hampshire NJ New Jersey NM New Mexico NV Nevada NY New York OH Ohio OK Oklahoma OR Oregon PA Pennsylvania RI Rhode Island SC South Carolina SD South Dakota TN Tennessee TX Texas UT Utah VA Virginia VT Vermont WA Washington WI Wisconsin WV West Virginia WY Wyoming

Page | 73
43. Do you have previous experience working at a casino? o Yes o No
44. What is the highest level of education that you have completed? o Did not attend high school o Attended some high school o High school graduate or equivalent (e.g., GED, etc.) o Trade or technical high school graduate o Some college, no degree o Associate's degree o Bachelor's degree o Master's degree or more education
45. Have you received or do you anticipate any orientation or training in preparation for your job at the casino (e.g., casino operations, food and beverage operations, hotel operations, etc.)? o Yes GO TO QUESTION 46 o No GO TO QUESTION 47
46. Where did you receive training (or anticipate training)? Please check all that apply. From this casino or another casino Massachusetts Casino Career Training Institute (MCCTI) Bristol Community College Bunker Hill Community College Cambridge College Holyoke Community College Massasoit Community College North Shore Community College Roxbury Community College Springfield Technical Community College Other training provider (community organization, employment board, etc.), please specify
institution name. ___________________________________________________________________
47. How interested are you in pursuing a career in the casino industry? o Very interested o Somewhat interested o Neutral (neither interested nor disinterested) o Somewhat disinterested o Very disinterested

Page | 74
48. Please indicate which types of casino career training you are obtaining or are interested in obtaining for your job. Please check all that apply. Casino Operations (slots, table games, poker, cashiering, count rooms, security) Food and Beverage Operations (bartending, busing, serving, cooking, supervising) Customer Service General Management, Supervisor Hotel and Facility Operations (housekeeping, front desk, valet, grounds keeping, maintenance,
facilities, retail) Sales and Marketing (advertising, box office, promotions, public relations) Security Finance and Administration (accounting, financial analysis, purchasing, MIS/IT, auditing) Human Resources Administration (human resources, personnel) None Other, please specify: ______________________________________________________________
49. Please indicate which other types of training you might benefit from in your career. Please check all
that apply. Adult basic education (GED/high-school-equivalency certification) Adult higher education (Bachelor’s degree or more) Adult basic work skills English for speakers of other languages Leadership/management training Technical/computer training None Other, please specify: _______________________________________________________________

Page | 75
This section asks questions about you. 50. What year were you born?
51. What is your gender? o Male o Female o Prefer not to answer
52. Are you Hispanic or Latino? o Yes o No
53. Which one or more of the following would you say is your race? Please check all that apply. White/Caucasian Black/African-American Asian Native Hawaiian/Other Pacific Islander Native American/Alaskan Native Some other race, please specify: ______________________________________________________
54. Were you born in the United States? o Yes, born in the United States o Yes, born in Puerto Rico, Guam, the U.S. Virgin Islands, or Northern Marianas o No, born outside of the United States
55. Have you ever served in the Military or reserves of the United States? o Yes o No
Thank you for taking the time to complete this survey.