New Document 1 you make any investment decision, you should read the current Product Disclosure...
8
Welcome to the latest edition of our monthly newsletter! Our articles cover a range of topics which we hope you will find interesting. We aim to keep you informed of changes as they happen, but we also want to provide ideas to help you live the life you want – now and in the future. In this Newsletter: View from the Hill Shane Oliver’s Insights Model Share Portfolio Update If you have any questions or enquiries about any of the articles in our newsletter, or any other financial planning topic, don’t hesitate to contact us. We hope you enjoy reading this edition. Hillross Wealth Logic 4 Watson Avenue Rose Park SA 5067 P 08 8364 1555 F 08 8364 1855 E [email protected] W wealthlogic.hillross.com.au Kind Regards, David Peacock Disclosure: Wealth Logic Pty Ltd trading as Wealth Logic is an Authorised Representative of Hillross Financial Services Limited, ABN 77 003 323 055, AFSL 232705. Advice warnings: Any advice contained in this newsletter is of a general nature only and does not take into account the objectives, financial situation or needs of any particular person. Therefore, before making any decision, you should consider the appropriateness of the advice with regard to those matters. If you decide to purchase or vary a financial product, your advisers, our firm, Hillross Financial Services Limited, its associates and other companies within the AMP Group will receive fees and other benefits, which will be a dollar amount and/or a percentage of either the premium you pay or the value of your investments. You can ask us for more details.
Transcript of New Document 1 you make any investment decision, you should read the current Product Disclosure...

Welcome to the latest edition of our monthly newsletter! Our articles cover a range of topics which we hope you will find interesting. We aim to keep you informed of changes as they happen, but we also want to provide ideas to help you live the life you want – now and in the future. In this Newsletter:
View from the Hill Shane Oliver’s Insights Model Share Portfolio Update
If you have any questions or enquiries about any of the articles in our newsletter, or any other financial planning topic, don’t hesitate to contact us. We hope you enjoy reading this edition.
Hillross Wealth Logic 4 Watson Avenue Rose Park SA 5067 P 08 8364 1555 F 08 8364 1855 E [email protected] W wealthlogic.hillross.com.au
Kind Regards,
David Peacock
Disclosure: Wealth Logic Pty Ltd trading as Wealth Logic is an Authorised Representative of Hillross Financial Services Limited, ABN 77 003 323 055, AFSL 232705. Advice warnings: Any advice contained in this newsletter is of a general nature only and does not take into account the objectives, financial situation or needs of any particular person. Therefore, before making any decision, you should consider the appropriateness of the advice with regard to those matters. If you decide to purchase or vary a financial product, your advisers, our firm, Hillross Financial Services Limited, its associates and other companies within the AMP Group will receive fees and other benefits, which will be a dollar amount and/or a percentage of either the premium you pay or the value of your investments. You can ask us for more details.
Hillross Financial Services Limited. ABN 77 003 323 055. AFS Licence No. 232705 GPO Box 4134 Sydney NSW 2001 T 1800 445 767 www.hillross.com.au
View from the hill APRIL 2015
Overview & Outlook
Despite fears that healthy levels of economic growth in
the United States would lead to increased interest rates,
the low interest rate environment across the globe
became further entrenched last month. With the absence
of any tangible sign of inflation, bond yields declined
again over March. Contributing to this decline was a
statement by the U.S. central bank implying that there
were no short term plans to raise interest rates. The
Federal Reserve stated that “economic conditions may,
for some time, warrant keeping the target federal funds
rate below levels the Committee views as normal in the
longer run.”
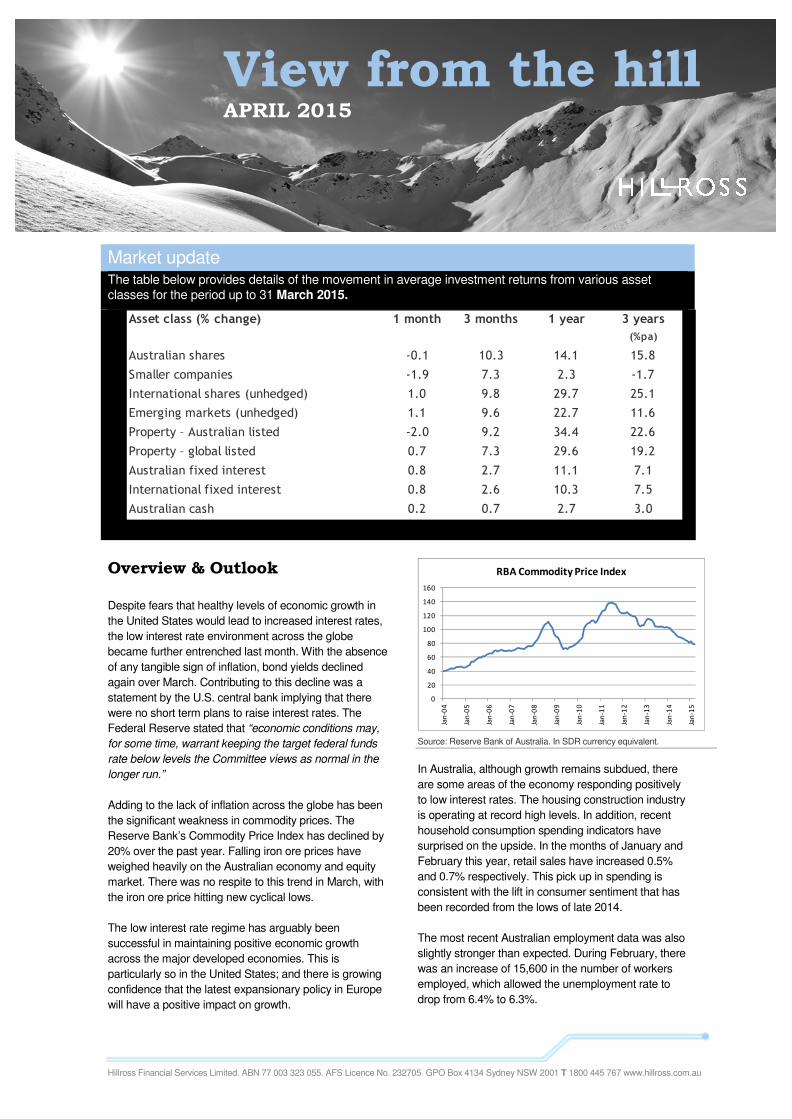
Adding to the lack of inflation across the globe has been
the significant weakness in commodity prices. The
Reserve Bank’s Commodity Price Index has declined by
20% over the past year. Falling iron ore prices have
weighed heavily on the Australian economy and equity
market. There was no respite to this trend in March, with
the iron ore price hitting new cyclical lows.
The low interest rate regime has arguably been
successful in maintaining positive economic growth
across the major developed economies. This is
particularly so in the United States; and there is growing
confidence that the latest expansionary policy in Europe
will have a positive impact on growth.
0
20
40
60
80
100
120
140
160
Jan-04
Jan-05
Jan-06
Jan-07
Jan-08
Jan-09
Jan-10
Jan-11
Jan-12
Jan-13
Jan-14
Jan-15
RBA Commodity Price Index
Source: Reserve Bank of Australia. In SDR currency equivalent.
In Australia, although growth remains subdued, there
are some areas of the economy responding positively
to low interest rates. The housing construction industry
is operating at record high levels. In addition, recent
household consumption spending indicators have
surprised on the upside. In the months of January and
February this year, retail sales have increased 0.5%
and 0.7% respectively. This pick up in spending is
consistent with the lift in consumer sentiment that has
been recorded from the lows of late 2014.
The most recent Australian employment data was also
slightly stronger than expected. During February, there
was an increase of 15,600 in the number of workers
employed, which allowed the unemployment rate to
drop from 6.4% to 6.3%.
Market update The table below provides details of the movement in average investment returns from various asset classes for the period up to 31 March 2015.
Asset class (% change) 1 month 3 months 1 year 3 years
(%pa)
Australian shares -0.1 10.3 14.1 15.8
Smaller companies -1.9 7.3 2.3 -1.7
International shares (unhedged) 1.0 9.8 29.7 25.1
Emerging markets (unhedged) 1.1 9.6 22.7 11.6
Property – Australian listed -2.0 9.2 34.4 22.6
Property – global listed 0.7 7.3 29.6 19.2
Australian fixed interest 0.8 2.7 11.1 7.1
International fixed interest 0.8 2.6 10.3 7.5
Australian cash 0.2 0.7 2.7 3.0

Share markets
After the strong gains of February, movements on share
markets were more subdued last month. The Australian
market was almost flat with the S&P ASX 200 Index
recording a marginal fall of 0.1% over the month. The
pattern of price movement across the sectors was
consistent with the dominant trend of recent years.
Sectors providing more defensive yield based returns
found some support; whereas resource stocks were
pushed lower by an average of 6.2% due to falling
commodity prices. Finance and healthcare were amongst
the leading sectors, both higher by around 2%.
-6%
-4%
-2%
0%
2%
4%
6%
8%
Mar-
14
Ap
r-14
May-1
4
Jun-1
4
Jul-14
Aug
-14
Sep
-14
Oct-
14
No
v-1
4
Dec-1
4
Jan-1
5
Feb
-15
Mar-
15
Monthly Australian equity market returns
Source: S&P ASX 200 Index
Results on overseas markets were mixed last month with
a 2% fall in the $A (to U.S. 76.3 cents) providing the main
source of positive return for unhedged Australian
investors. Although bond yields declined, the U.S. equity
market showed signs of nervousness over the possibility
that interest rates would move higher this year. The S&P
500 Index fell by 1.7% over the month. In contrast, strong
results were again recorded on Continental European
markets as confidence grew over the likely positive
impact of the recently announced Quantitative Easing
program.
-3% -2% -1% 0% 1% 2% 3% 4% 5%
MSCI Emerging Mkts (AUD)
UK (FTSE)
Hong Kong (Hang Seng)
Japan (Nikkei)
US (S&P 500)
Australia (S&P ASX 200)
Germany (DB AG)
World Equity Market Returns March 2015
Source: Index as shown.
Emerging markets also experienced positive returns last
month. The increase was largely due to China, where the
Shanghai Composite Index surged 13.2% in response to
some more accommodative monetary policy being put in
place by the central bank. The gains in China more than
offset declines in resource sensitive markets such as Russia
and Brazil.
Interest rates
Despite some speculation that there would be a further
easing in monetary policy, the Reserve Bank kept
interest rates unchanged following its Board meetings in
early March and April. Bond yields, however, continued
to drift lower as investors took note of the U.S. Federal
Reserve statement suggesting that low rates would be
maintained for some time ahead. The Australian 5-year
Government bond yield declined from 1.93% to 1.84%
over March, with the equivalent U.S. yield dropping
0.13% to 1.34%. These falls created increased bond
prices and positive returns for fixed interest investors.
0%
1%
2%
3%
4%
Ma
r-1
3
Jun
-13
Se
p-1
3
De
c-1
3
Ma
r-1
4
Jun
-14
Se
p-1
4
De
c-1
4
Ma
r-1
5
5 Year Bond Yields
Australia United States
Source: Reserve Bank of Australia. US Federal Reserve.
Property
Following 3 months of very strong gains, the Australian
listed property market lost ground over March. The A-REIT
sector recorded a fall of 2.0%, despite the fact that lower
bond yields made property yields more attractive on a
relative basis. There was not the same pullback on
overseas markets, however, with the UBS Global Investors
Listed Property Index rising by 0.7% in hedged currency
terms over March.
-6%
-4%
-2%
0%
2%
4%
6%
8%
Ap
r-14
May-1
4
Jun-1
4
Jul-14
Aug
-14
Sep
-14
Oct-
14
No
v-1
4
Dec-1
4
Jan-1
5
Feb
-15
Mar-
15
Listed Property Price Movements
Source: S&P ASX 200 A-REIT Acc Index.
Price rises in the residential property sector continue to
attract much attention. Low interest rates have clearly
boosted affordability and created increased demand from
investors seeking assets with higher potential returns than
interest bearing deposits. The Australian Bureau of
Statistics Property Price Index suggests that residential
prices increased by 6.8% in capital cities across Australia
over 2014. Increases ranged from 1.2% in Perth to 12.2%
in Sydney.
This newsletter is provided by Hillross Financial Services Limited (ABN 77 003 323 055 & AFSL No. 232705) an AMP Group Company. It is of a general nature only and any advice is not based on your objectives, financial situation or needs. Accordingly you should consider the appropriateness of any advice to your personal circumstances before acting on the advice. Before you make any investment decision, you should read the current Product Disclosure Statement available from Hillross or your financial adviser. Although this information was obtained from sources considered to be reliable, we do not guarantee it is accurate or complete. The information in this publication is current as at 9 April 2015, and may change over time. Hillross is part of the AMP group of companies. No additional remuneration or other benefits are paid to us or our related companies or associates in relation to the advice provided on this page. If you decide to purchase or vary a financial product, your financial adviser, Hillross and other companies within the AMP Group or associates of Hillross will receive fees and other benefits, including fees calculated as a percentage of either the premium you pay or the value of your investment. Further details are available from your adviser or Hillross. Past performance is not a reliable indicator of future performance.

1 APRIL 2015EDITION 11
What is risk in investing?
Introduction
What is risk? Surely that is a stupid question as everyone knows what risk is when it comes to investing. Investopedia (www.investopedia.com) defines risk as “the chance that an investment’s actual return will be different than expected”. It’s actually quite a complex concept because it could mean different things to different people depending on their circumstances and tolerance to it. And it can be highly perverse often being very different to what backward looking statistical measures and common sense might suggest. But it’s worth thinking about because it can impact how you invest.
Volatility
The conventional approach to measuring investment risk is to look at volatility. This is usually done with a statistical concept called standard deviation which shows how tightly clustered past returns have been around their average in a certain period. The higher the standard deviation the greater the volatility. The standard deviation of monthly returns based on very long term data for major asset classes is shown in the next table.
Major asset class volatility
Asset class Standard deviation of
monthly returns, %
Australian cash 0.5
Australian bonds 4.0
Australian real estate investment trusts 12.0
Australian shares 16.5
Global shares 15.5
Source: Global Financial Data, Bloomberg, AMP Capital
A basic idea in investments is that the higher the volatility (or risk) the higher the return should be over time as investors need to be compensated for taking on additional risk. If more risky assets do not offer this then their prices will fall until their prospective returns do. From the standard deviation and return assumptions, statistics on things like the chance of a negative
year for an asset or fund can be calculated. However, to get a real handle on risk there is much more involved than this.
The risk of capital loss
What really concerns investors is not the volatility to the upside (as most of us like stronger returns) but capital loss. Various attempts have been made to measure the risk of capital loss. However, it’s not clear that these are much better than standard deviation. More fundamentally there are several problems with simple statistical measures.
First, standard deviation and related measures of risk are backward looking and when measured over short periods can give a misleading picture as to the potential for capital loss. This is because during solid periods for returns markets tend to be relatively stable and so measured volatility and hence risk looks low. And vice versa during bad periods. For example, the next chart shows the rolling 12 month standard deviation of US shares against the US share market.
Source: Bloomberg, AMP Capital
It can be seen the standard deviation often indicates high risk when the market is low after a big fall and low risk when it’s high. This is around the wrong way. The risk of capital loss actually rises as markets go up and goes down as they fall. Trying to manage a fund based on such backward looking indicators is about as sensible as driving a car through the rear view mirror (unless you look at them as contrarian indicators).
Second, the risk regarding an asset can be perverse and radically different to what the statistics show and common sense would suggest. The well-known corporate bond investor Howard Marks is reputed to have once said that “there is nothing riskier than the widespread perception that there is no risk”. This usually comes after a period of strong returns, when economic and profit growth is solid and those investors who want to invest have. Perhaps the best way to demonstrate this is with one of my favourite charts – what Russell Investments called the roller coaster of investor emotion.
0
20
40
60
80
100
120
-500
0
500
1000
1500
2000
2500
00 02 04 06 08 10 12 14
S&P 500 price index (LHS)
Rolling 12 mth standard deviation, % (RHS)
US shares - volatility goes up in bad times, down in good
Measured "risk" high, but actual risk low
Key points
> Risk is often portrayed as just market volatility when in reality it’s a whole lot more, notably: the risk of capital loss; the risk of not having enough investment income; the risk of not having enough to last through retirement.
> Risk is also perverse. The risk of capital loss is actually highest when most consider it to be low and vice versa.

Important note: While every care has been taken in the preparation of this document, AMP Capital Investors Limited (ABN 59 001 777 591, AFSL 232497) and AMP Capital Funds Management Limited (ABN 15 159 557 721, AFSL 426455) make no representations or warranties as to the accuracy or completeness of any statement in it including, without limitation, any forecasts. Past performance is not a reliable indicator of future performance. This document has been prepared for the purpose of providing general information, without taking account of any particular investor’s objectives, financial situation or needs. An investor should, before making any investment decisions, consider the appropriateness of the information in this document, and seek professional advice, having regard to the investor’s objectives, financial situation and needs. This document is solely for the use of the party to whom it is provided.
The roller coaster of investor emotion
Source: Russell Investments, AMP Capital
During a bull market ‘optimism’ gives way to ‘excitement’, ‘thrill’ and eventually ‘euphoria’ as investors push the asset class up in value. It’s at this point investors are most bullish and most confident and relaxed. The reality though is this is actually around the point of maximum financial risk. That’s because it’s at this point that the market has become overvalued and with the crowd fully on board everyone who wants to buy has and so it only takes a bit of bad news to tip the market down.
On the flip side after a bear market when shares have become cheap and investor sentiment has collapsed to ‘depression’, the market will then reach the point of minimum risk and maximum opportunity. It then usually only takes a bit of good news to tip the market higher. Unfortunately, this is the point when both statistical measures and common sense indicate risk is high.
A classic example of the latter was in 2009 at the end of the bear market driven by the GFC. At this point statistical measures of risk were high (see the first chart), investors were scared and had retreated to cash and all the buzz was about the need to focus on capital preservation. Of course history speaks for itself on this one as 2009 provided a huge investment opportunity after which followed very strong returns.
The way to get a handle of the risk of capital loss is therefore not to look at backward looking statistics but rather at forward looking indicators such as valuation measures and indicators as to how optimistic and invested the crowd is. Maximum risk is when an asset is unambiguously overvalued and over loved.
Finally, when it comes to investing time is on your side as it smooths out short term risk. For example, over rolling 12 month periods shares periodically have negative returns (since 1900 roughly two years out of ten are negative) and/or underperform cash. But over 10 year periods this has hardly ever occurred and has never occurred over 20 year periods.
Source: Global Financial Data, Bloomberg, AMP Capital
The point is: when it comes to investing time is on your side.
Risk of insufficient income from investment
But sometimes it’s not really capital loss that should concern an investor but the risk that investment income falls short. This is
now a big issue for those who have been relying on income from bank deposits. Bank deposits are safe, but the income they offer is not. Four years ago the income on $100,000 in a three year bank term deposit was running around $6150 a year. It’s now just $2750. What happened? The deposit is safe but the income has collapsed with interest rates. By contrast, a $100,000 Australian investment in shares 4 years ago that was providing annual dividend income of $4300 (or $5600 with franking credits) is now providing an income of roughly $5350 ($6950 with franking) & the investment has risen to $122,000.
The next chart compares the annual interest and dividend income on $100,000 investments in Australian shares and one year term deposits in December 2000. The annual dividend payment has trended higher over the period reflecting growth in the value of the share investment (to $166,000 by end last year) and relatively stable dividend yields over time. By contrast the annual interest payment has fallen sharply reflecting the collapse in interest rates and the term deposit remaining at $100,000. Of course if franking credits are allowed for annual dividend payments would be about 30% higher. Because dividend yields are relatively stable over time and shares tend to rise in value over time shares can provide a stronger and somewhat smoother income flow than bank deposits.
Source: RBA, Bloomberg, AMP Capital
The same applies in relation to property rent. If diversified, it tends to be more stable than term deposit income and has growth potential.
Risk of not having enough in retirement
While investors may be focussed on short term wiggles, they can be distracted from what should really concern them and this is the risk of not having enough to last through retirement. We are living longer. A few generations ago male retirees at age 65 had just 12 years on average to live. Now it’s about 20 years and expected to stretch out further in the years ahead. But not only are we living longer post retirement but we are having more healthy active years which need to be funded. Against this backdrop there is a real danger that if we don’t have enough in growth assets our savings won’t provide sufficient growth and then ultimately income to last through our retirement years.
Wrapping up
The bottom line is that risk can mean different things – volatility, the risk of capital loss, the risk of not having enough income from your investment and the risk of not having enough in retirement. Each of these risks can be of greater or lesser importance depending on your stage in life, how much capital you have and your tolerance for risk. What’s more risk is perverse. The risk of capital loss is often highest when you think it is low (ie after good times) and lowest when you think it is high (ie after a bad patch). Trying to get a handle on this is critical to being a successful investor.
Dr Shane Oliver Head of Investment Strategy and Chief Economist AMP Capital
-30
-20
-10
0
10
20
30
40
50
60
1900 1910 1920 1930 1940 1950 1960 1970 1980 1990 2000 2010
All Ords Accumulation index, % pa return
Rolling 12 month returns
Aust share returns over over rolling 12 mth & 20 yr periods
Rolling 20 year returns
0
2,000
4,000
6,000
8,000
10,000
12,000
14,000
0
100000
200000
300000
400000
500000
600000
700000
800000
900000
1000000
01 03 05 07 09 11 13
Dividend income from share investment (RHS)
Income from bank deposit (RHS)
Value of Australian share investment (LHS)
Value of bank deposit (LHS)
$ value of investment $ value of annual income
Comparing a $100,000 investment in term deposits & Aust shares

Concentrated Portfolio –March 2015
The Hillross Model Concentrated Share Portfolio outperformed
the S&P/ASX 200 index by 2.27% during January. Over the past
12 months, the concentrated portfolio has produced a positive
return of 15.6% against a market return of 14.5%.
Portfolio
Returns to end of February 2015 %
1 Month 1 Year
3 Years
(pa)
5 Years
(pa)
Concentrated 9.16 15.62 17.36 11.36
S&P/ASX200 6.89 14.53 16.33 9.82
Australian equities surged higher after the Reserve Bank of
Australia cut the official interest rate with 0.25% to 2.25% at the
start of the February with the S&P/ASX 200 Accumulation Index
closing the month +6.89% higher. In a month with all sectors
posting positive returns, the materials (11.90%) and energy
(9.15%) sectors were the strongest performing sectors; however,
due to its heavy-weight in the benchmark, the financials sector
was the main contributor. A stabilisation in oil and commodity
prices supported the materials and energy sectors. The financial
sector performed strongly again with ongoing search for yield in
stocks such as the Westpac Banking Corp and Commonwealth
Bank of Australia. With investors previously favouring large caps,
small caps finished higher this month and performed stronger
than the large caps, with the Small Ordinaries index up by 8.43%.
The Reserve Bank of Australia (RBA) cut the official cash interest
rate by 0.25% to 2.25%. This is the first change in the official
cash rate since August 2013. The key reasons for this interest
rate cut appears to be the RBA lowering their growth forecasts
given more modest consumption growth, a milder increase in
Liquid Natural Gas (LNG) exports and a delay in the expected
recovery in non-mining business investment.
Australia’s employment fell in January and the unemployment
rate rose to a 12 year high of 6.4%. The RBA expects the
“unemployment to rise a little further and peak a little later than
earlier anticipated “. Australia’s economic data showed subdued
business confidence, but strength in house prices and a rise in
consumer confidence. The expected gradual rise in Australia’s
unemployment rate suggests that another interest rate cut is likely
over coming months.
Woolworths (WOW)
Woolworths reported a 1st half net profit of $1,384 million, up 4.7% on last year. However more damaging was the fact that the company stepped away from its net profit growth guidance for ‘14/15 of 4% - 7%, suggesting near 2% is more likely. So whichever way you spin it, a clear profit downgrade which the market embraced negatively with great enthusiasm – the share price was down around 9% on the day. Woolworths also took a restructuring charge of $148 million relating to Big W, a chain that performed poorly in the half with a decline in comparable store sales of 6.5%. On the bright side, the Australian supermarket business had margin expansion of 41bp, a good result, but at the expense of market share, and the hemorrhaging at Masters stabilised (but still racked up a loss).
Management is undertaking a strategic review of Supermarkets
with a strategy day on 6 May 2015 and has stated that there will
be investments in the 2nd half of the ‘14/15 year to support a
“reinvigoration of sales”. Our analyst is interpreting all the above
as implying zero or marginally negative EPS growth over the
balance of ‘14/15 as well as ‘15/16 which makes him one of the
more bearish forecasters. The double digit decline in the share
price is arguably at odds with the 3 to 4% profit downgrade but
like Wesfarmers, WOW was on a hefty PE and the share price
weakness means this has now been significantly de-rated. The
stock is now under review as we try to estimate how much
downside there is to current profits given the outlook for
increased competition in the backdrop of a decelerating domestic
economy.
Company 1 month return 1 year returnPortfolio
Weight (%)
Adelaide Brighton Ltd 0.28 -5.29 3.91
BHP Billiton Ltd -0.37 -19.99 4.91
Boral Ltd 5.66 17.89 2.70
Brambles Ltd -0.28 17.65 2.40
Commonwealth Bank of Australia 4.30 20.34 4.45
Goodman Group 7.73 31.26 3.54
James Hardie Industries PLC -1.36 0.93 4.40
Lend Lease Group 1.71 58.40 4.77
QBE Insurance Group Ltd -5.35 -7.66 2.80
Ramsay Health Care Ltd 4.12 35.54 1.38
Rio Tinto Ltd -0.76 -12.31 4.40
Telstra Corp Ltd 8.88 26.46 4.76
Westpac Banking Corp 3.92 11.63 4.71
Woolworths Ltd 3.59 -6.72 4.85
Woodside Petroleum Ltd -9.81 -8.29 8.65

Portfolio Weights
Energy
Materials
Industrials
Consumer Discretionary
Consumer Staples
Health Care
-60.000
-40.000
-20.000
-
20.000
40.000
60.000
80.000
Monthly Performance
Portfolio Benchmark
Company Price ($)Market Cap
A$Bn Last EPS EPS Est
Divs paid/
last 12M Net Div (%)
Grossed up
Div (%)
Announced
Div date
Implied
franking
credit
rate
Adelaide Brighton Ltd 4.35 $3 Bn 0.27$ 0.27$ 0.17$ 3.91 5.58 16/04/2015 100.00
BHP Billiton Ltd 30.2 $157 Bn 1.88$ 1.60$ 1.24$ 4.91 7.01 31/03/2015 100.00
Boral Ltd 6.12 $5 Bn 0.18$ 0.28$ 0.17$ 2.70 3.85 13/03/2015 100.00
Brambles Ltd 11.44 $18 Bn 0.38$ 0.40$ 0.23$ 2.40 2.71 9/04/2015 30.00
Commonwealth Bank of Australia 93.39 $151 Bn 5.52$ 5.59$ 4.16$ 4.45 6.36 2/04/2015 100.00
Goodman Group 6.06 $11 Bn 0.58$ 0.37$ 0.21$ 3.54 3.54 20/02/2015 0.00
James Hardie Industries PLC 14.87 $7 Bn 0.18$ 0.49$ 0.88$ 4.40 4.40 27/02/2015 0.00
Lend Lease Group 15.93 $9 Bn 1.62$ 1.07$ 0.76$ 4.77 4.77 18/03/2015 0.00
QBE Insurance Group Ltd 13.23 $18 Bn 0.59$ 0.72$ 0.31$ 2.80 4.00 13/04/2015 100.00
Ramsay Health Care Ltd 66.2 $13 Bn 1.61$ 2.00$ 0.92$ 1.38 1.97 26/03/2015 100.00
Rio Tinto Ltd 58.22 $104 Bn 3.53$ 3.67$ 2.15$ 4.40 6.28 9/04/2015 100.00
Telstra Corp Ltd 6.3 $77 Bn 0.37$ 0.34$ 0.30$ 4.76 6.80 27/03/2015 100.00
Westpac Banking Corp 38.68 $121 Bn 2.44$ 2.50$ 1.82$ 4.71 6.72 19/12/2014 100.00
Woolworths Ltd 28.67 $36 Bn 1.93$ 1.99$ 1.39$ 4.85 6.93 24/04/2015 100.00
Woodside Petroleum Ltd 34.86 $29 Bn 2.93$ 1.23$ 2.55$ 8.65 12.35 25/03/2015 100.00
Code Company SectorHistoric yield
(%)
Earnings
yield (%) Historic P/E
Portfolio
Weight (%)
ABC Adelaide Brighton Ltd Materials 7.54 6.18 16.17 7.83
BHP BHP Billiton Ltd Materials 7.68 8.17 12.24 4.62
BLD Boral Ltd Materials 2.67 3.02 33.12 3.20
BXB Brambles Ltd Industrials 4.33 4.34 23.04 3.58
CBA Commonwealth Bank of Australia Financials 6.60 5.91 16.93 8.11
GMG Goodman Group Financials 7.56 9.64 10.38 4.91
JHX James Hardie Industries PLC Materials 1.66 1.55 64.61 6.68
LLC Lend Lease Group Financials 11.50 10.19 9.82 9.30
QBE QBE Insurance Group Ltd Financials 6.27 5.84 17.13 7.00
RHC Ramsay Health Care Ltd Health Care 3.17 2.43 41.12 9.38
RIO Rio Tinto Ltd Materials 7.46 7.97 12.55 4.62
TLS Telstra Corp Ltd Telecommunication Services6.93 5.94 16.84 12.11
WBC Westpac Banking Corp Financials 7.58 6.31 15.85 7.50
WOW Woolworths Ltd Consumer Staples 5.51 6.72 14.89 6.27
WPL Woodside Petroleum Ltd Energy 9.44 11.05 9.05 4.90

Growth Portfolio – March 2015
The Hillross Model Growth Share Portfolio outperformed the
S&P/ASX 200 index by 2% during February. Over the past 12
months, the growth portfolio has produced a positive return of
13% against a market return of 14.5%.
Portfolio
Returns to end of February 2015 %
1 Mth 1 Year 3 Years
(pa)
5 Years
(pa)
Growth 8.83 12.95 13.00 7.26
S&P/ASX200 6.89 14.53 16.33 9.82
Australian equities surged higher after the Reserve Bank of
Australia cut the official interest rate with 0.25% to 2.25% at the
start of the February with the S&P/ASX 200 Accumulation Index
closing the month +6.89% higher. In a month with all sectors
posting positive returns, the materials (11.90%) and energy
(9.15%) sectors were the strongest performing sectors; however,
due to its heavy-weight in the benchmark, the financials sector
was the main contributor. A stabilisation in oil and commodity
prices supported the materials and energy sectors. The financial
sector performed strongly again with ongoing search for yield in
stocks such as the Westpac Banking Corp and Commonwealth
Bank of Australia. With investors previously favouring large caps,
small caps finished higher this month and performed stronger
than the large caps, with the Small Ordinaries index up by 8.43%.
Rates go sub-zero, markets go red-hot
In recent months, we’ve seen a renewed move to lower global
and local interest rates. In Denmark, for example, rates have
fallen to -0.75%. While we have had negative real yields (yields
adjusted for inflation) in many jurisdictions for a few years now,
the move to negative nominal yields (before inflation) is
something new. Should this unprecedented situation persist or
propagate, it may lead to some uncertainty about whether central
banks are capable of ‘engineering’ a recovery.
From an Australian equities point-of-view, this phenomenon has
been one of the factors driving the market higher for the past two
months. The latest leg down has seen the fervour for yield reach
even higher levels. These looser global monetary conditions have
been accompanied with a local rate cut by the Reserve Bank of
Australia and a lower Australian dollar. Locally, this makes the
move out of cash more urgent as offshore players buy more
Australian stocks particularly those with strong yield
characteristics.
These forces combine to form a ‘wall of money’, which appears to
be a strong effect in the red-hot run the market has enjoyed
during the past two months. While this is great for the market and
those of us fully invested, we need to appreciate that some of
these flows may be fickle and they don’t appear to be too
valuation driven.
While it’s easy to get excited, it’s important to keep a grounded
demeanour and not give into the temptation to buy for
momentum’s sake or on takeover potential. Instead, investors
should keep an eye on fundamentals, the progress of earnings
and their derivative dividends. A wise old investor once said in the
short-term, the stock market behaves like a voting machine but in
the long-term, it acts like a weighing machine.
Company 1 month return 1 year returnPortfolio
Weight (%)
Adelaide Brighton Ltd 0.28 -5.29 3.91
Ansell Ltd 0.67 18.26 1.80
BHP Billiton Ltd -0.37 -19.99 4.91
Bank of Queensland Ltd 2.71 11.15 4.60
Brambles Ltd -0.28 17.65 2.40
CSL Ltd 1.47 25.18 1.49
Fletcher Building Ltd -1.26 -7.89 3.92
Goodman Group 7.73 31.26 3.54
QBE Insurance Group Ltd -5.35 -7.66 2.80
Ramsay Health Care Ltd 4.12 35.54 1.38
Rio Tinto Ltd -0.76 -12.31 4.40
ResMed Inc 16.43 60.64 1.33
Seek Ltd 3.36 43.84 1.72
Sydney Airport 5.94 26.65 4.52
Westpac Banking Corp 3.92 11.63 4.71
Wesfarmers Ltd 4.48 1.99 6.92
Woodside Petroleum Ltd -9.81 -8.29 8.65