Elastic Plastic Response Spectra for Exponential Blast Loading

New Design Guidelines for Slug Loading and Response in Pipelines and Risers
MCE Deepwater Development 2015, London

Slug Loading and Response
SLARP Phase 2 Testing
A-frame Supports
Lazy-S Riser Typical Riser Base Spool Problem

Slugging Problem Definition
Steady flow = Constant force
Slug flow = Time varying forces
− Varying fluid mass (heavy vs light)
− Varying fluid forces at bends
− Varying pressure, friction, Coriolis, etc.
Fatigue and overloading can occur if slug flow is coupled with onerous frequencies, dynamics and susceptible configurations
3

Phase 1: Kick-off April 2010
Phase 2: Completed 2014
Phase 3: Commenced 2014 ⇒ Schedule for completion Q1 2016
4
Slug Loading and Response in Pipelines and Risers
⇒Global structural response
1
2
3

Participation
Phase 1: Desktop Analysis
BP, BSEE, Chevron, ExxonMobil, Petrobras, Saipem,
Technip, Total, GE-Wellstream
Phase 2: Testing & Analysis
BP, BSEE, Chevron, ExxonMobil, Petrobras, Saipem,
Total, GE-Wellstream
Phase 3: Further Testing & Analysis
BP, Chevron, Saipem, Total
⇒ Confirmed to date…
5
Collaboration
Supported by a wide range of collaborating organizations
Working together to achieve a common GOAL
Establish industry consensus on methodologies for analyzing structural response of pipeline & riser configurations subject to slug flow
6

Analytical formulation & methodologies
Communication of flow data
Global response to bend forces
Enhanced numerical modelling
Multi-planar configurations
Response coupling
Breakup & vertical flow
Viscosity effects
Resonance effects
7
Phase 1
Phase 2 (Testing)
Phase 3 (Testing)
Targeted Uncertainties
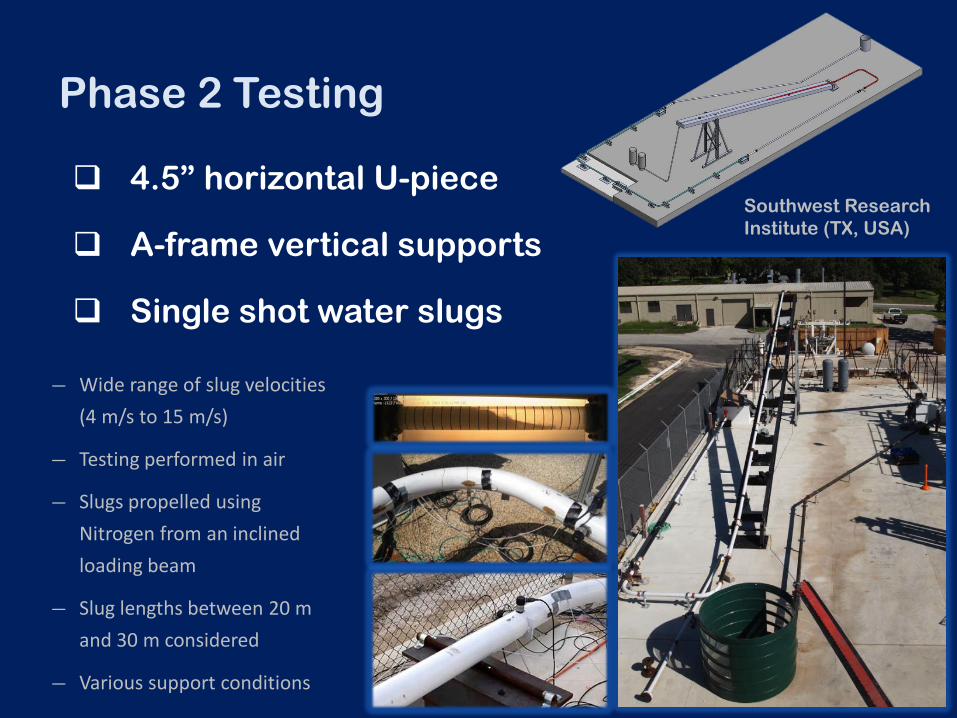
Phase 2 Testing
4.5” horizontal U-piece
A-frame vertical supports
Single shot water slugs
8
Southwest Research Institute (TX, USA)
− Wide range of slug velocities (4 m/s to 15 m/s)
− Testing performed in air
− Slugs propelled using Nitrogen from an inclined loading beam
− Slug lengths between 20 m and 30 m considered
− Various support conditions

Test Results and Findings
Enhanced numerical model developed to replicate changing length & velocity of slugs
Excellent correlations achieved
9
Dynamic displacement of piping system due to slug flow
Horizontal racking displacement of U-piece
String potentiometer for displacement measurement
Numerical model correlation
Physical Model vs Numerical Model
Pipe Displacement Time History
CFD correlation
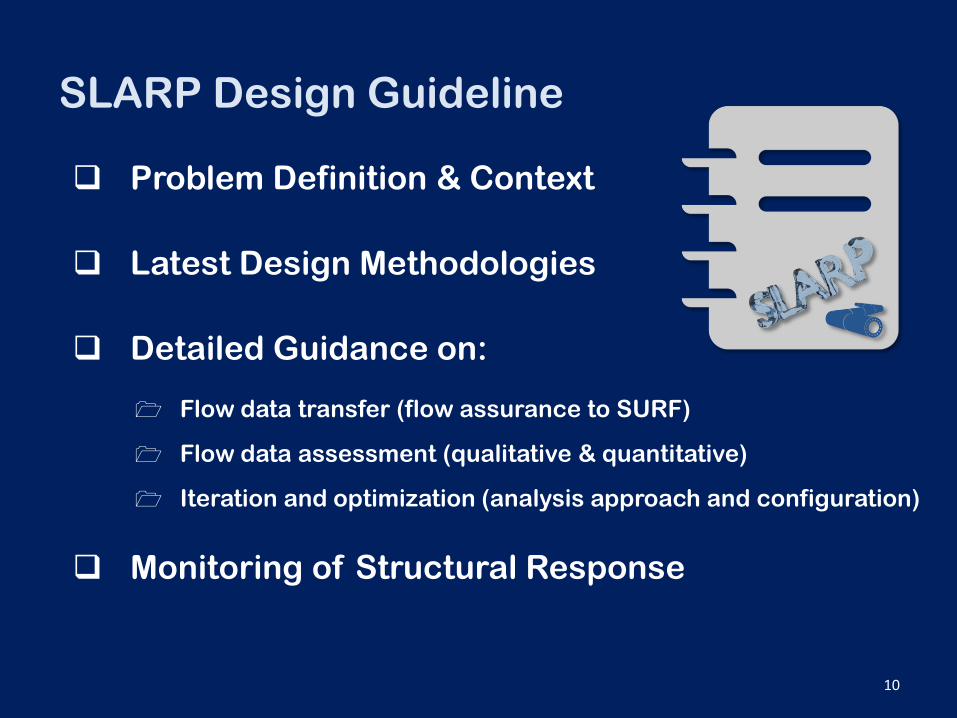
SLARP Design Guideline
Problem Definition & Context
Latest Design Methodologies
Detailed Guidance on:
Flow data transfer (flow assurance to SURF)
Flow data assessment (qualitative & quantitative)
Iteration and optimization (analysis approach and configuration)
Monitoring of Structural Response
10
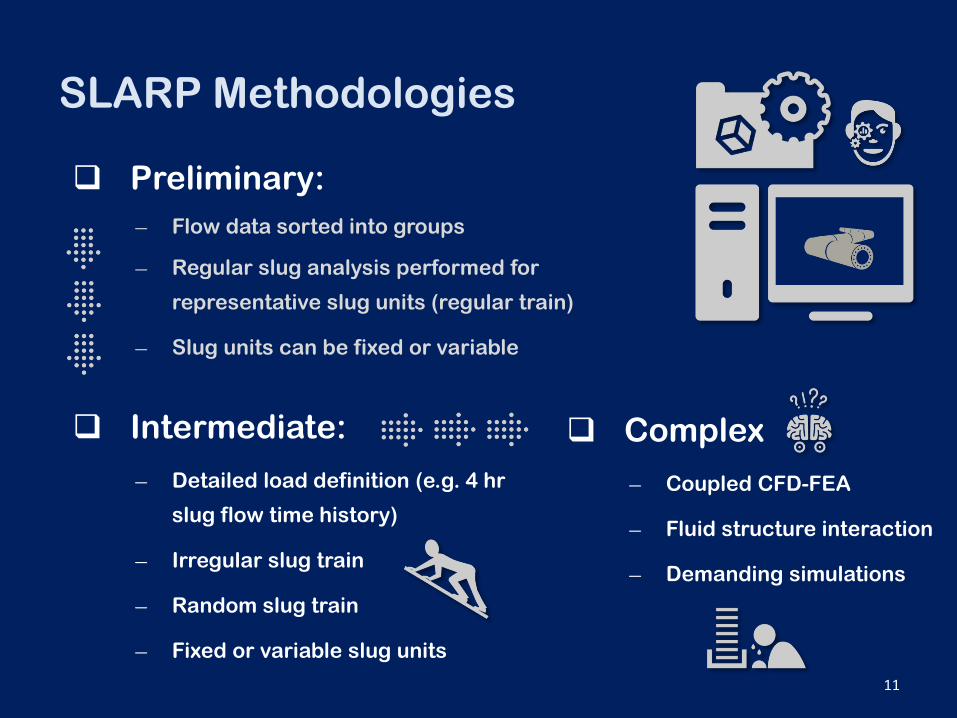
SLARP Methodologies
Preliminary: − Flow data sorted into groups
− Regular slug analysis performed for
representative slug units (regular train)
− Slug units can be fixed or variable
Intermediate:
− Detailed load definition (e.g. 4 hr
slug flow time history)
− Irregular slug train
− Random slug train
− Fixed or variable slug units
11
Complex
− Coupled CFD-FEA
− Fluid structure interaction
− Demanding simulations

Intermediate Approaches
Slug Train Analogy…
Irregular slug train setup based on specific flow assurance (FA) simulation window
12
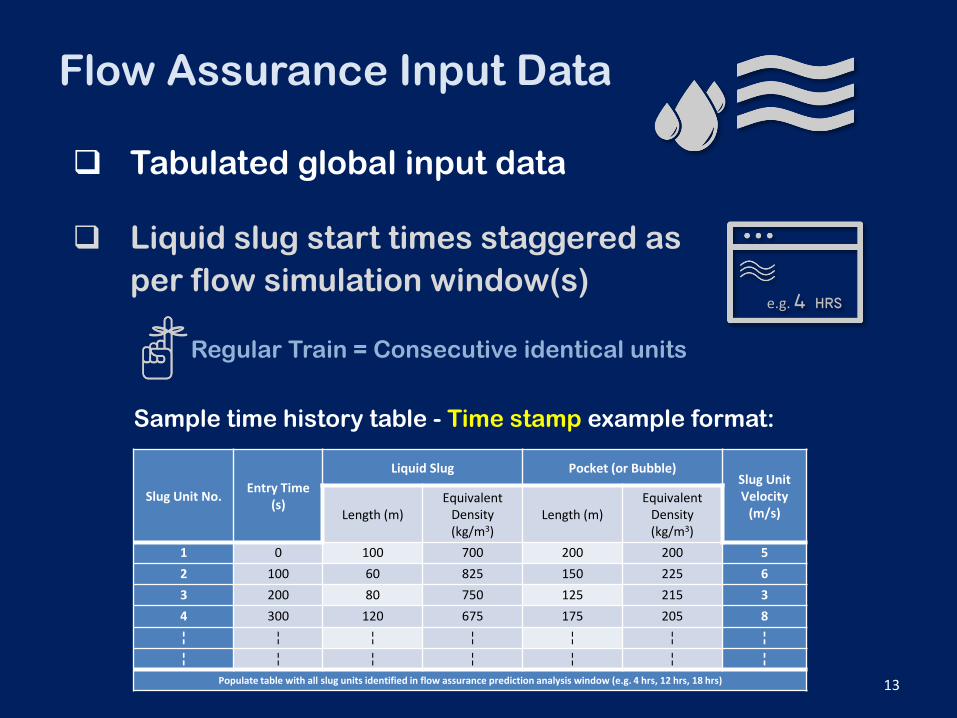
Flow Assurance Input Data
Tabulated global input data
Liquid slug start times staggered as per flow simulation window(s)
Regular Train = Consecutive identical units
Sample time history table - Time stamp example format:
13
Slug Unit No. Entry Time (s)
Liquid Slug Pocket (or Bubble) Slug Unit Velocity
(m/s) Length (m) Equivalent
Density (kg/m3)
Length (m) Equivalent
Density (kg/m3)
1 0 100 700 200 200 5 2 100 60 825 150 225 6 3 200 80 750 125 215 3 4 300 120 675 175 205 8 ¦ ¦ ¦ ¦ ¦ ¦ ¦ ¦ ¦ ¦ ¦ ¦ ¦ ¦
Populate table with all slug units identified in flow assurance prediction analysis window (e.g. 4 hrs, 12 hrs, 18 hrs)
e.g.

Irregular Slug Train
Each slug unit can be different
Different representative slug unit velocities can be assigned to slug units
Train carriages can join, separate & change length!
Variable slug units are also possible, i.e.:
Slug units can change properties during transit
14

Slugging Fatigue Damage
First calculate for simulation window
e.g. 4 hrs, 8 hrs or 12 hrs
Then extrapolated to window of operation
e.g. 12 months
Compare to slugging fatigue budget
(or total calculation)
15
Slugging? Other fatigue mechanisms

Phase 3 – Latest Scope of Work
Testing with continuous flow setup
Testing of multi-planar configuration
Numerical model correlation
SLARP Design Guideline update
Worked examples
Field data correlation study
Detailed monitoring system review
16
Final details being worked
Subject to final participation numbers
Summary

Summary
SLARP Design Guideline represents a significant forward step as the 1st collaborative industry guideline relating to slug loading & response methodologies in pipelines & risers
Successful correlation of full scale test response results with numerical model predictions for a range of conditions
Phase 3 (now ongoing) will significantly expand current insights & model validation
18

MCE DD 2015 – Thank You!
Presenter:
Jason Payne, Wood Group Kenny Ireland
Senior Project Manager – Technology Team
Co-authors:
− Adrian Connaire & Christian Chauvet, WGK
− Steven Green, Southwest Research Institute (SwRI)
Acknowledgments:
− SLARP JIP Participants - BP, BSEE, Chevron, ExxonMobil, GE-
Wellstream, Petrobras, Saipem, Technip, Total
19 www.slarp-jip.com