On the gas-ice depth difference ( depth) along the EPICA Dome C ...

New constraints on the gas age-ice age difference along
the EPICA ice cores, 0–50 kyr
L. Loulergue, F. Parrenin, T. Blunier, J.-M. Barnola, R. Spahni, A. Schilt, G.
Raisbeck, J. Chappellaz
To cite this version:
L. Loulergue, F. Parrenin, T. Blunier, J.-M. Barnola, R. Spahni, et al.. New constraints on thegas age-ice age difference along the EPICA ice cores, 0–50 kyr. Climate of the Past Discussions,European Geosciences Union (EGU), 2007, 3 (2), pp.435-467. <hal-00330728>
HAL Id: hal-00330728
https://hal.archives-ouvertes.fr/hal-00330728
Submitted on 5 Mar 2007
HAL is a multi-disciplinary open accessarchive for the deposit and dissemination of sci-entific research documents, whether they are pub-lished or not. The documents may come fromteaching and research institutions in France orabroad, or from public or private research centers.
L’archive ouverte pluridisciplinaire HAL, estdestinee au depot et a la diffusion de documentsscientifiques de niveau recherche, publies ou non,emanant des etablissements d’enseignement et derecherche francais ou etrangers, des laboratoirespublics ou prives.

CPD
3, 435–467, 2007
Gas age-ice age
differences along the
EPICA cores
L. Loulergue et al.
Title Page
Abstract Introduction
Conclusions References
Tables Figures
◭ ◮
◭ ◮
Back Close
Full Screen / Esc
Printer-friendly Version
Interactive Discussion
EGU
Clim. Past Discuss., 3, 435–467, 2007
www.clim-past-discuss.net/3/435/2007/
© Author(s) 2007. This work is licensed
under a Creative Commons License.
Climate
of the Past
Discussions
Climate of the Past Discussions is the access reviewed discussion forum of Climate of the Past
New constraints on the gas age-ice age
difference along the EPICA ice cores,
0–50 kyr
L. Loulergue1, F. Parrenin
1, T. Blunier
2, J.-M. Barnola
1, R. Spahni
2, A. Schilt
2,
G. Raisbeck3, and J. Chappellaz
1
1Laboratoire de Glaciologie et de Geophysique de l’Environnement (LGGE), CNRS, Universite
Joseph Fourier – Grenoble, BP96 38402 Saint Martin d’Heres Cedex, France2Climate and Environmental Physics, Physics Institute, University of Bern, Sidlerstrasse 5,
3012 Bern, Switzerland3Centre de Spectrometrie Nucleaire et de Spectrometrie de Masse (CSNSM),
IN2P3-CNRS-Universite de Paris-Sud, Bat 108, 91405 Orsay Cedex, France
Received: 14 February 2007 – Accepted: 21 February 2007 – Published: 5 March 2007
Correspondence to: L. Loulergue ([email protected])
435

CPD
3, 435–467, 2007
Gas age-ice age
differences along the
EPICA cores
L. Loulergue et al.
Title Page
Abstract Introduction
Conclusions References
Tables Figures
◭ ◮
◭ ◮
Back Close
Full Screen / Esc
Printer-friendly Version
Interactive Discussion
EGU
Abstract
Gas is trapped in polar ice sheets at ∼50–120 m below the surface and is therefore
younger than the surrounding ice. Firn densification models are used to evaluate this
ice age-gas age difference (∆age) in the past. However, such models are not well
tested on low accumulation and cold sites of the East Antarctic plateau, especially for5
periods with different climatic conditions. Here we bring new constraints to test a firn
densification model applied to the EPICA Dome C (EDC) site for the last 50 kyr, by
linking the EDC ice core to the EPICA Dronning Maud Land (EDML) ice core, both
in the ice phase (using volcanic horizons) and in the gas phase (using rapid methane
variations). We use the structured10
Be peak, occurring 41 kyr before present (BP) and10
due to the low geomagnetic field associated with the Laschamp event, to experimen-
tally estimate the ∆age and ∆depth during this event. It allows us to evaluate the model
and to link together climatic archives from EDC and EDML to NorthGRIP (Greenland).
Our results reveal an overestimate of the ∆age by the firn densification model during
the last glacial period at EDC. Tests with different accumulation rates and tempera-15
ture scenarios do not entirely resolve this discrepancy. Our finding suggests that the
phase relationship between CO2 and EDC temperature inferred at the start of the last
deglaciation (lag of CO2 by 800±600 yr) is overestimated and that the CO2 increase
could well have been in phase or slightly leading the temperature increase at EDC.
1 Introduction20
The timing of climatic events in the two hemispheres is a key information for a better
understanding of the mechanisms of climate change. Comparison of Greenland and
Antarctic ice records can be accomplished using atmospheric gas records as correla-
tive tools. Ice cores from high accumulation rate sites are preferable as they minimize
uncertainties in the difference between the age of the gas and the age of the sur-25
rounding ice matrix (∆age) (Schwander et al., 1997). Atmospheric trace gases with
436
CPD
3, 435–467, 2007
Gas age-ice age
differences along the
EPICA cores
L. Loulergue et al.
Title Page
Abstract Introduction
Conclusions References
Tables Figures
◭ ◮
◭ ◮
Back Close
Full Screen / Esc
Printer-friendly Version
Interactive Discussion
EGU
lifetimes exceeding the interhemispheric mixing time and showing significant changes
in the past, can be considered as time markers on a global scale. The most prominent
trace gases measured routinely on extracted air from ice cores are carbon dioxide,
methane and nitrous oxide (CO2, CH4, N2O) (Stauffer et al., 2002; Siegenthaler et al.,
2005; Spahni et al., 2005). Additionally available is the isotopic composition δ18
O of5
O2 (δ18
Oatm), a proxy for biologic productivity and ice volume changes (Sowers et al.,
1993). Atmospheric CH4 and δ18
Oatm records are preferentially used for synchronisa-
tions during the last glacial period. The reconstructed CO2 concentration suffers from
in situ production in Greenland ice cores (Anklin et al., 1995), and N2O shows sporadic
artefacts occurring in depth intervals with elevated dust concentrations, hence in ice10
covering glacial time periods (Sowers, 2001; Stauffer et al., 2003). CH4 is of special
interest for three reasons: the past atmospheric signal is reliably recorded in ice cores
from both polar regions, it shows large temporal concentration variations, and it closely
follows Greenland rapid climatic variability during the last glaciation and deglaciation
(Chappellaz et al., 1993).15
Several studies have already used the O2 isotopes and/or the CH4 concentration to
constrain the climatic relation between the hemispheres at the last glacial inception
(Landais et al., 2004), the last glaciation (Bender et al., 1994; Blunier et al., 1998;
Blunier and Brook, 2001) and the last deglaciation (Blunier et al., 1997; Steig et al.,
2002). Best information about the timing of climate events comes from high-resolution20
gas records which have absolute or synchronized timescales with uncertainties smaller
than 500 yr (Blunier and Brook, 2001). Based on the methane correlation it has been
proposed that for each large Dansgaard-Oeschger (DO) event in Greenland exists a
corresponding warming event in Antarctica (Blunier et al., 1998; Blunier and Brook,
2001). The abrupt DO warming in Greenland is preceded by a slower warming in25
Antarctica. In addition Antarctic temperatures peak at about the time of the abrupt
warming in Greenland. This north-south interaction suggests a strong teleconnection
between the two poles through heat transport by the ocean circulation (Stocker and
Johnsen, 2003). This connection feature has been termed “bipolar seesaw”. Recently
437

CPD
3, 435–467, 2007
Gas age-ice age
differences along the
EPICA cores
L. Loulergue et al.
Title Page
Abstract Introduction
Conclusions References
Tables Figures
◭ ◮
◭ ◮
Back Close
Full Screen / Esc
Printer-friendly Version
Interactive Discussion
EGU
a high-resolution methane record combined with a detailed isotopic profile was pro-
duced from the EDML ice core in Antarctica (EPICA Community Members, 2006). It
indicates that even the smaller DO events in Greenland have a counterpart in Antarc-
tica. The amplitude of the Greenland warming appears to be linearly correlated with
the duration of the preceding warm phase in Antarctica. EDML is indeed an interessant5
ice core, located in the Atlantic sector of Antarctica, showing this one-to-one coupling.
The gas dating tool provides a relative chronology between ice cores, not an abso-
lute dating. The quality of this relative chronology strongly depends on how accurate
the calculation of the ∆age is. The latter can be estimated by a firn densification model
assuming that we know the ice chronology and the past variations of surface temper-10
ature and accumulation rate at the site of deposition. ∆age is small and very well
determined in Greenland over the last glacial period, due to the relatively high accu-
mulation rate. This characteristic of Greenland ice cores further allows annual layer
counting as used in the new ice chronology GICC05 for NorthGRIP (Andersen et al.,
2006; Rasmussen et al., 2006; Svensson et al., 2006; Vinther et al., 2006). In addition15
to the model results, ∆age can be determined directly from the Greenland ice core it-
self. The abrupt Greenland surface warmings induce a temperature gradient in the firn
column. This temperature gradient causes isotopically heavier molecules to migrate
towards the cold end. This thermal diffusion affects the isotopic ratios of atmospheric
nitrogen and argon, which are thought to be constant over time in the atmosphere.20
Therefore, anomalies of the isotopic ratios allow to calculate the amplitude of fast
temperature changes in the past. Further, they set the start point of these changes in
the gas record. Since the temperature variation is recorded in the isotopic composition
of the ice and in the isotopic composition of the gases of the enclosed air, the difference
of the respective depths (∆depth) is directly accessible. With an underlying timescale25
we find also the corresponding ∆age, e.g. for each DO event individually. Unfortunately,
in Antarctica, thermal diffusion produces isotope anomalies usually too small to be
detected. In addition, the lower accumulation rate results in relatively uncertain ∆age
calculations.
438

CPD
3, 435–467, 2007
Gas age-ice age
differences along the
EPICA cores
L. Loulergue et al.
Title Page
Abstract Introduction
Conclusions References
Tables Figures
◭ ◮
◭ ◮
Back Close
Full Screen / Esc
Printer-friendly Version
Interactive Discussion
EGU
One way to improve the accuracy of ∆age estimates in Antarctica is to rely on a strati-
graphic marker recorded in the ice matrix of two ice cores. This allows the correlation
of the ice records in addition to the gas correlation. The10
Be anomaly (Raisbeck et
al., 2002) provides such a marker. It is observed as a highly structured peak believed
to be due to a low geomagnetic field associated with the Laschamp Event (Mazaud5
et al., 1994), centered at 40.4±2 kyr BP (Guillou et al., 2004). Yiou et al. (1997) and
Raisbeck et al. (2002) showed that this10
Be peak is contemporary with the DO event
# 10.
Here we present new CH4 data obtained on the EDC ice core (75◦′
S, 123◦E,
3233 m a.s.l., 25 kg m−2
yr−1
) over the last 55 kyr BP (before AD 1950), that comple-10
ment recently published CH4 data along the EDML ice core (75◦S, 0
◦E, 2892 m a.s.l.,
64 kg m−2
yr−1
) (EPICA Community Members, 2006) and a stack of Greenland CH4
records (Blunier et al., 2007). We then evaluate different accumulation and temper-
ature scenarios against the objective that the ∆age at EDC and EDML obtained by
the densification model should produce 1) two consistent gas age scales at EDC and15
EDML; and 2) a North-South synchronisation compatible with the one obtained from
the10
Be peak during the Laschamp event.
2 Data
2.1 Ice chronologies
When evaluating the ice/gas difference (as a function of age at the same depth – here-20
after ∆age – or as a function of depth at the same age – hereafter ∆depth) with a firn
densification model, a chronology for the ice has to be imposed.
For the NorthGRIP core, we use the GICC05 chronology obtained by annual layer
counting from 0 to 42 kyr BP (Andersen et al., 2006; Rasmussen et al., 2006; Svensson
et al., 2006; Vinther et al., 2006. The uncertainty of GICC05 is around 1.6 kyr at the25
location of the10
Be peak. Its GICC05 age of 41.2 kyr BP matches recent independent
439

CPD
3, 435–467, 2007
Gas age-ice age
differences along the
EPICA cores
L. Loulergue et al.
Title Page
Abstract Introduction
Conclusions References
Tables Figures
◭ ◮
◭ ◮
Back Close
Full Screen / Esc
Printer-friendly Version
Interactive Discussion
EGU
estimates within a few centuries (Svensson et al., 2006). Note that the uncertainty on
the time spent between two nearby depth levels (which can be expressed as e.g. the
number of uncertain counted layers per meter) is smaller than the error on the absolute
ages, the latter being cumulative with depth.
The new EDC ice chronology (hereafter EDC3, Parrenin et al., 20071) is based on5
a relatively simple ice flow model applied to ice domes. Several control age windows
are used (from absolutely dated horizons and from comparison to others paleoclimatic
records) to constrain the free parameters of the model via an inverse method (Parrenin
et al., 2001). For the last 50 kyr, EDC3 is matched onto GICC05 (Parrenin et al.,
20071) at several tie points: during the last 6 kyr (by
10Be-
10Be synchronization), during10
the last deglaciation (by methane-isotope synchronization) and during the Laschamp
event (by10
Be-10
Be synchronization).
The corresponding chronology for EDML (hereafter EDML1, Ruth et al., 2007) has
been derived by synchronizing the EDML and EDC ice cores using volcanic and dust tie
points based on continuous sulfate, electrolytic conductivity, dielectric profiling, partic-15
ulate dust and Ca2+
data available for both cores (Severi et al., 2007). Due to common
changes in the Patagonian dust source strength and the hemispheric significance of
major volcanic eruptions, this procedure is justified. For the last 75 kyr (the period of
interest in this study), the synchronization is mainly based on unambiguous volcanic
markers recorded in the sulphate parameter, providing a synchronization to better than20
±100 years (on average ±35 years, Ruth et al., 2007).
1Parrenin, F., Barnola, J.-M., Beer, J., Blunier, T., Castellano, E., Chappellaz, J., Dreyfus, G.,
Fischer, H., Fujita, S., Jouzel, J., Kawamura, K., Lemieux, B., Loulergue, L., Masson-Delmotte,
V., Narcisi, B., Petit, J.-R., Raisbeck, G. M., Raynaud, D., Ruth, U., Schwander, J., Severi, M.,
Spahni, R., Steffensen, J. P., Svensson, A., Udisti, R., Waelbroeck, C., and Wolff, E.: The EDC3
agescale for the EPICA Dome C ice core, Clim. Past Discuss., submitted, 2007.
440

CPD
3, 435–467, 2007
Gas age-ice age
differences along the
EPICA cores
L. Loulergue et al.
Title Page
Abstract Introduction
Conclusions References
Tables Figures
◭ ◮
◭ ◮
Back Close
Full Screen / Esc
Printer-friendly Version
Interactive Discussion
EGU
2.2 Temperature and accumulation parameterizations
∆age estimates from a firn densification model (Pimienta et al., 1987; Arnaud et al.,
2000; Goujon et al., 2003) require knowing the history of surface temperature and
accumulation rate at the site of deposition. Below we present the temperature and
accumulation parameterizations that will be used further on.5
Accumulation rate A and temperature T are deduced from the deuterium content of
the ice δD, through the following relationships:
T = T 0+ α∆δDcorr (1)
A = A0 expβ∆δDsmo (2)
where A0
and T0
are surface accumulation and temperature for the present. ∆δDcorr10
corresponds to the present-day value δD0 isotope corrected for the variations in tem-
perature and isotope at the source of the air masses (Parrenin et al., 2007). The latter
is determined through isotopic reconstructions of benthic foraminifera (Bintanja et al.,
2005). ∆δDsmo is a 50-yr running average of ∆δDcorr (to remove the noise of water
isotopic ratios unrelated with accumulation rate changes). α represents the spatial15
slope of the present-day isotopic thermometer. β is a corrective factor influencing the
glacial-interglacial relationship between accumulation rate and δD changes.
As EDML was measured for δ18
O instead of δD, the following relationship is used
δD = 8 · δ18O + 10 (3)
The present-day isotopic content, temperature and accumulation rates are respectively20
δD0=–396.5‰, T0=217.5 K, A
0=2.84 cm-of-ice/yr for EDC (Parrenin et al., 2007
(5))
and δD0=-351.22‰, T0=228.65 K, A
0=6.4 cm-of-ice/yr for EDML (supplementary ma-
terial, EPICA, Community Members, 2006).
Equation (2) leads to an average glacial accumulation rate at the EDML drill site
of about 2.9 cm WE/year (EPICA Community Members, 2006), a value not far from25
441

CPD
3, 435–467, 2007
Gas age-ice age
differences along the
EPICA cores
L. Loulergue et al.
Title Page
Abstract Introduction
Conclusions References
Tables Figures
◭ ◮
◭ ◮
Back Close
Full Screen / Esc
Printer-friendly Version
Interactive Discussion
EGU
the present one of Dome C (2.5 cm WE/year) (EPICA Community Members, 2004).
Furthermore, smooth modifications of the accumulation rate at EDC were applied in
order to match EDC3 onto GICC05 back to 41 kyr BP (Parrenin et al., 20071), creating
some artefacts of the accumulation rate during early Holocene.
2.3 Methane records5
We use CH4 records from EDC and EDML back to 55 kyr BP (Fig. 1) (EPICA Commu-
nity Members, 2006). For EDC, the resolution of the existing methane data (Spahni et
al., 2005) has been doubled (leading to an average temporal resolution of 93 years)
and extra samples were analyzed around DO 8 to 11 corresponding to the location of
the10
Be peak. The measurements were performed at Bern and Grenoble with a wet10
extraction technique. Details of the method can be found in Chappellaz et al. (1997).
For consistency with previously published EDC and EDML CH4 data sets, the CH4 mix-
ing ratios obtained at LGGE are increased by 6 ppbv to be in accordance with the Bern
values (Spahni et al., 2005). The measurement uncertainty is ±10 ppbv (Chappellaz
et al., 1997).15
2.4 The 41 kyr10
Be peak in Greenland and Antarctic ice cores
10Be has been measured in detail on the EDC (Raisbeck et al., 2002, 2007
2) and
GRIP (Yiou et al., 1997) ice cores, depicting the full structure of the peak at 41 kyr BP.
The uncertainty of the position of two sub-peaks during the Laschamp event is about
±1.1 m for both cores. The10
Be record at NorthGRIP is not completed yet. There-20
fore the position of the10
Be sub-peaks at NorthGRIP is based on GRIP-NorthGRIP
isotopic synchronization (Svensson et al., 2006). The uncertainty associated with this
GRIP-NorthGRIP synchronization is neglected here (NorthGRIP Community Members,
2004).
2Raisbeck, G. M., Yiou, F., Jouzel, J., and Stocker, T. F.: Direct North- South Synchronization
of abrupt climate change records in ice cores using be10, in preparation, 2007.
442

CPD
3, 435–467, 2007
Gas age-ice age
differences along the
EPICA cores
L. Loulergue et al.
Title Page
Abstract Introduction
Conclusions References
Tables Figures
◭ ◮
◭ ◮
Back Close
Full Screen / Esc
Printer-friendly Version
Interactive Discussion
EGU
For EDML, the10
Be peak has not yet been measured. To determine its probable
location in the core, we use the synchronization through volcanic horizons between the
EDML and EDC cores (Severi et al., 2007). The estimated depths of the two10
Be sub-
peaks in the EDML core are shown in Table 1. The uncertainty of the corresponding
depths is ±0.23 m and ±0.35 m (Ruth et al., 2007).5
3 Empirical constraints on EDC and EDML ∆ages
Two types of empirical constraints on the EDC and EDML ∆ages are used. The first is
based on EDC and EDML ice (sulphate) and gas (methane) synchronisation during the
last glacial period (Sect. 3.1). The second involves their synchronisation to NorthGRIP
during the Laschamp event (Sect. 3.2).10
3.1 EDC-EDML CH4 synchronisation
As the ice of the two EPICA ice cores is well synchronized via volcanic horizons (±35
years, Severi et al., 2007; Ruth et al., 2007 ), a correct estimate of ∆age/∆depth at
both sites should lead to synchronised CH4 records in the gas phase. We use the
sharp methane transitions to define match points between the two cores, taken at15
middle slope of each CH4 sharp increase and decrease (Table 2), and to evaluate the
correctness of the two modelled ∆age/∆depth.
Note that contrary to the information inferred by comparison to NorthGRIP during the
Laschamp event, this constraint is only relative. Hence, we do not infer an estimate of
∆age (or ∆depth) at each site, but we determine if two scenarios of ∆age (or ∆depth)20
at each site are consistent. The accumulation rate being more than twice as large
at EDML than at EDC, its ∆age is smaller and better constrained. Consequently, the
EDML-EDC methane synchronisation brings more constraints on the EDC ∆age.
In the following, this empirical constraint will be referred to as the EDC-EDML con-
straint.25
443

CPD
3, 435–467, 2007
Gas age-ice age
differences along the
EPICA cores
L. Loulergue et al.
Title Page
Abstract Introduction
Conclusions References
Tables Figures
◭ ◮
◭ ◮
Back Close
Full Screen / Esc
Printer-friendly Version
Interactive Discussion
EGU
3.2 ∆age and ∆depth constraints during the Laschamp event
∆age and ∆depth at the depth of the10
Be peak in the two EPICA cores is estimated
by linking both their ice and gas signals to NorthGRIP. The ice link is obtained by10
Be-10
Be synchronisation for both10
Be sub-peaks. The gas link is obtained by matching
the EPICA CH4 records to the NorthGRIP isotopic record, assuming that these two5
records are synchronous during the rapid DO transitions (Huber et al., 2006).
3.2.1 The ∆age method
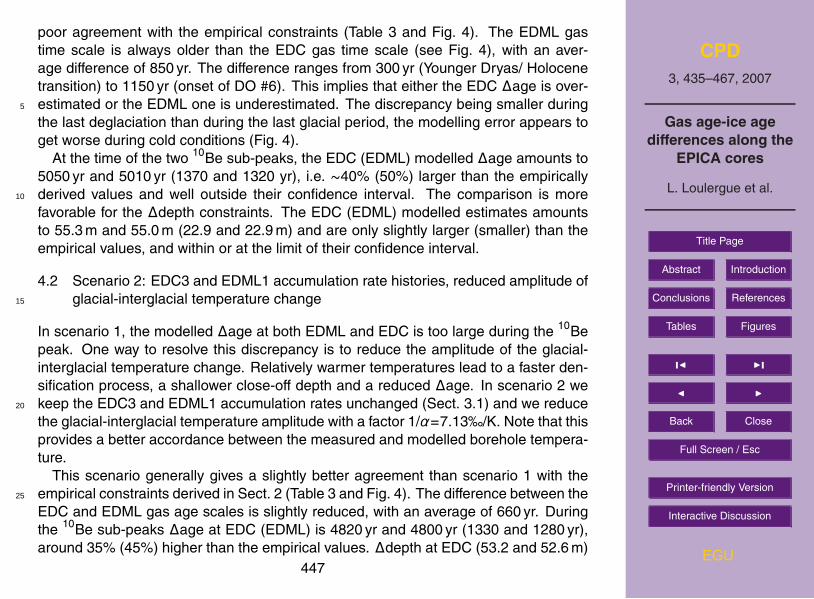
The method is illustrated in Figs. 2 and 3 for EDC. One of the10
Be sub-peaks is found
at the ice depths DC-d1 at EDC and NG−d1 at NorthGRIP. The corresponding GICC05
age is a1. The age of the methane at the same EDC depth DC-d1 is younger than10
the age a1 with a difference of ∆age. At EDC, the depth corresponding to the10
Be
peak occurs during DO #8 in the gas phase. At EDML, the corresponding trapped gas
occurs during DO #9 due to the smaller ∆age. We synchronise this methane event
with its concomitant NorthGRIP isotope event, being found shallower than the10
Be
sub-peak at a depth NG-d2 and with a GICC05 age a2. Therefore, the age difference15
a1−a2 is an indirect measurement of the ∆age at the EDC depth DC-d1.
The overall uncertainty of this ∆age corresponds to the square root of the sum of the
uncertainties on:
1. the10
Be NorthGRIP-EDC synchronisation;
2. the isotope-methane NorthGRIP-EDC synchronisation;20
3. the GICC05 age difference a1−a2, that is to say the number of uncertain annual
layers between the NG-d1 and NG-d2 depths (which is much smaller than the un-
certainty on the absolute age at these depths). Consequently, our ∆age estimate
is directly dependent on the GICC05 age scale.
444

CPD
3, 435–467, 2007
Gas age-ice age
differences along the
EPICA cores
L. Loulergue et al.
Title Page
Abstract Introduction
Conclusions References
Tables Figures
◭ ◮
◭ ◮
Back Close
Full Screen / Esc
Printer-friendly Version
Interactive Discussion
EGU
EDC ∆age with this method is found to be 3408±240 yr and 3692±315 yr for both EDC10
Be sub-peaks (Table 1).
The same procedure is applied for EDML, adding the uncertainty due to the EDML-
EDC synchronisation through volcanic horizons. EDML ∆age is found to be 909±286 yr
and 892±364 yr (Table 1).5
In the following, these empirical constraints will be referred to as the EDC-∆age and
EDML-∆age constraints respectively.
3.2.2 The ∆depth method
The method is illustrated in Figs. 2 and 3. We start again by considering the EDC
ice depth DC-d1 of the10
Be sub-peak, and the corresponding NorthGRIP ice depth10
NG-d1. Assuming that CH4 and the Greenland isotopes change synchronously, the
methane variation corresponding to the NorthGRIP isotope variation at depth NG-d1 is
found in the EDC ice deeper than the10
Be peak, at the depth DC-d2. The gas age at
DC-d2 is identical to the ice age at DC−d1, and the depth difference DC-d2- DC-d1 is
an indirect measurement of ∆depth. With this method, uncertainties in the age scales15
are not relevant.
The uncertainty on the ∆depth evaluation corresponds to the square root of the sum
of the uncertainties on:
1. the10
Be NorthGRIP-EDC synchronisation;
2. the isotope-methane NorthGRIP-EDC synchronisation.20
∆depth for the two10
Be sub-peaks amounts to 53.5±4.2 m and 53.1±4.2 m (Table 1).
The same procedure is applied to EDML, adding the uncertainty on the EDML-EDC
synchronisation. ∆depth then amounts to 24.7±1.7 m and 25.1 m±1.7 m (Table 1).
In the following, these empirical constraints will be referred to as the EDC-∆depth
and EDML-∆depth constraints respectively.25
445

CPD
3, 435–467, 2007
Gas age-ice age
differences along the
EPICA cores
L. Loulergue et al.
Title Page
Abstract Introduction
Conclusions References
Tables Figures
◭ ◮
◭ ◮
Back Close
Full Screen / Esc
Printer-friendly Version
Interactive Discussion
EGU
4 Testing firn densification model scenarios
We use the Arnaud firn densification model (Arnaud et al., 2000) which considers two
densification processes: pure sliding of snow grains for density lower than ∼0.55, and
pure deformation of grains for density higher than ∼0.55. Diffusion and advection of
temperature in the firn are also considered, and lead to an average temperature at the5
close-off depth slightly higher than at the surface (Goujon et al., 2003).
In this section, we test different temperature and accumulation rate scenarios at
EDC and EDML (supplemental material http://www.clim-past-discuss.net/3/435/2007/
cpd-3-435-2007-supplement.zip) against the ∆age and ∆depth empirical constraints
described in section 2: EDC-EDML methane synchronisation, and ∆age and ∆depth10
at the location of the10
Be peak.
4.1 Scenario 1: EDC3 and EDML1 temperature and accumulation histories
With the EDC3 chronology (Parrenin et al., 2007), the surface temperature history is
deduced from the isotopic content of the ice without correction for source temperature
variations. The β coefficient in Eq. (2) has then been determined so that the resulting15
chronology agrees with the absolute age of the10
Be peak at 41 kyr BP. The inferred
value is 0.0157. The accumulation rate has been further slightly modified in order to
synchronize the EDC3 age scale onto GICC05 at several tie points (Parrenin et al.,
20071). For EDML, source temperature variations were not considered either and β
has been set to 0.015 (EPICA community members, 2006).20
The α coefficient in Eq. (1) representing the spatial slope of the present-day isotopic
thermometer is estimated empirically at EDC as 1/6.04‰/◦K from the present day-
surface measurements between Dumont d’Urville and Dome C (Lorius and Merlivat,
1977). For EDML, the value is estimated empirically as 0.82‰/◦C from the relationship
between δ18
O and surface temperature in Dronning Maud Land (EPICA community25
members, 2006).
Overall, the EDC3 and EDML1 climatic inputs to the densification model provide a
446
CPD
3, 435–467, 2007
Gas age-ice age
differences along the
EPICA cores
L. Loulergue et al.
Title Page
Abstract Introduction
Conclusions References
Tables Figures
◭ ◮
◭ ◮
Back Close
Full Screen / Esc
Printer-friendly Version
Interactive Discussion
EGU
poor agreement with the empirical constraints (Table 3 and Fig. 4). The EDML gas
time scale is always older than the EDC gas time scale (see Fig. 4), with an aver-
age difference of 850 yr. The difference ranges from 300 yr (Younger Dryas/ Holocene
transition) to 1150 yr (onset of DO #6). This implies that either the EDC ∆age is over-
estimated or the EDML one is underestimated. The discrepancy being smaller during5
the last deglaciation than during the last glacial period, the modelling error appears to
get worse during cold conditions (Fig. 4).
At the time of the two10
Be sub-peaks, the EDC (EDML) modelled ∆age amounts to
5050 yr and 5010 yr (1370 and 1320 yr), i.e. ∼40% (50%) larger than the empirically
derived values and well outside their confidence interval. The comparison is more10
favorable for the ∆depth constraints. The EDC (EDML) modelled estimates amounts
to 55.3 m and 55.0 m (22.9 and 22.9 m) and are only slightly larger (smaller) than the
empirical values, and within or at the limit of their confidence interval.
4.2 Scenario 2: EDC3 and EDML1 accumulation rate histories, reduced amplitude of
glacial-interglacial temperature change15
In scenario 1, the modelled ∆age at both EDML and EDC is too large during the10
Be
peak. One way to resolve this discrepancy is to reduce the amplitude of the glacial-
interglacial temperature change. Relatively warmer temperatures lead to a faster den-
sification process, a shallower close-off depth and a reduced ∆age. In scenario 2 we
keep the EDC3 and EDML1 accumulation rates unchanged (Sect. 3.1) and we reduce20
the glacial-interglacial temperature amplitude with a factor 1/α=7.13‰/K. Note that this
provides a better accordance between the measured and modelled borehole tempera-
ture.
This scenario generally gives a slightly better agreement than scenario 1 with the
empirical constraints derived in Sect. 2 (Table 3 and Fig. 4). The difference between the25
EDC and EDML gas age scales is slightly reduced, with an average of 660 yr. During
the10
Be sub-peaks ∆age at EDC (EDML) is 4820 yr and 4800 yr (1330 and 1280 yr),
around 35% (45%) higher than the empirical values. ∆depth at EDC (53.2 and 52.6 m)
447

CPD
3, 435–467, 2007
Gas age-ice age
differences along the
EPICA cores
L. Loulergue et al.
Title Page
Abstract Introduction
Conclusions References
Tables Figures
◭ ◮
◭ ◮
Back Close
Full Screen / Esc
Printer-friendly Version
Interactive Discussion
EGU
is now in excellent agreement with the empirical estimates. The agreement however
slightly decreases for EDML ∆depth (22.2 and 22.8 m).
4.3 Scenario 3: EDC3 and EDML1 accumulation rate histories, EDC temperature
corrected for source effects
The EDC3 temperature history is corrected for variations in the mean ocean isotopic5
composition, but not for source temperature variations. Vimeux et al. (2002) showed
at Vostok that taking into account the latter reduces the amplitude of glacial-interglacial
surface temperature change by up to 2◦C. In scenario 3, we apply such correction us-
ing the deuterium excess record (Stenni et al., 2003 and new data, B. Stenni personal
communication). In general, temperatures are warmer during the glacial period com-10
pared to scenario 1. The EDC accumulation rate history is kept identical to scenario 1,
as well as the EDML temperature and accumulation rate histories.
Overall, this scenario gives results very close to scenario 2 (Table 3 and Fig. 4).
The agreement between the EDC and EDML gas age scales is slightly improved, with
an average shift of 630 yr. During the10
Be sub-peaks, the EDC ∆age is 4820 yr and15
4810 yr, around 35% higher than the empirical values. The EDC ∆depth (54.1 m and
53.5 m) is in excellent agreement with the empirical estimates.
4.4 Scenario 4: EDC3 and EDML1 temperature histories, reduced amplitude of
glacial-interglacial accumulation rate changes
Another way to reduce ∆age is to increase the past accumulation rate. In scenario 4,20
we choose β to be 0.0094 for EDC and 0.0120 for EDML, the temperature histories
remaining identical to scenario 1.
Overall this scenario provides an excellent agreement between modelled and em-
pirical ∆ages, with an average shift of only –30 yr (Table 3, Fig. 4, 5a). There are two
notable exceptions : during the last deglaciation, the EDML gas chronology is older25
than the EDC one by a few centuries, and vice versa during DO #9.
448

CPD
3, 435–467, 2007
Gas age-ice age
differences along the
EPICA cores
L. Loulergue et al.
Title Page
Abstract Introduction
Conclusions References
Tables Figures
◭ ◮
◭ ◮
Back Close
Full Screen / Esc
Printer-friendly Version
Interactive Discussion
EGU
During the10
Be sub-peaks, EDC (EDML) ∆age is 3970 yr and 4020 yr (1270 and
1220 yr), around 10–15% (35%) higher than the empirical values but almost within
their confidence intervals.
∆depth at EDC (44.5 m and 44.3 m) and EDML (21.7 m and 21.7 m) are now signifi-
cantly smaller than the empirical estimates. Indeed, ∆depth is equal to the product of5
the close-off depth in ice equivalent (CODIE) by the thinning function. In this scenario,
we increased the glacial accumulation rate while keeping the same ice chronology, and
thus implicitly decreased this thinning function, thus leading to smaller ∆depths.
In Fig. 5b, the EPICA gas chronologies are compared to the NorthGRIP one. The
Antarctic ice age scales being fitted to NorthGRIP only during the10
Be peak. Apart10
from this time period, a disagreement between the GICC05 age scale and the EDC
or EDML gas age scale could result either from a wrong Antarctica-Greenland ice
synchronisation, or/and from an error in the ∆age estimates at the Antarctic sites. As
expected, EDC and NorthGRIP chronologies agree well at the time of DO #8 (EDC
gas trapped at the depth of the10
Be peak) and in a lesser margin between EDML and15
NorthGRIP at the time of DO #9.
5 Discussion
The comparison between our empirical constraints on EDC and EDML ∆age and
∆depth and different firn densification modelling scenarios indicate that the official
EDC3 and EDML1 ice chronology, temperature and accumulation rate histories are20
clearly inconsistent with the EDML-EDC methane synchronization constraint. Either
the EDC glacial ∆age is greatly overestimated or the EDML glacial ∆age is greatly
underestimated. The shift between the two gas chronologies roughly resembles the
isotopic signal (being inversely correlated, Fig. 4), in contrast with Vostok and Byrd
(Bender et al., 2006), where it covers a large range between +1500 yr and –2000 yr.25
The origin of the inconsistency between model outputs and the observation thus prob-
ably lies either in the parameterization of the climatic input to the model based on
449

CPD
3, 435–467, 2007
Gas age-ice age
differences along the
EPICA cores
L. Loulergue et al.
Title Page
Abstract Introduction
Conclusions References
Tables Figures
◭ ◮
◭ ◮
Back Close
Full Screen / Esc
Printer-friendly Version
Interactive Discussion
EGU
water isotopes or in the physical link in the model between climate conditions and the
densification process, under colder and drier conditions than today.
A test of different temperature scenarios (scenarios 2 and 3) only removes a fraction
of the disagreement with empirical constraints. These scenarios reduce the glacial-
interglacial amplitude of temperature change by about 15%, which seems to be a max-5
imum bound according to different evidences presently available for the East Antarc-
tic plateau (Jouzel et al., 2003; Blunier et al., 2004). Salamatin et al. (1998) and
Tsyganova and Salamatin (2004) suggest on the other hand a large underestimate of
the temperature change, which would make even worse the disagreement between
modelled and observed ∆age and ∆depth. To our knowledge, there is no other study10
proposing a smaller amplitude of glacial-interglacial temperature change than the one
deduced from the standard isotope/temperature relationship in Antarctica. In summary,
only a small fraction of the disagreement can thus originate from the temperature sce-
nario.
Using larger glacial accumulation rates at both EDC and EMDL (scenario 4) than15
those classically deduced from water isotopes, we are able to get a much better agree-
ment between firn densification model outputs and ∆age empirical constraints. But
at EDC, it represents an average accumulation rate of 63% of the present-day value
during the last glacial maximum, corresponding to an increase of more than 30% with
respect to the EDC3 official scenario. However, changing the accumulation rate sce-20
nario implies a modification of the ice chronology. The EDC3 chronology is the product
of the initial annual layer thickness (the initial accumulation rate) and the thinning func-
tion (evaluated with a mechanical ice-flow model, Parrenin et al., 20071). Larger glacial
accumulation rates (scenario 4) associated with the EDC3 thinning function leads to a
younger chronology during the last glacial part. This is inconsistent with the fact that25
the EDC3 chronology is constrained within ∼1 kyr at the location of the10
Be peak and
that it is synchronized onto the NorthGRIP annual layer-counted GICC05 age scale
(Andersen et al., 2006; Svensson et al., 2006).
Increased glacial accumulation rates as in scenario 4 are thus physically compatible
450

CPD
3, 435–467, 2007
Gas age-ice age
differences along the
EPICA cores
L. Loulergue et al.
Title Page
Abstract Introduction
Conclusions References
Tables Figures
◭ ◮
◭ ◮
Back Close
Full Screen / Esc
Printer-friendly Version
Interactive Discussion
EGU
with the ice core chronology only if they are compensated by a proportional decrease
in the thinning function. However, the latter varies between 1 at the surface and 0.75 at
850 m of depth (∼50 kyr BP) and it is considered very well constrained under ice-flow
conditions for the upper quarter of an ice dome (Parrenin et al., 20071). A correction of
about 30% of the thinning function in this EDC depth range thus seems unrealistic.5
It could be argued that the EDML-EDC methane disagreement results from an un-
derestimated ∆age at EDML. However, EDML ∆age during the last glacial amounts to
1000–1500 yr, and an underestimate of 800 yr (50 to 80%) is unrealistic. We can thus
conclude that the firn densification model overestimates ∆age at EDC during the last
glacial period.10
Because of the larger ∆age at EDC, we can not assess the accuracy of the EDML
firn modelling for the EDC-EDML CH4 synchronisation. Only the10
Be peak shows that
during this particular time period, EDML ∆age is overestimated by ∼400 yr. This is still
within the uncertainties estimated in the EPICA Community Members (2006) paper.
Such an inconsistency of EDC modelled gas ages has already been suggested by15
comparing them to the Byrd ice core constraints (Schwander et al., 2001), although
the uncertainty on the EDC ∆age was evaluated at ±10% by Schwander et al. (2001).
Consequently, we suggest that an important phenomenon is missing in the firn densi-
fication model applied to the very cold and low accumulation conditions of the glacial
Antarctic plateau, for which no present-day analogue exists so far. This leads to an20
overestimate of the close off depth, as already suggested by the δ15
N data at Vostok
(Sowers, 1992). The model has been tested over a large range of accumulation rate
and temperature conditions and has proved to be realistic (Arnaud et al., 2000; Goujon
et al., 2003). But conditions with –65◦C mean annual temperature and ∼1 cm H2O/yr
accumulation rate apparently generate different snow surface structures and/or densi-25
fication processes (and thus density profiles) compared with present-day conditions on
the East Antarctic plateau, which are not yet represented in the physics of the model.
Apparently by chance, no such systematic bias between model and empirical ∆age
constraints was detected, using the methane synchronization, between the Vostok (low
451

CPD
3, 435–467, 2007
Gas age-ice age
differences along the
EPICA cores
L. Loulergue et al.
Title Page
Abstract Introduction
Conclusions References
Tables Figures
◭ ◮
◭ ◮
Back Close
Full Screen / Esc
Printer-friendly Version
Interactive Discussion
EGU
accumulation rate) and Byrd ice cores (high accumulation rate) (Blunier et al., 2004;
Bender et al. 2006), although gas age shifts of up to 1000 yr were observed for some
tie points. This could result from the different flow regime between Vostok, situated on
a flow line, and EDC situated on a dome. At EDC, if the dome location remained stable,
the total thinning is approximately linearly related to the depth of ice layers (Parrenin et5
al., 20071). At Vostok, the thinning of ice is related to the thickness of the ice column
upstream from the drilling site, where the ice originates from. As shown by Parrenin et
al. (2004), differences of up to 20% in the thinning function at Vostok can be obtained
depending on the scenario on the ice flow. This makes Vostok a less suitable site than
EDC to constraint ∆age and ∆depth based on the ice and gas chronological tie points.10
The EDC ∆depth constraint provides another test of the modelled glacial Close Off
Depth in Ice Equivalent (CODIE corresponding to the firn-ice transition). At the depth
of the10
Be peak, the latter is roughly consistent with the empirical constraint (larger by
only 3 to 4%) within its confidence interval. ∆depth is indeed the product of the CODIE
by the thinning function. Assuming the thinning function has been correctly estimated,15
the modelled CODIE thus seems confirmed for this particular time period. Although the
EDC ∆depth constraint is not very accurate (uncertainty of ∼8%), this suggests that
the mismatch between modelled and observed EDC ∆ages results from the density
profile between the surface and the close-off depth, more than from the close-off depth
itself.20
Our findings have potentially large consequences on one of the key questions re-
garding climate and carbon cycle dynamics: the relative timing between Antarctic cli-
mate and CO2 mixing ratio changes. Current estimates of the time relationship be-
tween the two signals at the start of the last deglaciation, based on detailed EDC
measurements, point to a CO2 lag of 800±600 yr compared to the δD increase (Mon-25
nin et al., 2001). This conclusion based on a ∆age calculation similar to scenario 1
may have to be revisited.
The correction factor on EDC ∆age that we have to apply in order to bring modelled
and observed ∆age into agreement at the time of the10
Be peak implies a smaller
452

CPD
3, 435–467, 2007
Gas age-ice age
differences along the
EPICA cores
L. Loulergue et al.
Title Page
Abstract Introduction
Conclusions References
Tables Figures
◭ ◮
◭ ◮
Back Close
Full Screen / Esc
Printer-friendly Version
Interactive Discussion
EGU
∆age. If this correction is valid throughout the last glaciation the CO2 deglacial increase
may have started simultaneously or even with a lead of the CO2 rise over Antarctic
temperature. The consequences of such a suggestion are far beyond the scope of this
paper and should certainly wait for confirmation through other time markers in the ice
allowing a direct chronological fit between EDC and the Greenland ice. Furthermore5
CO2 measurements on the EDML core with a much smaller ∆age will allow estimating
the timing of CO2 and temperature rise with much more confidence. However, with the
information at hand through our study, it is likely that the EDC ∆age and therefore the
CO2 lag on East Antarctic temperature has also been overestimated around 18 kyr BP.
6 Conclusions10
An improved time resolution of CH4 measurements on the EDC and EDML ice cores,
notably over DO #9 and 10, allowed us to evaluate the compatibility of the EDC and
EDML gas chronologies. The combination of EDC-EDML gas synchronisation through
CH4 and ice synchronisation through volcanic horizons provides a constraint on the
gas age-ice age difference at both sites. At the location of the 41 kyr10
Be event, the15
ice synchronisation of EDC with NorthGRIP allows us to empirically evaluate this ∆age
(as well as the ∆depth) for EDC and EDML.
The EDC ∆age produced by the firn densification model can match our new empirical
constraints only through larger accumulation rate at EDC and EDML during the last
glacial period, compared with current estimates. However, it requires modification of20
the EDC chronology, which would change either the age of the 41 kyr10
Be event, or the
modelled EDC thinning function, both of them being robust estimates. This suggests
a systematic overestimate of the simulated EDC ∆age during glacial periods. As a
consequence, the suggested lag of CO2 on Antarctic temperature at the start of the
last deglaciation can be questioned and could well become a lead.25
Independent estimates of paleo-accumulation rates via chemical tracers would re-
move the current doubt on the accumulation rate scenario. In addition, the precision
453

CPD
3, 435–467, 2007
Gas age-ice age
differences along the
EPICA cores
L. Loulergue et al.
Title Page
Abstract Introduction
Conclusions References
Tables Figures
◭ ◮
◭ ◮
Back Close
Full Screen / Esc
Printer-friendly Version
Interactive Discussion
EGU
of our method could be improved through direct synchronisation of a future detailed
CH4 record from NorthGRIP with its Antarctic counterparts. Finally, a similar study of
the Japanese Dome Fuji ice core, also situated on a dome and characterized by a
slightly larger accumulation rate relative to EDC, would help to better understand the
physics behind the densification process on the East Antarctic plateau during glacial5
conditions.
Acknowledgements. This work is a contribution to the European Project for Ice Coring in
Antarctica (EPICA), a joint European Science Foundation/European Commission scientific pro-
gramme, funded by the EU (EPICA-MIS) and by national contributions from Belgium, Denmark,
France, Germany, Italy, the Netherlands, Norway, Sweden, Switzerland and the United King-10
dom. The main logistic support was provided by IPEV and PNRA (at Dome C) and AWI (at
Dronning Maud Land).
References
Andersen, K. K., Svensson, A., Johnsen, S. J., Rasmussen, S. O., Bigler, M., Rothlisberger, R.,
Ruth, U., Siggaard-Andersen, M.-L., Steffensen, J. P., Dahl-Jensen, D., Vinther, B. M., and15
Clausen, H. B.: The Greenland Ice Core Chronology 2005, 15–42 ka. Part 1: constructing
the time scale, Quat. Sci. Rev., in press, 2007.
Anklin, M., Barnola, J.-M., Schwander, J., Stauffer, B., and Raynaud, D.: Processes affecting
the CO2 concentration measured in Greenland ice, Tellus Ser. B, (47), 461–470, 1995.
Arnaud, L., Barnola, J.-M., and Duval, P.: Physical modeling of the densification of snow/firn20
and ice in the upper part of polar ice sheets. Physics of Ice Core Records. T. Hondoh. Sap-
poro, Hokkaido University Press, 285–305, 2000.
Bender, M. L., Floch, G., Chappellaz, J., Suwa, M., Barnola, J.-M., Blunier, T., Dreyfus, G.,
Jouzel, J., and Parrenin, F.: Gas age-ice age differences and the chronology of the Vostok
ice core, 0–100 ka, J. Geophys. Res., 111, D21115, doi:10.1029/2005JD006488, 2006.25
Bender, M. L., Sowers, T., Dickson, M.-L., Orchardo, J., Grootes, P., Mayewski, P. A., and
Meese, D. A.: Climate correlations between Greenland and Antarctica during the past
100 000 years, Nature, 372, 663–666, 1994.
454

CPD
3, 435–467, 2007
Gas age-ice age
differences along the
EPICA cores
L. Loulergue et al.
Title Page
Abstract Introduction
Conclusions References
Tables Figures
◭ ◮
◭ ◮
Back Close
Full Screen / Esc
Printer-friendly Version
Interactive Discussion
EGU
Bintanja, R., Van De Wal, R. S. W., and Oerlemans, J.: Modelled atmospheric temperatures
and global sea levels over the past million years, Nature, 437, 125–128, 2005.
Blunier, T., Schwander, J., Chappellaz, J., Parrenin, F., and Barnola, J.-M.: What was the
surface temperature in central Antarctica during the last glacial maximum?, Earth Planet.
Sci. Lett., 218, 379–388, 2004.5
Blunier, T. and Brook, E. J.: Timing of Millennial-Scale climate change in Antarctica and Green-
land during the last glacial period. Science, 291, 109–111, 2001.
Blunier, T., Chappellaz, J., Schwander, J., Dallenbach, A., Stauffer, B., Stocker, T. F., Raynaud,
D., Jouzel, J., Clausens, H. B., Hammer, C. U. and Johnsen, S. J.: Asynchrony of Antarctic
and Greenland climate change during the last glacial period. Nature, 394, 739–743, 1998.10
Blunier, T., Schwander, J., Stauffer, B., Stocker, T. F., Dallenbach, A., Indermuhle, A. and
Tschumi, J.: Timing of the Antarctic Cold Reversal and the atmospheric CO2 increase with
respect to the Younger Dryas event, Geophys. Res. Lett., 24, 2683–2686, 1997.
Blunier, T., Spahni, R., Barnola, J. M., Loulergue, L., and Schwander, J.: Synchronization of ice
core records via atmospheric gases, Clim. Past Discuss., 3, 365–381, 2007,15
http://www.clim-past-discuss.net/3/365/2007/.
Chappellaz, J., Blunier, T., Kints, S., Dallenbach, A., Barnola, J.-M., Schwander, J., Raynaud, D.
and Stauffer, B.: Changes in the atmospheric CH4 gradient between Greenland and Antarc-
tica during the Holocene, J. Geophys. Res., 102(D13), 15 987–15 997, 1997.
Chappellaz, J., Blunier, T., Raynaud, D., Barnola, J.-M., Schwander, J., and Stauffer, B.: Syn-20
chronous changes in atmospheric CH4 and Greenland climate between 40 and 8 kyr BP.
Nature, 366, 443–445, 1993.
Eisen, O., Rack, W., Nixdorf, U., and Whilhelms, F.: Characteristics of accumulation around the
EPICA deep-drilling site in Dronning Maud Land, Antarctica, Ann. Glaciol., 41, 41–46, 2005.
Epica, C. M.: Eight glacial cycles from an Antarctic ice core. Nature, 429, 623–628, 2004.25
Epica, C. M.: One-to-one interhemispheric coupling of polar climate variability during the last
glacial, Nature, 444, doi:10.1038/nature05301, 2006.
Goujon, C., Barnola, J.-M., and Ritz, C.: Modeling the densification of polar firn including heat
diffusion: Application to close-off characteristics and gas isotopic fractionation for Antarctica
and Greenland sites, J. Geophys. Res., 108, 4792, doi:10.1029/2002JD003319, 2003.30
Guillou, H., Singer, B. S., Laj, C., Kissel, C., Scaillet, S., and Jicha, B. R.: On the age of the
Laschamp geomagnetic excursion, Earth Planet. Sci. Lett., 227, 331–343, 2004.
Jouzel, J., Vimeux, F., Caillon, N., Delaygue, G., Hoffmann, G., Masson-Delmotte, V., and
455

CPD
3, 435–467, 2007
Gas age-ice age
differences along the
EPICA cores
L. Loulergue et al.
Title Page
Abstract Introduction
Conclusions References
Tables Figures
◭ ◮
◭ ◮
Back Close
Full Screen / Esc
Printer-friendly Version
Interactive Discussion
EGU
Parrenin, F.: Magnitude of isotope/temperature scaling for interpretation of central Antarctic
ice cores, J. Geophys. Res., 108(D12), 4361, doi:10.1029/2002JD002677, 2003.
Jouzel, J., Alley, R. B., Cuffey, K. M., Dansgaard, W., Grootes, P., Hoffmann, G., Johnsen, S. J.,
Koster, R. D., Peel, D., Shuman, C. A., Stievenard, M., Stuiver, M., and White, J.: Validity of
the temperature reconstruction from water isotopes in ice cores, J. Geophys. Res., 102(C12),5
26 471–26 487, 1997.
Lorius, C. and Merlivat, L.: Distribution of mean surface stable isotope values in east Antarctica.
Observed changes with depth in a coastal area. In Isotopes and impurities in snow and ice.
proceedings of the grenoble symposium aug./sep. 1975, volume 118 of IAHS. Publication.
IAHS, Vienna, 1977.10
Mazaud, A., Laj, C., and Bender, M. L.: A geomagnetic chronology for antarctic ice accumula-
tion, Geophys. Res. Lett., 21(5), 337–340, 1994.
Monnin, E., Indermuhle, A., Dallenbach, A., Fluckiger, J., Stauffer, B., Stocker, T. F., Raynaud,
D., and Barnola, J.-M.: Atmospheric CO2 concentrations over the last glacial termination,
Science, 291, 112–114, 2001.15
North Greenland, Community Members: High resolution record of Northern Hemisphere cli-
mate extending into the last interglacial period. Nature, 2805, 1–5, 2004.
Parrenin, F., Jouzel, J., Waelbroek, C., Ritz, C., and Barnola, J.-M.: Dating the Vostok ice core
by an inverse method, J. Geophys. Res., 106(D23), 31 837–31 851, 2001.
Parrenin, F., Remy, F., Ritz, C., Siegert, M. J., and Jouzel, J.: New modeling of the Vostok ice20
flow line and implication for the glaciological chronology of the Vostok ice core, J. Geophys.
Res., 109, D20102, doi:10.1029/2004JD004561, 2004.
Parrenin, F., Dreyfus, G., Durand, G., Fujita, S., Gagliardini, O., Gillet, F., Jouzel, J., Kawa-
mura, K., Lhomme, N., Masson-Delmotte, V., Ritz, C., Schwander, J., Shoji, H., Uemura, R.,
Watanabe, M., Wolff, E., and Yoshida, N.: Ice flow modelling at EPICA Dome C and Dome25
Fuji, East Antarctica, Clim. Past Discuss., 3, 19–61, 2007,
http://www.clim-past-discuss.net/3/19/2007/.
Pimienta, P.: Etude du comportement mecanique des glaces polycristallines aux faibles con-
traintes; applications aux glaces des calottes polaires. Grenoble, Universite Joseph Fourier,
1987.30
Raisbeck, G. M., Yiou, F., and Jouzel, J.: Cosmogenic 10Be as a high-resolution correlation
tool for climate records. Geochimica and cosmochimica acta, Acta 66, A623, 2002.
Rasmussen, S. O., Andersen, K. K., Svensson, A., Steffensen, J. P., Vinther, M., Clausens,
456

CPD
3, 435–467, 2007
Gas age-ice age
differences along the
EPICA cores
L. Loulergue et al.
Title Page
Abstract Introduction
Conclusions References
Tables Figures
◭ ◮
◭ ◮
Back Close
Full Screen / Esc
Printer-friendly Version
Interactive Discussion
EGU
H. B., Siggard-Andersen, M. L., Johnsen, S. J., Larsen, L. B., Bigler, M., Rothlisberger,
R., Fisher, H., Goto-Azuma, K., Hansson, M., and Ruth, U.: A new Greenland
ice core chronology for the last glacial termination, J. Geophys. Res., 111, D06102,
doi:10.1029/2005JD006079, 2006.
Ruth, U., Barnola, J.-M., Beer, J., Bigler, M., Blunier, T., Castellano, E., Fischer, H., Fundel, F.,5
Huybrechts, P., Kaufmann, P., Kipfstuhl, J., Lambrecht, A., Morganti, A., Oerter, H., Parrenin,
F., Rybak, O., Severi, M., Udisti, R., Wilhelms, F., and Wolff, E.: EDML1: A chronology for the
EDML ice core, Antarctica, over the last 150 000 years, Clim. Past Discuss., in press, 2007.
Salamatin, A. N., Lipenkov, V. Y., Barkov, N. I., Jouzel, J., Petit, J.-R., and Raynaud, D. Ice core
age dating and paleothermometer calibration based on isotope and temperature profiles from10
deep boreholes at Vostok station (east Antarctica), J. Geophys. Res., 103(D8), 8963–8977,
1998.
Schwander, J., Jouzel, J., Hammer, C. U., Petit, J.-R., Udisti, R., and Wolff, E.: A tentative
chronology for the EPICA Dome Concordia ice core, Geophys. Res. Lett., 28(22), 4243–
4246, 2001.15
Schwander, J., Sowers, T., Barnola, J.-M., Blunier, T., Fuchs, A., and Malaize, B.: Age scale of
the air in the summit ice: Implication for glacial-interglacial temperature change. Journal of
Geophysical Research, 102(D16), 19 483–19 493, 1997.
Severi, M., Castellano, E., Morganti, A., Udisti, R., Ruth, U., Fischer, H., Huybrechts, P., Wolff,
E., Parrenin, F., Kaufmann, P., Lambert, F., and Steffensen, J. P.: Synchronisation of the20
EDML1 and EDC3 timescales for the last 52 kyr by volcanic signatures matching, Clim. Past
Discuss., in press, 2007.
Severinghaus, J. P. and Brook, E. J.: Abrupt climate change at the end of the last glacial period
inferred from trapped air in polar ice, Science, 286, 930–933, 1999.
Severinghaus, J. P., Sowers, T., Brook, E. J., Alley, R. B., and Bender, M. L.: Timing of abrupt25
climate change at the end of the Younger Dryas interval from thermally fractionated gases in
polar ice. Nature, 391, 141–144, 1998.
Siegenthaler, U., Stocker, T. F., Monnin, E., Luthi, D., Schwander, J., Stauffer, B., Raynaud, D.,
Barnola, J.-M., Fischer, H., Masson-Delmotte, V., and Jouzel, J.: Stable carbon cycle-climate
relationship during the late pleistocene, Science, 310, 1313–1317, 2005.30
Sowers, T.: N2O record spanning the penultimate deglaciation from the Vostok ice core, J.
Geophys. Res., 106(D23), 31 903–31 914, 2001.
Sowers, T., Bender, M. L., Labeyrie, L., Martinson, D., Jouzel, J., Raynaud, D., Pichon, J. J.,
457

CPD
3, 435–467, 2007
Gas age-ice age
differences along the
EPICA cores
L. Loulergue et al.
Title Page
Abstract Introduction
Conclusions References
Tables Figures
◭ ◮
◭ ◮
Back Close
Full Screen / Esc
Printer-friendly Version
Interactive Discussion
EGU
and Korotkevich, Y. S.: A 135 000 year Vostok-SPECMAP common temporal framework,
Paleoceanography, 8(6), 737–766, 1993.
Sowers, T., Bender, M., Raynaud, D., and Korotkevich, Y. L.: The δ15
N of O2 in air trapped in
polar ice: a tracer of gas transport in the firn and a possible constraint on ice age-gas age
differences, J. Geophys. Res., 97, 15, 15 683–15 697, 1992.5
Spahni, R., Chappellaz, J., Stocker, T. F., Loulergue, L., Hausammann, G., Kawamura, K.,
Fluckiger, J., Schwander, J., Raynaud, D., Masson-Delmotte, V., and Jouzel, J.: Variations
of atmospheric methane and nitrous oxide during the last 650 000 years from Antarctic ice
cores, Science, 310, 1317–1321, 2005.
Stauffer, B., Fluckiger, J., Monnin, E., Nakazawa, T., and Aoki, S.: Discussion of the reliability10
of CO2, CH4 and N2O records from polar ice cores. Memoirs of National Institute of Polar
Research, Special Issue (Japan), Global Scale Climate and Environment Study trough Polar
Deep Ice Cores, 57, 139–152, 2003.
Stauffer, B., Fluckiger, J., Monnin, E., Schwander, J., Barnola, J.-M., and Chappellaz, J.: Atmo-
spheric CO2, CH4 and N2O records over the past 60 000 years based on the comparison of15
different polar ice cores, Ann. Glaciol., 35, 202–208, 2002.
Steig, E. J. and Alley, R. B.: Phase relationship between Antarctic and Greenland climate
records, Ann. Glaciol., 35, 451–456, 2002.
Stenni, B., Jouzel, J., Masson-Delmotte, V., Rothlisberger, R., Castellano, E., Cattani, O.,
Falourd, S., Johnsen, S. J., Longinelli, A., Sachs, J. P., Selmo, E., Souchez, R., Steffensen,20
J. P., and Udisti, R.: A late-glacial high resolution site and source temperature record derived
from the EPICA Dome C isotope records (East Antarctica), Earth Planet. Sci. Lett., 217,
183–195, 2003.
Stocker, T. F. and Johnsen, S. J.: A minimum thermodynamic model for the bipolar seesaw, Pa-
leoceanography, 18, 1087, doi:10.1029/2003PA000920, doi:10.1029/2003PA000920, 2003.25
Svensson, A., Andersen, K. K., Bigler, M., Clausen, H. B., Dahl-Jensen, D., Davies, S., M.,
Johnsen, S. J., Muscheler, R., Rasmussen, S. O., Rothlisberger, R., Steffensen, J. P., and
Vinther, B. M.: The Greenland Ice Core Chronology 2005: 15–42 ka. Part 2: comparison to
others records, Quaternary Sci. Rev., in press, 2007.
Tsyganova, E. A. and Salamatin, A. N.: Non-stationary temperature field simulations along30
the ice flow line ”Ridge B - Vostok Station”, East Antarctica. Materialy Glyatsiologicheskih
Issledovaniy, Data of Glaciological Studies, 97, 57–70, 2004.
Vimeux, F., Cuffey, K. M., and Jouzel, J.: New insights into Southern Hemisphere temperature
458

CPD
3, 435–467, 2007
Gas age-ice age
differences along the
EPICA cores
L. Loulergue et al.
Title Page
Abstract Introduction
Conclusions References
Tables Figures
◭ ◮
◭ ◮
Back Close
Full Screen / Esc
Printer-friendly Version
Interactive Discussion
EGU
changes from Vostok ice cores using deuterium excess correction, Earth Planet. Sci. Lett,
203, 829–843, 2002.
Vinther, M., Clausens, H. B., Johnsen, S. J., Rasmussen, S. O., Andersen, K. K., Buchardt,
S. L., Dahl-Jensen, D., Seierstad, I. K., Siggard-Andersen, M. L., Steffensen, J. P., Svens-
son, A., Olsen, J., and Heinemeier, J.: A synchronized dating of three Greeland ice cores5
throughout the Holocene. Geophys. Res. Lett., D13102, doi:10.1029/2005JD006921, 2006.
Yiou, F., Raisbeck, G. M., Baumgartner, S., Beer, J., Hammer, C., Johnsen, S. J., Jouzel, J.,
Kubik, P. W., Lestringuez, J., Stievenard, M., Suter, M., and Yiou, P.: Beryllium 10 in the
Greenland Ice Core Project ice core at Summit, Greenland, J. Geophys. Res., 102(C12),
26 783–26 794, 1997.10
459

CPD
3, 435–467, 2007
Gas age-ice age
differences along the
EPICA cores
L. Loulergue et al.
Title Page
Abstract Introduction
Conclusions References
Tables Figures
◭ ◮
◭ ◮
Back Close
Full Screen / Esc
Printer-friendly Version
Interactive Discussion
EGU
Table 1. ∆age and ∆depth estimates at EDC and EDML at the location of the10
Be sub-
peaks. Definitions of depths d1 and d2, and ages a1 and a2 at NorthGRIP are given in the
legend of Fig. 2. For EDML-d1, the error bar represents the uncertainty in the EDC-EDML
synchronisation. Ages a1 and a2 are on the GICC05 chronology, and the error bar on a1−a2 is
estimated as the number of uncertain layers at NorthGRIP in this time interval.
(EDC or EDML)-d1 (EDC or EDML)-d2 GRIP-d1 (m) NGRIP-d1 (m) NGRIP-d2 (m) a1 (yr BP) a2 (yr BP) a1 − a2 uncer. (yr) ∆age (yr) ∆depth (m)
EDCPeak 1 735.5±1.1 788.9±2 2231.9±1.1 2110.1±1.1 2045.9±3 40820 37410 190 3410±240 53.5±4.2
Peak 2 744.8±1.1 797.9±2 2246.2±1.1 2127.5±1.1 2063.3±6 41700 38010 210 3690±320 53.1±4.2
EDMLPeak 1 1368.4±0.3 1393.1±1.2 2231.9±1.1 2110.1±1.1 2094.8±7 40820 39910 45 910±290 24.7±1.7
Peak 2 1383.3±0.4 1408.5±0.5 2246.2±1.1 2127.5±1.1 2109.8±7 41700 40810 35 890±360 25.1±1.3
460

CPD
3, 435–467, 2007
Gas age-ice age
differences along the
EPICA cores
L. Loulergue et al.
Title Page
Abstract Introduction
Conclusions References
Tables Figures
◭ ◮
◭ ◮
Back Close
Full Screen / Esc
Printer-friendly Version
Interactive Discussion
EGU
Table 2. Depth of the methane tie points for the EDML-EDC gas synchronisation. Tie points
are located at the middle of each sharp transition. The specified uncertainty (2σ) on the match
has been determined as a function of depth, and then translated to ages using the EDC3 and
EDML1 chronologies.
Events EDML depth (m) CH4 (ppbv) EDC depth (m) CH4 (ppbv) Uncertainties on the
synchronisation
EDML-EDC (yrs)
1st transition (PB YD) 717.6 583.6 418.2 583.0 124.6
2nd transiton (YD BO) 766.4 556.3 442.7 552.2 172.7
3th transition (BO LGM) 830.2 532.3 476.1 532.6 122.3
DO2 onset 1032.9 369.7 579.9 373.9 98.4
DO2 end 1072.9 375.7 599.9 380.,9 321.3
DO3 onset 1148.0 405.0 635.4 404.0 141.1
DO3 end 1155.1 390.9 639.1 401.0 127.3
DO4 onset 1162.7 396.7 645.9 411.0 170.1
DO4 end 1174.2 405.7 651.9 403.7 56.7
DO5 onset 1224.0 434.5 681.6 429.8 196.7
DO5 en 1233.7 437.7 688.1 438.4 199.7
DO6 onset 1248.6 454.3 697.5 447.5 343.2
DO6 end 1261.1 454.5 702.1 450.7 170.,5
DO7 onset 1272.9 476.8 712.5 473.1 268.0
DO7end 1286,4 471.7 719.,7 472.2 98.0
DO8 onset 1308.5 484.9 732.0 488.4 146.4
DO8 end 1338.6 484.3 751.3 490.7 271.0
DO9 peak 1374.6 424.5 774.7 446.7 117.6
DO10 onset 1391.4 442.9 784.1 443.4 183.6
DO10 end 1404.6 440.5 790.6 439.8 183.6
DO11 onset 1416.0 438.1 801.5 456.9 75.4
DO11 end 1435.8 447.1 810.1 445.2 223.0
DO12 onset 1452.9 448.9 820.4 453.5 223.0
DO12 end 1491.3 458.5 848.1 465.9 330.0
461

CPD
3, 435–467, 2007
Gas age-ice age
differences along the
EPICA cores
L. Loulergue et al.
Title Page
Abstract Introduction
Conclusions References
Tables Figures
◭ ◮
◭ ◮
Back Close
Full Screen / Esc
Printer-friendly Version
Interactive Discussion
EGU
Table 3. Comparison between the outputs of firn densification modelling scenarios and empir-
ical constraints as derived in Sect. 3. Cf Sect. 4 for a description of the scenarios.
Scenarios Scenario 1 Scenario 2 Scenario 3 Scenario 4 Empirical values
Drilling sites EDC EDML EDC EDML EDC EDML EDC EDML EDC EDML
∆age for both sub-peaks [yr] 5050 1370 4820 1330 4820 1370 3970 1270 3408±240 909±286
5010 1320 4800 1280 4810 1320 4020 1220 3692±315 892±364
Differences between modelled
and empirical ∆age [yr]
1650 460 1410 420 1410 460 560 360
1320 430 1110 390 1110 430 330 330
∆depth for both sub-peaks [m] 55.3 22.9 53.2 22.2 54.1 22.9 44.5 21.2 53.5±4.2 24.7±1.7
55.0 22.9 52.6 22.8 53.5 22.9 44.3 21.7 53.1±4.2 25.1±1.3
Differences between modelled
and empirical ∆depth [m]
1.8 1.8 0.4 2.6 0.5 1.8 9.0 3.6
1.9 2.3 0.5 2.4 0.4 2.3 8.8 3.4
Mean differences between two
chronologies (EDML-EDC) [m]
850 660 630 30
462

CPD
3, 435–467, 2007
Gas age-ice age
differences along the
EPICA cores
L. Loulergue et al.
Title Page
Abstract Introduction
Conclusions References
Tables Figures
◭ ◮
◭ ◮
Back Close
Full Screen / Esc
Printer-friendly Version
Interactive Discussion
EGU
0 10000 20000 30000 40000 50000Gas chronology (yr BP)
300
400
500
600
700
800
CH
4 c
on
ce
ntr
atio
n (
pp
bv)
EDC CH4
Bern data
Grenoble data
New measurements on DO8-11
Tie points with error bars
EDML CH4
300
400
500
600
700
800
CH
4 c
on
ce
ntr
atio
n (
pp
bv)
Fig. 1. Methane concentrations at EDML (in red) and EDC (in black) during the last 55 kyr
BP. The EDC methane record consists of results published by Spahni et al. (2005) (Bern data,
blue cross), new data doubling the time resolution (LGGE data, red dots) and additional new
data specifically improving the time resolution between the DO #8 and #11 events (LGGE data,
brown stars). The EDML methane data, already published in EPICA Community Members
(2006), have been measured at LGGE and Bern. Black stars and their error bars correspond
to the CH4 tie points. Gas ages have been computed with the Goujon/Arnaud model (Goujon
et al., 2003) according to scenario 1.
463

CPD
3, 435–467, 2007
Gas age-ice age
differences along the
EPICA cores
L. Loulergue et al.
Title Page
Abstract Introduction
Conclusions References
Tables Figures
◭ ◮
◭ ◮
Back Close
Full Screen / Esc
Printer-friendly Version
Interactive Discussion
EGU
∆age?
Ice
Ga
s
EDCEDC NGRIPNGRIP
Ice
∆age
= a1-a2
NGRIPNGRIPEDCEDC
Ice
Ice
Gas
∆depth
?
DC-d1
NG-d2
DC-d1
DC-d1
NG-d1
DC-d2
NG-d1
Depth (m) Depth (m)
Depth (m) Depth (m)
Fig. 2. Sketch of the ∆age and ∆depth determination methods for EDC (DC). Top panel: ∆age
method. The green arrow represents the10
Be-10
Be tie point and the blue arrow corresponds
to the methane/NorthGRIP (NG)-isotope stratigraphic link, assuming that these two records
are synchronous during the rapid DO transitions (Huber et al., 2006). Bottom panel: ∆depth
method. The green arrow represents the10
Be-10
Be tie point and the red arrow corresponds
to the methane/NorthGRIP-isotope stratigraphic link, assuming that these two records are syn-
chronous during the rapid DO transitions (Huber et al., 2006).464
CPD
3, 435–467, 2007
Gas age-ice age
differences along the
EPICA cores
L. Loulergue et al.
Title Page
Abstract Introduction
Conclusions References
Tables Figures
◭ ◮
◭ ◮
Back Close
Full Screen / Esc
Printer-friendly Version
Interactive Discussion
EGU
2000
204
02080
2120
21
60
North
Grip
de
pth
(m)
-46
-44
-42
-40
-38
-36
δ18O (‰)
720
760
800
Dom
e C
depth
(m)
-450
-440
-430
-420
Deuterium (‰)
400
440
480
520
560
600
CH4 concentration (ppbv)
∆age
∆depth
DC-d1 DC-d1
DC-d2NG-d1
NG-d2
DO8
DO10
21
60
214
02
120
21
00
208
020
60
No
rth G
rip d
ep
th (m
)
-36
-38
-40
-42
-44
-46
δ18O (‰)
148
01
440
14
00
13
60
132
0
ED
ML d
epth
(m)
-46
-48
-50
-52
-54
δ18O (‰)
600
550
500
450
400
350
CH4 concentration (ppbv)
∆age∆depth
DML-d1
DML-d1
DML-d2
NG-d2
NG-d1
DO10
DO8
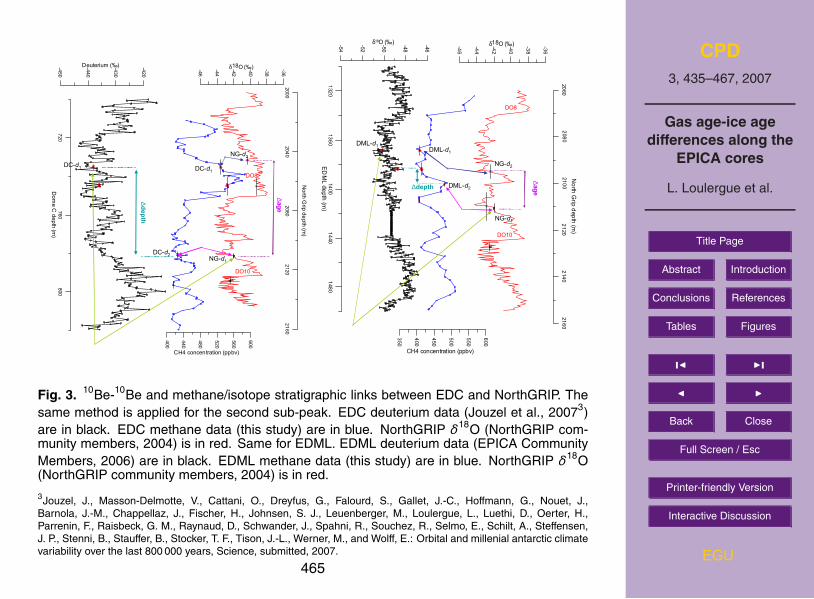
Fig. 3.10
Be-10
Be and methane/isotope stratigraphic links between EDC and NorthGRIP. The
same method is applied for the second sub-peak. EDC deuterium data (Jouzel et al., 20073)
are in black. EDC methane data (this study) are in blue. NorthGRIP δ18
O (NorthGRIP com-munity members, 2004) is in red. Same for EDML. EDML deuterium data (EPICA Community
Members, 2006) are in black. EDML methane data (this study) are in blue. NorthGRIP δ18
O(NorthGRIP community members, 2004) is in red.
3Jouzel, J., Masson-Delmotte, V., Cattani, O., Dreyfus, G., Falourd, S., Gallet, J.-C., Hoffmann, G., Nouet, J.,
Barnola, J.-M., Chappellaz, J., Fischer, H., Johnsen, S. J., Leuenberger, M., Loulergue, L., Luethi, D., Oerter, H.,Parrenin, F., Raisbeck, G. M., Raynaud, D., Schwander, J., Spahni, R., Souchez, R., Selmo, E., Schilt, A., Steffensen,J. P., Stenni, B., Stauffer, B., Stocker, T. F., Tison, J.-L., Werner, M., and Wolff, E.: Orbital and millenial antarctic climatevariability over the last 800 000 years, Science, submitted, 2007.
465

CPD
3, 435–467, 2007
Gas age-ice age
differences along the
EPICA cores
L. Loulergue et al.
Title Page
Abstract Introduction
Conclusions References
Tables Figures
◭ ◮
◭ ◮
Back Close
Full Screen / Esc
Printer-friendly Version
Interactive Discussion
EGU
10000 20000 30000 40000 50000Gas chronology (yrs)
-400
0
400
800
1200
Diffe
ren
ce
s b
etw
ee
n t
he
tw
o g
as c
hro
no
log
ies (
ED
ML
-ED
C)
Scenario 1
Scenario 2
Scenario 3
Scenario 4
Uncertainties
1st2nd
3th transition DO2 DO3DO4
DO5DO6
DO7DO8
DO9DO10
DO11DO12
Fig. 4. Differences between the EDML and EDC gas chronologies for each methane tie point.
The uncertainty (discontinuous line) on the methane synchronisation tie points is shown with
the grey area. For a description of the scenarios, refer to Sect. 4.
466

CPD
3, 435–467, 2007
Gas age-ice age
differences along the
EPICA cores
L. Loulergue et al.
Title Page
Abstract Introduction
Conclusions References
Tables Figures
◭ ◮
◭ ◮
Back Close
Full Screen / Esc
Printer-friendly Version
Interactive Discussion
EGU
0 10000 20000 30000 40000 50000 60000Gas chronology (yr BP)
EDC
EDML
NorthGRIP
350
400
450
500
550
600
CH
4 c
oncentr
ation (
ppbv)
300
400
500
600
700
800
CH
4 c
oncentr
ation (
ppbv)
360
400
440
480
520
560
600
CH
4 c
oncentr
ation (
ppbv)
32000 36000 40000 44000 48000Gas chronology (yr BP)
-46
-44
-42
-40
-38
-36
δ18O
(‰
)
-46
-44
-42
-40
-38
-36
δ18O
(‰
)
DO8
DO9
a)
b)
Fig. 5. Comparison between EDC methane (blue curve), EDML methane (pink curve) and
NorthGRIP isotope (green curve). NorthGRIP age scale is GICC05. EDC and EDML gas age
scales are from scenario 4 (see Sect. 4.4).
467