New and Small Starts Evaluation and Rating Process · 2015-10-06 · New and Small Starts...
58
Section 5309 Capital Investment Grant Program New and Small Starts Evaluation and Rating Process August 2013
Transcript of New and Small Starts Evaluation and Rating Process · 2015-10-06 · New and Small Starts...

Section 5309 Capital Investment
Grant Program
New and Small Starts Evaluation and Rating Process
August 2013

Agenda
• Welcome and overview• MAP-21 framework for New and Small Starts• Overview of final rule and policy guidance • Project evaluation and rating process• Questions and answers
2

Speakers
Lucy GarliauskasAssociate AdministratorOffice of Planning and Environment
Beth DayDirector, Office of Project Planning
3

PROGRAM OVERVIEW AND MAP-21 FRAMEWORK
4

New and Small Starts Program Overview• Discretionary & Competitive Federal Grant Program
– Roughly $2 billion appropriated each year – Historical average federal share for projects in the program = 50%– Demand for funds exceeds supply – 29 projects in current pipeline
• Legislatively directed multi-year, multi-step process, with FTA project evaluation and rating required at specific points
• Successful 37-year program of investing in transit infrastructure around the country
• Generates projects that are transformational, create economic opportunity, and improve quality of life
5

How is the Program Carried Out?
MAP‐21Final RulePolicy Guidance
Reporting Instructions, Templates, and Cost Worksheets
Effective October 1, 2012
Effective April 9, 2013
Published August 14, 2013
Published August 14, 2013Project Sponsors must read and understand all of these documents to be successful
in getting through the program
6

Eligible ApplicantsMAP-21 defines eligible applicants as State or local governmental authorities
Local governmental authorities can include:• Political subdivisions of a State• Authorities of at least one State or political subdivision of a state• Indian tribes• Public corporations, boards, or commissions established under
the laws of a State
7

MAP-21 Eligible New Starts Projects• Total Cost ≥ $250M and/or New Starts funding sought is >$75M
• New fixed guideway or extension to existing fixed guideway
• Fixed guideway BRT:
8
– Majority operates in separate right-of-way– Represents substantial investment in a
single route in a defined corridor– Includes defined stations, traffic signal
priority for transit, and short headway bidirectional services for substantial part of weekdays and weekend days

MAP-21 Eligible Small Starts Projects• Total cost <$250 million and Small Starts share <$75 million
• New fixed guideway systems and extensions
• Fixed guideway BRT
• Corridor-based BRT that represents a substantial investment in a defined corridor, with features including:
– Defined stations– Traffic signal priority for transit– Short headway bi-directional
services for a substantial part of weekdays and weekend days
9

New Starts Process
• Complete environmental review process including developing and reviewing alternatives, selecting locally preferred alternative (LPA), and adopting it into the fiscally constrained long range transportation plan
• Gain commitments of all non-New Starts funding
• Complete sufficient engineering and design
Project Development Engineering
Full Funding Grant
Agreement
• Construction
• Complete environmental review process including developing and reviewing alternatives, selecting locally preferred alternative (LPA), and adopting it into fiscally constrained long range transportation plan
• Gain commitments of all non-Small Starts funding
• Complete sufficient engineering and design
ProjectDevelopment
Expedited Grant Agreement
• Construction
Small Starts Process
= FTA evaluation, rating, and approval
= FTA approvalLegend

MAP-21 Project Evaluation and Rating Criteria
• Project Justification: mobility; environmental benefits; congestion relief; economic development; land use; cost effectiveness
• Local financial commitment: acceptable degree of local financial commitment including evidence of stable and dependable financing sources
11

FINAL RULE AND FINAL POLICY GUIDANCE
12

Background• Advanced Notice of Proposed Rulemaking - June 3, 2010
• Notice of Proposed Rulemaking - January 25, 2012
• Final Rule and Proposed Policy Guidance - January 9, 2013
• Final Policy Guidance - August 14, 2013
• Reporting Instructions, Templates and Cost Worksheets -August 14, 2013
Sponsors now have complete picture of what is needed to get evaluated and rated
13

Reasons for Changes• Better address Administration goals and
comply with MAP-21 provisions:– Invest in infrastructure– Foster economic development and job creation– Improve sustainability and livability– Ensure consideration of the environment, disadvantaged
populations, and the impact these projects have on economic development
– Streamline project delivery
• Better quantify benefits of transit projects
14

Extensive Outreach Efforts• FTA undertook extensive outreach prior to making changes:
– Multiple outreach sessions held around the country– Multiple webinars, with recordings on FTA website– Outreach to non-traditional partners including social
equity groups, state and local governments, etc.– Collaboration with the U.S. Department of Housing and
Urban Development and Environmental Protection Agency
• As a result, FTA received thousands of comments from a wide audience
15

Benefits of Final Rule• Comports with MAP-21 requirements
• Reduces red tape and allows projects to reach the construction stage sooner
• Potentially shaves six months or more off the time required to move major projects through the process
• Eliminates time-consuming technical requirements
• Includes common-sense changes that:– Continue an appropriate level of scrutiny for these
significant investments of taxpayer dollars– Increase the transparency of the process
16

Simplified Approaches Accommodated
• Revised measures allow for:– simplified ridership estimation methods– potential expansion of “warrants” – ways that projects can
qualify for automatic ratings
• Measures use standard factors to simplify calculations and reduce the level of effort required
• Sponsors given options about the level of analysis they wish to undertake
17
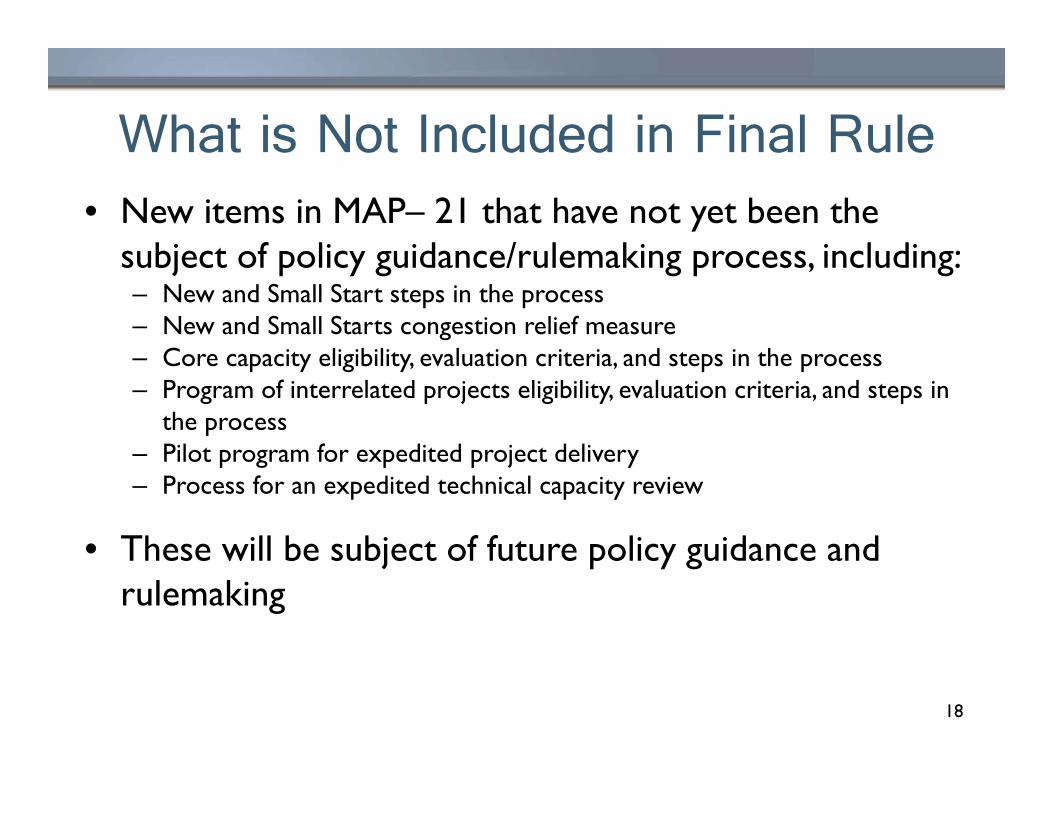
What is Not Included in Final Rule• New items in MAP– 21 that have not yet been the
subject of policy guidance/rulemaking process, including:– New and Small Start steps in the process– New and Small Starts congestion relief measure– Core capacity eligibility, evaluation criteria, and steps in the process– Program of interrelated projects eligibility, evaluation criteria, and steps in
the process– Pilot program for expedited project delivery– Process for an expedited technical capacity review
• These will be subject of future policy guidance and rulemaking
18

Comments Received on Proposed Guidance
• 50 letters received
• 392 individual comments
• A summary of comments and responses found at www.fta.dot.gov
19

How FTA Addressed CommentsRatings thresholds too high for some measures
• FTA performed additional research, lowered breakpoints
Separate rating thresholds for New and Small Starts• FTA mode neutral, sticking with one set of thresholds in
most cases
Clarity needed on affordable housing items• FTA clarified definitions, measure, and how ratings assigned
20

Project Evaluation and Rating Process
Reflects information contained in MAP-21, Final Rule, and Final Policy Guidance
21

22

Ratings
• 5 point rating scale – Low to High
• Ratings used to:– Approve or deny advancement into Engineering– Approve or deny projects for construction grants– Support annual funding recommendations to Congress
23

Updates to Ratings
• Re-rating for each Annual Report not required as long as no material changes to project scope or cost
• Material changes that may trigger a re-rating are: – design and construction scope of work changes– planning context changes– schedule changes of six months or more– change in a funding source or financing method
24

Establishing Ratings Thresholds
• FTA strives to have a mode neutral process
• Thresholds the same for New and Small Starts except for cost-effectiveness
• Thresholds developed using available research
• When research not available, thresholds developed using data from current & past projects
25

Current Year/Horizon Year• When sponsors prepare ridership estimates and other data for FTA
– Estimates using current year inputs are required– Estimates using horizon year inputs are optional
• Current year = most recent year for which data on the existing system and demographic data are available
• Horizon year = May select either 10 or 20 years in the future; must use socioeconomic forecasts from Metropolitan Planning Organization
• If sponsor chooses to do both current and horizon year estimates– Must do it for all relevant criteria– Ratings will be based on a 50% weight for each
26

Point of Comparison
For any criteria that use incremental measures, the point of comparison will be the no-build alternative
27
IF Sponsor is Preparing THEN No Build Alternative =
Current Year Estimate Current System
10 year horizon estimate Current system plus projects contained in Transportation Improvement Program
20 year horizon estimate Current system plus projects contained in fiscally constrained Long Range Transportation Plan

Project Justification Criteria
• Congestion Relief• Mobility • Cost effectiveness• Environmental Benefits• Existing Land Use • Economic Development
28

Congestion Relief
• New measure required by MAP-21 for both New Starts and Small Starts
• Will be subject of subsequent policy guidance and rulemaking, including public comment opportunities
• Policy Guidance includes interim approach –
All projects assigned an automatic Medium rating
29

Mobility Benefits
• Trips = linked trips• Transit Dependent Persons
– individuals residing in households that do not own a car OR
– individuals in the lowest income category
30
Trips by non‐transit
dependents
Trips by transit
dependents 2

Options for Estimating Trips• Local Travel Forecasting Model
– FTA must review validity of model and reasonableness of outcomes
• FTA Simplified Model (STOPS)– Uses census and ridership data on existing system– Reduces time required to develop estimates and FTA review time– Produces:
• Project trips for use in mobility and cost effectiveness• Change in auto vehicle miles traveled for use in environmental
benefits31

Cost-Effectiveness – New StartsAnnualized cost per trip on the project
• Trips = linked trips using the project• Annualized capital cost based on useful life of scope elements and 2%
discount rate• O&M costs taken from sponsor’s O&M cost model
32
Annualized capital cost of the project minus
“enrichments”
Annual operating cost of the project
Annual trips on the project

Enrichments – New StartsImprovements to the transit project that are:
– desired but not integral to the planned functioning of the project– whose benefits are not captured in whole by other criteria– carried out simultaneously with the grant
Allowable Enrichments:– 100% of artwork expenses– 100% of landscaping expenses– 100% of bicycle and pedestrian improvements– 2.5% of sustainable building design features expenses– 50% of alternative energy buses expenses– 100% of joint development costs
33

Cost-Effectiveness – Small Starts
• Trips = linked trips using the project
• Federal share includes capital funds both from the Small Starts program as well as other Federal funds
• Sponsor reports total capital cost, annualized Federal share automatically calculated based on useful life of scope items and 2% discount rate
34
Annualized Federal Share
Annual Trips on
the Project

Environmental Benefits
• The dollar value of the direct and indirect benefits to safety, energy, and air quality expected to result from the project compared to the annualized cost (New Starts) or annualized Federal share (Small Starts)
35

Environmental Benefits – New Starts
Annualized capital cost
minus “enrichments”
Annual operating cost of the project
Dollar value of change in
Safety
X 100
Dollar value of change in
GHG Emissions
Dollar value of change in AQ
Pollutants
Dollar value of change in Energy Use
36

Environmental Benefits – Small Starts
Annualized capital cost minus
“enrichments”
Annual operating cost of the project
Dollar value of change in
Safety
X 100
Dollar value of change in
GHG Emissions
Dollar value of change in AQ
Pollutants
Dollar value of change in Energy Use
Annualized Federal share
37

Environmental Benefits• Benefits computed using estimated change in VMT from mode shift
• Measures converted into native units (e.g., tons of emissions or total accidents) using national-level standard factors– National emission factors for CO, NOx, PM2.5, VOC– GHG emissions factors based on national average values from EPA models– Energy consumption rate factors based on vehicle/fuel type – Injury & fatality factors from BTS, NHTSA, and FTA databases
• Benefits monetized using dollar values gathered from research– Emissions reduced in a non-attainment area worth more than in an attainment area– USDOT dollar values for statistical life and injuries
• Monetized benefits compared to cost or Federal share
38

Environmental Benefits – Standard FactorsPolicy Guidance• Displays factors used to calculate the various measures
– Different values for current year, 10 year, and 20 year estimates– Different values for attainment vs non-attainment areas– Different values for different vehicle/fuel types
Templates• Only a few inputs required by sponsors
– Attainment status of metropolitan area– Change in transit and auto VMT
• Template automatically calculates the values
39

40
Environmental Benefits - ExampleProject: Light Rail extension that includes changes to existing bus operations
Evaluation time frame: Current year
Project Sponsor Inputs:
Regional air quality status: Attainment area
Annual change automobile VMT : -14,100,000 VMT
Annual change in diesel bus VMT: +780,000 VMT
Annual change in light rail VMT: +970,000 VMT

41
AQ Emissions Benefits Example
VMT Decrease(Increase)
Conversion Factor:
Emissions (kg) / VMT
Emissions Decrease (Increase)
(kg)Monetization Factor ($ / kg)
Value of Improvement [1]
9 Automobile 14,100,000 0.01677 236,457.00 $0.08 $18,916.56
10 Diesel Bus (780,000) 0.00583 (4,547.40) $0.08 ($363.79)
11 Hybrid Bus 0 0.00583 0.00 $0.08 $0.00
12 CNG Bus 0 0.03962 0.00 $0.08 $0.00
13 Electric Bus 0 0.00645 0.00 $0.08 $0.00
14 Heavy Rail 0 0.00706 0.00 $0.08 $0.00
15 Light Rail / Streetcar (970,000) 0.01051 (10,194.70) $0.08 ($815.58)
16 Commuter Rail ‐ New diesel locomotive or DMU
0 0.01680 0.00 $0.08 $0.00
17 Commuter Rail ‐ Used diesel locomotive
0 0.01680 0.00 $0.08 $0.00
18 Commuter Rail ‐ Electric or EMU 0 0.01281 0.00 $0.08 $0.00
19 TOTAL CHANGE 12,350,000 ‐‐‐ 221,714.90 ‐‐‐ $17,737.19
Current Year
Line Mode
Template automatically converts inputs to the dollar value of AQ pollutant emissions reductions

42
GHG Benefits ExampleTemplate automatically converts inputs to the dollar value
of change in GHG emissions reductions
VMT Decrease(Increase)
Conversion Factor:
Emissions (ton) / VMT
Emissions Decrease (Increase)(tons)
Monetization Factor($ / ton)
Value of Improvement [1]
53 Automobile 14,100,000 0.000532 7,501.20 $30.00 $225,036.00
54 Diesel Bus (780,000) 0.003319 (2,588.82) $30.00 ($77,664.60)
55 Hybrid Bus 0 0.002655 0.00 $30.00 $0.00
56 CNG Bus 0 0.002935 0.00 $30.00 $0.00
57 Electric Bus 0 0.002934 0.00 $30.00 $0.00
58 Heavy Rail 0 0.003211 0.00 $30.00 $0.00
59 Light Rail / Streetcar (970,000) 0.004779 (4,635.63) $30.00 ($139,068.90)
60 Commuter Rail ‐ New diesel locomotive or DMU
0 0.007970 0.00 $30.00 $0.00
61 Commuter Rail ‐ Used diesel locomotive
0 0.007970 0.00 $30.00 $0.00
62 Commuter Rail ‐ Electric or EMU 0 0.005821 0.00 $30.00 $0.00
63 TOTAL CHANGE 12,350,000 ‐‐‐ 276.75 ‐‐‐ $8,302.50
Line Mode
Current Year

43
Energy Use Benefits ExampleTemplate automatically converts inputs to the
dollar value of change in energy use
VMT Decrease(Increase)
Conversion Factor: Energy Use (million Btu) / VMT
Energy Use Decrease (Increase)
(million Btu)
Monetization Factor
($ / million Btu)
Value of Improvement [1]
64 Automobile 14,100,000 0.007559 106,581.90 $1.72 $183,320.87
65 Diesel Bus (780,000) 0.041436 (32,320.08) $1.56 ($50,419.32)
66 Hybrid Bus 0 0.033149 0.00 $1.56 $0.00
67 CNG Bus ‐‐‐ ‐‐‐ ‐‐‐ ‐‐‐ ‐‐‐
68 Electric Bus ‐‐‐ ‐‐‐ ‐‐‐ ‐‐‐ ‐‐‐
69 Heavy Rail ‐‐‐ ‐‐‐ ‐‐‐ ‐‐‐ ‐‐‐
70 Light Rail / Streetcar ‐‐‐ ‐‐‐ ‐‐‐ ‐‐‐ ‐‐‐
71 Commuter Rail ‐ New diesel locomotive or DMU
0 0.096138 0.00 $1.56 $0.00
72 Commuter Rail ‐ Used diesel locomotive
0 0.096138 0.00 $1.56 $0.00
73 Commuter Rail ‐ Electric or EMU ‐‐‐ ‐‐‐ ‐‐‐ ‐‐‐ ‐‐‐
74 TOTAL CHANGE 13,320,000 ‐‐‐ 74,261.82 ‐‐‐ $132,901.54
Mode
Current Year
Line

44
Safety Benefits ExampleTemplate automatically converts inputs to the dollar
value of changes in injuries/fatalities
VMT Decrease(Increase)
Conversion Factor:
Fatalities / VMT
Fatality Decrease (Increase)
Monetization Factor
($ / fatality)Value of
Improvement [1]75 Automobile 14,100,000 0.000000013 0.18 $6,200,000 $1,136,460.00
76 Diesel Bus (780,000) 0.000000004 (0.00) $6,200,000 ($19,344.00)
77 Hybrid Bus 0 0.000000004 0.00 $6,200,000 $0.00
78 CNG Bus 0 0.000000004 0.00 $6,200,000 $0.00
79 Electric Bus 0 0.000000004 0.00 $6,200,000 $0.00
80 Heavy Rail 0 0.000000007 0.00 $6,200,000 $0.00
81 Light Rail / Streetcar (970,000) 0.000000009 (0.01) $6,200,000 ($54,126.00)
82 Commuter Rail ‐ New diesel locomotive or DMU
0 0.000000012 0.00 $6,200,000 $0.00
83 Commuter Rail ‐ Used diesel locomotive
0 0.000000012 0.00 $6,200,000 $0.00
84 Commuter Rail ‐ Electric or EMU 0 0.000000012 0.00 $6,200,000 $0.00
85 TOTAL CHANGE 12,350,000 ‐‐‐ 0.17 ‐‐‐ $1,062,990.00
Line Mode
Current Year

Existing Land Use in the Corridor• Primarily quantitative analysis examining potential
for successful project based on existing conditions– Population densities within ½ mile of station areas– Total employment served by the project– Parking supply and cost in the Central Business District– Share of legally binding affordability restricted housing in the corridor
compared to share in the counties through which the project travels
• Some qualitative information, but not weighted heavily in the evaluation – Existing station area character– Pedestrian accessibility
45

• What does Legally Binding Affordability Restricted (LBAR) mean?– A property that has a legal instrument attached to it that restricts
the cost of housing to be affordable to households at specified income levels for a defined period of time
• FTA seeking share of LBAR units for people with incomes < 60% of the area median income
• Where do project sponsors get the data?– LBAR units - Area housing authorities, preservationdatabase.org – Total Units - American Community Survey
46
Land Use – Affordable Housing Measure

Land Use – Affordable Housing Measure
LBAR Housing Units in Corridor
Total Housing Units in Corridor
LBAR Share in Corridor
47
LBAR Housing Units in County
Total Housing Units in County
LBAR Share in County
LBAR Share in Corridor
LBAR Share in County
FTA Measure
Step 1
Step 2
Step 3

Economic Development
• Qualitative analysis of how likely a project will enhance additional, transit-supportive development in the future based on:– Transit supportive plans and policies – Demonstrated performance and impacts of the policies– Plans and policies to maintain or increase affordable housing
• At sponsor’s option, an additional quantitative analysis:– No prescribed format– Ultimately looking for estimated indirect changes in VMT resulting
from changes in anticipated development patterns– Resulting environmental benefits then calculated, monetized, and
compared to the annualized cost or federal share
48

Economic Development
• Transit Supportive Plans and Policies– Growth Management– Transit Supportive Corridor Policies– Supportive Zoning Near Transit– Tools to implement transit-supportive plans and
policies
49

Economic Development
• Demonstrated Performance and Impact of Plans and Policies– Cases of development affected by policies– Station area development proposals and status– Adaptability of station land for development– Corridor economic environment
50

Economic Development
• Plans and Policies to Maintain or Increase Affordable Housing– Affordable housing needs and supply– Adopted financial tools and strategies– Evidence of developer activity to preserve or
increase affordable housing– Extent to which plans and policies account for
long term affordability and the needs of very and extremely low income households
51

Local Financial Commitment
To encourage overmatch, projects proposing less than 50% Section 5309 share will have their local financing commitment rating raised one level
Local Financial Commitment Rating
Commitment of Funds (both Capital
and Operating)25%
Reasonableness of Assumptions and Financial Capacity
(both Capital and Operating)
50%
Current Condition(both Capital
And Operating) 25%
52

Current Condition
• Average Fleet Age
• Bond ratings (within last 2 years)
• Current ratio (current assets/current liabilities)
• Recent service history
53

Commitment of Funds
• Amount of committed, budgeted, or planned funds– Committed = all approvals received, no additional actions necessary– Budgeted = budgeted and/or programmed for use but may be awaiting
final appropriations or action– Planned = funds identified, but are neither budgeted or committed
• Whether there are significant private contributions to the project
54

Financial Capacity and Reasonableness of Assumptions
• Assumptions about revenue and expense growth comparable to historical experience
• Reasonableness of project capital cost estimate
• Adequacy of meeting state of good repair needs
• Financial capacity to withstand funding shortfalls or cost overruns (above and beyond contingency included in the cost estimate)
55

Local Financial Commitment• Small Starts projects can qualify for simplified financial evaluation if
– Reasonable plan to secure funding for the local share– O&M cost of the project is < 5% of existing operating budget– Sponsor is in reasonably good financial condition
56
IF Sponsor THEN
Meets requirements above and requests >50% Small Starts funding
Automatic Medium Rating
Meets requirements above and requests < 50% Small Starts funding
Automatic High Rating
Cannot meet requirements above Cash flow must be submitted and project is evaluated and rated in fashion similar to New Starts
Questions?
• For more information, visit Capital Investment Grant Program webpage http://www.fta.dot.gov/12304.html
57

58