NEW ADVANCES IN POST-INSTALLED SUBSEA...
9
1 Copyright © 2014 by ASME Proceedings of the 33 rd International Conference on Ocean, Offshore and Arctic Engineering OMAE2014 June 8-13, 2014, San Francisco, California, USA OMAE2014-24300 NEW ADVANCES IN POST-INSTALLED SUBSEA MONITORING SYSTEMS FOR STRUCTURAL AND FLOW ASSURANCE EVALUATION Reza Asgharzadeh Shishavan Brigham Young University 350 Clyde Building Provo, Utah, 84602 Email: [email protected] David V. Brower Astro Technology, Inc. 712 Main Street, Suite 3200 Houston, Texas 77002 Email: [email protected] John D. Hedengren Brigham Young University 350 Clyde Building Provo, Utah, 84602 Email: [email protected] Alexis D. Brower Astro Technology, Inc. 712 Main Street, Suite 3200 Houston, Texas 77002 Email: [email protected] ABSTRACT An overview of fiber optic sensors for temperature, pressure, strain, and fatigue of subsea structures is provided. Current progress details efforts to ensure proper installation and bonding to existing risers, flow-lines, mooring lines, trees, and other structures in actual subsea environments. Developments include clamp prototypes, bonding techniques, long-term fatigue analysis, sensor calibration, and temperature compensation. Fiber optic technology in subsea monitoring began over 20 years ago by migrating expertise from decommissioning of rocket motors. The first installations were on new installations of subsea pipelines, production risers, and drilling risers to measure strain and vibration for fatigue life monitoring. Of particular interest for these systems were detecting riser vortex induced vibration and strain throughout the touchdown zone. A prior limitation was that sensor installation was only performed top-side on new subsea equipment. This recent work demonstrates the capability to deploy on existing subsea equipment. The novel contributions of this study are the developments that optimize the clamp design, bonding techniques, and factors that allow long-term service life. Button pull tests validate long term service life after the clamps are subjected to accelerated aging tests. Details on the subsea calibration also provide insight on the recent progress with post-installed sensors. The purpose of reliable post-installed advanced sensors is not only to detect failures of subsea infrastructure but also to warn of signs of fatigue or hydrate formation that contribute to catastrophic failures. The calibration and testing mentioned in this paper are part of the Clear Gulf study, a collaboration formed in 2010 between the offshore energy industry and NASA. The study continues to make advances in highly sensitive monitoring systems that anticipate failures, catastrophic events, and flow assurance issues. NOMENCLATURE CFD Computational fluid dynamics FBG Fiber Bragg Gratings KIPS Units equal to 1000 lb f ROV Remotely Operated Vehicle TLP Tension Leg Platform VIV Vortex Induced Vibration Sensitivity factor for post-installed FBG sensors Baseline factor for post-installed FBG sensors Raw micro-strain (m/m) from an FBG sensor Calibrated micro-strain (m/m) for an FBG sensor INTRODUCTION This paper relates significant advances for installation and calibration of non-penetrating sensors for monitoring of subsea structures as part of the Clear Gulf study. This work is a
Transcript of NEW ADVANCES IN POST-INSTALLED SUBSEA...

1 Copyright © 2014 by ASME
Proceedings of the 33rd International Conference on Ocean, Offshore and Arctic Engineering OMAE2014
June 8-13, 2014, San Francisco, California, USA
OMAE2014-24300
NEW ADVANCES IN POST-INSTALLED SUBSEA MONITORING SYSTEMS FOR STRUCTURAL AND FLOW ASSURANCE EVALUATION
Reza Asgharzadeh Shishavan Brigham Young University
350 Clyde Building Provo, Utah, 84602
Email: [email protected]
David V. Brower Astro Technology, Inc.
712 Main Street, Suite 3200 Houston, Texas 77002
Email: [email protected]
John D. Hedengren Brigham Young University
350 Clyde Building Provo, Utah, 84602
Email: [email protected]
Alexis D. Brower Astro Technology, Inc.
712 Main Street, Suite 3200 Houston, Texas 77002
Email: [email protected]
ABSTRACT An overview of fiber optic sensors for temperature, pressure,
strain, and fatigue of subsea structures is provided. Current
progress details efforts to ensure proper installation and bonding
to existing risers, flow-lines, mooring lines, trees, and other
structures in actual subsea environments. Developments include
clamp prototypes, bonding techniques, long-term fatigue
analysis, sensor calibration, and temperature compensation.
Fiber optic technology in subsea monitoring began over 20
years ago by migrating expertise from decommissioning of
rocket motors. The first installations were on new installations
of subsea pipelines, production risers, and drilling risers to
measure strain and vibration for fatigue life monitoring. Of
particular interest for these systems were detecting riser vortex
induced vibration and strain throughout the touchdown zone. A
prior limitation was that sensor installation was only performed
top-side on new subsea equipment. This recent work
demonstrates the capability to deploy on existing subsea
equipment.
The novel contributions of this study are the developments
that optimize the clamp design, bonding techniques, and factors
that allow long-term service life. Button pull tests validate long
term service life after the clamps are subjected to accelerated
aging tests. Details on the subsea calibration also provide
insight on the recent progress with post-installed sensors.
The purpose of reliable post-installed advanced sensors is
not only to detect failures of subsea infrastructure but also to
warn of signs of fatigue or hydrate formation that contribute to
catastrophic failures. The calibration and testing mentioned in
this paper are part of the Clear Gulf study, a collaboration
formed in 2010 between the offshore energy industry and NASA.
The study continues to make advances in highly sensitive
monitoring systems that anticipate failures, catastrophic events,
and flow assurance issues.
NOMENCLATURE
CFD Computational fluid dynamics
FBG Fiber Bragg Gratings
KIPS Units equal to 1000 lbf
ROV Remotely Operated Vehicle
TLP Tension Leg Platform
VIV Vortex Induced Vibration
𝛼 Sensitivity factor for post-installed FBG sensors
𝛽 Baseline factor for post-installed FBG sensors
𝜇𝜖𝐹 Raw micro-strain (m/m) from an FBG sensor
𝜇𝜖𝑆 Calibrated micro-strain (m/m) for an FBG sensor
INTRODUCTION This paper relates significant advances for installation and
calibration of non-penetrating sensors for monitoring of subsea
structures as part of the Clear Gulf study. This work is a

2 Copyright © 2014 by ASME
continuation of a prior study with test articles that are subjected
to accelerated aging (1). The novel contributions of this study are
new tensile strength measurements that quantify the effect of wet
and dry bonding, innovative clamp designs, and methods for
calibration of post-installed sensors. A major shortcoming of
prior attempts at post-installed monitoring was the inadequate
coupling of the sensor to the structure and this study provides
methods to overcome this limitation. Advances in subsea sensing
technology offers many options for highly accurate and
distributed sensing solutions. Measurements for pressure,
temperature, strain, hydrate formation, strain, vortex induced
vibration (VIV), asphaltene buildup, wax deposition, and other
quantities are well-established or under development and
provide important insight for reservoir management, flow
assurance, and in developing sophisticated predictive models.
The modern sensors for newly installed systems combine to form
a “central nervous system” for the production network that can
sense and respond to abnormal or planned events. The system
responds with changes to valves, pumps, pig deployment,
methanol injection, pipe-in-pipe heating, ballast levels, and other
actuators. A distributed sensor network can also provide input to
an intelligent system that immediately responds to detected
changes (2), checks for long-term fouling (3), schedules
sequences of actions, performs regular maintenance, and
likewise embeds years of experience by trained operators or
model predictive algorithms into an automation solution (4-7).
The combination of sensors, actuators, and intelligent system
creates an Intelli-field where the lifecycle of the reservoir is
actively monitored throughout exploration, drilling, completion,
production, enhanced recovery phases, and well-abandonment
(8-9).
While the Intelli-field concept is certainly possible for new
installations, there remain two major obstacles for existing
installations that are currently operating. The first limitation is
that many sensor require penetration into the flow-line or subsea
structure. Installation of penetrating sensors likely involves
production shut-down, loss of structural integrity, and a change
in containment strategy that was part of the original design.
Installation of penetrating sensors to an existing field is often
prohibitive for these reasons. Where penetrating sensors are not
feasible, there also exist many types of non-penetrating sensors
that can detect temperature, pressure, strain, hydrate formation,
and other flow assurance concerns. The second major limitation
is then how to couple the non-penetrating sensor to the structure
in a subsea environment with divers or remotely operated
vehicles (ROVs). For full lifecycle use, the bond that creates the
sensor measurement coupling must maintain the required tensile
strength to avoid loss of sensitivity. External clamp devices have
also been designed to hold the sensor in place during the curing
phase of the subsea adhesive and to protect the sensor. In some
cases, it is desirable to use an external clamp without adhesive to
facilitate replacement or maintenance of the sensor. This paper
specifically investigates clamp design, coupling in simulated
subsea conditions with accelerated aging tests, and calibration of
the sensors once installed. Finite element modeling of the
accelerated aging tests gives insight into the long-term service
potential in areas of high strain or vibration. By enabling
installation and long-term service life potential, additional
sensors can be distributed along the flow-line without disrupting
production on vast networks of currently operating systems.
REMOTE MONITORING AND DIAGNOSTICS With the push to deepwater, arctic environments, and with
longer subsea tie-backs, Intelli-field systems are becoming
increasingly important to ensure performance of large
investments. Several areas of interest for monitoring include the
cement around the casing, the casing from the bottom of
production casing to the well-head, the well-head, the flowline,
the riser touchdown zone, and also with the top of the riser to
evaluate the effectiveness of strakes designed to dampen VIV.
Among some of the sensors considered are pH, leak detection,
pressure, temperature, heat flux, strain, vibration, material
composition (i.e. liquid/gas states), hydrate formation and
blockage development, asphaltene or paraffin detection, thermal
insulation effectiveness, iceberg trenching, riser trenching,
emulsions, erosion, internal corrosion, scales, fatigue, slugging
and sloshing, and pig location. These can be analyzed with a
combination of fiber-optic, ultrasonic, acoustic and other
sensors. Using the sensors in the laboratory or with field data
allows correlations to be developed or computational fluid
dynamic (CFD) models to be validated to further improve the
predictive capability of the Intelli-field system.
FIBER-OPTIC MONITORING DEVELOPMENT The introduction of fiber optic sensors into the oil and gas
industry stems from initial work in robotic sensing to provide
tactile feedback within a robotic hand (9) as shown in Figure 1.
Figure 1. FIBER OPTIC FEEDBACK WITHIN THE
ROBONAUT FINGER JOINTS AND TIPS (10).
This technology was also used to measure temperature and
strain within a motor burning solid rocket propellant for the
demilitarization of Intercontinental Ballistic Missiles (ICBMs).
The use of fiber optic sensors was necessitated by the
requirement for non-electrical monitoring in a high temperature
and reactive environment. At the time, fiber optic sensing was an
immature area and this success in rockets motors attracted
interest from the oil and gas industry where sensing in remote
and harsh environments is also desirable.
A first project in 1997 was the instrumentation of a 14 mile
tie-back from the Troika wells in the Gulf of Mexico (11). The
drilling risers of the vessels Ocean Clipper and Ocean

3 Copyright © 2014 by ASME
Confidence (12) were instrumented with all fiber optic strain
gauges to measure VIV. These 24’’ diameter drilling risers
extended to a depth of 7500 ft. This work was done during
drilling operations on the Neptune well in the Gulf of Mexico
and is the first known study for real-time VIV measurements.
This was a significant advance over the typical practice of data-
logging and retrieval performed with accelerometers.
Another area of interest for strain and vibration was on the
touchdown zone of several clusters of risers. These risers were
instrumented on new flowlines connected to spar and semi-
submersible platforms (13-14) as shown in Figure 2.
Figure 2. INSTRUMENTATION OF RISERS ON SPAR
AND SEMI-SUBMERSIBLE PLATFORMS.
A major innovation came during project work on a tie-back
at depths of approximately 7,000 feet (15). Several clam-shell
sensor stations were installed on pipe before the initial pipe-lay
for the new tie-back to an existing platform in the Gulf of
Mexico. During the pipe-lay, the sensor station intended to
monitor strain, temperature, and pressure at the well-head was
damaged. With the well-head at nearly 7,000 feet and 56-miles
from the platform, it was critical for operations to monitor
pressure and temperature especially because the electrically
operated sensors had failed shortly after startup. An ROV
installable clamp was designed and installed to monitor
temperature, pressure, and strain at the well-head. This
installation was successful and after six years the system is still
operational. Up to this period of technology development, only
new installations could be attempted. This innovation
demonstrated that post-installed monitoring solutions were also
possible and would allow sensing of existing flowlines without
penetration and without shutting down production.
Other recent developments in fiber optic monitoring include
instrumentation of flexible risers, distributed strain and
temperature sensing along pipelines (16-21), leak detection for
LNG pipelines (22), and as communication networks for control
applications. These recent developments are intended for new
installations and not necessarily for installation on existing
production systems.
The activities of this study to test subsea bonding, clamp
design, and sensor calibration were sponsored by the Clear Gulf
study and in support of an installation on two Tension Leg
Platforms (TLPs) in West Africa (1). Loss of load cells readings
for tendon tensions necessitated another approach at load
sensing. During normal operations, the tendon tensions are not
adjusted but are allowed to oscillate up and down by 40 to 90
kips (1 kip = 1000 lbf) due to tidal and wave action. However,
when drilling equipment is loaded or other heavy lift operations
are required, the tendon tensions are increased by removing
ballast in anticipation of the additional weight on the platform.
To stay within acceptable tendon tension ranges during the
ballast and lift operations, a retrofitted tendon tension monitoring
system was proposed using fiber optic sensing and diver-
installable clamps. Subscale test articles were fabricated after
analysis with finite element analysis (FEA) during compression,
tension, and bending tests. The FEA ensured that representative
and uniform loads were applied to the test article and consistent
with expected tendon tension load cycling. Aging tests were also
conducted to ensure adequate potential for a long-term service
life. Redundant sensors were installed on four of the eight
tendons as shown in Figure 3 and have provided necessary
information during an expansion of the platform production
capacity to avoid over- or under-tensioning of the tendons.
Figure 3. TENDON TENSION MONITORING SYSTEM.
With over a year of continuous monitoring, the coupling and
aging tests have so far proved valid in suggesting long-term
service life. Anticipated service life exceeds the life of the
platform although individual sensor stations may need retuning
and maintenance to perform well over an extended period.
SENSOR COUPLING IN SUBSEA CONDITIONS Three test articles were used to determine the tensile
strength of sensor bonding in subsea conditions. Full details of
the testing in compression, tension, and in four point bending
were given in a previous publication (1). The additional results
in this section are the button pull tests that were used to evaluate
the effectiveness of the sensor bonding after the accelerated
aging tests, in wet and dry installation conditions, and also for
samples that were not subjected to the cyclical aging tests. Figure
4 shows a diagram of the sensor clamp and the button pull
locations for each of the sensing stations. Including samples at
90° intervals is especially important with the four point bending

4 Copyright © 2014 by ASME
test where some clamps were subjected to both compression and
tension but on opposite sides of the clamp.
Figure 4. CLAMP DESIGN WITH BUTTON PULL TEST
LOCATIONS.
Each of the tests includes the simulation of the test showing
areas of strain or compression, a simplified diagram of the test,
and a photo of the test article. Figure 5 shows the test article and
simulation with the 14’ length pipe used in the four point bending
test. Clamps AA (wet) and BB (dry) were bonded after the testing
as control samples to evaluate both the effect of wet bonding
conditions and the effect of the aging tests. A full summary of
the results is given in Annex A below with results for each of the
individual clamps.
Figure 5. TEST ARTICLE AND CLAMP LOCATIONS FOR
THE FOUR POINT BENDING TEST.
Figure 6 shows the test article and simulation with the 3’
pipe used in the compression test and a separate test article used
for the tension test. In this case, only a single sensor clamp was
installed on each pipe segment (Clamps F and G). These test
articles were subjected to compression or tension forces up to
70% of yield strength with 10 cycles of fast (1’’/min) and 10
cycles of slower (0.1’’/min) rate of change for each. The samples
were also held at maximum tension or compression forces for a
period of time before relaxation during each cycle.
Figure 6. TEST ARTICLES AND CLAMP LOCATIONS
FOR THE COMPRESSION AND TENSION TESTS.
For each of the button test samples, a small circular cut was
made in the clamp material. Next, a tab was attached to the top
of the circular piece as shown in Figure 7.
Figure 7. BUTTON PULL TEST TO MEASURE TENSILE
STRENGTH.
The load for each test was measured with a load cell by
pulling until there was an observed loss of resistive force where
either the polyurethane or adhesive failed. Multiple samples
were collected from each location to determine the average,
standard deviation, minimum, and maximum for the tensile
strength as shown in Table 1.
Button Pull
Locations at
90° Increments
Pulled Button

5 Copyright © 2014 by ASME
Table 1. ADHESIVE STRENGTH BY LOCATION AND
PREPARATION METHOD.
Clamp Avg (psi)
StDev (psi)
Min (psi)
Max (psi) Description
BB 292.0 108.9 113.6 498.6 Dry Bonded Control
AA 81.4 47.2 31.1 193.5 Wet Bonded Control
A 94.0 30.4 45.0 155.8 Four Point Bending (Left)
B 174.1 112.4 29.8 503.3 Four Point Bending(Left)
E 91.1 46.9 49.5 150.8 Four Point Bending (Center)
C 142.5 65.6 45.8 267.9 Four Point Bending (Right)
D 136.3 73.6 57.5 358.7 Four Point Bending (Right)
F 114.0 53.7 33.6 225.7 Tension
G 105.3 59.8 29.7 268.8 Compression
A summary of the tensile strength results is shown in Figure
8. All of the samples are displayed on a semi-log plot to lessen
the visual effect of outliers. There are a number of interesting
results from the study. A first observation, that was also
expected, is that the dry bonded sample (BB) not subjected to
aging tests had the highest median value of 236 psi (or 292 psi
average) for tensile strength. Bonding in a dry environment
allows the epoxy to better seal to the surface of the pipe possibly
because of higher temperatures during the curing phase as well
as lack of water to interfere with the bonding surfaces. Another
somewhat surprising observation is that the aging tests did not
decrease the tensile strength. Instead, all but one of the samples
subjected to accelerated aging have higher median tensile
strength than the wet-bonded control sample (AA). The AA
clamp has a 66 psi median (or 81 psi average) tensile strength
while the other samples subjected to strain up to 70% of failure
have a 58-132 psi median (or 91-174 psi average) tensile
strength. This apparent increase in the tensile strength has no
immediately plausible explanation and may be due to some other
unaccounted factor such as temperature of the water bath during
clamp installation. The sensor clamps were installed in ambient
conditions in Louisiana and Texas at slightly different
temperatures and may have contributed to the bonding strength
disparity. Another possible factor is the longer time for curing of
the aged samples because the control samples were added after
the accelerated aging tests. Additional tests are underway to
quantify the effect of temperature and other critical to quality
(CTQ) parameters for better isolation of these effects and to
determine factors that lead to improved bonding. For example,
will there be an effect on bonding strength when clamps are wet
bonded at deep water temperatures of 0-4°C? This and other
questions will be answered through additional evaluation at
NASA test facilities as part of the Clear Gulf study.
Figure 8. SUMMARY OF TENSILE STRENGTH
RESULTS.
Other observations from these results are that there are high
and low outliers and a nearly linear distribution on a log-scaled
plot. Certain factors tend to shift the entire distribution up or
down, but the slope of the log-scaled distribution remains
constant regardless of the sample preparation method or
accelerated aging.
The button pull tests further demonstrate that adequate
bonding can be achieved in simulated subsea environments. The
ability of the adhesive to maintain tensile strength even after
accelerated aging shows the potential for long service life for
post-installed sensors attached through adhesion methods.
SENSOR CLAMP DESIGN In addition to adhesion studies, the clamp design has been
modified to better support the FBG sensors, better disperse the
bonding agent, and fit a variety of subsea structures such as
risers, tendons, and flowlines. Various clamp prototypes have
been designed in software and the molds have been printed with
3-D printing technology. The 3-D printed molds have enabled
the creation of highly precise clamp designs such as the mold for
an 8’’ diameter flowline as shown in Figure 9.
6 Copyright © 2014 by ASME
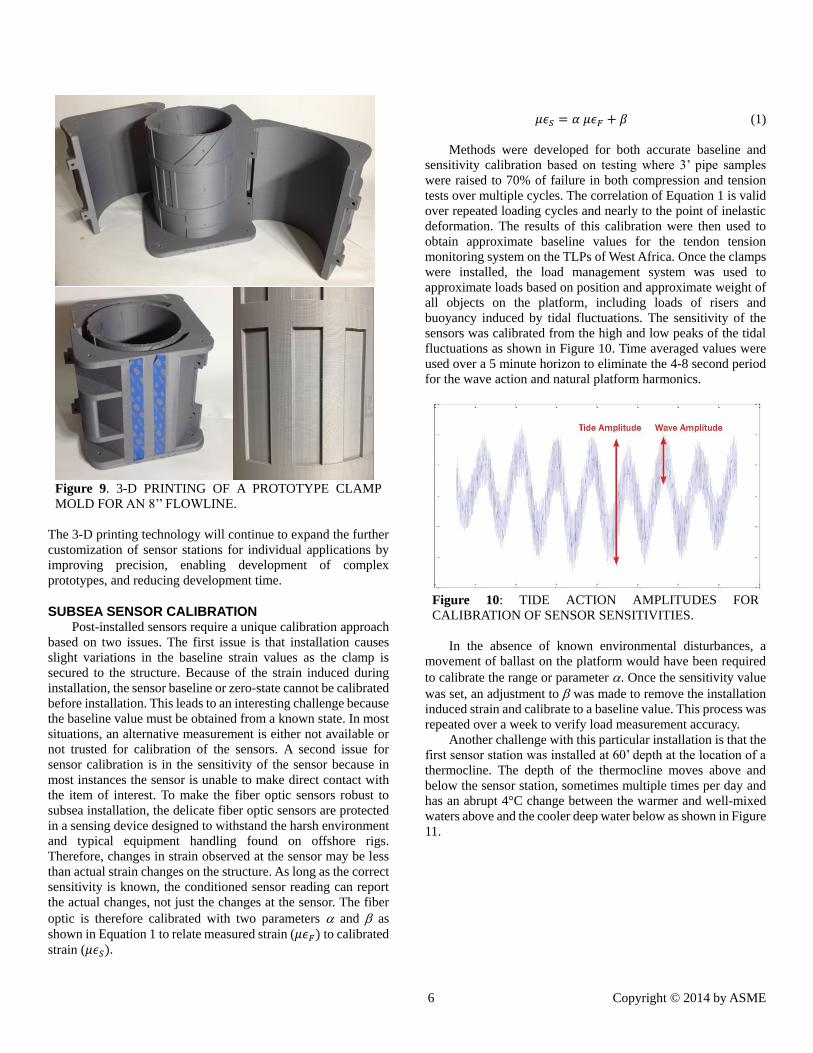
Figure 9. 3-D PRINTING OF A PROTOTYPE CLAMP
MOLD FOR AN 8’’ FLOWLINE.
The 3-D printing technology will continue to expand the further
customization of sensor stations for individual applications by
improving precision, enabling development of complex
prototypes, and reducing development time.
SUBSEA SENSOR CALIBRATION Post-installed sensors require a unique calibration approach
based on two issues. The first issue is that installation causes
slight variations in the baseline strain values as the clamp is
secured to the structure. Because of the strain induced during
installation, the sensor baseline or zero-state cannot be calibrated
before installation. This leads to an interesting challenge because
the baseline value must be obtained from a known state. In most
situations, an alternative measurement is either not available or
not trusted for calibration of the sensors. A second issue for
sensor calibration is in the sensitivity of the sensor because in
most instances the sensor is unable to make direct contact with
the item of interest. To make the fiber optic sensors robust to
subsea installation, the delicate fiber optic sensors are protected
in a sensing device designed to withstand the harsh environment
and typical equipment handling found on offshore rigs.
Therefore, changes in strain observed at the sensor may be less
than actual strain changes on the structure. As long as the correct
sensitivity is known, the conditioned sensor reading can report
the actual changes, not just the changes at the sensor. The fiber
optic is therefore calibrated with two parameters and as
shown in Equation 1 to relate measured strain (𝜇𝜖𝐹) to calibrated
strain (𝜇𝜖𝑆).
𝜇𝜖𝑆 = 𝛼 𝜇𝜖𝐹 + 𝛽 (1)
Methods were developed for both accurate baseline and
sensitivity calibration based on testing where 3’ pipe samples
were raised to 70% of failure in both compression and tension
tests over multiple cycles. The correlation of Equation 1 is valid
over repeated loading cycles and nearly to the point of inelastic
deformation. The results of this calibration were then used to
obtain approximate baseline values for the tendon tension
monitoring system on the TLPs of West Africa. Once the clamps
were installed, the load management system was used to
approximate loads based on position and approximate weight of
all objects on the platform, including loads of risers and
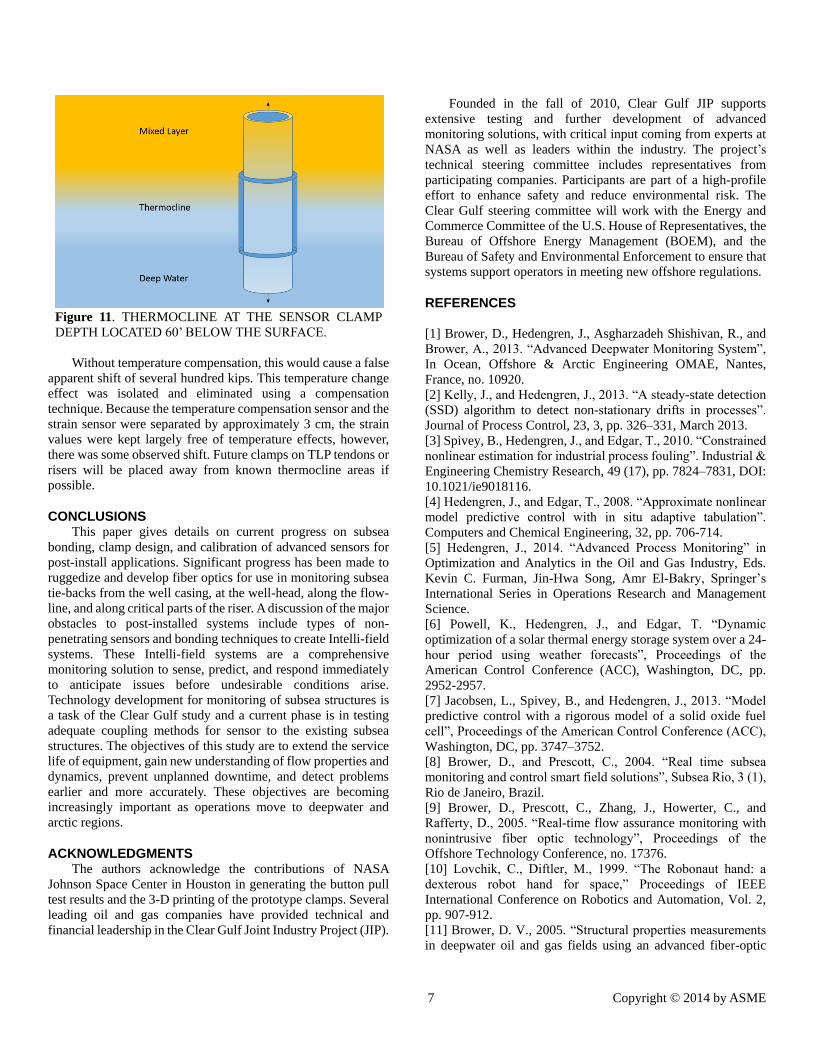
buoyancy induced by tidal fluctuations. The sensitivity of the
sensors was calibrated from the high and low peaks of the tidal
fluctuations as shown in Figure 10. Time averaged values were
used over a 5 minute horizon to eliminate the 4-8 second period
for the wave action and natural platform harmonics.
Figure 10: TIDE ACTION AMPLITUDES FOR
CALIBRATION OF SENSOR SENSITIVITIES.
In the absence of known environmental disturbances, a
movement of ballast on the platform would have been required
to calibrate the range or parameter . Once the sensitivity value
was set, an adjustment to was made to remove the installation
induced strain and calibrate to a baseline value. This process was
repeated over a week to verify load measurement accuracy.
Another challenge with this particular installation is that the
first sensor station was installed at 60’ depth at the location of a
thermocline. The depth of the thermocline moves above and
below the sensor station, sometimes multiple times per day and
has an abrupt 4°C change between the warmer and well-mixed
waters above and the cooler deep water below as shown in Figure
11.
7 Copyright © 2014 by ASME
Figure 11. THERMOCLINE AT THE SENSOR CLAMP
DEPTH LOCATED 60’ BELOW THE SURFACE.
Without temperature compensation, this would cause a false
apparent shift of several hundred kips. This temperature change
effect was isolated and eliminated using a compensation
technique. Because the temperature compensation sensor and the
strain sensor were separated by approximately 3 cm, the strain
values were kept largely free of temperature effects, however,
there was some observed shift. Future clamps on TLP tendons or
risers will be placed away from known thermocline areas if
possible.
CONCLUSIONS This paper gives details on current progress on subsea
bonding, clamp design, and calibration of advanced sensors for
post-install applications. Significant progress has been made to
ruggedize and develop fiber optics for use in monitoring subsea
tie-backs from the well casing, at the well-head, along the flow-
line, and along critical parts of the riser. A discussion of the major
obstacles to post-installed systems include types of non-
penetrating sensors and bonding techniques to create Intelli-field
systems. These Intelli-field systems are a comprehensive
monitoring solution to sense, predict, and respond immediately
to anticipate issues before undesirable conditions arise.
Technology development for monitoring of subsea structures is
a task of the Clear Gulf study and a current phase is in testing
adequate coupling methods for sensor to the existing subsea
structures. The objectives of this study are to extend the service
life of equipment, gain new understanding of flow properties and
dynamics, prevent unplanned downtime, and detect problems
earlier and more accurately. These objectives are becoming
increasingly important as operations move to deepwater and
arctic regions.
ACKNOWLEDGMENTS The authors acknowledge the contributions of NASA
Johnson Space Center in Houston in generating the button pull
test results and the 3-D printing of the prototype clamps. Several
leading oil and gas companies have provided technical and
financial leadership in the Clear Gulf Joint Industry Project (JIP).
Founded in the fall of 2010, Clear Gulf JIP supports
extensive testing and further development of advanced
monitoring solutions, with critical input coming from experts at
NASA as well as leaders within the industry. The project’s
technical steering committee includes representatives from
participating companies. Participants are part of a high-profile
effort to enhance safety and reduce environmental risk. The
Clear Gulf steering committee will work with the Energy and
Commerce Committee of the U.S. House of Representatives, the
Bureau of Offshore Energy Management (BOEM), and the
Bureau of Safety and Environmental Enforcement to ensure that
systems support operators in meeting new offshore regulations.
REFERENCES
[1] Brower, D., Hedengren, J., Asgharzadeh Shishivan, R., and
Brower, A., 2013. “Advanced Deepwater Monitoring System”,
In Ocean, Offshore & Arctic Engineering OMAE, Nantes,
France, no. 10920.
[2] Kelly, J., and Hedengren, J., 2013. “A steady-state detection
(SSD) algorithm to detect non-stationary drifts in processes”.
Journal of Process Control, 23, 3, pp. 326–331, March 2013.
[3] Spivey, B., Hedengren, J., and Edgar, T., 2010. “Constrained
nonlinear estimation for industrial process fouling”. Industrial &
Engineering Chemistry Research, 49 (17), pp. 7824–7831, DOI:
10.1021/ie9018116.
[4] Hedengren, J., and Edgar, T., 2008. “Approximate nonlinear
model predictive control with in situ adaptive tabulation”.
Computers and Chemical Engineering, 32, pp. 706-714.
[5] Hedengren, J., 2014. “Advanced Process Monitoring” in
Optimization and Analytics in the Oil and Gas Industry, Eds.
Kevin C. Furman, Jin-Hwa Song, Amr El-Bakry, Springer’s
International Series in Operations Research and Management
Science.
[6] Powell, K., Hedengren, J., and Edgar, T. “Dynamic
optimization of a solar thermal energy storage system over a 24-
hour period using weather forecasts”, Proceedings of the
American Control Conference (ACC), Washington, DC, pp.
2952-2957.
[7] Jacobsen, L., Spivey, B., and Hedengren, J., 2013. “Model
predictive control with a rigorous model of a solid oxide fuel
cell”, Proceedings of the American Control Conference (ACC),
Washington, DC, pp. 3747–3752.
[8] Brower, D., and Prescott, C., 2004. “Real time subsea
monitoring and control smart field solutions”, Subsea Rio, 3 (1),
Rio de Janeiro, Brazil.
[9] Brower, D., Prescott, C., Zhang, J., Howerter, C., and
Rafferty, D., 2005. “Real-time flow assurance monitoring with
nonintrusive fiber optic technology”, Proceedings of the
Offshore Technology Conference, no. 17376.
[10] Lovchik, C., Diftler, M., 1999. “The Robonaut hand: a
dexterous robot hand for space,” Proceedings of IEEE
International Conference on Robotics and Automation, Vol. 2,
pp. 907-912.
[11] Brower, D. V., 2005. “Structural properties measurements
in deepwater oil and gas fields using an advanced fiber-optic

8 Copyright © 2014 by ASME
sensor monitoring system”, Society for the Advancement of
Material and Process Engineering (SAMPE).
[12] Brower, D., Abbassian, F., and Caballero, C., 2000. “Real-
time Fatigue Monitoring of Deepwater Risers Using Fiber-Optic
Sensors,” Proceedings of ETCE/OMAE2000 Joint Conference:
Energy for the New Millennium, New Orleans, LA. USA,
February 14-17.
[13] Brower, D., 2003. “Real-time fatigue monitoring of
deepwater drilling and oil production risers using fiber-optic
sensors”, Structural Health Monitoring Conference, Palo Alto,
CA.
[14] Brower, D., Hedengren, J., Loegering, C., Brower, A.,
Witherow, K., and Winter, K., 2012. “Fiber optic monitoring of
subsea equipment”. In Ocean, Offshore & Arctic Engineering
OMAE, Rio de Janiero, Brazil, no. 84143.
[15] Hedengren, J., Brower, D., and Mojica, J., 2012. “Advanced
process monitoring of flow assurance with fiber optics”. In
AIChE Spring Meeting.
[16] Glisic, B., and Inaudi, D., 2008. “Fibre optic methods for
structural health monitoring”, Wiley, West Sussex, England.
[17] Kersey, A., 2000. “Optical fiber sensors for permanent
downwell monitoring applications in the oil and gas industry”,
IEICE Trans. Electron., E83-C(3), March, pp. 400-404.
[18] Eisler, B., Lanan, G., Niklès, M., and Zuckerman, L., 2008.
“Distributed Fiber Optic Temperature Sensing System for
Burried Subsea Arctic Pipelines”, Proceedings of the Deep
Offshore Technology International Conference & Exhibition,
DOT’08, Houston, Texas.
[19] Ravet, F., Rochat, E., and Niklès, M., 2013. “Challenges,
requirements and advances for distributed fiber optic sensors in
surf structures and subsea well monitoring”, In Ocean, Offshore
& Arctic Engineering OMAE, Nantes, France, no. 10367.
[20] Decrin, M., Nebell, F., Naurois, H., and Parenteau, T., 2013.
“Flow assurance modelling using an electrical trace heated pipe-
in-pipe: from qualification to offshore testing”, Proceedings of
the Offshore Technology Conference, Houston, Texas, no.
24060.
[21] Kersey, A., Morey, W., and Berkoff, T., 1993. “Fiber-optic
Bragg grating strain sensor with drift-compensated high-
resolution interferometric wavelength-shift detection,” Opt. Lett.
18, pp. 72-74.
[22] Prescott, C., Zhang, J., and Brower, D., 2005. “An ambient
pressure insulated LNG pipeline for subsea environments”,
Proceedings of the Offshore Technology Conference, no. 17338.

9 Copyright © 2014 by ASME
ANNEX A
SUMMARY OF BUTTON PULL TEST DATA
A summary of the button test results is given below for each
of the pipe clamps. Clamps AA and BB are control samples.
Clamp AA was installed wet and clamp BB was installed dry. All
of the other clamps were installed under simulated subsea
conditions in an underwater dive tank. Clamp sensors A-E were
placed on a 14 ft section of pipe and subjected to repeated
bending tests. Clamps F and G were installed on 3 ft pipe
segments and subjected to tension and compression testing,
respectively.
Table A1. SUMMARY OF A-E TENSILE STRENGTH DATA
Table A2. SUMMARY OF F-G TENSILE STRENGTH DATA
The total number of pull button tests conducted was 239 with a
total of 142 good results. Sources of failed tests included tab
breaks that may indicate the tensile strength was very high due
to incomplete button cutting or a very strong bond. This is
evident with clamp BB that had the highest average tensile
strength and the highest number of tab breaks. There were also a
number of bad tests with various causes ranging from the button
pull mechanism to the button preparation. For each of the clamp
results, a minimum, maximum, average, and standard deviation
of the breaking strength are reported in units of psi. A
predominate adhesive failure mode is also reported as either the
polyurethane surface, steel surface, or mixed failure modes. This
indicates whether the failure was due to the bonding (steel
surface) or the strength of the polyurethane (poly surface).
Overall, the test results show excellent bonding even with
simulated subsea adhesion and after simulated aging tests. The
highest average tensile strength is observed with the control
sample (BB) at 292.0 psi. The lowest average tensile strength is
observed with the other control sample (AA) at 81.4 psi affixed
after the aging tests. The actual lowest required tensile strength
has not yet been determined but will be the subject of further
testing.
Clamp A Clamp B Clamp AA Clamp E Clamp BB Clamp C Clamp D Total
Total Number of Test Conducted 23 37 25 7 35 31 30 188
Number of Good Tests 20 24 13 4 18 18 15 112
Number of Tab Break Tests 2 11 11 1 17 12 13 67
Number of Bad Tests 1 2 1 2 0 1 2 9
Min. Breaking Strength (psi) 45.0 29.8 31.1 49.5 113.6 45.8 57.5
Max. Breaking Strength (psi) 155.8 503.3 193.5 150.8 498.6 267.9 358.7
Average Breaking Strength (psi) 94.0 174.1 81.4 91.1 292.0 142.5 136.3
Breaking Strength Standard Deviation
(psi)30.4 112.4 47.2 46.9 108.9 65.6 73.6
Predominate Adhesive Failure Mode Poly Surface Steel Surface Steel Surface Poly Surface Mixed Mixed Steel Surface
Clamp F Clamp G Total
Total Number of Test Conducted 22 29 51
Number of Good Tests 15 15 30
Number of Tab Break Tests 2 5 7
Number of Bad Tests 5 9 14
Min. Breaking Strength (psi) 33.6 29.7
Max. Breaking Strength (psi) 225.7 268.8
Average Breaking Strength (psi) 114.0 105.3
Breaking Strength Standard Deviation
(psi)53.7 59.8
Predominate Adhesive Failure Mode Steel Surface Poly Surface