NEVADA GROUND-WATER QUALITY - USGS · NEVADA Ground-Water Quality ... are Las Vegas Valley in the...
13
NEVADA GROUND-WATER QUALITY By James M. Thomas and Ray J. Hoff man U.S. Geological Survey Open-File Report 87-0738
Transcript of NEVADA GROUND-WATER QUALITY - USGS · NEVADA Ground-Water Quality ... are Las Vegas Valley in the...

NEVADA GROUND-WATER QUALITY
By James M. Thomas and Ray J. Hoff man
U.S. Geological Survey Open-File Report 87-0738
DEPARTMENT OF THE INTERIOR
DONALD PAUL MODEL, Secretary
U.S. GEOLOGICAL SURVEY
Dallas L. Peck, Director
For additional information: For sale by:
Chief Hydrologist U.S. Geological SurveyU.S. Geological Survey Books and Open-File Reports Section407 National Center Federal CenterReston, VA 22092 Box 25425
Denver, Colorado 80225
Use of trade names in this report is for descriptive purposes only and does not constitute endorsement by the U.S. Geological Survey
FOREWORD
This report contains summary information on ground-water quality in one of the 50
States, Puerto Rico, the Virgin Islands, or the Trust Territories of the Pacific Islands,
Saipan, Guam, and American Samoa. The material is extracted from the manuscript
of the 1986 National Water Summary, and with the exception of the illustrations,
which will be reproduced in multi-color in the 1986 National Water Summary, the
format and content of this report is identical to the State ground-water-quality
descriptions to be published in the 1986 National Water Summary. Release of this
information before formal publication in the 1986 National Water Summary
permits the earliest access by the public.
Contents
Ground-Water Quality ................................................... 1
Water-Quality in Principal Aquifers ....................................... 1
Background Water Quality .......................................... 1
Basin-Fill Aquifers ............................................. 1
Carbonate-Rock Aquifers ....................................... 2
Volcanic-Rock Aquifers ......................................... 2
Effects of Land Use on Water Quality ................................. 2
Waste Disposal ................................................ 2
Mining ....................................................... 3
Urbanization .................................................. 3
Potential for Water-Quality Changes ................................. 3
Ground-Water-Quality Management ...................................... 4
Selected References ..................................................... 4
Illustrations
Figure 1.--Selected geographic feature and 1985 population distribution in
Nevada. ...................................................... 5
Figure 2.--Principal aquifers and related water-quality data in Nevada. ....... 6
Figure 3.--Selected waste sites and ground-water quality information in
Nevada. ....................................................... 8
IV
NEVADA Ground-Water Quality
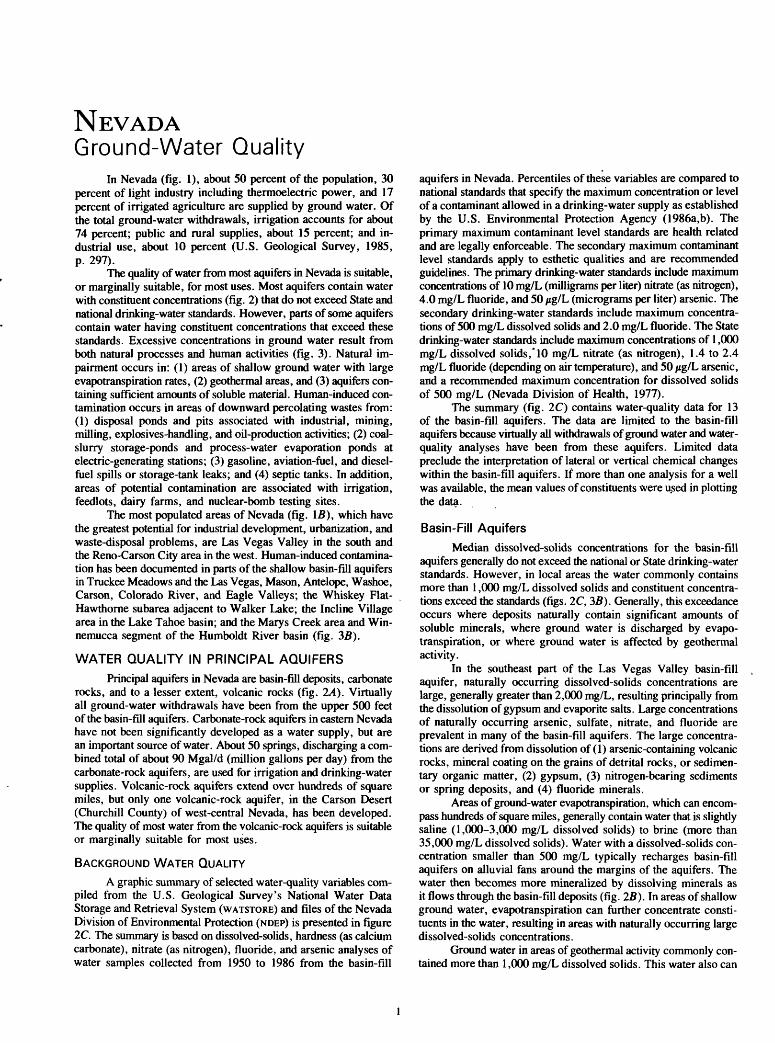
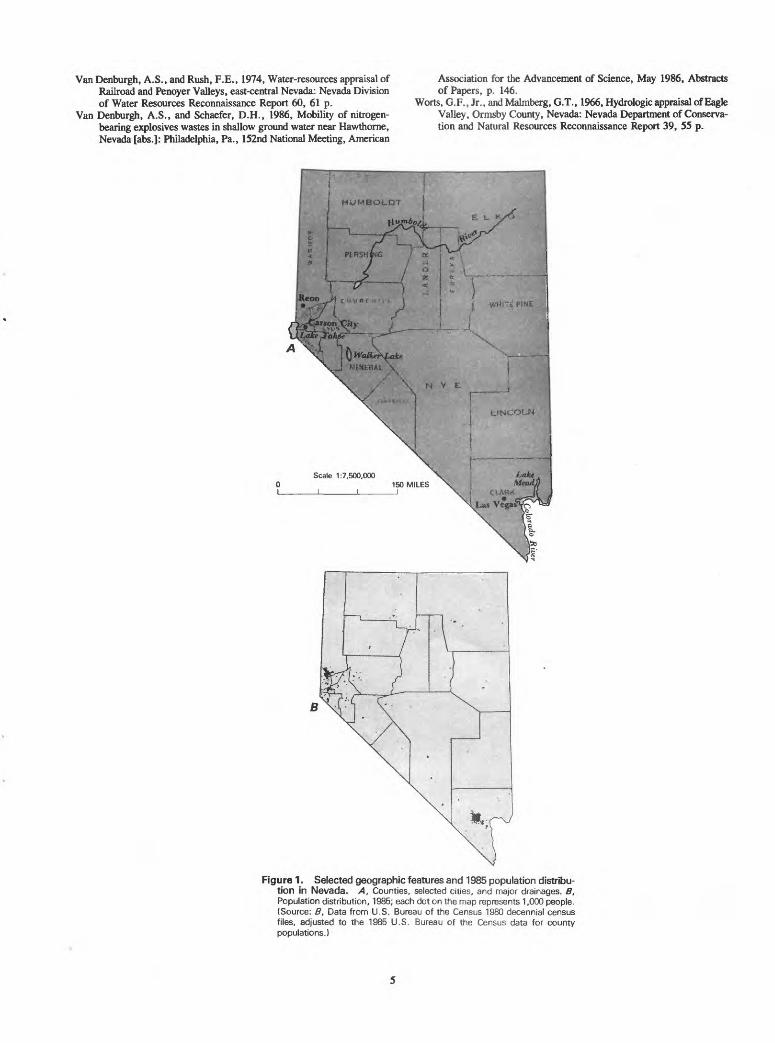
In Nevada (fig. 1), about 50 percent of the population, 30 percent of light industry including thermoelectric power, and 17 percent of irrigated agriculture are supplied by ground water. Of the total ground-water withdrawals, irrigation accounts for about 74 percent; public and rural supplies, about 15 percent; and in dustrial use, about 10 percent (U.S. Geological Survey, 1985, p. 297).
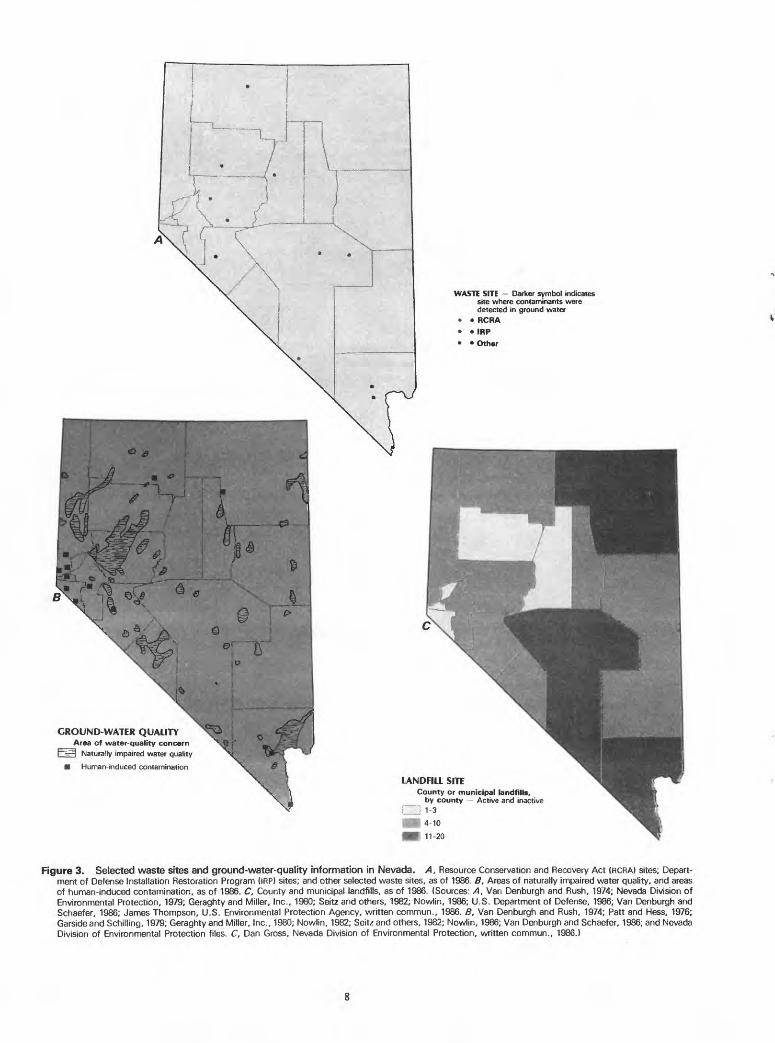
The quality of water from most aquifers in Nevada is suitable, or marginally suitable, for most uses. Most aquifers contain water with constituent concentrations (fig. 2) that do not exceed State and national drinking-water standards. However, parts of some aquifers contain water having constituent concentrations that exceed these standards. Excessive concentrations in ground water result from both natural processes and human activities (fig. 3). Natural im pairment occurs in: (1) areas of shallow ground water with large evapotranspiration rates, (2) geothermal areas, and (3) aquifers con taining sufficient amounts of soluble material. Human-induced con tamination occurs in areas of downward percolating wastes from: (1) disposal ponds and pits associated with industrial, mining, milling, explosives-handling, and oil-production activities; (2) coal- slurry storage-ponds and process-water evaporation ponds at electric-generating stations; (3) gasoline, aviation-fuel, and diesel- fuel spills or storage-tank leaks; and (4) septic tanks. In addition, areas of potential contamination are associated with irrigation, feedlots, dairy farms, and nuclear-bomb testing sites.
The most populated areas of Nevada (fig. IB), which have the greatest potential for industrial development, urbanization, and waste-disposal problems, are Las Vegas Valley in the south and the Reno-Carson City area in the west. Human-induced contamina tion has been documented in parts of the shallow basin-fill aquifers in Truckee Meadows and the Las Vegas, Mason, Antelope, Washoe, Carson, Colorado River, and Eagle Valleys; the Whiskey Flat- Hawthorne subarea adjacent to Walker Lake; the Incline Village area in the Lake Tahoe basin; and the Marys Creek area and Win- nemucca segment of the Humboldt River basin (fig. 3fl).
WATER QUALITY IN PRINCIPAL AQUIFERS
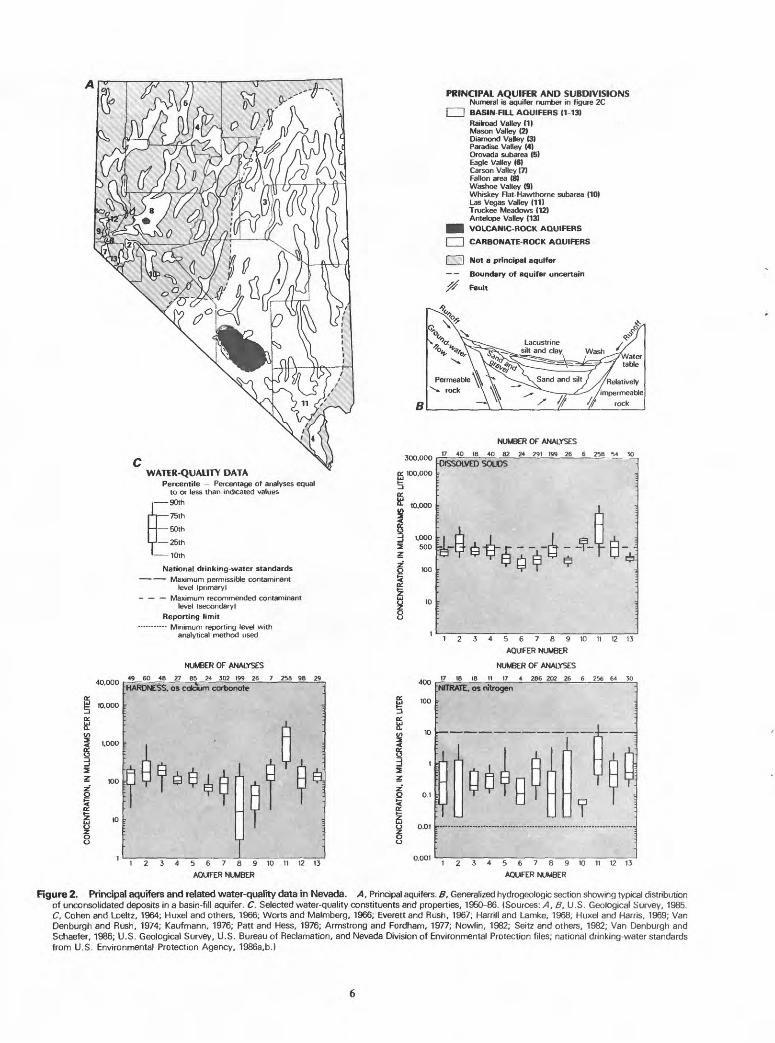
Principal aquifers in Nevada are basin-fill deposits, carbonate rocks, and to a lesser extent, volcanic rocks (fig. 2/4). Virtually all ground-water withdrawals have been from the upper 500 feet of the basin-fill aquifers. Carbonate-rock aquifers in eastern Nevada have not been significantly developed as a water supply, but are an important source of water. About 50 springs, discharging a com bined total of about 90 Mgal/d (million gallons per day) from the carbonate-rock aquifers, are used for irrigation and drinking-water supplies. Volcanic-rock aquifers extend over hundreds of square miles, but only one volcanic-rock aquifer, in the Carson Desert (Churchill County) of west-central Nevada, has been developed. The quality of most water from the volcanic-rock aquifers is suitable or marginally suitable for most uses.
BACKGROUND WATER QUALITYA graphic summary of selected water-quality variables com
piled from the U.S. Geological Survey's National Water Data Storage and Retrieval System (WATSTORE) and files of the Nevada Division of Environmental Protection (NDEP) is presented in figure 2C. The summary is based on dissolved-solids, hardness (as calcium carbonate), nitrate (as nitrogen), fluoride, and arsenic analyses of water samples collected from 1950 to 1986 from the basin-fill
aquifers in Nevada. Percentiles of these variables are compared to national standards that specify the maximum concentration or level of a contaminant allowed in a drinking-water supply as established by the U.S. Environmental Protection Agency (1986a,b). The primary maximum contaminant level standards are health related and are legally enforceable. The secondary maximum contaminant level standards apply to esthetic qualities and are recommended guidelines. The primary drinking-water standards include maximum concentrations of 10 mg/L (milligrams per liter) nitrate (as nitrogen), 4.0 mg/L fluoride, and 50 /ig/L (micrograms per liter) arsenic. The secondary drinking-water standards include maximum concentra tions of 500 mg/L dissolved solids and 2.0 mg/L fluoride. The State drinking-water standards include maximum concentrations of 1,000 mg/L dissolved solids,*10 mg/L nitrate (as nitrogen), 1.4 to 2.4 mg/L fluoride (depending on air temperature), and 50 /tg/L arsenic, and a recommended maximum concentration for dissolved solids of 500 mg/L (Nevada Division of Health, 1977).
The summary (fig. 2C) contains water-quality data for 13 of the basin-fill aquifers. The data are limited to the basin-fill aquifers because virtually all withdrawals of ground water and water- quality analyses have been from these aquifers. Limited data preclude the interpretation of lateral or vertical chemical changes within the basin-fill aquifers. If more than one analysis for a well was available, the mean values of constituents were used in plotting the data.
Basin-Fill Aquifers
Median dissolved-solids concentrations for the basin-fill aquifers generally do not exceed the national or State drinking-water standards. However, in local areas the water commonly contains more than 1,000 mg/L dissolved solids and constituent concentra tions exceed the standards (figs. 2C, 3B). Generally, this exceedance occurs where deposits naturally contain significant amounts of soluble minerals, where ground water is discharged by evapo transpiration, or where ground water is affected by geothermal activity.
In the southeast part of the Las Vegas Valley basin-fill aquifer, naturally occurring dissolved-solids concentrations are large, generally greater than 2,000 mg/L, resulting principally from the dissolution of gypsum and evaporite salts. Large concentrations of naturally occurring arsenic, sulfate, nitrate, and fluoride are prevalent in many of the basin-fill aquifers. The large concentra tions are derived from dissolution of (1) arsenic-containing volcanic rocks, mineral coating on the grains of detrital rocks, or sedimen tary organic matter, (2) gypsum, (3) nitrogen-bearing sediments or spring deposits, and (4) fluoride minerals.
Areas of ground-water evapotranspiration, which can encom pass hundreds of square miles, generally contain water that is slightly saline (1,000-3,000 mg/L dissolved solids) to brine (more than 35,000 mg/L dissolved solids). Water with a dissolved-solids con centration smaller than 500 mg/L typically recharges basin-fill aquifers on alluvial fans around the margins of the aquifers. The water then becomes more mineralized by dissolving minerals as it flows through the basin-fill deposits (fig. 2B). In areas of shallow ground water, evapotranspiration can further concentrate consti tuents in the water, resulting in areas with naturally occurring large dissolved-solids concentrations.
Ground water in areas of geothermal activity commonly con tained more than 1,000 mg/L dissolved solids. This water also can

contain fluoride concentrations that exceed national drinking-water standards, and excessive concentrations of arsenic and boron.
Hardness of water in the basin-fill aquifers ranged from soft (less than 60 mg/L) to very hard (more than 180 mg/L; fig. 2C). Water hardness, a function of calcium and magnesium concentra tions, is derived primarily from natural processes, such as dissolu tion of limestone, dolomite, or calcium-rich volcanic rocks.
No median concentrations of nitrate exceeded the national drinking-water standard. However, nitrate concentrations in ground water have been increased locally by natural sources, such as solu tion of minerals that contain nitrogen, or percolation of water through organic material (Patt and Hess, 1976). The Las Vegas Valley basin-fill aquifer contains water suitable for most uses. However, in the southeastern part and in a small area (7 square miles) in the north-central part of the aquifer (fig. 35), naturally occurring nitrate concentrations exceed 300 mg/L (Patt and Hess, 1976).
Median fluoride concentrations, which range from 0. 1 to 2.4 mg/L in the basin-fill aquifers, do not exceed the national drinking- water standard (4.0 mg/L). However, maximum concentrations did exceed the drinking-water standard in some water from 8 of the 13 basin-fill aquifers. Most of the fluoride is probably from dissolu tion of fluoride-bearing rocks.
Arsenic concentrations exceeded the drinking-water standard (50 /ig/L) in parts of all the basin-fill aquifers sampled (fig. 2C). Naturally occurring arsenic concentrations exceeding 50 /ig/L com monly are associated with geothermal waters and alluvial-lacustrine and volcanic deposits.
Carbonate-Rock Aquifers
Water quality in the carbonate-rock aquifers is suitable for most uses. Water from the springs in eastern Nevada generally is hard (121-180 mg/L as calcium carbonate) to very hard (more man 180 mg/L), owing to the dissolution of carbonate minerals. Dissolved-solids concentrations in carbonate-rock aquifers do not exceed the State drinking-water standard of 1,000 mg/L.
Volcanic-Rock Aquifers
Water in the volcanic-rock aquifer in the Carson Desert of west-central Nevada is suitable for most uses. However, arsenic concentrations are large, ranging from 73 to 140 /ig/L. These con centrations exceed the national primary drinking-water standard of 50
EFFECTS OF LAND USE ON WATER QUALITYWater in some of the basin-fill aquifers has been contaminated
by downward percolation of industrial wastes, milling- waste fluids, explosives wastes, possibly oil-well brines from disposal ponds or pits, coal-slurry storage ponds, and process- water evaporation ponds at electric-generating stations. Excessive leakage or spills of gasoline, diesel fuel, and aviation fuel from storage tanks and con tamination by effluents from septic-tank systems have contributed to the contamination of water in some of the basin-fill aquifers.
Waste DisposalNevada has one operating low-level waste-disposal site near
Beatty (Nye County), three commercial facilities at an industrial complex near Henderson (Clark County) that are either closed or in the process of being closed, and an Army ammunition plant at Hawthorne (Mineral County) that require monitoring of ground- water quality under the Federal Resource Conservation and Recovery Act (RCRA) of 1976 (James Thompson, U.S. Environmen tal Protection Agency, written commun., 1986). In addition, the State has: a military hazardous- waste area at Nellis Air Force Base in Las Vegas Valley (U.S. Department of Defense, 1986), the
Nevada Test Site for nuclear-bomb testing in southern Nevada (fig. 35), two sites in central Nevada where underground nuclear tests were conducted, four pesticide-disposal sites, industrial waste- disposal sites in the Las Vegas and Carson Valleys, previously used settling ponds for oil-well brine in Railroad Valley, an electric- generating station with process-water evaporation ponds and coal- slurry storage ponds in the Colorado River valley, and 107 land fills (figs. 3A, 3C). For these areas, minimal information is available on the quality of ground water, mainly because of a lack of wells. As a result, only the industrial sites in southeastern Las Vegas Valley and Carson Valley; the fluid-disposal pits for explosives wastes associated with shell- and bomb-casing cleaning in the Whiskey Flat- Hawthorne subarea near Walker Lake; and the process-water evaporation ponds and coal-slurry storage ponds in the Colorado River valley have documented ground-water contamination (Geraghty and Miller, Inc., 1980; Harding-Lawson Associates, 1986; Dan Gross and Doug Zimmerman, Nevada Division of En vironmental Protection, written commun., 1986; and U.S. Bureau of Reclamation, unpublished data on file in the U.S. Geological Survey office, Carson City, Nevada).
As of September 1985, 16 hazardous-waste sites at 2 facilities in Nevada, including the site at Nellis Air Force Base, had been identified by the U.S. Department of Defense (DOD) as part of their Installation Restoration Program (IRP) as having potential for con tamination (U.S. Department of Defense, 1986). The IRP, established in 1976, parallels the U.S. Environmental Protection Agency (EPA) Superfimd program under the Comprehensive En vironmental Response, Compensation, and Liability Act (CERCLA) of 1980. The EPA presently ranks these sites under the hazard ranking system and may include them in the National Priorities List (NPL). Of the 16 sites in the program, 5 sites contained contaminants but did not present a hazard to the environment. One IRP site at one facility (fig. 3A) was considered to present a hazard signifi cant enough to warrant response action in accordance with CERCLA. The remaining sites were scheduled for confirmation studies to deter mine if remedial action is required.
Contamination from an industrial site at Henderson near Las Vegas has increased the dissolved-solids concentrations in the Las Vegas Valley basin-fill aquifer to about 10,000 mg/L near the site (Dave Hemphill, U.S. Bureau of Reclamation, written commun., 1986). The increase is due mainly to leakage of industrial organic compounds primarily benzene, chlorinated benzene compounds, trichloromethane (chloroform), and organophosphates from the industrial site into the aquifer. Dithioic acids and hexachloro- cyclohexane (BHC) also have been detected in the ground water at the site (Geraghty and Miller, Inc., 1980). In addition, organic com pounds, primarily benzene with dissolved organophosphates, are present both floating at the top of the water table and at the bot tom of wells because of the differences in densities of the associated fluids. The layer of organic compounds is about 2 to 5 feet thick in three wells near the organophosphate waste ponds and contains as much as 530,000 mg/L benzene and 54,000 mg/L car- bophenothion (Geraghty and Miller, Inc., 1980). The compounds are principally from a 30,000-gallon leak of benzene from an underground storage tank that occurred in 1976. The benzene subse quently migrated downgradient beneath the organophosphate waste ponds, dissolving the downward-percolating organophosphate com pounds. By 1980, the benzene had migrated between 3,000 and 5,000 feet downgradient from the tank (Geraghty and Miller, Inc., 1980). Chromium concentrations as large as 90,000 /ig/L also are present at the site from leakage of processing fluids (Dan Gross, Nevada Division of Environmental Protection, written commun., 1986).
Traces of trichloroethylene (TCE); 1,1,1 trichloroethane (1,1,1-TCA); 1,1,2 trichloroethane and 1,2,2 trifluoroethane (Freon 113); and 1,1 dichloroethylene (1, I-DCE) have been detected in water
in the Carson Valley basin-fill aquifer (Dan Gross, Nevada Divi sion of Environmental Protection, written commun., 1986). These organic compounds apparently have percolated into the aquifer from a nearby industrial site.
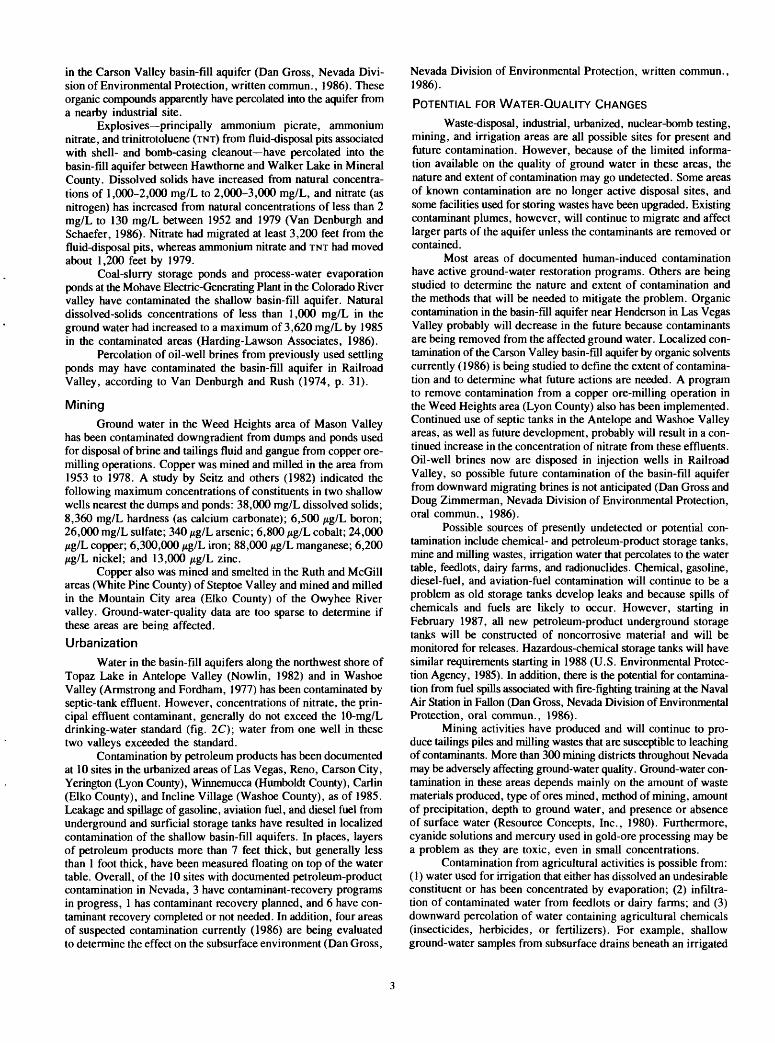
Explosives principally ammonium picrate, ammonium nitrate, and trinitrotoluene (TNT) from fluid-disposal pits associated with shell- and bomb-casing cleanout have percolated into the basin-fill aquifer between Hawthorne and Walker Lake in Mineral County. Dissolved solids have increased from natural concentra tions of 1,000-2,000 mg/L to 2,000-3,000 mg/L, and nitrate (as nitrogen) has increased from natural concentrations of less than 2 mg/L to 130 mg/L between 1952 and 1979 (Van Denburgh and Schaefer, 1986). Nitrate had migrated at least 3,200 feet from the fluid-disposal pits, whereas ammonium nitrate and TNT had moved about 1,200 feet by 1979.
Coal-slurry storage ponds and process-water evaporation ponds at the Mohave Electric-Generating Plant in the Colorado River valley have contaminated the shallow basin-fill aquifer. Natural dissolved-solids concentrations of less than 1,000 mg/L in the ground water had increased to a maximum of 3,620 mg/L by 1985 in the contaminated areas (Harding-Lawson Associates, 1986).
Percolation of oil-well brines from previously used settling ponds may have contaminated the basin-fill aquifer in Railroad Valley, according to Van Denburgh and Rush (1974, p. 31).
Mining
Ground water in the Weed Heights area of Mason Valley has been contaminated downgradient from dumps and ponds used for disposal of brine and tailings fluid and gangue from copper ore- milling operations. Copper was mined and milled in the area from 1953 to 1978. A study by Seitz and others (1982) indicated the following maximum concentrations of constituents in two shallow wells nearest the dumps and ponds: 38,000 mg/L dissolved solids; 8,360 mg/L hardness (as calcium carbonate); 6,500 /ig/L boron; 26,000 mg/L sulfate; 340 /*g/L arsenic; 6,800 /*g/L cobalt; 24,000 /ig/L copper; 6,300,000 /ig/L iron; 88,000 /tg/L manganese; 6,200 /ig/L nickel; and 13,000 /ig/L zinc.
Copper also was mined and smelted in the Ruth and McGill areas (White Pine County) of Steptoe Valley and mined and milled in the Mountain City area (Elko County) of the Owyhee River valley. Ground-water-quality data are too sparse to determine if these areas are being affected.
Urbanization
Water in the basin-fill aquifers along the northwest shore of Topaz Lake in Antelope Valley (Nowlin, 1982) and in Washoe Valley (Armstrong and Fordham, 1977) has been contaminated by septic-tank effluent. However, concentrations of nitrate, the prin cipal effluent contaminant, generally do not exceed the 10-mg/L drinking-water standard (fig. 2C); water from one well in these two valleys exceeded the standard.
Contamination by petroleum products has been documented at 10 sites in the urbanized areas of Las Vegas, Reno, Carson City, Yerington (Lyon County), Winnemucca (Humboldt County), Carlin (Elko County), and Incline Village (Washoe County), as of 1985. Leakage and spillage of gasoline, aviation fuel, and diesel fuel from underground and surficial storage tanks have resulted in localized contamination of the shallow basin-fill aquifers. In places, layers of petroleum products more than 7 feet thick, but generally less than 1 foot thick, have been measured floating on top of the water table. Overall, of the 10 sites with documented petroleum-product contamination in Nevada, 3 have contaminant-recovery programs in progress, 1 has contaminant recovery planned, and 6 have con taminant recovery completed or not needed. In addition, four areas of suspected contamination currently (1986) are being evaluated to determine the effect on the subsurface environment (Dan Gross,
Nevada Division of Environmental Protection, written commun., 1986).
POTENTIAL FOR WATER-QUALITY CHANGESWaste-disposal, industrial, urbanized, nuclear-bomb testing,
mining, and irrigation areas are all possible sites for present and future contamination. However, because of the limited informa tion available on the quality of ground water in these areas, the nature and extent of contamination may go undetected. Some areas of known contamination are no longer active disposal sites, and some facilities used for storing wastes have been upgraded. Existing contaminant plumes, however, will continue to migrate and affect larger parts of the aquifer unless the contaminants are removed or contained.
Most areas of documented human-induced contamination have active ground-water restoration programs. Others are being studied to determine the nature and extent of contamination and the methods that will be needed to mitigate the problem. Organic contamination in the basin-fill aquifer near Henderson in Las Vegas Valley probably will decrease in the future because contaminants are being removed from the affected ground water. Localized con tamination of the Carson Valley basin-fill aquifer by organic solvents currently (1986) is being studied to define the extent of contamina tion and to determine what future actions are needed. A program to remove contamination from a copper ore-milling operation in the Weed Heights area (Lyon County) also has been implemented. Continued use of septic tanks in the Antelope and Washoe Valley areas, as well as future development, probably will result in a con tinued increase in the concentration of nitrate from these effluents. Oil-well brines now are disposed in injection wells in Railroad Valley, so possible future contamination of the basin-fill aquifer from downward migrating brines is not anticipated (Dan Gross and Doug Zimmerman, Nevada Division of Environmental Protection, oral commun., 1986).
Possible sources of presently undetected or potential con tamination include chemical- and petroleum-product storage tanks, mine and milling wastes, irrigation water that percolates to the water table, feedlots, dairy farms, and radionuclides. Chemical, gasoline, diesel-fuel, and aviation-fuel contamination will continue to be a problem as old storage tanks develop leaks and because spills of chemicals and fuels are likely to occur. However, starting in February 1987, all new petroleum-product underground storage tanks will be constructed of noncorrosive material and will be monitored for releases. Hazardous-chemical storage tanks will have similar requirements starting in 1988 (U.S. Environmental Protec tion Agency, 1985). In addition, there is the potential for contamina tion from fuel spills associated with fire-fighting training at the Naval Air Station in Fallen (Dan Gross, Nevada Division of Environmental Protection, oral commun., 1986).
Mining activities have produced and will continue to pro duce tailings piles and milling wastes that are susceptible to leaching of contaminants. More than 300 mining districts throughout Nevada may be adversely affecting ground-water quality. Ground-water con tamination in these areas depends mainly on the amount of waste materials produced, type of ores mined, method of mining, amount of precipitation, depth to ground water, and presence or absence of surface water (Resource Concepts, Inc., 1980). Furthermore, cyanide solutions and mercury used in gold-ore processing may be a problem as they are toxic, even in small concentrations.
Contamination from agricultural activities is possible from: (1) water used for irrigation that either has dissolved an undesirable constituent or has been concentrated by evaporation; (2) infiltra tion of contaminated water from feedlots or dairy farms; and (3) downward percolation of water containing agricultural chemicals (insecticides, herbicides, or fertilizers). For example, shallow ground-water samples from subsurface drains beneath an irrigated
field at Fallen (Churchill County) contain large arsenic concentra tions (maximum of 950 /tg/L) derived from the soil as the irriga tion water percolated to the shallow water table (Doug Zimmer- man, Nevada Division of Environmental Protection, written com- mun., 1986).
Radionuclides from nuclear-weapon detonations beneath the Nevada Test Site in southern Nevada, Hot Creek valley (Nye County), and the Sand Springs Range (Churchill and Mineral Counties) in central Nevada may migrate into the basin-fill aquifers in the future. In addition, the Nevada Test Site is one of the areas that is being considered as a national repository for the underground storage of high-level radioactive wastes.
GROUND-WATER-QUALITY MANAGEMENT
Ground-water quality is regulated by the NDEP, but is monitored by several State and Federal agencies. The Department may require ground-water monitoring for ground-water permits issued for industrial plants, land applications of sewage effluent, and geothermal injection wells. In addition, in 1987 the Depart ment will assume responsibility for oil and gas injection wells, which currently are monitored by the EPA, and for issuing permits for zero- discharge heap-leaching operations. Ground-water monitoring also may be required in response to suspected contamination, such as mining sites or leaking fuel tanks (Dan Gross, Nevada Division of Environmental Protection, oral commun., 1986).
The State Health Division, Bureau of Consumer Health Pro tection Services, monitors ground-water quality for public and rural systems, and also monitors quality with regard to the approval of water supply and waste-water disposal facilities for subdivisions and developments, in all counties except Clark and Washoe. Clark and Washoe Counties have their own monitoring programs. All community water systems are required to monitor system water periodically for contaminants regulated under the Federal Safe Drinking Water Act and State law. Amendments to the Safe Drinking Water Act in 1986 will require monitoring of 83 addi tional constituents, including 14 volatile organic compounds, 29 synthetic organic chemicals, 13 inorganic chemicals, 4 microbiological contaminants, and 2 radiological contaminants (Thompson, 1986).
Radionuclide migration and ground-water quality are being monitored where underground nuclear device testing has been con ducted in Nevada. These locations include the Nevada Test Site and surrounding areas, the Hot Creek Valley area, and the Sand Springs Range area. The monitoring program was initiated in 1972. Under a Memorandum of Understanding with the DOD, the EPA'S laboratory in Las Vegas has operated the monitoring program to evaluate possible movement of radionuclides from the nuclear-test sites. The network consists of 22 monthly, 23 semi-annual, and 22 annual stations (Nowlin, 1986).
The U.S. Department of Agriculture makes random checks on pesticide disposal during use inspections, and any violations of pesticide-management laws are referred to the NDEP. The Nevada Department of Minerals regulates permitting for well construction relating to oil, gas, and geothermal wells. The Nevada Division of Water Resources regulates geothermal wells with regard to water rights and well construction (Dan Gross, Nevada Division of En vironmental Protection, oral commun., 1986).
SELECTED REFERENCES
Armstrong, A.T., and Fordham, J.W., 1977, Investigation of ground-water quality and its effect on suburban development in Washoe Valley, Nevada: University of Nevada, Desert Research Institute Project Report 48, 60 p.
Cohen, Philip, and Loeltz, O.J., 1964, Evaluation of hydrogeology and hydrogeochemistry of Truckee Meadows area, Washoe County, Nevada: U.S. Geological Survey Water-Supply Paper 1770-S, 63 p.
Everett, D.E., and Rush, F.E., 1967, A brief appraisal of the water resources of the Walker Lake area, Mineral, Lyon, and Churchill Counties, Nevada: Nevada Department of Conservation and Natural Resources Reconnaissance Report 40, 44 p.
Garside, L.J., and Schilling, J.H., 1979, Thermal waters of Nevada: Nevada Bureau of Mines and Geology Bulletin 91, 13 p.
Geraghty and Miller, Inc., 1980, Ground-water investigation, Stauffer Chemical Company, Henderson, Nevada: Syosset, New York, 42 p.
Glancy, P. A., 1986, Geohydrology of the basalt and unconsolidated sedi mentary aquifers in the Fallen area, Churchill County, Nevada: U.S. Geological Survey Water-Supply Paper 2263, 62 p.
Harding-Lawson Associates, 1986, Hydrogeologic assessment report, Mohave Generating Station, Laughlin, Nevada: Tustin, California, v. 1, 81 p.
Harrill, J.R., and Lamke, R.D., 1968, Hydrologic response to irrigation pumping in Diamond Valley, Eureka and Elko Counties, Nevada, 1950-65: Nevada Department of Conservation and Natural Resources Bulletin 35, 85 p.
Huxel, C.J., Jr., and Harris, E.E., 1969, Water resources and develop ment in Mason Valley, Lyon and Mineral Counties, Nevada, 1948-65: Nevada Division of Water Resources Bulletin 38, 77 p.
Huxel, C.J., Jr., Parkes, J.E., and Everett, D.E., 1966, Effects of irriga tion development on the water supply of Quinn River Valley area, Nevada and Oregon, 1950-64: Nevada Department of Conservation and Natural Resources Bulletin 34, 80 p.
Kaufmann, R.F., 1976, Land and water use effects on ground-water qual ity in Las Vegas Valley: University of Nevada, Desert Research In stitute Project Report 47A, 215 p.
Nevada Division of Environmental Protection, 1979, Surface impoundment assessment final report: Nevada Department of Conservation and Natural Resources, 76 p.
Nevada Division of Health, 1977, Water supply regulations, Part 1. Water quality standards Monitoring, record keeping, and reporting: Nevada Bureau of Consumer Health Protection Services, 17 p.
Nowlin, J.N., 1982, Ground-water levels and water quality in an area near Topaz Lake, Douglas County, Nevada: U.S. Geological Survey Open- File Report 80-2046, 76 p.
___ 1986, Ground-water quality in Nevada A proposed monitoring pro gram: U.S. Geological Survey Open-File Report 78-768, 235 p.
Patt, R.O., and Hess, J. W., 1976, Characterization of nitrogen sources con taminating shallow ground water in an arid basin, Las Vegas area, Nevada: University of Nevada, Desert Research Institute Technical Report H-W 26, 44 p.
Resource Concepts, Inc., 1980, Ground-water pollution potential An analysis of mining districts in Nevada: Carson City, Nevada, 39 p.
Seitz, H.R., Van Denburgh, A.S., and La Camera, R.J., 1982, Ground- water quality downgradient from copper-ore milling wastes at Weed Heights, Lyon County, Nevada: U.S. Geological Survey Open-File Report 80-1217, 48 p.
Thompson, J.C., 1986, The Safe Drinking Water Act A summary of amendments to the Safe Drinking Water Act and revisions of the drink ing water regulations: Public Works, September, p. 123-125, 184-188.
U.S. Department of Defense, 1986, Status of the Department of Defense Installation Restoration Program Information paper: Washington, D.C., U.S. Department of Defense, Office of the Assistant Secretary of Defense (Acquisition and Logistics), Environmental Policy Direc torate, February, 35 p.
U.S. Environmental Protection Agency, 1985, Underground storage tanks (UST) The new federal law: Pamphlet, 4 p.
___ 1986a, Maximum contaminant levels (subpart B of part 141, Na tional interim primary drinking-water regulations): U.S. Code of Federal Regulations, Title 40, Parts 100 to 149, revised July 1, 1986, p. 524-528.
___ 1986b, Secondary maximum contaminant levels (section 143.3 of part 143, national secondary drinking-water regulations): U.S. Code of Federal Regulations, Title 40, Parts 100 to 149, revised July 1, 1986, p. 587-590.
___ 1986c, Amendment to National Oil and Hazardous Substances Contingency Plan; national priorities list, final rule and proposed rule: Federal Register, v. 51, no. Ill, June 10, 1986, p. 21053-21112.
U.S. Geological Survey, 1985, National water summary 1984 Hydrologic events, selected water-quality trends, and ground-water resources: U.S. Geological Survey Water-Supply Paper 2275, 467 p.
Van Denburgh, A.S., and Rush, F.E., 1974, Water-resources appraisal of Railroad and Penoyer Valleys, east-central Nevada: Nevada Division of Water Resources Reconnaissance Report 60, 61 p.
Van Denburgh, A.S., and Schaefer, D.H., 1986, MobDity of nitrogen- bearing explosives wastes in shallow ground water near Hawthorne, Nevada [abs.]: Philadelphia, Pa., 152nd National Meeting, American
Association for the Advancement of Science, May 1986, Abstracts of Papers, p. 146.
Worts, G.F., Jr., and Malmberg, G.T., 1966, Hydrologic appraisal of Eagle Valley, Ormsby County, Nevada: Nevada Department of Conserva tion and Natural Resources Reconnaissance Report 39, 55 p.
Figure 1. Selected geographic features and 1985 population distribu tion in Nevada. A. Counties, selected cities, and major drainages. B. Population distribution, 1985, each dot on the map represents 1,000 people. (Source: B. Data from U.S. Bureau of the Census 1980 decennial census files, adjusted to the 1985 U.S. Bureau of the Census data for county populations.)
PRINCIPAL AQUIFER AND SUBDIVISIONS___ Numeral is aquifer number in figure 2C I | BASIN-FILL AQUIFERS (1-13)
Railroad Valley (1)Mason Valley (2)Diamond Valley (3)Paradise Valley (4)Orovada subarea (5)Eagle Valley (6)Carson Valley (7)Fallen area (8)Washoe Valley (9)Whiskey Flat-Hawthorne subarea (10)Las Vegas Valley (11)Truckee Meadows (12)
___ Antelope Valley (13) H VOLCANIC-ROCK AQUIFERS
| | CARBONATE-ROCK AQUIFERS
[_ | Not a principal aquifer
Boundary of aquifer uncertain
# Fault
B
rater table
Relativelyimpermeable)
rock
WATER-QUALITY DATAPercentile Percentage of analyses equal
to or less than indicated values -90th
75th
10th
National drinking-water standards Maximum permissible contaminant
level I primary I Maximum recommended contaminant
level 'secondary! Reporting limit
....... Minimum reporting level withanalytical method used
J 1.000 51 500z
O 100
IB .0
NUMBER OF ANALYSES
17 40 18 40 82 24 291 199 26 6 258 54 30
DISSOLVED SOLOS
6°
NUMBER OF ANALYSES
3°240000 i - T HARDNESS. OS cotcium corbonote
10.000
* 100z
1 2 3 4 5 6 7 8 9 10 11 12 13
AQUIFER NUMBER
NUMBER OF ANALYSES
17 18 18 11 17 4 286 202 26 6 256 64 30
;NfTRATE. os nitrogen
2 3 4 5 6 7 8 9 10 11 12 13
AQUIFER NUMBER
1 2 3 4 5 6 7 8 9 10 11 12 13
AQUIFER NUMBER
Figure 2. Principal aquifers and related water-quality data in Nevada. A, Principal aquifers. B. Generalized hydrogeologic section showing typical distribution of unconsolidated deposits in a basin-fill aquifer. C. Selected water-quality constituents and properties, 1950-86. (Sources: A, B, U.S. Geological Survey, 1985. C. Cohen and Loeltz, 1964; Huxel and others, 1966; Worts and Malmberg, 1966; Everett and Rush, 1967; Harrill and Lamke, 1968; Huxel and Harris, 1969; Van Denburgh and Rush, 1974; Kaufmann, 1976; Patt and Hess, 1976; Armstrong and Fordham, 1977; Nowlin, 1982; Seitz and others, 1982; Van Denburgh and Schaefer, 1986; U.S. Geological Survey, U.S. Bureau of Reclamation, and Nevada Division of Environmental Protection files; national drinking-water standards from U.S. Environmental Protection Agency, 1986a,b.)

CO
NC
ENTR
ATIO
N.
IN M
CR
OC
RA
MS
PER
LIT
ERC
ON
CEN
TRAT
ION
. IN
MIL
LIG
RAM
S PE
R LI
TER
_
NJ
*
O
WASTE SITE - Darker symbol indicates site where contaminants were detected in ground water
RCRA »IRP « Other
GROUND-WATER QUALITY__Area of water-quality concernIr^^ Naturally impaired water quality
Human-induced contamination
LANDFILL SITECounty or municipal landfills,
__ by county Active and inactiveC53 1-3 IBI 4~ 10 ^B 11-20
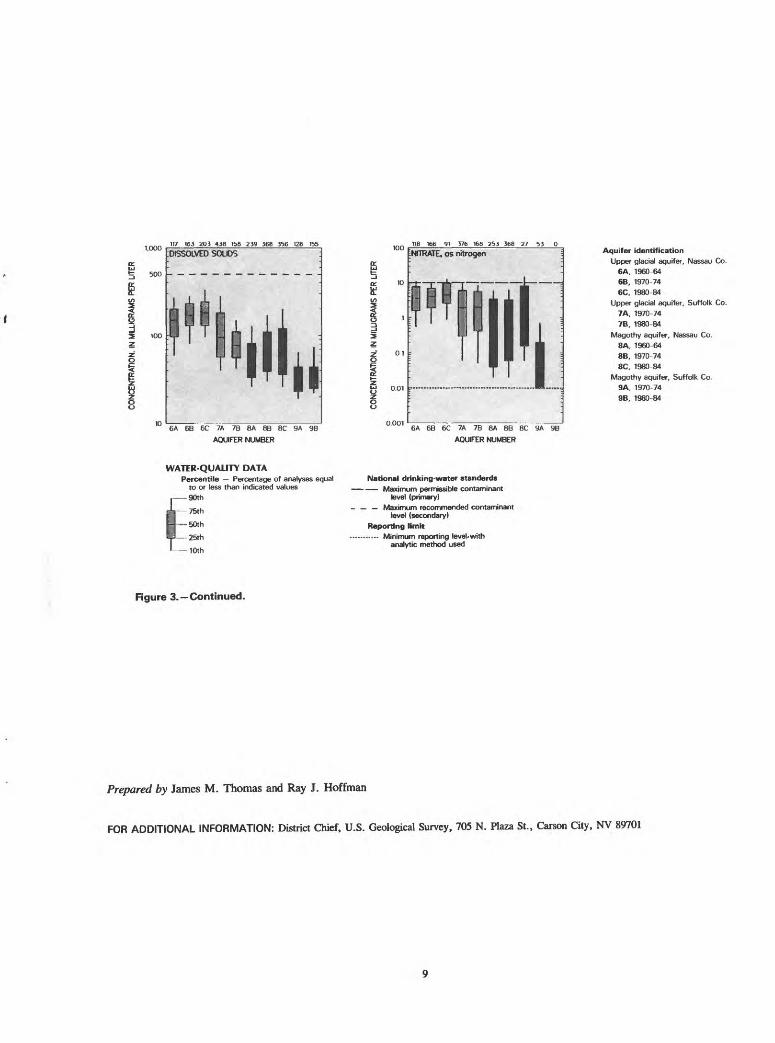
Figure 3. Selected waste sites and ground-water-quality information in Nevada. A, Resource Conservation and Recovery Act (RCRA) sites; Depart ment of Defense Installation Restoration Program (IRP) sites; and other selected waste sites, as of 1986. B, Areas of naturally impaired water quality, and areas of human-induced contamination, as of 1986. C, County and municipal landfills, as of 1986. (Sources: A. Van Denburgh and Rush, 1974; Nevada Division of Environmental Protection, 1979; Geraghty and Miller, Inc.. 1980; Seitz and others, 1982; Nowlin, 1986; U.S. Department of Defense, 1986; Van Denburgh and Schaefer, 1986; James Thompson, U.S. Environmental Protection Agency, written commun., 1986. B. Van Denburgh and Rush, 1974; Patt and Hess, 1976; Garside and Schilling, 1979; Geraghty and Miller, Inc., 1980; Nowlin, 1982; Seitz and others, 1982; Nowlin, 1986; Van Denburgh and Schaefer, 1986; and Nevada Division of Environmental Protection files. C, Dan Gross, Nevada Division of Environmental Protection, written commun., 1986.)
117 163 203 438 158 239 368 356 128 155
:DtSSOLVED SOLIDS
E '
118 166 91 376 168 253 368 27 53 0
NITRATE, os nitrogen
6A 6B 6C 7A 7B 8A 8B 8C 9A 9B
AQUIFER NUMBER
6A 6B 6C 7A 7B 8A 8B 8C 9A 9B
AQUIFER NUMBER
Aquifer identificationUpper glacial aquifer, Nassau Co.
6A. 1960-646B, 1970-746C. 1980-84
Upper glacial aquifer. Suffolk Co.
7A, 1970-747B. 1980-84
Magothy aquifer. Nassau Co.
8A, 1960-648B, 1970-748C. 1980 84
Magothy aquifer. Suffolk Co.9A. 1970-74
SB, 1980-84
WATER-QUALITY DATAPercentile Percentage of analyses equal
to or less than indicated values -90th
National drinking-water standerds- Maximum permissible contaminant
level (primary)- Maximum recommended contaminant
level (secondary) Reporting limit
- - Minimum reporting level-with analytic method used
Figure 3. Continued.
Prepared by James M. Thomas and Ray J. Hoffman
FOR ADDITIONAL INFORMATION: District Chief, U.S. Geological Survey, 705 N. Plaza St., Carson City, NV 89701