Neuronal gamma-band synchronization regulated by ... fileNeuronal gamma-band synchronization...
26
Neuronal gamma-band synchronization regulated by instantaneous modulations of the oscillation frequency Authors: E. Lowet 1 *, M.J. Roberts 1 , A. Peter 2 , B. Gips 3 , P. De Weerd 1 Affiliations: 1 Psychology and Neuroscience, Maastricht University, Maastricht, The Netherlands 2 Ernst Strüngmann Institute (ESI) for Neuroscience in Cooperation with Max Planck Society, Frankfurt, Germany 3 Donders Institute for Brain, Cognition and Behaviour, Radboud University Nijmegen, Nijmegen, The Netherlands *Correspondence to: [email protected] Neuronal gamma-band synchronization shapes information flow during sensory and cognitive processing. A common view is that a stable and shared frequency over time is required for robust and functional synchronization. To the contrary, we found that non- stationary instantaneous frequency modulations were essential for synchronization. First, we recorded gamma rhythms in monkey visual area V1, and found that they synchronized by continuously modulating their frequency difference in a phase-dependent manner. The frequency modulation properties regulated both the phase-locking and the preferred phase-relation between gamma rhythms. Second, our experimental observations were in agreement with a biophysical model of gamma rhythms and were accurately predicted by the theory of weakly coupled oscillators revealing the underlying theoretical principles that govern gamma synchronization. Thus, synchronization through instantaneous frequency modulations represents a fundamental principle of gamma-band neural coordination that is likely generalizable to other brain rhythms. INTRODUCTION Synchronization, the ability of oscillators to mutually adapt their rhythms (Pikovsky et al., 2002; Winfree, 1967), is a ubiquitous natural phenomenon. Neural synchronization in the gamma-range (25-80Hz) has been reported both in subcortical structures (Akam et al., 2012; Steriade et al., 1993; Zhou et al., 2016) and in cortical areas (Fries, 2015; Gray and Singer, 1989; Gregoriou et al., 2009). Gamma rhythms emerge in activated neural circuits, in which fast-spiking inhibitory neurons play a central role (Cardin et al., 2009; Tiesinga and Sejnowski, 2009; Traub et al., 1996). A prime example is the emergence of gamma rhythms in the early visual cortex during All rights reserved. No reuse allowed without permission. (which was not peer-reviewed) is the author/funder, who has granted bioRxiv a license to display the preprint in perpetuity. The copyright holder for this preprint . http://dx.doi.org/10.1101/070672 doi: bioRxiv preprint first posted online Aug. 22, 2016;
Transcript of Neuronal gamma-band synchronization regulated by ... fileNeuronal gamma-band synchronization...

1
Neuronal gamma-band synchronization regulated by instantaneous 1
modulations of the oscillation frequency 2
3
Authors: E. Lowet1*, M.J. Roberts1, A. Peter2, B. Gips3, P. De Weerd1 4
Affiliations: 5
1 Psychology and Neuroscience, Maastricht University, Maastricht, The Netherlands 6
2 Ernst Strüngmann Institute (ESI) for Neuroscience in Cooperation with Max Planck Society, 7
Frankfurt, Germany 8
3 Donders Institute for Brain, Cognition and Behaviour, Radboud University Nijmegen, 9
Nijmegen, The Netherlands 10
*Correspondence to: [email protected] 11
12
Neuronal gamma-band synchronization shapes information flow during sensory and 13
cognitive processing. A common view is that a stable and shared frequency over time is 14
required for robust and functional synchronization. To the contrary, we found that non-15
stationary instantaneous frequency modulations were essential for synchronization. First, 16
we recorded gamma rhythms in monkey visual area V1, and found that they synchronized 17
by continuously modulating their frequency difference in a phase-dependent manner. The 18
frequency modulation properties regulated both the phase-locking and the preferred 19
phase-relation between gamma rhythms. Second, our experimental observations were in 20
agreement with a biophysical model of gamma rhythms and were accurately predicted by 21
the theory of weakly coupled oscillators revealing the underlying theoretical principles that 22
govern gamma synchronization. Thus, synchronization through instantaneous frequency 23
modulations represents a fundamental principle of gamma-band neural coordination that 24
is likely generalizable to other brain rhythms. 25
26
INTRODUCTION 27
Synchronization, the ability of oscillators to mutually adapt their rhythms (Pikovsky et al., 2002; 28
Winfree, 1967), is a ubiquitous natural phenomenon. Neural synchronization in the gamma-range 29
(25-80Hz) has been reported both in subcortical structures (Akam et al., 2012; Steriade et al., 30
1993; Zhou et al., 2016) and in cortical areas (Fries, 2015; Gray and Singer, 1989; Gregoriou et 31
al., 2009). Gamma rhythms emerge in activated neural circuits, in which fast-spiking inhibitory 32
neurons play a central role (Cardin et al., 2009; Tiesinga and Sejnowski, 2009; Traub et al., 33
1996). A prime example is the emergence of gamma rhythms in the early visual cortex during 34
All rights reserved. No reuse allowed without permission. (which was not peer-reviewed) is the author/funder, who has granted bioRxiv a license to display the preprint in perpetuity.
The copyright holder for this preprint. http://dx.doi.org/10.1101/070672doi: bioRxiv preprint first posted online Aug. 22, 2016;

2
visual stimulus processing (Brunet et al., 2013; Gail et al., 2000; Gray and Singer, 1989; Hermes 35
et al., 2014; Ray and Maunsell, 2010; Roberts et al., 2013). Gamma synchronization has been 36
found to relate to the formation of neural assemblies within (Gail et al., 2000; Gray and Singer, 37
1989; Havenith et al., 2011; Vinck et al., 2010) and across brain areas (Bosman et al., 2012; 38
Gregoriou et al., 2009; Jia et al., 2013a; Roberts et al., 2013; Sirota et al., 2008; Zhou et al., 39
2016). Precise temporal coordination of presynaptic spikes increases their effectiveness on 40
postsynaptic targets (Fries et al., 2001; Tiesinga et al., 2005) and can thereby modulate the 41
effectiveness of neural communication (Börgers et al., 2005; Cannon et al., 2014; Womelsdorf et 42
al., 2007), as shown between V1 and V4 during visual attention (Bosman et al., 2012; Grothe et 43
al., 2012). Temporal coordination in terms of spike timing (phase code) might be an efficient and 44
robust mechanism for information coding (Havenith et al., 2011; Jensen et al., 2014; Maris et al., 45
2016; Tiesinga et al., 2008; Vinck et al., 2010). Further, gamma rhythmic inhibition might 46
increase coding efficiency through sparsening (Chalk et al., 2015; Jadi and Sejnowski, 2014; 47
Vinck and Bosman, 2016) and normalization (Gieselmann and Thiele, 2008; Ray et al., 2013) of 48
neural activity. These network consequences of gamma have led to influential hypotheses about 49
the function of gamma for sensation and cognition (Buehlmann and Deco, 2010; Buzsáki and 50
Wang, 2012; Eckhorn et al., 2001; Fries, 2015; Gray and Singer, 1989; Maris et al., 2016; Miller 51
and Buschman, 2013), including a role in perceptual grouping (Eckhorn et al., 2001; Engel et al., 52
1999; Gray and Singer, 1989) and in visual attention (Bosman et al., 2012; Fries, 2015; 53
Gregoriou et al., 2009; Miller and Buschman, 2013). 54
Surprisingly, in spite of important scientific advances, it is not well understood how 55
gamma rhythms synchronize and what the underlying principles of synchronization are. For 56
example, recent experimental observations of large variability of the precise oscillation 57
frequency have raised doubts on the robustness and functionality of gamma synchronization in 58
the brain. It has been observed that the precise frequency fluctuates strongly over time (Atallah 59
and Scanziani, 2009; Burns et al., 2011, 2010) and that different cortical locations can express 60
different preferred frequencies (Bosman et al., 2012; Ray and Maunsell, 2010). That these 61
observations have led to doubts on the functionality of gamma synchronization indicates that 62
research into gamma synchronization often starts from the premise that continuously matched 63
frequencies are a requirement for the occurrence of stable phase-relations. The observation of 64
frequency variations and frequency differences would then suggest that meaningful 65
synchronization cannot be maintained. These ideas reveal a stationary view of synchronization, 66
which assumes that the underlying oscillatory dynamics are stable at a fixed phase-relation and 67
shared frequency. This is also reflected in the widespread use of stationary methods to assess 68
gamma synchronization, of which spectral coherence is a prime example (Carter et al., 1973). 69
From a dynamic systems perspective however, synchronization is primarily a non-stationary 70
process (Izhikevich and Kuramoto, 2006; Izhikevich, 2007; Kopell and Ermentrout, 2002; 71
Pikovsky et al., 2002; Winfree, 1967), because oscillators adjust their rhythms through phase 72
shifts (i.e., changes in the instantaneous frequency). 73
All rights reserved. No reuse allowed without permission. (which was not peer-reviewed) is the author/funder, who has granted bioRxiv a license to display the preprint in perpetuity.
The copyright holder for this preprint. http://dx.doi.org/10.1101/070672doi: bioRxiv preprint first posted online Aug. 22, 2016;

3
Here, by using a combination of theoretical and experimental techniques, we studied the 74
dynamical principles of gamma synchronization in monkey visual area V1. We simultaneously 75
recorded gamma-rhythmic neural activity at different V1 cortical locations and studied their 76
synchronization properties while using local stimulus contrast (Ray and Maunsell, 2010) to 77
modulate the frequency difference (detuning). Strikingly, we observed that frequency-variable 78
gamma rhythms still synchronized, even when the mean frequencies did not match. This was 79
achieved by continuously varying their instantaneous frequency difference in a manner 80
depending on the phase difference. The function relating phase difference to frequency 81
difference had a sinusoidal-like shape. The interplay between the detuning, representing a 82
desynchronization force, and the amount of instantaneous frequency modulations, representing a 83
synchronization force, regulated the phase-locking strength and the preferred phase-relation 84
between V1 locations. Further, detuning was dependent on visual grating contrast difference, 85
whereas frequency modulation strength was dependent on the cortical distance. 86
To assess the biophysical underpinning of our V1 observations, we simulated two 87
interacting pyramidal-interneuron gamma (PING) networks (Bartos et al., 2007; Börgers et al., 88
2005; Tiesinga and Sejnowski, 2009). In line with our observation in V1, we found gamma 89
synchronization to be associated with rapid frequency modulations. The modulation strength was 90
modulated by synaptic connectivity, whereas detuning was dependent on the excitatory input 91
drive. To achieve a principled understanding of our observations, we applied the theoretical 92
framework of weakly coupled oscillators (Ermentrout and Kleinfeld, 2001; Hoppensteadt and 93
Izhikevich, 1998; Kopell and Ermentrout, 2002; Kuramoto, 1991; Pikovsky et al., 2002). We 94
found that a single differential equation accounted well for the non-stationary frequency 95
modulations and further allowed for precise predictions of how the phase-locking and the phase-96
relation between gamma rhythms changed across conditions. 97
98
RESULTS 99
Local frequency differences regulate the dynamic synchronization process between V1 100
gamma rhythms 101
We first asked how synchronization within V1 was influenced by frequency differences, and by 102
the distance between recording sites. To this aim, we recorded from 2 to 3 laminar probes 103
simultaneously in cortical area V1 of two macaques (M1 and M2) (Fig.1A). We used distances in 104
the order of magnitude of V1 horizontal connectivity (Stettler et al., 2002), hence probes were 105
separated by 1 to 6mm. Using laminar probes enabled us to reduce the influence of volume 106
conduction by calculating current-source density (CSD) as a network signal. Using CSD, we 107
estimated the instantaneous frequency, phase and phase difference of gamma signals. The 108
monkeys fixated centrally while a whole-field static grating with spatially variable contrast was 109
shown. Gamma power was induced in layers 2-4 and in the deepest layer (Fig.1B, Fig.S1). V1 110
locations showed increased gamma frequency with increased local contrast (linear regression, 111
single contact level, M1: R2=0.38, M2: R2= 0.27, both p<10-10, Fig.1C, Fig.S2) allowing us to 112
All rights reserved. No reuse allowed without permission. (which was not peer-reviewed) is the author/funder, who has granted bioRxiv a license to display the preprint in perpetuity.
The copyright holder for this preprint. http://dx.doi.org/10.1101/070672doi: bioRxiv preprint first posted online Aug. 22, 2016;
4
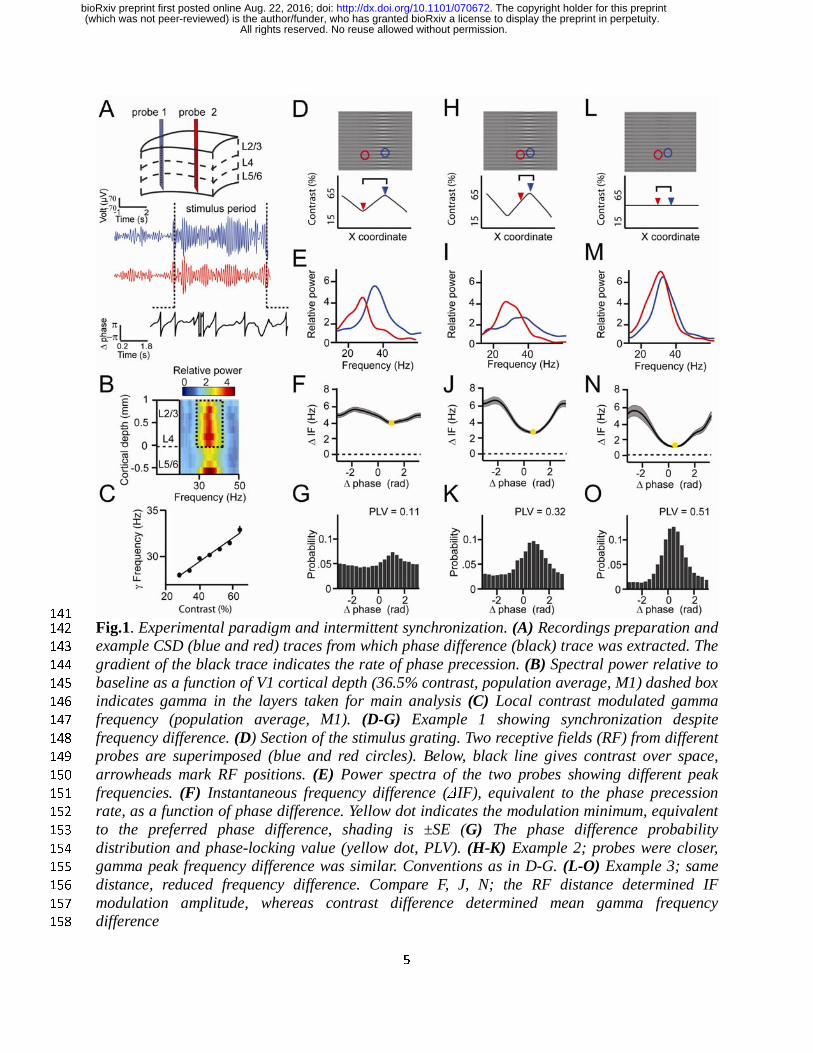
parametrically vary the frequency difference between probes by varying the contrast difference. 113
We will first show the key results through three illustrative examples. In the first example, we 114
chose two cortical locations separated by a relatively large distance of ~5mm, presented with a 115
visual contrast difference of 17% (Fig.1D). Their frequency difference was 5Hz as shown by 116
their non-overlapping power spectra (Fig.1E). This would imply that the phase difference would 117
not be constant, but would advance at a phase precession rate of 2π every 200ms, which could be 118
expected to preclude synchronization. However, the frequency difference was not constant. 119
Instead, the instantaneous frequency difference was modulated as a function of phase difference 120
(Fig.1F, Fig.S3) with a modulation amplitude of 1Hz. At the smallest frequency difference (4Hz, 121
yellow point) the phase precession was slowest, at 2π every 250ms, meaning that the oscillators 122
stayed relatively longer around that phase difference. As a result, the probability distribution of 123
phase differences over time (Fig.1G) was non-uniform giving a phase-locking value (Lachaux et 124
al., 1999) (PLV) of 0.11. The peak of the distribution, the ‘preferred phase’, was at 1.3rad, in line 125
with the minimum of the instantaneous frequency modulation function. In the second example, 126
we chose a pair with a similar frequency difference of 4.8Hz but a closer distance (~2.5mm, 127
Fig.1H). The instantaneous frequency modulation amplitude was larger with a modulation 128
amplitude of 1.8Hz (Fig.1J) and a modulation minimum around 3Hz at the preferred phase. 129
Because phase precession at the preferred phase was slower, the phase difference distribution 130
was narrower than in the previous example, indicating higher synchrony (PLV=0.32, Fig.1K) 131
with a peak centered at a different phase (0.78rad). In the third example the cortical distance 132
remained the same but the frequency difference was reduced (2.8Hz) by eliminating the contrast 133
difference (Fig.1M, the remaining frequency difference might be due to eccentricity, see Fig.S2). 134
The frequency modulation amplitude did not change however, with a lower mean difference, the 135
modulation minimum was close to zero (1Hz, Fig.1N), thus the associated phase difference 136
(0.48rad) could be maintained for even longer periods and the phase difference probability 137
distribution was even narrower (PLV=0.51, Fig.1O). The three examples were representative for 138
the 805 recorded contact pairs in monkey M1 and 882 contact pairs in monkey M2 where each 139
pair was recorded at 9 levels of contrast difference. 140
All rights reserved. No reuse allowed without permission. (which was not peer-reviewed) is the author/funder, who has granted bioRxiv a license to display the preprint in perpetuity.
The copyright holder for this preprint. http://dx.doi.org/10.1101/070672doi: bioRxiv preprint first posted online Aug. 22, 2016;
5
141
Fig.1. Experimental paradigm and intermittent synchronization. (A) Recordings preparation and 142
example CSD (blue and red) traces from which phase difference (black) trace was extracted. The 143
gradient of the black trace indicates the rate of phase precession. (B) Spectral power relative to 144
baseline as a function of V1 cortical depth (36.5% contrast, population average, M1) dashed box 145
indicates gamma in the layers taken for main analysis (C) Local contrast modulated gamma 146
frequency (population average, M1). (D-G) Example 1 showing synchronization despite 147
frequency difference. (D) Section of the stimulus grating. Two receptive fields (RF) from different 148
probes are superimposed (blue and red circles). Below, black line gives contrast over space, 149
arrowheads mark RF positions. (E) Power spectra of the two probes showing different peak 150
frequencies. (F) Instantaneous frequency difference (ΔIF), equivalent to the phase precession 151
rate, as a function of phase difference. Yellow dot indicates the modulation minimum, equivalent 152
to the preferred phase difference, shading is ±SE (G) The phase difference probability 153
distribution and phase-locking value (yellow dot, PLV). (H-K) Example 2; probes were closer, 154
gamma peak frequency difference was similar. Conventions as in D-G. (L-O) Example 3; same 155
distance, reduced frequency difference. Compare F, J, N; the RF distance determined IF 156
modulation amplitude, whereas contrast difference determined mean gamma frequency 157
difference 158
All rights reserved. No reuse allowed without permission. (which was not peer-reviewed) is the author/funder, who has granted bioRxiv a license to display the preprint in perpetuity.
The copyright holder for this preprint. http://dx.doi.org/10.1101/070672doi: bioRxiv preprint first posted online Aug. 22, 2016;

6
159
Experimental observations reproduced by two weakly coupled pyramidal-interneuron 160
gamma (PING) networks 161
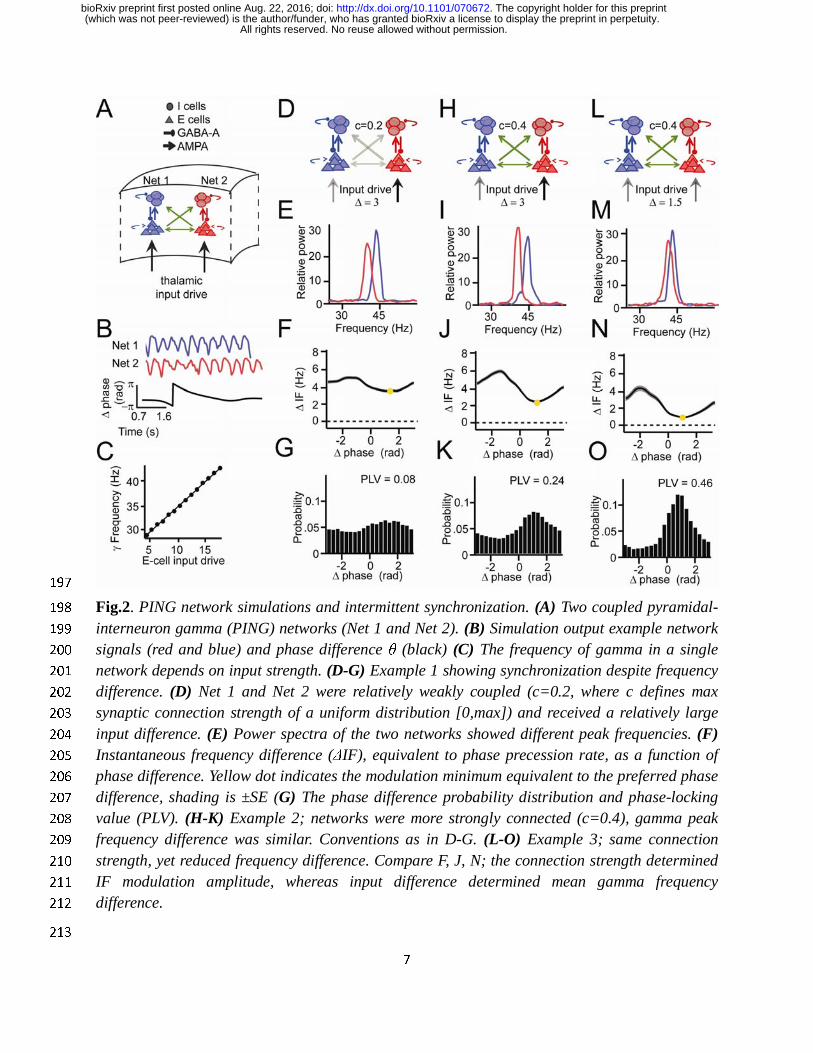
To gain a first understanding of our experimental observations, we tested whether the findings 162
were reproducible by a well-established biophysical model of cortical gamma rhythms (see 163
Supplementary Information for more details). We simulated two coupled pyramidal-interneuron 164
gamma (PING) networks (Fig.2A), which have been shown to capture many properties of 165
cortical gamma rhythms (Börgers et al., 2005; Jadi and Sejnowski, 2014; Lowet et al., 2015; 166
Tiesinga and Sejnowski, 2009, 2010). The network consisted of excitatory regular-spiking 167
spiking neurons, representing pyramidal neurons, and fast-spiking inhibitory interneurons. We 168
used the Izhikevich neural model (Izhikevich, 2003). Neurons were connected through excitatory 169
AMPA and inhibitory GABA-A synapses. To mimic V1 horizontal connections (Stettler et al., 170
2002), the two PING networks were weakly coupled through excitatory cross-network 171
connections that targeted the excitatory and inhibitory neurons of the receiving network. Each 172
network received an independent source of excitatory drive, mimicking the effect of local visual 173
contrast (Sclar et al., 1990). Neurons also received additional noise, such that the oscillation 174
frequency was instable over time as observed for V1 gamma. For each network we estimated a 175
population signal from which we extracted the instantaneous phase (Fig.2B). In line with our 176
experimental observations and previous studies (Jia et al., 2013b; Lowet et al., 2015; Roberts et 177
al., 2013; Tiesinga and Sejnowski, 2009), the input drive set the frequency of the gamma rhythm 178
(R2=0.98, Fig.2C). To reproduce the experimental V1 findings shown in Fig.1 (Fig.2D-O) we 179
modulated the cross-network connection strength, mimicking cortical distance, and the 180
difference of input drive between networks, mimicking the local contrast difference (Fig.2D, H, 181
L). These manipulations led to effects on the spectra (Fig.2E,I,M), on the relationship of 182
instantaneous frequency difference to phase difference (Fig.2F,J,N), and on phase-relation 183
distributions (PLV and preferred phase difference) that were similar to those observed in the 184
empirical V1 data. In particular, the modulation of the frequency difference between the gamma 185
rhythms as a function of phase difference had an approximatively sinusoidal shape in the model 186
data, as in the empirical V1 data. Stronger synchronization of gamma rhythms was associated 187
with larger non-stationary modulations of the frequency difference. The strength of the 188
modulation was changed by the synaptic connectivity between networks, whereas the input drive 189
difference changed the frequency difference. As in V1, the phase difference probability 190
distribution was determined by the frequency difference modulations: The mean frequency 191
difference and the amplitude of the frequency modulation defined both the preferred phase-192
relation and the narrowness of the distribution (PLV). Taken together, this shows that the 193
observations of V1 gamma can be accurately modelled by mutually interacting PING networks, 194
in which synchronization is shaped by the phase-dependent instantaneous frequency 195
modulations. 196
All rights reserved. No reuse allowed without permission. (which was not peer-reviewed) is the author/funder, who has granted bioRxiv a license to display the preprint in perpetuity.
The copyright holder for this preprint. http://dx.doi.org/10.1101/070672doi: bioRxiv preprint first posted online Aug. 22, 2016;
7
197
Fig.2. PING network simulations and intermittent synchronization. (A) Two coupled pyramidal-198
interneuron gamma (PING) networks (Net 1 and Net 2). (B) Simulation output example network 199
signals (red and blue) and phase difference θ (black) (C) The frequency of gamma in a single 200
network depends on input strength. (D-G) Example 1 showing synchronization despite frequency 201
difference. (D) Net 1 and Net 2 were relatively weakly coupled (c=0.2, where c defines max 202
synaptic connection strength of a uniform distribution [0,max]) and received a relatively large 203
input difference. (E) Power spectra of the two networks showed different peak frequencies. (F) 204
Instantaneous frequency difference (ΔIF), equivalent to phase precession rate, as a function of 205
phase difference. Yellow dot indicates the modulation minimum equivalent to the preferred phase 206
difference, shading is ±SE (G) The phase difference probability distribution and phase-locking 207
value (PLV). (H-K) Example 2; networks were more strongly connected (c=0.4), gamma peak 208
frequency difference was similar. Conventions as in D-G. (L-O) Example 3; same connection 209
strength, yet reduced frequency difference. Compare F, J, N; the connection strength determined 210
IF modulation amplitude, whereas input difference determined mean gamma frequency 211
difference. 212
213
All rights reserved. No reuse allowed without permission. (which was not peer-reviewed) is the author/funder, who has granted bioRxiv a license to display the preprint in perpetuity.
The copyright holder for this preprint. http://dx.doi.org/10.1101/070672doi: bioRxiv preprint first posted online Aug. 22, 2016;

8
The theory of weakly coupled oscillators (TWCO): A framework for cortical gamma 214
synchronization 215
We now show how the observed synchronization behavior can be accounted for within the 216
mathematical framework of the theory of weakly coupled oscillators (Ermentrout and Kleinfeld, 217
2001; Hoppensteadt and Izhikevich, 1998; Kopell and Ermentrout, 2002; Kuramoto, 1991; 218
Pikovsky et al., 2002; Winfree, 1967). Many oscillatory phenomena in the natural world 219
represent dynamic systems with a limit-cycle attractor (Winfree, 2001). Although the underlying 220
system might be complex (e.g. a neuron or neural population), the dynamics of the system can be 221
reduced to a phase-variable if the interaction among oscillators is weak. If interaction strength is 222
weak, amplitude changes are relatively small and play a minor role in the oscillatory dynamics. 223
In this way, V1 neural populations can be approximated as oscillators, ‘weakly coupled’ by 224
horizontal connections. The manner in which mutually coupled oscillators adjust their phases, by 225
phase-delay and phase-advancement, is described by the phase response curve, the PRC (Brown 226
et al., 2004; Canavier, 2015; Izhikevich, 2007; Kopell and Ermentrout, 2002; Schwemmer and 227
Lewis, 2012). The PRC is important, because if the PRC of a system can be described, the 228
synchronization behavior can be understood at a more general level and hence predicted across 229
various conditions. 230
According to the theory, the synchronization of two coupled oscillators can be predicted from the 231
forces they exert on each other as a function of their instantaneous phase difference. The amount 232
of force is here defined as interaction strength and the interaction function as the PRC. Each 233
oscillator has an intrinsic (natural) frequency and additionally an own source of phase noise, 234
making the oscillators stochastic. The phase precession of two oscillators is given by (Fig.3A): 235
236
where is the time derivative of the phase difference θ (the rate of phase precession), ∆ω the 237
detuning (the intrinsic frequency difference), ε the interaction strength, G(θ) is defined as the 238
mutual PRC, and � the combined phase noise, where η ~ N(0, ). Phase noise is defined here 239
as variation, unrelated to interaction, that occurs for neural oscillators due to inherent instabilities 240
of the generation mechanism (Atallah and Scanziani, 2009; Burns et al., 2010). This type of 241
variation is distinct from measurement noise that is unrelated to the dynamics of the system. We 242
express ω, ε and � in units of Hz (1Hz=2π*rad/s). The time derivative is also expressed in Hz 243
(instantaneous frequency, IF). The equation was solved analytically (see Supplementary 244
Information) to study changes in the phase-difference probability distribution, here characterized 245
by the PLV and the mean (preferred) phase difference, as a function of detuning ∆ω and 246
interaction strength ε. The model’s behavior as a function of detuning ∆ω and interaction 247
strength ε can be understood more easily by considering the noise-free case first. In the noise-248
free case (σ=0) one can solve the equation for zero-points (equilibrium points), meaning that the 249
phase precession is zero, ( 0θ =& , i.e. zero frequency difference). To reach equilibrium, the 250
detuning ∆ω and the interaction term εG(θ) need to be counterbalanced. When detuning is 251
( ) ( )1 εG θ ω θ η= Δ + +&
θ&
22σ
θ&
All rights reserved. No reuse allowed without permission. (which was not peer-reviewed) is the author/funder, who has granted bioRxiv a license to display the preprint in perpetuity.
The copyright holder for this preprint. http://dx.doi.org/10.1101/070672doi: bioRxiv preprint first posted online Aug. 22, 2016;

9
smaller than the interaction strength (∆ω<=ε), then there is a particular phase difference θ at 252
which an equilibrium can be reached. At equilibrium, there is no phase precession (Fig.3B) and 253
thus a PLV of 1 (full synchronization). When interaction strength is zero (ε=0), the asynchronous 254
oscillators display continuous linear phase precession and have zero PLV (Fig.3C), with the 255
exception of zero detuning. When detuning is larger than a nonzero interaction strength (∆ω>ε, 256
ε>0), oscillators exhibit a nonlinear phase precession over time, characteristic for the intermittent 257
synchronization regime (Izhikevich, 2007; Pikovsky et al., 2002, Fig.3D). The phase precession 258
rate (instantaneous frequency difference) is determined by the detuning ∆ω, the modulation 259
shape G(θ), and the modulation amplitude ε. Around the preferred phase-relation, the 260
instantaneous frequency difference is reduced (‘slow’ precession in Fig.3D), whereas away from 261
the preferred phase-relation, the instantaneous frequency is larger (‘fast’ precession in Fig.3D). 262
In this regime, PLV between 0 and 1 can be obtained. Including phase noise (σ>0) has important 263
effects on the synchronization behavior (Izhikevich, 2007; Pikovsky et al., 2002). The noise 264
flattens the phase-relation distribution and can induce full cycles of phase precession (phase 265
slips) that also lead to instantaneous frequency modulations. Hence, for noisy oscillators, the 266
intermittent synchronization regime is the default regime for a large parameter range. 267
268
Fig.3. Theory of weakly coupled oscillators (TWCO). (A) The single differential equation used 269
for analysis, with colors representing different key parameters. (B-D) Rate of phase precession 270
plotted in different synchronization regimes, with (B) full synchrony, (C) no synchrony and (D) 271
intermittent synchrony. For each plot, the corresponding range of the parameters and the PLV 272
are indicated. (E-G) Equivalent behavior as in the examples as Fig.1 and 2. Top is the 273
All rights reserved. No reuse allowed without permission. (which was not peer-reviewed) is the author/funder, who has granted bioRxiv a license to display the preprint in perpetuity.
The copyright holder for this preprint. http://dx.doi.org/10.1101/070672doi: bioRxiv preprint first posted online Aug. 22, 2016;

10
modulation of the instantaneous frequency difference as a function of phase difference. Bottom is 274
the phase difference probability distribution. Black bars are numerical simulation results, 275
whereas the red line indicates the analytical solution. (E) Large detuning and low interaction 276
strength. (F) Large detuning and strong interaction strength. (G) Small detuning and strong 277
interaction strength. (H) The Arnold tongue. The analytically derived PLV is plotted as a 278
function of interaction strength (y-axis) and detuning (x-axis). (I) The same as in (H), but for the 279
mean (preferred) phase-relation. Black lines mark the predicted Arnold tongue borders in the 280
noise-free case (ε=|∆ω|). 281
282
To show the applicability of the theory, we first reproduced the three examples shown in 283
Fig.1 and 2 by numerical simulations of equation 1 and by varying detuning ∆ω and interaction 284
strength ε. We assumed a sinusoidal G(θ) (see Kuramoto model, Breakspear et al., 2010; 285
Kuramoto, 1991) and a phase variability of SD=18Hz. As shown in Fig.3E-G, the same relation 286
between the instantaneous frequency difference modulations and the properties of the phase 287
difference probability distribution were observed as for V1 gamma data. Detuning defined the 288
mean of the frequency modulations, whereas the interaction strength defined the amplitude of the 289
modulations. To obtain a general description of the effect of detuning ∆ω and interaction strength 290
ε, we mapped the PLV and the mean phase difference (derived analytically) in the ∆ω-ε 291
parameter space. We observed a triangular synchronization region (Fig.3H) described as the 292
Arnold tongue (Pikovsky et al., 2002). This reflects the fact that stronger interaction strengths 293
‘tolerate’ larger detuning (∆ω<=ε). Further, a clear phase gradient along the detuning dimension 294
can be observed (Fig.3I). The oscillator with a higher frequency led the oscillator with a lower 295
frequency in terms of their phases. 296
297
Estimating the underlying parameters and function of TWCO in observed data 298
To demonstrate the underlying principles of V1 gamma synchronization, we aimed to reconstruct 299
its Arnold tongue, a central prediction of the theory. For comparison, we did the same for the 300
coupled PING networks. Further, by estimating the parameters and function of equation 1, we 301
aimed to directly test its accuracy by comparing analytical predictions to experimental 302
observations in V1, and to simulation data from coupled PING networks. 303
The theory predicts that the phase difference dependent modulations of instantaneous 304
frequency difference (∆IF(θ)) are determined by the detuning ∆ω and the interaction term εG(θ). 305
In experimental data, we observed these systematic modulations. Thus, these modulations give 306
information about the detuning and the properties of the interaction term. Specifically, the time-307
averaged modulation of the instantaneous frequency directly relates to the deterministic 308
term ∆ω+εG(θ), as noise is averaged out (see Supplementary Information). We estimated a 309
single G(θ) function (mutual PRC) and σ value for a given dataset (i.e. each monkey and the 310
PING networks) assuming stability of underlying PRCs and of the noise sources, whereas ∆ω 311
and ε were estimated for each contact pair and condition. G(θ) was estimated by the 312
Δ IF(θ)
Δ IF(θ)
All rights reserved. No reuse allowed without permission. (which was not peer-reviewed) is the author/funder, who has granted bioRxiv a license to display the preprint in perpetuity.
The copyright holder for this preprint. http://dx.doi.org/10.1101/070672doi: bioRxiv preprint first posted online Aug. 22, 2016;
11
modulation shapes put to unity. The interaction strength ε was estimated by the modulation 313
amplitude of the . The detuning ∆ω was estimated by the average value of the 314
computed over [-π π]. The remaining parameter σ was approximated by finding the σ value for 315
equation 1 that reproduced the observed overall instantaneous frequency variability (see 316
supplementary materials). Given G(θ) and the value σ, the equation can be mathematically 317
(analytically) solved for any values of detuning ∆ω and interaction strength ε. 318
319
TWCO predicts synchronization properties of weakly coupled PING networks 320
We first tested the applicability of TWCO for the PING network simulation data. To test for the 321
presence of the Arnold tongue in simulation data, we modulated detuning and interaction 322
strength by varying input drive difference and cross-network connection strength respectively 323
(Fig.4A). From the instantaneous frequency difference modulations (Fig.4B) we reconstructed 324
G(θ), which was approximately a sinusoidal function. This is noteworthy given that the 325
excitatory cross-network connections mainly advanced the phase (Cannon and Kopell, 2015). As 326
discussed later, this was because networks were mutually connected. Further, we estimated the 327
remaining parameters: detuning, interaction strength and the phase noise variance (σ=15Hz). Fig 328
4C shows for an example level of interaction strength that the analytical predictions of PLV 329
accurately predicted the simulated PLV (model accuracy: R2=0.93). Fig 4D demonstrates that 330
mapping the gamma PLV in the ∆ω vs. ε parameter space yielded the Arnold tongue with a 331
shape similar to the prediction by the TWCO. Likewise, Fig.4E shows the excellent match 332
between analytical prediction and simulation data for the mean phase difference (model 333
accuracy: R2= 0.94), and Fig.4F shows that the mean phase difference of simulated data in the 334
∆ω - ε parameter space yielded the Arnold tongue (Fig.4E-F) with a shape similar to that 335
predicted by the TWCO. 336
Δ IF(θ) Δ IF(θ)
All rights reserved. No reuse allowed without permission. (which was not peer-reviewed) is the author/funder, who has granted bioRxiv a license to display the preprint in perpetuity.
The copyright holder for this preprint. http://dx.doi.org/10.1101/070672doi: bioRxiv preprint first posted online Aug. 22, 2016;

12
337
Fig.4. Applying the theory of weakly coupled oscillators to coupled PING networks. (A) Two 338
coupled pyramidal-interneuron gamma (PING) networks (Net 1 and Net 2). Detuning ∆ω was 339
varied by excitatory input drive, whereas interaction strength ε was varied by inter-network 340
connectivity strength. (B) An example plot of averaged phase-dependent modulation of the 341
instantaneous frequency difference (∆IF) used for estimating ε and ∆ω. The shape of the 342
modulation indicates the G(θ). (C) The simulation PLV at different detuning values ∆ω (dots 343
colored by PLV) at a single interaction strength value (ε =1.7) was well predicted by the model 344
(gray line). (D) The PLV at many interaction strengths and detuning values mapped the Arnold 345
tongue. Black lines mark the predicted Arnold tongue borders in the noise-free case (ε=|∆ω|). 346
(E-F) As (F-G), but for preferred phase difference θ. 347
348
TWCO predicts synchronization properties of V1 cortical gamma rhythms 349
We then tested whether the theory predicted the in vivo data with equal success. In the same 350
manner as with the PING modeling data, we estimated the underlying parameters using the 351
observed modulations of the instantaneous frequency difference (see examples in 352
Fig.5A,F), and the phase variance (M1:σ=19Hz, M2:σ=20Hz). The interaction strengths and 353
detuning values were estimated for each channel pair and condition separately. G(θ) was again 354
approximately a sinusoidal function with symmetric negative and positive components (Akam et 355
Δ IF(θ)
All rights reserved. No reuse allowed without permission. (which was not peer-reviewed) is the author/funder, who has granted bioRxiv a license to display the preprint in perpetuity.
The copyright holder for this preprint. http://dx.doi.org/10.1101/070672doi: bioRxiv preprint first posted online Aug. 22, 2016;

13
al., 2012). The interaction strength ε was found to be inversely correlated with the cortical 356
distance between probes (linear regression, M1: R2=0.41, M2: R2=0.29, both p <10-10), in line 357
with V1 horizontal connectivity (Stettler et al., 2002). The detuning ∆ω was correlated with the 358
contrast difference between probes (linear regression, M1: R2=0.31, M2: R2= 0.25, both p<10-10, 359
Fig.S2). Combining gamma PLV estimates from all recorded V1 pairs, we were able reconstruct 360
the Arnold tongue as a function of ∆ω and ε in both M1 and M2 (Fig.5C/G) confirming a central 361
theoretical prediction. To better evaluate the accuracy of the theory, we derived analytical 362
predictions for different ∆ω and ε by solving equation 1 using the estimated parameters. We 363
found that the gamma PLV variation over all single contact pairs were substantially captured by 364
the analytical predictions as a function of ∆ω and ε (model accuracy: M1: R2=0.18, n=7245, M2: 365
R2= 0.32, n=7938). The observed population means for different ∆ω and ε values followed the 366
analytical predictions well (model accuracy: M1: R2=0.83, M2: R2= 0.86, both n=638). In 367
Fig.5D/H we plotted a horizontal cross-section of the Arnold tongue that shows the good fit 368
between the prediction and observed population means. The observation of a gamma Arnold 369
tongue across the V1 middle-superficial layers was confirmed also for deep layer contacts 370
(Fig.S4). We then mapped the mean phase difference (preferred phase-relation) between V1 371
gamma rhythms as function of ∆ω and ε. We observed a clear phase gradient in both monkeys 372
across the detuning dimension (Fig.5E/I). The phase spread (see also Fig.5F/J) had a range of 373
nearly –pi/2 to pi/2 in both M1 and M2, as predicted by the shape of G(θ). Gamma rhythms with 374
the higher frequency of a pair had the leading preferred phase relation. The mean phase 375
difference increased with increased detuning. For given detuning, stronger interaction strength 376
led to a reduction of the phase difference. Over all single contact pairs the mean phase difference 377
was substantially captured by the analytical predictions (model accuracy: M1: R2=0.56, n=7245, 378
M2: R2=0.3, n=7938). The observed population means for different ∆ω and ε values followed the 379
analytical predictions precisely (model accuracy: M1: R2=0.92, M2: R2=0.88, both n=638). 380
We confirmed the PLV and phase difference analysis in spike-CSD (spike-field) and 381
spike-spike measurements (Fig.S5). 382
All rights reserved. No reuse allowed without permission. (which was not peer-reviewed) is the author/funder, who has granted bioRxiv a license to display the preprint in perpetuity.
The copyright holder for this preprint. http://dx.doi.org/10.1101/070672doi: bioRxiv preprint first posted online Aug. 22, 2016;
14
383
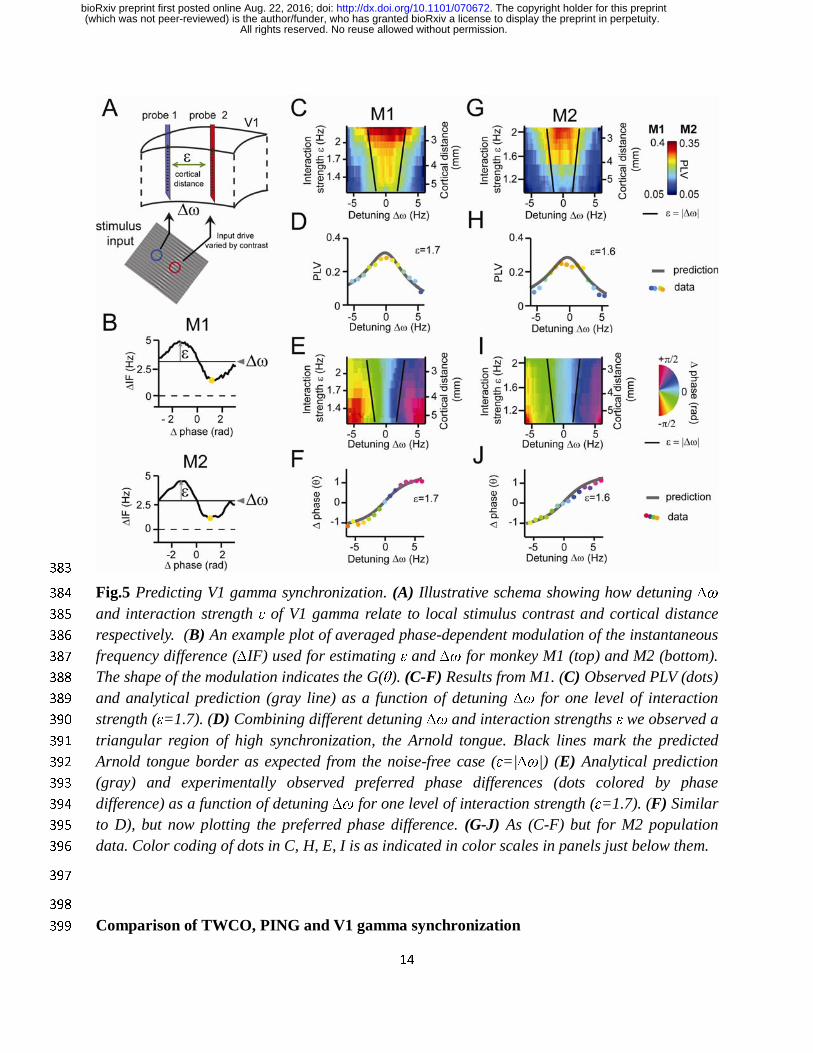
Fig.5 Predicting V1 gamma synchronization. (A) Illustrative schema showing how detuning ∆ω 384
and interaction strength ε of V1 gamma relate to local stimulus contrast and cortical distance 385
respectively. (B) An example plot of averaged phase-dependent modulation of the instantaneous 386
frequency difference (∆IF) used for estimating ε and ∆ω for monkey M1 (top) and M2 (bottom). 387
The shape of the modulation indicates the G(θ). (C-F) Results from M1. (C) Observed PLV (dots) 388
and analytical prediction (gray line) as a function of detuning ∆ω for one level of interaction 389
strength (ε=1.7). (D) Combining different detuning ∆ω and interaction strengths ε we observed a 390
triangular region of high synchronization, the Arnold tongue. Black lines mark the predicted 391
Arnold tongue border as expected from the noise-free case (ε=|∆ω|) (E) Analytical prediction 392
(gray) and experimentally observed preferred phase differences (dots colored by phase 393
difference) as a function of detuning ∆ω for one level of interaction strength (ε=1.7). (F) Similar 394
to D), but now plotting the preferred phase difference. (G-J) As (C-F) but for M2 population 395
data. Color coding of dots in C, H, E, I is as indicated in color scales in panels just below them. 396
397
398
Comparison of TWCO, PING and V1 gamma synchronization 399
All rights reserved. No reuse allowed without permission. (which was not peer-reviewed) is the author/funder, who has granted bioRxiv a license to display the preprint in perpetuity.
The copyright holder for this preprint. http://dx.doi.org/10.1101/070672doi: bioRxiv preprint first posted online Aug. 22, 2016;

15
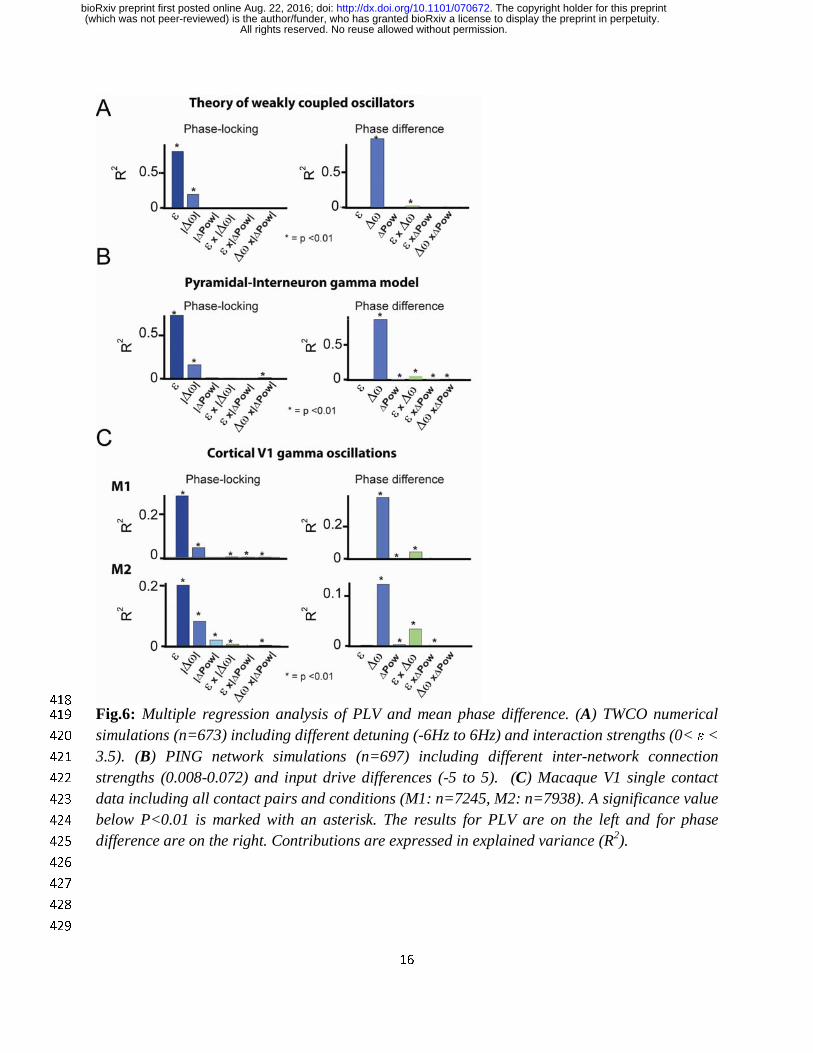
To reveal the individual contributions of detuning and interaction strength in regulating the PLV 400
and the mean phase difference, we applied a multiple regression approach with detuning, 401
interaction strength and amplitude as factors (Fig.6). The contributions were expressed in 402
explained variance (R2). We found that the TWCO (Fig.6A) reflected the same pattern of 403
contributions as we observed for PING (Fig.6B) and V1 gamma rhythms (Fig.6C). The phase 404
locking value (PLV) was mainly determined by interaction strength and more weakly by 405
detuning. The mean phase difference was however primarily determined by detuning and only 406
weakly by interaction strength. Interaction strength affected the mean phase difference through 407
an interaction effect with detuning by changing the detuning-to-phase-difference slope 408
(interaction effect in Fig.6). In addition to the predictions of TWCO, we observed weak effects of 409
the oscillation amplitude on the PLV and on the mean phase difference in PING and V1 gamma 410
data. Amplitude differences between gamma rhythms can lead to asymmetric interaction 411
strengths that shift the precise PLV and the preferred phase-relation. Further, in both PING and 412
V1 data, we observed phase-dependent instantaneous amplitude modulations (Fig.S6). However, 413
the analytical predictions and multiple regression analysis are in agreement in showing that 414
detuning and interaction strength (frequency modulations) represent the main parameters for 415
regulating V1 gamma synchronization. 416
417
All rights reserved. No reuse allowed without permission. (which was not peer-reviewed) is the author/funder, who has granted bioRxiv a license to display the preprint in perpetuity.
The copyright holder for this preprint. http://dx.doi.org/10.1101/070672doi: bioRxiv preprint first posted online Aug. 22, 2016;
16
418
Fig.6: Multiple regression analysis of PLV and mean phase difference. (A) TWCO numerical 419
simulations (n=673) including different detuning (-6Hz to 6Hz) and interaction strengths (0< ε < 420
3.5). (B) PING network simulations (n=697) including different inter-network connection 421
strengths (0.008-0.072) and input drive differences (-5 to 5). (C) Macaque V1 single contact 422
data including all contact pairs and conditions (M1: n=7245, M2: n=7938). A significance value 423
below P<0.01 is marked with an asterisk. The results for PLV are on the left and for phase 424
difference are on the right. Contributions are expressed in explained variance (R2). 425
426
427
428
429
All rights reserved. No reuse allowed without permission. (which was not peer-reviewed) is the author/funder, who has granted bioRxiv a license to display the preprint in perpetuity.
The copyright holder for this preprint. http://dx.doi.org/10.1101/070672doi: bioRxiv preprint first posted online Aug. 22, 2016;

17
DISCUSSION 430
The present study shows that gamma synchronization in awake monkey V1 adheres to 431
theoretical principles of weakly coupled oscillators (Ermentrout and Kleinfeld, 2001; 432
Hoppensteadt and Izhikevich, 1998; Kopell and Ermentrout, 2002; Kuramoto, 1991; Pikovsky et 433
al., 2002; Winfree, 1967), thereby providing insight into the synchronization regime of gamma 434
rhythms and its principles. Given the generality of the synchronization principles, they are likely 435
to apply to other brain regions and frequency bands. 436
437
Intermittent synchronization: The role of non-stationary frequency modulations 438
Our findings reveal the importance of phase-dependent frequency modulations for synchronizing 439
V1 gamma rhythms. The same modulations were observed in a general biophysical model of 440
gamma rhythms. These modulations show that a fixed and common frequency is not required for 441
phase coordination. To the contrary, stronger non-stationary frequency modulations led to 442
stronger synchronization, and thus to more reliable phase coordination. These modulations arise 443
naturally in the intermittent synchronization regime (Izhikevich, 2007; Pikovsky et al., 2002), 444
when oscillators cannot remain in a stable equilibrium due to detuning and noise. Given the 445
variable nature of gamma rhythms in vivo (Atallah and Scanziani, 2009; Burns et al., 2010; Ray 446
and Maunsell, 2010; Roberts et al., 2013), intermittent synchronization is the most likely regime 447
for their phase coordination. Although complete synchronization is not achieved in this regime, 448
phase coordination remains sufficiently robust to influence the strength and directionality of 449
information flow (Battaglia et al., 2012; Buehlmann and Deco, 2010; Fries, 2015; Maris et al., 450
2016), by rendering particular phase-relations more likely than others. The observation of non-451
stationary frequency modulations also has methodological implications. Gamma rhythms are 452
often studied with stationary methods, for example spectral coherence or stationary granger 453
measures, yet our findings are not in line with the (weak-sense) stationarity assumption (Lachaux 454
et al., 1999; Lowet et al., 2016). Time-resolved non-stationary methods are therefore more 455
appropriate to study the dynamics underling gamma synchronization. 456
457
The interaction function of V1 gamma rhythms 458
We show that the shape of the frequency modulations reflects the underlying interaction 459
function, the PRC (Hoppensteadt and Izhikevich, 1998; Kopell and Ermentrout, 2002; 460
Kuramoto, 1991; Pikovsky et al., 2002; Winfree, 1967). The PRC defines how the oscillators 461
advance or delay each other’s phase development to coordinate their phase-relation. We 462
observed symmetric sinusoidal-like functions in both PING and in V1 gamma that resemble the 463
basic function of the widely-used Kuramoto-model (Breakspear et al., 2010). This is in 464
agreement with the biphasic PRC of gamma rhythms observed in the rat hippocampus (Akam et 465
al., 2012). In agreement with our symmetric G(θ), we observed symmetric Arnold tongues 466
(Izhikevich, 2007; Kopell and Ermentrout, 2002; Pikovsky et al., 2002). Importantly, here we 467
estimated the mutual (bidirectional) PRC, the G(θ). This function can be symmetric (equal 468
magnitude of phase advance and delay), despite asymmetric individual (unidirectional) PRCs, as 469
All rights reserved. No reuse allowed without permission. (which was not peer-reviewed) is the author/funder, who has granted bioRxiv a license to display the preprint in perpetuity.
The copyright holder for this preprint. http://dx.doi.org/10.1101/070672doi: bioRxiv preprint first posted online Aug. 22, 2016;
18
long as the rhythms interact approximatively equally strongly, which is a plausible assumption 470
between V1 locations. Therefore, our results are not per se at odds with other studies that have 471
indicated asymmetric individual PRC in neural data (Cannon and Kopell, 2015; Wang et al., 472
2013). Unidirectionally connected neural groups, for example between certain cortical areas, 473
might have asymmetric PRC and hence an asymmetric Arnold tongue. In this situation a 474
frequency difference between cortical areas (Bosman et al., 2012; Cannon et al., 2014) might be 475
favorable for optimal information transmission. This hypothesis could be tested between gamma 476
rhythms recorded from unidirectionally connected cortical areas. 477
478
The Arnold tongue and the regulative parameters of gamma synchronization 479
Previous studies have established diversity in the phase-locking (Eckhorn et al., 2001; Gray and 480
Singer, 1989; Ray and Maunsell, 2010) and in the phase-relation (Maris et al., 2016; Vinck et al., 481
2010) of gamma rhythms in the primate visual cortex. However, how this diversity is regulated 482
was not well established. Here, we show that two parameters mainly determined gamma 483
synchronization: the detuning (frequency difference) and the interaction strength ε (frequency 484
modulations). This was highlighted in the mapping of the Arnold tongue, offering a graphical 485
understanding of how these parameters shape gamma-band synchronization. Detuning represents 486
a desynchronization force, whereas the interaction strength represents a synchronization force. 487
The former was modulated by input drive differences, and the latter by connectivity strength. 488
Their interplay defined the resultant phase-locking strength and the preferred phase-relation 489
between gamma rhythms. The observed role of detuning is in agreement with a previous study in 490
the rat hippocampus (Akam et al., 2012), in which optogenetic entrainment strength and phase of 491
gamma rhythms were dependent on the frequency-detuning. The results also agree with 492
theoretical conceptions on oscillatory interactions (Ermentrout and Kopell, 1984; Hoppensteadt 493
and Izhikevich, 1998; Sancristóbal et al., 2014; Tiesinga and Sejnowski, 2010). We suggest that 494
small detuning values (mainly <∆10Hz) reported in the present study and much larger shifts in 495
the gamma frequency-range (25-50Hz to 65-120Hz) reported in the rat hippocampus and cortex 496
(Colgin et al., 2009) represent different but complementary mechanisms for controlling gamma 497
synchronization. In this perspective, large shifts in the frequency-range could selectively turn on 498
or off gamma-mediated information flow between brain regions, whereas fine frequency 499
detuning modulates the exact strength and direction of the gamma-mediated information flow. 500
The role of instantaneous frequency modulations, defining the interaction strength, reflects the 501
overall ability of two cortical locations to engage in gamma-band synchronization. These 502
modulations are mediated by anatomical connectivity and further modified by oscillation 503
amplitude. Hence, an important source of instantaneous V1 gamma frequency modulations 504
(Bosman et al., 2009; Burns et al., 2011, 2010; Roberts et al., 2013) is the underlying network 505
(intermittent) synchronization process. Instantaneous gamma frequency fluctuations have also 506
been observed in the rat hippocampus by Atallah and Scanziani (2009). Their data suggested that 507
these fluctuations, which reflected rapid phase shifts due to changes in excitation-inhibition 508
balance, might be critical for gamma-mediated information flow. In line with this notion, we 509
All rights reserved. No reuse allowed without permission. (which was not peer-reviewed) is the author/funder, who has granted bioRxiv a license to display the preprint in perpetuity.
The copyright holder for this preprint. http://dx.doi.org/10.1101/070672doi: bioRxiv preprint first posted online Aug. 22, 2016;
19
show that these cycle-by-cycle modulations are essential for regulating synchronization 510
properties between gamma rhythms. 511
512
Role of V1 gamma synchronization for visual processing 513
In our experiment, detuning was dependent on the local contrast difference (Ray and Maunsell, 514
2010; Roberts et al., 2013), known to change neural excitation in V1 (Sclar et al., 1990), while 515
the interaction strength was dependent on the underlying horizontal connectivity strength, here 516
varied by cortical distance (Stettler et al., 2002). Gamma synchronization is therefore 517
informative about the sensory input (Besserve et al., 2015) and informative about the underlying 518
structure of connectivity. Indeed, the frequency of gamma rhythms is modulated by various 519
sensory stimuli (Fries, 2015) and by cognitive manipulations (Bosman et al., 2012; Buzsáki and 520
Wang, 2012; Fries, 2015) suggesting that frequency control is critical for functional V1 gamma-521
band coordination. The horizontal connectivity in V1 is not only local, but also exhibits 522
remarkable tuning to visual features, orientation being a prime example (Stettler et al., 2002). 523
Hence, innate and learned connectivity patterns likely affect the interaction strength and hence 524
the synchronization patterns of gamma rhythms within V1. These properties suggest V1 gamma 525
as a functional mechanism for early vision (Eckhorn et al., 2001; Gray and Singer, 1989) by 526
temporally coordinating local neural activity as a function of sensory input and connectivity. 527
However, in line with previous studies (Eckhorn et al., 2001; Palanca and DeAngelis, 2005), V1 528
gamma synchronization was found to be mainly local and hence not likely to ‘bind’ whole 529
perceptual objects. Furthermore, recent studies on the gamma-band response during natural 530
viewing (Brunet et al., 2013; Hermes et al., 2014) have found variable levels of synchronization 531
power for different natural images. In line with these observations, the revealed Arnold tongue of 532
V1 gamma implies that natural image parts with high input/detuning variability (heterogeneity) 533
will induce no or weak synchronization, whereas parts with low input/detuning variability 534
(homogeneity) will induce strong synchronization. This is also in line with proposals linking 535
gamma synchronization with surround suppression/normalization (Gieselmann and Thiele, 2008; 536
Ray et al., 2013) and predictive coding (Vinck and Bosman, 2016). Our findings and 537
interpretation shed new light onto the operation of gamma synchronization in the brain and will 538
permit new and more detailed description of the mechanisms by which synchronization is 539
regulated by cognitive and sensory inputs. 540
541
Experimental Procedures: 542
Species used and surgical procedures 543
Two adult male rhesus monkeys were used in this study. A chamber was implanted above early 544
visual cortex, positioned over V1/V2. A head post was implanted to head-fix the monkeys during 545
the experiment. All the procedures were in accordance with the European council directive 546
2010/63/EU, the Dutch ‘experiments on animal acts’ (1997) and approved by the Radboud 547
University ethical committee on experiments with animals (Dier‐Experimenten‐Commissie, 548
DEC). 549
All rights reserved. No reuse allowed without permission. (which was not peer-reviewed) is the author/funder, who has granted bioRxiv a license to display the preprint in perpetuity.
The copyright holder for this preprint. http://dx.doi.org/10.1101/070672doi: bioRxiv preprint first posted online Aug. 22, 2016;
20
550
Recording methods 551
V1 recordings were made with 2 or 3 Plexon U-probes (Plexon Inc.) consisting of 16 contacts 552
(150µm inter-contact spacing). We recorded the local field potential (LFP) and multi-unit 553
spiking activity (MUA). For the main analysis we used the current-source density (CSD, (Vaknin 554
et al., 1988)) to reduce volume conduction. We aligned the neural data from the different laminar 555
probes according to their cortical depth and excluded contacts coming from deep V2. Layer 556
assignment was based on the stimulus-onset CSD profile (Schroeder et al., 1991) and the inter-557
laminar coherence pattern (Maier et al., 2010). Receptive field (RF) mapping was achieved by 558
presenting at fast rate high-contrast black and white squares pseudorandomly on a 10x10 grid 559
(Roberts et al., 2013). For RF mapping we used CSD signals and spikes. 560
561
Task and visual stimuli 562
The monkeys were trained for head-fixation and were placed in a Faraday-isolated darkened 563
booth at a distance of 57cm from a computer screen. Stimuli were presented on a Samsung TFT 564
screen (SyncMaster 940bf, 38ºx30º 60Hz). During stimulation and pre-stimulus time the monkey 565
maintained a central eye position (measured by infra-red camera, Arrington, 60Hz sampling 566
rate). The monkey´s task was to passively gaze on a fixation point while a stimulus was shown. 567
The monkey was rewarded for correct trials. The local stimulus contrast was manipulated in a 568
whole-field static square-wave grating (2 cycles/degree, presented at two opposite phases 569
randomly interleaved). Contrast was varied smoothly over space such that different RFs had 570
different contrast values. The direction of the contrast difference was parallel to the arrangement 571
of RFs and orthogonal to the orientation of the grating. The stimulus was isoluminant at all 572
points and was isoluminant with the pre-stimulus grey screen. We presented 9 different contrast 573
modulation conditions (Table.S1). Cortex software (http://dally.nimh.nih.gov/index.html) was 574
used for visual stimulation and behavioral control. 575
576
Data analysis 577
To investigate dynamical changes in the gamma phase and frequency over time we estimated the 578
instantaneous gamma phase and frequency using the singular spectrum decomposition of the 579
signal (SSD (Bonizzi et al., 2014), see https://project.dke.maastrichtuniversity.nl/ssd/) combined 580
with Hilbert-Transform or wavelet-decomposition. The phase-locking value (PLV) was 581
estimated as the mean resultant vector length (Lachaux et al., 1999) and the preferred phase-582
relation as the mean resultant vector angle. For experimental data, we estimated the signal-to-583
noise ratio (SNR) to reduce the influence of measurement noise on estimates. Phase flipping due 584
to CSD computation was corrected. 585
586
Theoretical and computational modelling 587
Using the theory of weakly coupled oscillators we investigated the phase-locking as well as the 588
mean phase difference of two mutually coupled noisy phase-oscillators with variable frequency 589
All rights reserved. No reuse allowed without permission. (which was not peer-reviewed) is the author/funder, who has granted bioRxiv a license to display the preprint in perpetuity.
The copyright holder for this preprint. http://dx.doi.org/10.1101/070672doi: bioRxiv preprint first posted online Aug. 22, 2016;

21
difference (detuning) and interaction strength. The stochastic differential equation was solved 590
analytically (Pikovsky et al., 2002). The analytical results correctly predicted the numerical 591
simulations. In addition, we simulated two coupled excitatory-inhibitory spiking networks 592
generating gamma oscillations using the Izhikevich-type neuronal model (Izhikevich, 2003). The 593
detuning between the networks was altered by changing the difference in excitatory input drive. 594
The interaction strength was altered by changing the cross-network synaptic connection strength. 595
596
Statistics 597
The accuracy of the theoretical predictions for the experimental data was quantified as the 598
explained variance R2. In addition, to evaluate the contribution of different parameters we used a 599
multiple regression approach (Matlab function fitlm, The MathWorks Inc.). 600
601
Author contributions: E.L., M.J.R. and P.DW. designed the experiment. E.L. and M.J.R. 602
conducted the recordings. Data analysis and the writing of the manuscript was by E.L. with 603
support by M.J.R, A.P., B.G. and P.DW. 604
605
Acknowledgments: We thank N.Kopell, W.Singer, A.Bastos, P.Fries, C.Micheli, F.Smulders, 606
J.v.d.Eerden, J.Karel, P.Bonizzi, A.Hadjipapas, A.A.v.d.Berg. Supported by NWO VICI grant 607
453-04-002 to PDW and NWO VENI grant 451-09-025 to MJR. All data are stored at the 608
Department of Psychology and Neuroscience, Maastricht University, The Netherlands. We thank 609
the Radboud University Nijmegen for hosting our experiments, and staff of the Central Animal 610
Facility (CDL) for expert assistance. 611
612
REFERENCES: 613
Akam, T., Oren, I., Mantoan, L., Ferenczi, E., Kullmann, D., 2012. Oscillatory dynamics in the 614
hippocampus support dentate gyrus–CA3 coupling. Nat. Neurosci. 1–9. 615
doi:10.1038/nn.3081 616
Atallah, B. V, Scanziani, M., 2009. Instantaneous modulation of gamma oscillation frequency by 617
balancing excitation with inhibition. Neuron 62, 566–577. 618
doi:10.1016/j.neuron.2009.04.027 619
Bartos, M., Vida, I., Jonas, P., 2007. Synaptic mechanisms of synchronized gamma oscillations 620
in inhibitory interneuron networks. Nat. Rev. Neurosci. 8, 45–56. doi:10.1038/nrn2044 621
Battaglia, D., Witt, A., Wolf, F., Geisel, T., 2012. Dynamic effective connectivity of inter-areal 622
brain circuits. PLoS Comput Biol 8, e1002438. doi:10.1371/journal.pcbi.1002438 623
Besserve, M., Lowe, S.C., Logothetis, N.K., Schoelkopf, B., Panzeri, S., 2015. Shifts of Gamma 624
Phase across Primary Visual Cortical Sites Reflect Dynamic Stimulus-Modulated 625
Information Transfer. PLoS Biol. 13. 626
Bonizzi, P., Karel, J.M.H., Meste, O., Peeters, R.L.M., 2014. Singular spectrum decomposition: 627
A new method for time series decomposition. Adv. Adapt. Data Anal. 1450011. 628
doi:10.1142/S1793536914500113 629
Börgers, C., Epstein, S., Kopell, N.J., 2005. Background gamma rhythmicity and attention in 630
cortical local circuits: a computational study. Proc. Natl. Acad. Sci. U. S. A. 102, 7002–7. 631
All rights reserved. No reuse allowed without permission. (which was not peer-reviewed) is the author/funder, who has granted bioRxiv a license to display the preprint in perpetuity.
The copyright holder for this preprint. http://dx.doi.org/10.1101/070672doi: bioRxiv preprint first posted online Aug. 22, 2016;

22
doi:10.1073/pnas.0502366102 632
Bosman, C.A., Schoffelen, J.-M., Brunet, N., Oostenveld, R., Bastos, A.M., Womelsdorf, T., 633
Rubehn, B., Stieglitz, T., De Weerd, P., Fries, P., 2012. Attentional stimulus selection 634
through selective synchronization between monkey visual areas. Neuron 75, 875–888. 635
doi:10.1016/j.neuron.2012.06.037 636
Bosman, C.A., Womelsdorf, T., Desimone, R., Fries, P., 2009. A microsaccadic rhythm 637
modulates gamma-band synchronization and behavior. J Neurosci 29, 9471–9480. 638
doi:10.1523/JNEUROSCI.1193-09.2009 639
Breakspear, M., Heitmann, S., Daffertshofer, A., 2010. Generative models of cortical 640
oscillations: neurobiological implications of the kuramoto model. Front Hum Neurosci 4, 641
190. doi:10.3389/fnhum.2010.00190 642
Brown, E., Moehlis, J., Holmes, P., 2004. On the phase reduction and response dynamics of 643
neural oscillator populations. Neural Comput. 16, 673–715. 644
doi:10.1162/089976604322860668 645
Brunet, N., Bosman, C. a, Roberts, M., Oostenveld, R., Womelsdorf, T., De Weerd, P., Fries, P., 646
2013. Visual Cortical Gamma-Band Activity During Free Viewing of Natural Images. 647
Cereb. Cortex 25, 1–9. doi:10.1093/cercor/bht280 648
Buehlmann, A., Deco, G., 2010. Optimal information transfer in the cortex through 649
synchronization. PLoS Comput. Biol. 6. doi:10.1371/journal.pcbi.1000934 650
Burns, S.P., Xing, D., Shapley, R.M., 2011. Is gamma-band activity in the local field potential of 651
V1 cortex a “clock” or filtered noise? J Neurosci 31, 9658–9664. 652
doi:10.1523/JNEUROSCI.0660-11.2011 653
Burns, S.P., Xing, D., Shelley, M.J., Shapley, R.M., 2010. Searching for autocoherence in the 654
cortical network with a time-frequency analysis of the local field potential. J Neurosci 30, 655
4033–4047. doi:10.1523/JNEUROSCI.5319-09.2010 656
Buzsáki, G., Wang, X.-J., 2012. Mechanisms of gamma oscillations. Annu Rev Neurosci 35, 657
203–225. doi:10.1146/annurev-neuro-062111-150444 658
Canavier, C.C., 2015. Phase-resetting as a tool of information transmission. Curr. Opin. 659
Neurobiol. doi:10.1016/j.conb.2014.12.003 660
Cannon, J., Kopell, N., 2015. The Leaky Oscillator: Properties of Inhibition-Based Rhythms 661
Revealed through the Singular Phase Response Curve. SIAM J. Appl. Dyn. Syst. 14, 1930–662
1977. doi:10.1137/140977151 663
Cannon, J., McCarthy, M.M., Lee, S., Lee, J., Börgers, C., Whittington, M.A., Kopell, N., 2014. 664
Neurosystems: brain rhythms and cognitive processing. Eur. J. Neurosci. 39, 705–19. 665
doi:10.1111/ejn.12453 666
Cardin, J.A., Carlén, M., Meletis, K., Knoblich, U., Zhang, F., Deisseroth, K., Tsai, L.-H., 667
Moore, C.I., 2009. Driving fast-spiking cells induces gamma rhythm and controls sensory 668
responses. Nature 459, 663–667. doi:10.1038/nature08002 669
Carter, G., Knapp, C., Nuttall, A., 1973. Estimation of the magnitude-squared coherence function 670
via overlapped fast Fourier transform processing. IEEE Trans. Audio Electroacoust. 21. 671
doi:10.1109/TAU.1973.1162496 672
Chalk, M., Gutkin, B., Deneve, S., 2015. Neural oscillations as a signature of efficient coding in 673
the presence of synaptic delays, bioRxiv. Cold Spring Harbor Labs Journals. 674
doi:10.1101/034736 675
Colgin, L.L., Denninger, T., Fyhn, M., Hafting, T., Bonnevie, T., Jensen, O., Moser, M.-B., 676
Moser, E.I., 2009. Frequency of gamma oscillations routes flow of information in the 677
All rights reserved. No reuse allowed without permission. (which was not peer-reviewed) is the author/funder, who has granted bioRxiv a license to display the preprint in perpetuity.
The copyright holder for this preprint. http://dx.doi.org/10.1101/070672doi: bioRxiv preprint first posted online Aug. 22, 2016;

23
hippocampus. Nature 462, 353–357. doi:10.1038/nature08573 678
Eckhorn, R., Bruns, A., Saam, M., Gail, A., Gabriel, A., Brinksmeyer, H.J., 2001. Flexible 679
cortical gamma-band correlations suggest neural principles of visual processing. Vis. cogn. 680
8, 519–530. doi:10.1080/13506280143000098 681
Engel, A.K., Fries, P., König, P., Brecht, M., Singer, W., 1999. Temporal binding, binocular 682
rivalry, and consciousness. Conscious. Cogn. 8, 128–51. doi:10.1006/ccog.1999.0389 683
Ermentrout, G.B., Kleinfeld, D., 2001. Traveling electrical waves in cortex: insights from phase 684
dynamics and speculation on a computational role. Neuron 29, 33–44. 685
Ermentrout, G.B., Kopell, N., 1984. Frequency Plateaus in a Chain of Weakly Coupled 686
Oscillators, I. SIAM J. Math. Anal. 15, 215–237. doi:10.1137/0515019 687
Fries, P., 2015. Rhythms For Cognition: Communication Through Coherence. Neuron. 688
Fries, P., Neuenschwander, S., Engel, a K., Goebel, R., Singer, W., 2001. Rapid feature 689
selective neuronal synchronization through correlated latency shifting. Nat. Neurosci. 4, 690
194–200. doi:10.1038/84032 691
Gail, A., Brinksmeyer, H.J., Eckhorn, R., 2000. Contour decouples gamma activity across 692
texture representation in monkey striate cortex. Cereb Cortex 10, 840–850. 693
Gieselmann, M.A., Thiele, A., 2008. Comparison of spatial integration and surround suppression 694
characteristics in spiking activity and the local field potential in macaque V1. Eur J 695
Neurosci 28, 447–459. doi:10.1111/j.1460-9568.2008.06358.x 696
Gray, C.M., Singer, W., 1989. Stimulus-specific neuronal oscillations in orientation columns of 697
cat visual cortex. Proc. Natl. Acad. Sci. U. S. A. 86, 1698–702. 698
Gregoriou, G.G., Gotts, S.J., Zhou, H., Desimone, R., 2009. High-frequency, long-range 699
coupling between prefrontal and visual cortex during attention. Science 324, 1207–1210. 700
doi:10.1126/science.1171402 701
Grothe, I., Neitzel, S.D., Mandon, S., Kreiter, A.K., 2012. Switching neuronal inputs by 702
differential modulations of gamma-band phase-coherence. J. Neurosci. 32, 16172–80. 703
doi:10.1523/JNEUROSCI.0890-12.2012 704
Havenith, M.N., Yu, S., Biederlack, J., Chen, N.-H., Singer, W., Nikolić, D., 2011. Synchrony 705
makes neurons fire in sequence, and stimulus properties determine who is ahead. J. 706
Neurosci. 31, 8570–84. doi:10.1523/JNEUROSCI.2817-10.2011 707
Hermes, D., Miller, K.J., Wandell, B. a, Winawer, J., 2014. Stimulus Dependence of Gamma 708
Oscillations in Human Visual Cortex. Cereb. Cortex 1–9. doi:10.1093/cercor/bhu091 709
Hoppensteadt, F.C., Izhikevich, E.M., 1998. Thalamo-cortical interactions modeled by weakly 710
connected oscillators: could the brain use FM radio principles? Biosystems 48, 85–94. 711
Izhikevich, E., Kuramoto, Y., 2006. Weakly coupled oscillators. Encycl. Math. Phys. 48–53. 712
Izhikevich, E.M., 2003. Simple model of spiking neurons. IEEE Trans Neural Netw 14, 1569–713
1572. doi:10.1109/TNN.2003.820440 714
Izhikevich, E.M., 2007. Dynamical Systems in Neuroscience: The Geometry of Excitability and 715
Bursting, Dynamical Systems. doi:10.1017/S0143385704000173 716
Jadi, M.P., Sejnowski, T.J., 2014. Cortical oscillations arise from contextual interactions that 717
regulate sparse coding. Proc. Natl. Acad. Sci. U. S. A. 111, 6780–5. 718
doi:10.1073/pnas.1405300111 719
Jensen, O., Gips, B., Bergmann, T.O., Bonnefond, M., 2014. Temporal coding organized by 720
coupled alpha and gamma oscillations prioritize visual processing. Trends Neurosci. 37, 721
357–369. doi:10.1016/j.tins.2014.04.001 722
Jia, X., Tanabe, S., Kohn, A., 2013a. γ and the coordination of spiking activity in early visual 723
All rights reserved. No reuse allowed without permission. (which was not peer-reviewed) is the author/funder, who has granted bioRxiv a license to display the preprint in perpetuity.
The copyright holder for this preprint. http://dx.doi.org/10.1101/070672doi: bioRxiv preprint first posted online Aug. 22, 2016;
24
cortex. Neuron 77, 762–74. doi:10.1016/j.neuron.2012.12.036 724
Jia, X., Xing, D., Kohn, A., 2013b. No consistent relationship between gamma power and peak 725
frequency in macaque primary visual cortex. J Neurosci 33, 17–25. 726
doi:10.1523/JNEUROSCI.1687-12.2013 727
Kopell, N., Ermentrout, G.B., 2002. Chapter 1 Mechanisms of phase-locking and frequency 728
control in pairs of coupled neural oscillators. Handb. Dyn. Syst. 2, 3–54. 729
doi:10.1016/S1874-575X(02)80022-4 730
Kuramoto, Y., 1991. Collective synchronization of pulse-coupled oscillators and excitable units. 731
Phys. D Nonlinear Phenom. 50, 15–30. doi:10.1016/0167-2789(91)90075-K 732
Lachaux, J.P., Rodriguez, E., Martinerie, J., Varela, F.J., 1999. Measuring phase synchrony in 733
brain signals. Hum Brain Mapp 8, 194–208. 734
Lowet, E., Roberts, M., Hadjipapas, A., Peter, A., van der Eerden, J., De Weerd, P., 2015. Input-735
Dependent Frequency Modulation of Cortical Gamma Oscillations Shapes Spatial 736
Synchronization and Enables Phase Coding. PLoS Comput. Biol. 11, e1004072. 737
doi:10.1371/journal.pcbi.1004072 738
Lowet, E., Roberts, M.J., Bonizzi, P., Karel, J., De Weerd, P., 2016. Quantifying Neural 739
Oscillatory Synchronization: A Comparison between Spectral Coherence and Phase-740
Locking Value Approaches. PLoS One 11, e0146443. doi:10.1371/journal.pone.0146443 741
Maier, A., Adams, G.K., Aura, C., Leopold, D.A., 2010. Distinct superficial and deep laminar 742
domains of activity in the visual cortex during rest and stimulation. Front. Syst. Neurosci. 4. 743
doi:10.3389/fnsys.2010.00031 744
Maris, E., Fries, P., van Ede, F., 2016. Diverse Phase Relations among Neuronal Rhythms and 745
Their Potential Function. Trends Neurosci. 39, 86–99. doi:10.1016/j.tins.2015.12.004 746
Miller, E.K., Buschman, T.J., 2013. Cortical circuits for the control of attention. Curr. Opin. 747
Neurobiol. 23, 216–222. doi:10.1016/j.conb.2012.11.011 748
Palanca, B.J.A., DeAngelis, G.C., 2005. Does neuronal synchrony underlie visual feature 749
grouping? Neuron 46, 333–46. doi:10.1016/j.neuron.2005.03.002 750
Pikovsky, A., Rosenblum, M., Kurths, J., Hilborn, R.C., 2002. Synchronization: A Universal 751
Concept in Nonlinear Science. Am. J. Phys. 70, 655. doi:10.1119/1.1475332 752
Ray, S., Maunsell, J.H.R., 2010. Differences in gamma frequencies across visual cortex restrict 753
their possible use in computation. Neuron 67, 885–96. doi:10.1016/j.neuron.2010.08.004 754
Ray, S., Ni, A.M., Maunsell, J.H.R., 2013. Strength of gamma rhythm depends on normalization. 755
PLoS Biol. 11, e1001477. doi:10.1371/journal.pbio.1001477 756
Roberts, M.J., Lowet, E., Brunet, N.M., Ter Wal, M., Tiesinga, P., Fries, P., De Weerd, P., 2013. 757
Robust gamma coherence between macaque V1 and V2 by dynamic frequency matching. 758
Neuron 78, 523–36. doi:10.1016/j.neuron.2013.03.003 759
Sancristóbal, B., Vicente, R., Garcia-Ojalvo, J., 2014. Role of frequency mismatch in neuronal 760
communication through coherence. J. Comput. Neurosci. 37, 193–208. doi:10.1007/s10827-761
014-0495-7 762
Schroeder, C.E., Tenke, C.E., Givre, S.J., Arezzo, J.C., Vaughan, H.G., 1991. Striate cortical 763
contribution to the surface-recorded pattern-reversal vep in the alert monkey. Vision Res. 764
31, 1143–1157. doi:10.1016/0042-6989(91)90040-C 765
Schwemmer, M.A., Lewis, T.J., 2012. Phase Response Curves in Neuroscience, in: Phase 766
Response Curves in Neuroscience. pp. 3–31. doi:10.1007/978-1-4614-0739-3 767
Sclar, G., Maunsell, J.H.R., Lennie, P., 1990. Coding of image contrast in central visual 768
pathways of the macaque monkey. Vision Res. 30, 1–10. doi:10.1016/0042-6989(90)90123-769
All rights reserved. No reuse allowed without permission. (which was not peer-reviewed) is the author/funder, who has granted bioRxiv a license to display the preprint in perpetuity.
The copyright holder for this preprint. http://dx.doi.org/10.1101/070672doi: bioRxiv preprint first posted online Aug. 22, 2016;

25
3 770
Sirota, A., Montgomery, S., Fujisawa, S., Isomura, Y., Zugaro, M., Buzsáki, G., 2008. 771
Entrainment of neocortical neurons and gamma oscillations by the hippocampal theta 772
rhythm. Neuron 60, 683–697. doi:10.1016/j.neuron.2008.09.014 773
Steriade, M., McCormick, D.A., Sejnowski, T.J., 1993. Thalamocortical oscillations in the 774
sleeping and aroused brain. Science 262, 679–685. doi:10.1126/science.8235588 775
Stettler, D.D., Das, A., Bennett, J., Gilbert, C.D., 2002. Lateral Connectivity and Contextual 776
Interactions in Macaque Primary Visual Cortex. Neuron 36, 739–750. doi:10.1016/S0896-777
6273(02)01029-2 778
Tiesinga, P., Fellous, J.-M., Sejnowski, T.J., 2008. Regulation of spike timing in visual cortical 779
circuits. Nat. Rev. Neurosci. 9, 97–107. doi:10.1038/nrn2315 780
Tiesinga, P., Sejnowski, T.J., 2009. Cortical enlightenment: are attentional gamma oscillations 781
driven by ING or PING? Neuron 63, 727–732. doi:10.1016/j.neuron.2009.09.009 782
Tiesinga, P.H., Fellous, J.-M., Salinas, E., José, J. V, Sejnowski, T.J., 2005. Inhibitory synchrony 783
as a mechanism for attentional gain modulation. J. Physiol. Paris 98, 296–314. 784
doi:10.1016/j.jphysparis.2005.09.002 785
Tiesinga, P.H., Sejnowski, T.J., 2010. Mechanisms for Phase Shifting in Cortical Networks and 786
their Role in Communication through Coherence. Front Hum Neurosci 4, 196. 787
doi:10.3389/fnhum.2010.00196 788
Traub, R.D., Whittington, M. a, Colling, S.B., Buzsáki, G., Jefferys, J.G., 1996. Analysis of 789
gamma rhythms in the rat hippocampus in vitro and in vivo. J. Physiol. 493 ( Pt 2, 471–84. 790
Vaknin, G., DiScenna, P.G., Teyler, T.J., 1988. A method for calculating current source density 791
(CSD) analysis without resorting to recording sites outside the sampling volume. J. 792
Neurosci. Methods 24, 131–135. doi:10.1016/0165-0270(88)90056-8 793
Vinck, M., Bosman, C.A., 2016. More Gamma More Predictions: Gamma-Synchronization as a 794
Key Mechanism for Efficient Integration of Classical Receptive Field Inputs with Surround 795
Predictions. Front. Syst. Neurosci. 10, 35. doi:10.3389/fnsys.2016.00035 796
Vinck, M., Lima, B., Womelsdorf, T., Oostenveld, R., Singer, W., Neuenschwander, S., Fries, P., 797
2010. Gamma-phase shifting in awake monkey visual cortex. J Neurosci 30, 1250–1257. 798
doi:10.1523/JNEUROSCI.1623-09.2010 799
Wang, S., Musharoff, M.M., Canavier, C.C., Gasparini, S., 2013. Hippocampal CA1 pyramidal 800
neurons exhibit type 1 phase-response curves and type 1 excitability. J. Neurophysiol. 109, 801
2757–66. doi:10.1152/jn.00721.2012 802
Winfree, A.T., 1967. Biological rhythms and the behavior of populations of coupled oscillators. 803
J. Theor. Biol. 16, 15–42. doi:10.1016/0022-5193(67)90051-3 804
Winfree, A.T., 2001. The Geometry of Biological Time. 805
Womelsdorf, T., Schoffelen, J.-M., Oostenveld, R., Singer, W., Desimone, R., Engel, A.K., 806
Fries, P., 2007. Modulation of neuronal interactions through neuronal synchronization. 807
Science 316, 1609–1612. doi:10.1126/science.1139597 808
Zhou, H., Schafer, R.J., Desimone, R., 2016. Pulvinar-Cortex Interactions in Vision and 809
Attention. Neuron 89, 209–220. doi:10.1016/j.neuron.2015.11.034 810
811
812
813
814
815
All rights reserved. No reuse allowed without permission. (which was not peer-reviewed) is the author/funder, who has granted bioRxiv a license to display the preprint in perpetuity.
The copyright holder for this preprint. http://dx.doi.org/10.1101/070672doi: bioRxiv preprint first posted online Aug. 22, 2016;

26
816
817
All rights reserved. No reuse allowed without permission. (which was not peer-reviewed) is the author/funder, who has granted bioRxiv a license to display the preprint in perpetuity.
The copyright holder for this preprint. http://dx.doi.org/10.1101/070672doi: bioRxiv preprint first posted online Aug. 22, 2016;