Neuron 49, 1–7, March 16, 2006 ª2006 Elsevier Inc. DOI 10...
17
Neuron 49, 1–7, March 16, 2006 ª2006 Elsevier Inc. DOI 10.1016/j.neuron.2006.01.032 A Neural Representation of Categorization Uncertainty in the Human Brain Jack Grinband, 1,2,3, * Joy Hirsch, 1,2 and Vincent P. Ferrera 1,3 1 Center for Neurobiology and Behavior 2 fMRI Research Center 3 David Mahoney Center for Brain and Behavior Research Columbia University New York, New York 10032 Summary The ability to classify visual objects into discrete cate- gories (‘‘friend’’ versus ‘‘foe’’; ‘‘edible’’ versus ‘‘poi- sonous’’) is essential for survival and is a fundamental cognitive function. The cortical substrates that medi- ate this function, however, have not been identified in humans. To identify brain regions involved in stimulus categorization, we developed a task in which subjects classified stimuli according to a variable categorical boundary. Psychophysical functions were used to de- fine a decision variable, categorization uncertainty, which was systematically manipulated. Using event- related functional MRI, we discovered that activity in a fronto-striatal-thalamic network, consisting of the medial frontal gyrus, anterior insula, ventral stria- tum, and dorsomedial thalamus, was modulated by categorization uncertainty. We found this network to be distinct from the frontoparietal attention net- work, consisting of the frontal and parietal eye fields, where activity was not correlated with categorization uncertainty. Introduction Categorization of objects into distinct classes is central to decisions that affect survival. To categorize an ap- proaching animal as ‘‘dangerous’’ or ‘‘innocuous,’’ for example, may depend on the animal’s distance. In this case, one attends to the relevant dimension (distance) and then compares it to an internal criterion demarcat- ing ‘‘danger.’’ Furthermore, the categorical boundary must be sensitive to context: is the tiger three feet away in a jungle, or in a zoo? Categorization is thus a critical and dynamic aspect of decision-making, yet the neural mechanisms by which this comparison process occurs are not well understood. One of the challenges in decision-making research in general has been to determine which variables are neurally encoded, and how this information is then used. Single unit studies in nonhuman primates have focused on cortical areas that are part of a frontoparietal at- tention network (Posner and Petersen, 1990), particu- larly the lateral intraparietal area (LIP) in the posterior parietal cortex (PPC) and the frontal eye fields (FEF) in the dorsolateral prefrontal cortex (DLPFC). These stud- ies have identified decision variables related to signal detection, accumulation of evidence, response selec- tion, and outcome evaluation (Schall and Hanes, 1993; Hanes and Schall, 1996; Kim and Shadlen, 1999; Shadlen and Newsome, 2001; Mazurek et al., 2003; Platt and Glimcher, 1999). Studies that have looked explicitly at categorization (Freedman et al., 2001, 2003) have found evidence for category-specific neuronal re- sponses in the lateral prefrontal cortex; it is possible that the role of such neurons is to establish a categorical boundary or to be involved in the comparison process necessary for making a categorical decision. To identify neural activation related to stimulus cate- gorization, we developed an event-related fMRI task (Figure 1) in which subjects categorized a stimulus, which varied continuously along a single dimension, into one of two categories. To accurately perform this categori- zation, subjects had to compare the stimulus to an ab- stract categorical boundary, such that the difficulty of the comparison process was inversely proportional to the distance of the stimulus from that boundary. In other words, the closer the stimulus was to the boundary, the greater the categorization uncertainty became. We hypothesized that BOLD activity related to the compar- ison process would be proportional to categorization uncertainty. We provide evidence that the neural sub- strate for comparing a stimulus to a categorical bound- ary includes the medial frontal gyrus (MFG), anterior insula (AI), ventral striatum (VS), and dorsomedial thala- mus (dmTh). Results Subjects performed a task in which they judged a vertical line segment to be long or short relative to one of two cri- terion lengths. The criterion lengths were not shown explicitly to the subjects but were learned through feed- back. On each trial, one criterion was chosen at random, and this was represented by a symbolic cue (colored cir- cle) presented at the beginning of he trial. To character- ize a psychophysical variable related to categorization, we constructed psychometric functions (Figure 2A; Fig- ure S5A in the Supplemental Data available with this article online) for subjects’ evaluation of line lengths, sorting responses according to length and cue color. Rectifying the psychometric functions around the point of subjective equality (PSE) created a function that pro- vided an estimate of subjective uncertainty (the uncer- tainty function) (Figure 2A; Figure S5A). This function could reflect uncertainty either at the signal detection stage or at the categorization stage of the decision-making process. We hypothesized that the latter was more likely the case, as the stimuli were all highly discriminable. To confirm this, we asked subjects to perform the same categorization task with the red/ green cue (symbolic criterion condition) replaced by a line segment equal in length to the categorical boundary (explicit criterion condition). If the ability to detect changes in stimulus length (i.e., signal detection) had been the primary source of deci- sion uncertainty in the subject’s performance, then the *Correspondence: [email protected] NEURON 2392
Transcript of Neuron 49, 1–7, March 16, 2006 ª2006 Elsevier Inc. DOI 10...
Neuron 49, 1–7, March 16, 2006 ª2006 Elsevier Inc. DOI 10.1016/j.neuron.2006.01.032
A Neural Representation of CategorizationUncertainty in the Human Brain
Jack Grinband,1,2,3,* Joy Hirsch,1,2
and Vincent P. Ferrera1,3
1Center for Neurobiology and Behavior2 fMRI Research Center3David Mahoney Center for Brain
and Behavior ResearchColumbia UniversityNew York, New York 10032
Summary
The ability to classify visual objects into discrete cate-
gories (‘‘friend’’ versus ‘‘foe’’; ‘‘edible’’ versus ‘‘poi-sonous’’) is essential for survival and is a fundamental
cognitive function. The cortical substrates that medi-ate this function, however, have not been identified in
humans. To identify brain regions involved in stimuluscategorization, we developed a task in which subjects
classified stimuli according to a variable categoricalboundary. Psychophysical functions were used to de-
fine a decision variable, categorization uncertainty,which was systematically manipulated. Using event-
related functional MRI, we discovered that activityin a fronto-striatal-thalamic network, consisting of
the medial frontal gyrus, anterior insula, ventral stria-tum, and dorsomedial thalamus, was modulated by
categorization uncertainty. We found this networkto be distinct from the frontoparietal attention net-
work, consisting of the frontal and parietal eye fields,where activity was not correlated with categorization
uncertainty.
Introduction
Categorization of objects into distinct classes is centralto decisions that affect survival. To categorize an ap-proaching animal as ‘‘dangerous’’ or ‘‘innocuous,’’ forexample, may depend on the animal’s distance. In thiscase, one attends to the relevant dimension (distance)and then compares it to an internal criterion demarcat-ing ‘‘danger.’’ Furthermore, the categorical boundarymust be sensitive to context: is the tiger three feet awayin a jungle, or in a zoo? Categorization is thus a criticaland dynamic aspect of decision-making, yet the neuralmechanisms by which this comparison process occursare not well understood.
One of the challenges in decision-making researchin general has been to determine which variables areneurally encoded, and how this information is then used.Single unit studies in nonhuman primates have focusedon cortical areas that are part of a frontoparietal at-tention network (Posner and Petersen, 1990), particu-larly the lateral intraparietal area (LIP) in the posteriorparietal cortex (PPC) and the frontal eye fields (FEF) inthe dorsolateral prefrontal cortex (DLPFC). These stud-ies have identified decision variables related to signal
*Correspondence: [email protected]
NEUR
detection, accumulation of evidence, response selec-tion, and outcome evaluation (Schall and Hanes, 1993;Hanes and Schall, 1996; Kim and Shadlen, 1999;Shadlen and Newsome, 2001; Mazurek et al., 2003; Plattand Glimcher, 1999). Studies that have looked explicitlyat categorization (Freedman et al., 2001, 2003) havefound evidence for category-specific neuronal re-sponses in the lateral prefrontal cortex; it is possiblethat the role of such neurons is to establish a categoricalboundary or to be involved in the comparison processnecessary for making a categorical decision.
To identify neural activation related to stimulus cate-gorization, we developed an event-related fMRI task(Figure1) inwhichsubjects categorized astimulus,whichvaried continuously along a single dimension, into oneof two categories. To accurately perform this categori-zation, subjects had to compare the stimulus to an ab-stract categorical boundary, such that the difficulty ofthe comparison process was inversely proportional tothe distance of the stimulus from that boundary. In otherwords, the closer the stimulus was to the boundary, thegreater the categorization uncertainty became. Wehypothesized that BOLD activity related to the compar-ison process would be proportional to categorizationuncertainty. We provide evidence that the neural sub-strate for comparing a stimulus to a categorical bound-ary includes the medial frontal gyrus (MFG), anteriorinsula (AI), ventral striatum (VS), and dorsomedial thala-mus (dmTh).
Results
Subjects performed a task in which they judged a verticalline segment to be long or short relative to one of two cri-terion lengths. The criterion lengths were not shownexplicitly to the subjects but were learned through feed-back. On each trial, one criterion was chosen at random,and this was represented by a symbolic cue (colored cir-cle) presented at the beginning of he trial. To character-ize a psychophysical variable related to categorization,we constructed psychometric functions (Figure 2A; Fig-ure S5A in the Supplemental Data available with thisarticle online) for subjects’ evaluation of line lengths,sorting responses according to length and cue color.Rectifying the psychometric functions around the pointof subjective equality (PSE) created a function that pro-vided an estimate of subjective uncertainty (the uncer-tainty function) (Figure 2A; Figure S5A).
This function could reflect uncertainty either at thesignal detection stage or at the categorization stage ofthe decision-making process. We hypothesized that thelatter was more likely the case, as the stimuli were allhighly discriminable. To confirm this, we asked subjectsto perform the same categorization task with the red/green cue (symbolic criterion condition) replaced by aline segment equal in length to the categorical boundary(explicit criterion condition).
If the ability to detect changes in stimulus length (i.e.,signal detection) had been the primary source of deci-sion uncertainty in the subject’s performance, then the
ON 2392

Neuron2
Figure 1. Experimental Design
(Top) Subjects were presented with one of
two cues. After a delay, a line segment
appeared, and subjects indicated whether
the line appeared ‘‘long’’ or ‘‘short’’ relative
to the categorical boundary (CB) indicated
by the cue. The line remained on screen until
the subject responded. A tone indicated
whether the response was correct or incor-
rect. (Bottom) The black circle (actual cue
was red) represented a CB located between
stimulus 5 and stimulus 6; the gray circle
(actual cue was green) represented a CB be-
tween stimulus 11 and stimulus 12. For exam-
ple, if the gray cue is presented, stimuli 1–11
are ‘‘short,’’ while stimuli 12–16 are ‘‘long.’’
To minimize learning effects in the scanner,
subjects learned to associate the cue with
its CB over the course of 1000 prescanning
practice trials.
psychometric functions would be the same in the ex-plicit and the symbolic criterion conditions. If, however,the representation of the internal decision criterion hadbeen the primary source of decision uncertainty in per-formance, then the psychometric functions of the ex-plicit criterion task would be characterized by smallerWeber fractions than in the symbolic criterion task. Infact, across all subjects, the largest Weber fraction ob-served in the explicit criterion task was three timessmaller than the smallest Weber fraction in the symboliccriterion task, indicating that the limiting factor in themain task was indeed the representation of the decisioncriterion, not the visual discrimination of the stimulusitself.
We predicted that cortical areas containing categori-zation-related neurons would present BOLD responseswith magnitude modulated by per-trial uncertainty. Thissignal should represent processes related to the com-parison of a stimulus against an abstract categoricalboundary, including categorization-specific attention,category rule application, and category-related memoryretrieval processes. In contrast, non-categorization re-gions involved in processing other aspects of thedecision—such assignal detection, non-decision-relatedattention, motor planning, etc.—should have constantresponse magnitudes across all trials, reflecting the sta-bility of these variables.
Neural activity was modeled using two regressors.One regressor, the unmodulated response time regres-sor, was aligned with stimulus onset and had a durationequal to the subject’s response time on each trial. Priorto convolution with the hemodynamic response function(HRF), the height of this regressor was constant acrossall trials (Figure S2). The other regressor, the uncertaintyregressor, was also equal in duration to the responsetime but varied in amplitude from trial to trial dependingon the value of the uncertainty function for the givenstimulus. Thus, after convolution with the HRF, the am-plitude of the uncertainty regressor reflected both theresponse time and the uncertainty for each trial.
Activity that was significantly correlated with the un-modulated regressor was widely distributed across theentire brain (Figure S4A). In contrast, activity modulated
NEURON
by categorization uncertainty was found in MFG andAI, and VS and dmTh (Figure 3), but not in the PPC orDLPFC.
To confirm that PPC and DLPFC were not related tocategorization uncertainty, we identified regions of in-terest (ROIs) in the frontoparietal oculomotor/attentionalnetwork (Posner and Petersen, 1990) using a center-outsaccade task (Figure 4A). These ROIs fit within the‘‘empty’’ or uncorrelated regions of the uncertainty acti-vation map (Figure 4B). This result suggests that theMFG-AI-VS-dmTh network is spatially and functionallydistinct from the frontoparietal attentional network.
The regression model used to identify activation cor-related to decision uncertainty is sensitive to the corre-lation between individual regressors. Because subjects’response times were partially correlated with psycho-physical uncertainty (Figure 2B; r = 0.342; n = 10), itwas impossible to construct a model in which uncer-tainty and reaction time were not correlated. We there-fore performed an alternate analysis that did not dependon linear regression. In this analysis, we computedevent-triggered averages of the HRFs aligned with stim-ulus onset within ROIs identified by the regressionmodel. To break the correlation between uncertaintyand response time, we restricted this analysis to trialswith response times confined to a 200 ms window (Fig-ure S5B). Since typical response times ranged from500 ms to 2500 ms, the use of a small response timewindow minimized the correlation between responsetime and uncertainty (r = 0.094; n = 10), allowing us toevaluate the effect of categorization uncertainty on theBOLD response while effectively holding response timeconstant.
We created ROI masks from the thresholded acti-vation maps and measured time-dependent BOLDchanges within those masks for the response time-constrained subset of trials. The trials were further sub-divided into low (0–0.33), medium (0.34–0.66), and high(0.67–1.0) psychophysical uncertainty. Figure 5A showsthe percent signal change for each trial type. Whereasthe BOLD response in the categorization network wasmodulated by uncertainty, no such relationship was ob-served in the oculomotor/attentional regions.
2392

---3
Discussion
Decision-making is often treated as a unitary cognitivefunction; however, it is likely that even simple decisionsinvolve an aggregation of several distinct subprocesses
Figure 2. Psychometric and Uncertainty Functions
(A) Trials were sorted to create percent ‘‘long’’ responses as a func-
tion of stimulus length in pixels (top panel). The two curves corre-
spond to the two cues (black and gray), respectively, for one typical
subject. The psychophysical data were acquired simultaneously with
the fMRI data. To create uncertainty functions (bottom panel), each
psychometric function was rectified around the PSE and normalized
such that the range varied from 0 to 1. Thus, by definition, the PSE has
maximum uncertainty and the endpoint stimuli have minimum uncer-
tainty. Each stimulus can have variable uncertainty depending on
which cue preceded it (although the biggest differences in uncer-
tainty between the two cues are near the categorical boundaries).
(B) The mean linear correlation coefficient between RT and uncer-
tainty is 0.342 (n = 10). The relationship between uncertainty and re-
action time, however, is not linear. There is no significant difference in
this relationship between the two cues. Error bars represent stan-
dard error across ten subjects.
NEUR
that includes signal detection, categorization, motorplanning, and outcome evaluation. In the context ofsensory-motor behavior, categorization may be an es-sential stage linking signal detection and motor planning,particularly when the mapping between stimulus andmotor response is contingent on behavioral context.Several prior studies have used functional imaging to
Figure 3. Activity Correlated to Categorization Uncertainty
Group (mixed effects) analysis of ten subjects, w750 trials/subject
(Z threshold at p < 0.05; cluster threshold at p < 0.05). (A) The net-
work of uncertainty-related areas consists of the medial frontal
gyrus (MFG), anterior insula (AI), ventral striatum (VS), and dorsome-
dial thalamus (dmTh). (B) The unthresholded Z statistic map demon-
strates the underlying correlational structure of the brain activity.
Blue indicates negatively correlated activity (Z < 21.6), red indicates
positively correlated activity (Z > 1.6), and black/white indicates the
95% confidence interval (21.96 < Z > 1.96), which contains voxels
that are not correlated to uncertainty. This figure illustrates that
the result in (A) is not a product of fortuitous thresholding. Cross
hairs intersect at the same point in all slices (MNI152: 0, 30, 24).
The unthresholded map is superimposed on a gray outline of an
average brain; the solid gray represents regions that were not
scanned in all subjects.
ON 2392

Neuron4
investigate the role of uncertainty in decision-making,though none has specifically focused on uncertainty re-lated to categorization (Huettel et al., 2005; Volz et al.,2003, 2004; Critchley et al., 2001; Paulus et al., 2002).These studies have instead demonstrated that, by vary-ing the probability with which a stimulus or responseoccurs, one can modulate activity in several regions ofthe frontal and parietal cortex (including LIP, MFG, AI,FEF, SEF, ACC, DLPFC, and VMPFC). The present work,however, distinguishes categorization uncertainty fromother decision variables and provides evidence that thisform of uncertainty modulates activity in a frontal-striatalloop.
To the extent that decision uncertainty is correlatedwith response time, our results are consistent with pre-vious reports. In the present study, however, we tookseveral steps to dissociate the categorical act from non-categorization processes present during the responsetime. By explicitly modeling response times, we ac-counted for non-categorization-related differences be-tween trial types. Furthermore, we segregated activitywith constant intensity across trials (unmodulated re-gressor) from activity with intensity modulated by cate-gorization uncertainty (uncertainty regressor). While theformer consists of a variety of cognitive processes, thelatter is likely to represent the comparison process itself.
The network of brain regions where activation wascorrelated with uncertainty after controlling for responsetime (MFG, AI, VS, dmTh) represents a classic basal
Figure 4. Attention and Categorization Networks Are Spatially Dis-
sociated
Activation map (p < 0.05; cluster p < 0.05) for a simple center-out
saccade task (left) shows that eye movements elicit activity in the
frontal eye fields, supplementary eye fields, and parietal eye fields.
The outlines of the activation clusters are overlaid on the unthre-
sholded Z statistic map of the uncertainty regressor, in which blue
indicates negative correlation with uncertainty (Z < 21.6), red indi-
cates positive correlation (Z < 1.6), and gray indicates the 95% con-
fidence interval in which activity is not correlated to uncertainty
(21.6 < Z < 1.6). The saccade activity overlay fits almost perfectly
into the gray regions of the unthresholded activation map, indicating
that the areas involved in directing spatial attention/oculomotor
control are not correlated to categorization uncertainty and are
therefore not involved in making categorical judgments.
NEURON
ganglia-thalamocortical loop (Alexander and Crutcher,1990). Converging neuropsychological and neuroimag-ing evidence has been used to construct a model of cat-egory learning that involves the prefrontal cortex, basalganglia, anterior cingulate, and thalamus (Maddox andAshby, 2004; Ashby and Maddox, 2005). Freedmanet al. (2003) have suggested that the mapping of a stim-ulus to abstract categories occurs throughout the frontalcortex, whereas the temporal lobe is involved in the pro-cessing of the physical properties of the stimulus. Wefound that two areas in the frontal cortex are involvedin processing categorical information, MFG (BA8) andAI. BA8 has been shown to be active in a variety of tasksthat involve cognitive control, preresponse conflict, anddecision uncertainty (Ridderinkhof et al., 2004). In fact,these types of tasks show increased activity throughoutthe medial wall of the frontal cortex, including areas
Figure 5. Hemodynamic Responses
(A) Percent BOLD signal change for trials within a 200 ms response
time window. The response time window for each subject was
chosen so as to maximize the total number of high-uncertainty trials.
However, the results were the same for three other nonoverlapping
windows (see Figure S6). Black, brown, and red represent low,
medium, and high uncertainty, respectively. Error bars represent
standard error. The oculomotor/attention brain regions show no sig-
nificant modulation by categorization uncertainty. However, AI, VS,
and MFG all show a positive correlation with uncertainty.
(B) To quantify this relationship, we computed the area under the
BOLD response curve over the first 8 s (gray square in first panel).
The integral of the BOLD response as a function of uncertainty
clearly shows a monotonically increasing relationship in AI, VS,
and MFG.
2392

---5
Figure 6. Extended Diffusion Model
The model explicitly represents three state
variables. Proximity to categorical boundary
is encoded as the rate of the diffusion pro-
cess. Accumulated evidence is the time inte-
gral of the diffusion rate. Decision uncertainty
is the time integral of the accumulated evi-
dence. The model predicts that response
times are proportional to decision uncertainty
and explains how response times can vary
when stimulus strength remains constant.
BA6, BA8, BA24, and BA32. In our case, we found thatthe unmodulated regressor shows increased activity inall of these regions; however, the uncertainty activationwas found only in BA8. The anterior cingulate (BA24;Figure 3B), the supplementary eye fields (BA6; Figure 4),and the DLPFC (BA46/9; Figure 4) showed no activitycorrelated with uncertainty after taking response timeinto account.
The AI is part of the orbitofrontal cortex and has wide-spread efferent and afferent projections to and from boththe frontal and parietal cortices (Mesulam and Mufson,1982a, 1982b), suggesting that it participates in the inte-gration of multimodal information. It has been sug-gested to be involved in the processing of reward valueand hedonic experience (Kringelbach, 2005). Studieshave shown that the AI is correlated with subjectivepleasantness ratings of food (Kringelbach et al., 2003),predicted reward value of odors (Gottfried et al., 2003),intensity of pain (Wager et al., 2004), and fairness of eco-nomic offers (Sanfey et al., 2003). All of these studiesmodulated the reward value of the stimulus, but sub-jects were also required to categorize the stimulus alonga given dimension. Furthermore, a number of studies ofdecision-making have shown insular activity in the ab-sence of reward modulation and/or minimal integrationdemands (Huettel et al., 2005; Volz et al., 2003, 2004;Critchley et al., 2001; Paulus et al., 2002). Thus, thereare at least two hypotheses for explaining activity inthe AI. In our task, AI activation was correlated with cat-egorization uncertainty even though reward value wasnot modulated.
The VS has been shown to be modulated by predict-ability of reward. Berns et al. (2001) showed that VSshowed increased activity when rewards became lesspredictable, a result consistent with models of dopa-mine release (Schultz et al., 1997). Category learningmodels have also involved the basal ganglia (Maddoxand Ashby, 2004). It is possible that the VS provides aninstructive signal necessary for the adjustment of a cate-gorical boundary when uncertainty is high. Such a strat-egy would allow subjects to minimize errors by main-taining accurate category boundaries.
Relationship of Imaging Results to Single
Neuron Studies
Single neuron recordings in behaving animals have beenused to identify activity associated with a number ofdecision processes. An emerging theme has been thatdecision-making is correlated with sustained neural ac-tivity that is integrated over time. Studies in inferior pari-etal lobule (Shadlen and Newsome, 2001) and DLPFC(Kim and Shadlen, 1999), for instance, have shown thatactivity accumulates over time, with a rate proportional
NEUR
to signal strength; and this build-up activity is a goodpredictor of oculomotor response times (Hanes andSchall, 1996).
These results have lent support to models in which bi-nary decisions are treated as a random walk or a racebetween two competing signal accumulators (Usherand McClelland, 2001; Ratcliff and Smith, 2004; Ratcliffet al., 2003): when enough evidence has been collectedby one of the accumulators, a response is selected. Thistype of model correctly predicts that response times arenegatively correlated with signal strength. Signal detec-tion models predict that general decision regions of thebrain should become more active as the decision be-comes easier (Heekeren et al., 2004). Indeed, a positivecorrelation between signal strength and neural activity isexpected for brain regions involved in signal detection.
However, these types of models have not been ableto explain how response times can vary when signalstrength is constant, nor do they account for neural ac-tivity that is positively correlated with response time.Categorization-related brain regions, however, shouldshow a different pattern of activity, especially when sig-nal strength is constant and above threshold. In fact,single cell recordings have shown that category selec-tive neurons fire earlier and with higher frequency thecloser the stimulus is to the categorical boundary(Freedman et al., 2001; Miller et al., 2003).
Our data suggest that decision uncertainty can be dis-sociated from stimulus discriminability, both psycho-physically and neurally. Our data also provide evidencefor a neural activation that increases with response time.To account for these observations, we propose a simpleextension of the standard diffusion model (Figure 6). Byintegrating the accumulated evidence over time, it ispossible to create a variable that we call decision effort,which increases as the rate of evidence accumulationdecreases. Such a model can explain how responsetimes can increase while stimulus strength remains con-stant and how decreasing information can create moreneural activity (i.e., a larger load on the categorizationprocess). This extension of the standard diffusion modelis natural because it involves nothing more than the re-peated application of neural time integration, a well-established neurocomputational principle (Aksay et al.,2001; Mazurek et al., 2003). The model provides a meansfor monitoring the rate of evidence accumulation, whichmay be important in assigning confidence to the out-come of the evidence accumulation process.
Experimental Procedures
Experiments were performed on ten adult subjects (five females;
ages: 18–34) who provided informed consent according to guide-
lines approved by the Institutional Review Boards of Columbia
ON 2392

Neuron6
University and the New York State Psychiatric Institute. All had nor-
mal vision.
Psychophysics
Prior to scanning, each subject was trained on the task outside the
scanner. Stimuli were presented on a calibrated 21 in CRT monitor
with a resolution of 1600 3 1200 pixels and frame rate of 75 Hz. Sub-
jects were seated comfortably with their head in a chinrest at a view-
ing distance of 36 in. Subjects responded by pressing a key on a
numeric keypad (USB interface). Both the identity of the key and
the time at which it was pressed were recorded. Stimulus generation
and response collection were managed using the Psychophysics
Toolbox running under Matlab 5.2 on a G4 Macintosh computer
(OS 9.2). This combination of software and hardware was tested to
ensure precise timing control over stimuli and responses. Auditory
feedback was provided to indicate a correct (high tone) or incorrect
(low tone) response.
Subject’s responses were sorted to produce psychometric func-
tions indicating the percentage of trials on which the stimulus was
categorized as ‘‘long’’ as a function of physical stimulus length in
pixels. The psychometric functions were fit with Weibull (Quick,
1974) functions of the following form:
ð1Þ percent long = 1 2 2ðx=mÞ3
The parameters m and 3 were fit by maximum likelihood estima-
tion. The uncertainty function was defined as follows:
ð2Þ uncertainty =
����
����0:5 2 2ð
xmÞ
3����2 0:5
����
j
where 4 was equal to the value of the uncertainty at the PSE. The
PSE was defined as the stimulus length for which percent long = per-
cent short = 50%. We defined a discrimination threshold, or just
noticeable difference (jnd), DL, as half the difference between the
25% and 75% correct points on the psychometric function. We
also defined a Weber fraction, DL/L, as the jnd divided by the PSE.
Response times were measured as the time (in ms) elapsed between
the onset of the test stimulus and the registration of the key press.
To minimize learning-related effects over the course of the exper-
iment, subjects performed 1000 trials (100 trials per session) outside
the scanner over the course of a week prior to starting the fMRI scan-
ning sessions. Performance on the task reached asymptotic levels
after approximately 200 to 300 trials. Subjects performed one prac-
tice run within the scanner prior to data collection. Each subject was
scanned 10 times. The series of scans for each subject took place
within a 3–6 week period with no more than one session per day.
Psychophysical thresholds were compared between the fMRI and
the psychophysics experiments to confirm that the tasks were
equally difficult.
During the fMRI experiment, stimuli were presented using a cali-
brated LCD projector (Sanyo PLCXP30) at a resolution of 1280 3
1024 pixels and a frame rate of 75 Hz. Stimuli were generated and re-
sponses collected using the Psychophysics Toolbox running under
Matlab 5.2 on a G4 Macintosh computer (OS 9.2). Auditory feedback
was provided via MR-compatible headphones. Stimulus size was
adjusted to match the stimuli in the psychophysics experiments.
The cue stimuli were red and green circles, 5.0º in diameter and
0.2º thick. The colors were matched for luminance. The line stimuli
were black, vertically oriented line segments, 4 pixels wide, 40–70
pixels long, ranging from 0.4º to 0.7º in height against a gray back-
ground. The line segments were blurred by filtering with a 2D Gauss-
ian blur function of the following form:
ð3Þ Gðx; yÞ= e2ðx 2 x0Þ2 + ðy 2 y0Þ2
s2
where s is the space constant of the blur function. An individualized
blur was applied to each subject’s stimulus set to make the task
of roughly equal difficulty (as measured by the Weber fraction)
across subjects. The stimulus set was also adjusted such that
it spanned a broad range of high, medium, and low values of
uncertainty.
NEURO
fMRI Imaging
Imaging experiments were conducted using a 1.5T GE Scanner us-
ing a standard GE birdcage head coil. A bite bar was used to mini-
mize head motion. Structural scans were performed using the 3D
SPGR sequence (124 slices; 256 3 256; FOV = 200 mm). Functional
scans were performed using EPI bold (TE = 50; TR = 1.6; 17 slices;
64 3 64; FOV = 200 mm; voxel size = 3 mm 3 3 mm 3 5.5 mm). Slices
were positioned to cover the frontal and parietal lobes on all sub-
jects. Some subjects had brains larger than the z axis FOV
(94 mm), which resulted in no coverage in the most ventral portions
of the occipital and temporal lobe. We only report activity for voxels
common to all ten subjects.
All analysis was done using the FMRIB Software Library (FSL;
http://www.fmrib.ox.ac.uk/fsl/index.html). Preprocessing consisted
of motion correction (McFlirt), brain extraction (BET), high-pass fil-
tering (>50 s), and spatial filtering (FWHM = 5 mm). Standard statis-
tical parametric mapping techniques (FEAT) were performed in orig-
inal T2* space. Multiple linear regression was used to identify voxels
that correlated with specific behavioral events. Activation thresh-
olds were set at p = 0.05, resel corrected. Second level analyses
were performed in standard MNI152 space by applying the registra-
tion transformation matrices to the parameter estimates. In order to
maximize the statistical power of the event-related fMRI data analy-
sis, the stimuli were presented with a temporal jitter. The two ISIs
and ITI were uniformly distributed across values from 1 to 4 s. This
results in a mean ISI and ITI equal to 2.5 s. Recent work (Wager
and Nichols, 2003) suggests that ITIs of 2.5 s have high efficiency
for parameter estimation.
Supplemental Data
The Supplemental Data include Supplemental Results, six supple-
mental figures, and two supplemental tables and can be found
with this article online at http://www.neuron.org/cgi/content/full/
49/6/---/DC1/.
Acknowledgments
This research was supportedbyRO1MH59244 (V.P.F.), T32MH015174
(J.G.), and T32EY013933 (J.G.). We would like to thank Christopher
Summerfield, Tobias Egner, Hannah M. Bayer, and especially Chris-
topher R. Kelly for reading the manuscript and providing valuable
feedback; and Stephen Dashnaw for his technical help and MR
expertise.
Received: August 10, 2005
Revised: November 10, 2005
Accepted: January 24, 2006
Published online: March 15, 2006
References
Aksay, E., Gamkrelidze, G., Seung, H.S., Baker, R., and Tank, D.W.
(2001). In vivo intracellular recording and perturbation of persistent
activity in a neural integrator. Nat. Neurosci. 4, 184–193.
Alexander, G.E., and Crutcher, M.D. (1990). Functional architecture
of basal ganglia circuits: neural substrates of parallel processing.
Trends Neurosci. 13, 266–271.
Ashby, F.G., and Maddox, W.T. (2005). Human category learning.
Annu. Rev. Psychol. 56, 149–178.
Berns, G.S., McClure, S.M., Pagnoni, G., and Montague, P.R. (2001).
Predictability modulates human brain response to reward. J. Neuro-
sci. 21, 2793–2798.
Critchley, H.D., Mathias, C.J., and Dolan, R.J. (2001). Neural activity
in the human brain relating to uncertainty and arousal during antici-
pation. Neuron 29, 537–545.
Freedman, D.J., Riesenhuber, M., Poggio, T., and Miller, E.K. (2001).
Categorical representation of visual stimuli in the primate prefrontal
cortex. Science 291, 312–316.
Freedman, D.J., Riesenhuber, M., Poggio, T., and Miller, E.K. (2003).
A comparison of primate prefrontal and inferior temporal cortices
during visual categorization. J. Neurosci. 23, 5235–5246.
N 2392

---7
Gottfried, J.A., O’Doherty, J., and Dolan, R.J. (2003). Encoding pre-
dictive reward value in human amygdala and orbitofrontal cortex.
Science 301, 1104–1107.
Hanes, D.P., and Schall, J.D. (1996). Neural control of voluntary
movement initiation. Science 274, 427–430.
Heekeren, H.R., Marrett, S., Bandettini, P.A., and Ungerleider, L.G.
(2004). A general mechanism for perceptual decision-making in the
human brain. Nature 431, 859–862.
Huettel, S.A., Song, A.W., and McCarthy, G. (2005). Decisions under
uncertainty: probabilistic context influences activation of prefrontal
and parietal cortices. J. Neurosci. 25, 3304–3311.
Kim, J.N., and Shadlen, M.N. (1999). Neural correlates of a decision
in the dorsolateral prefrontal cortex of the macaque. Nat. Neurosci.
2, 176–185.
Kringelbach, M.L. (2005). The human orbitofrontal cortex: linking re-
ward to hedonic experience. Nat. Rev. Neurosci. 6, 691–702.
Kringelbach, M.L., O’Doherty, J., Rolls, E.T., and Andrews, C. (2003).
Activation of the human orbitofrontal cortex to a liquid food stimulus
is correlated with its subjective pleasantness. Cereb. Cortex 13,
1064–1071.
Maddox, W.T., and Ashby, F.G. (2004). Dissociating explicit and pro-
cedural-learning based systems of perceptual category learning.
Behav. Processes 66, 309–332.
Mazurek, M.E., Roitman, J.D., Ditterich, J., and Shadlen, M.N. (2003).
A role for neural integrators in perceptual decision making. Cereb.
Cortex 13, 1257–1269.
Mesulam, M.M., and Mufson, E.J. (1982a). Insula of the old world
monkey. II: Afferent cortical output and comments on function.
J. Comp. Neurol. 212, 23–37.
Mesulam, M.M., and Mufson, E.J. (1982b). Insula of the old world
monkey. III: Efferent cortical output and comments on function.
J. Comp. Neurol. 212, 38–52.
Miller, E.K., Nieder, A., Freedman, D.J., and Wallis, J.D. (2003). Neu-
ral correlates of categories and concepts. Curr. Opin. Neurobiol. 13,
198–203.
Paulus, M.P., Hozack, N., Frank, L., and Brown, G.C. (2002). Error
rate and outcome predictability affect neural activation in prefrontal
cortex and anterior cingulate during decision-making. Neuroimage
15, 836–846.
Platt, M.L., and Glimcher, P.W. (1999). Neural correlates of decision
variables in parietal cortex. Nature 400, 233–238.
Posner, M.I., and Petersen, S.E. (1990). The attention system of the
human brain. Annu. Rev. Neurosci. 13, 25–42.
Quick, R.F. (1974). A vector-magnitude model of contrast detection.
Kybernetik 16, 65–67.
Ratcliff, R., and Smith, P.L. (2004). A comparison of sequential sam-
pling models for two-choice reaction time. Psychol. Rev. 111, 333–
367.
Ratcliff, R., Cherian, A., and Segraves, M. (2003). A comparison of
macaque behavior and superior colliculus neuronal activity to pre-
dictions from models of two-choice decisions. J. Neurophysiol. 90,
1392–1407.
Ridderinkhof, K.R., Ullsperger, M., Crone, E.A., and Nieuwenhuis, S.
(2004). The role of the medial frontal cortex in cognitive control. Sci-
ence 306, 443–447.
Sanfey, A.G., Rilling, J.K., Aronson, J.A., Nystrom, L.E., and Cohen,
J.D. (2003). The neural basis of economic decision-making in the Ul-
timatum Game. Science 300, 1755–1758.
Schall, J.D., and Hanes, D.P. (1993). Neural basis of saccade target
selection in frontal eye field during visual search. Nature 366, 467–
469.
Schultz, W., Dayan, P., and Montague, P.R. (1997). A neural sub-
strate of prediction and reward. Science 275, 1593–1599.
Shadlen, M.N., and Newsome, W.T. (2001). The basis of a perceptual
decision in the parietal cortex (area LIP) of the rhesus monkey.
J. Neurophysiol. 86, 1916–1936.
Usher, M., and McClelland, J.L. (2001). The time course of percep-
tual choice: the leaky, competing accumulator model. Psychol.
Rev. 108, 550–592.
NEU
Volz, K.G., Schubotz, R.I., and von Cramon, D.Y. (2003). Predicting
events of varying probability: uncertainty investigated by fMRI. Neu-
roimage 19, 271–280.
Volz, K.G., Schubotz, R.I., and von Cramon, D.Y. (2004). Why am I
unsure? Internal and external attributions of uncertainty dissociated
by fMRI. Neuroimage 21, 848–857.
Wager, T.D., and Nichols, T.E. (2003). Optimization of experimental
design in fMRI: a general framework using a genetic algorithm. Neu-
roimage 18, 293–309.
Wager, T.D., Rilling, J.K., Smith, E.E., Sokolik, A., Casey, K.L.,
Davidson, R.J., Kosslyn, S.M., Rose, R.M., and Cohen, J.D. (2004).
Placebo-induced changes in fMRI in the anticipation and experience
of pain. Science 303, 1162–1167.
RON 2392
1
Supporting Online Material
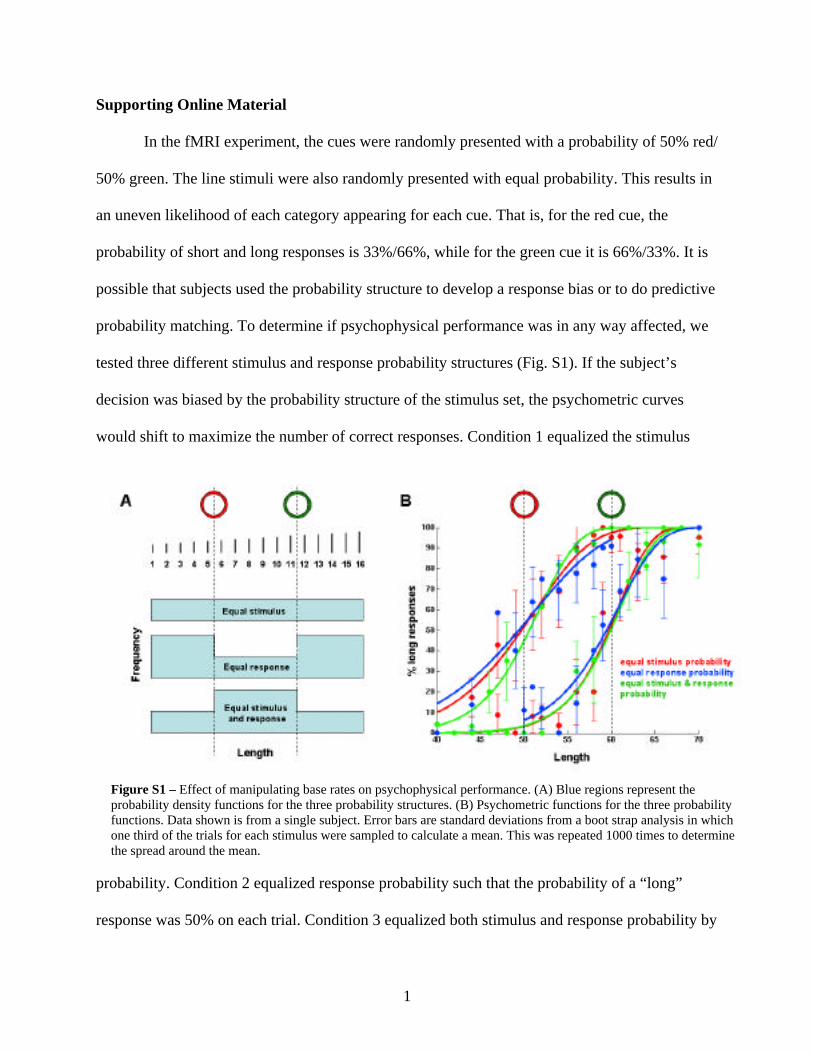
In the fMRI experiment, the cues were randomly presented with a probability of 50% red/
50% green. The line stimuli were also randomly presented with equal probability. This results in
an uneven likelihood of each category appearing for each cue. That is, for the red cue, the
probability of short and long responses is 33%/66%, while for the green cue it is 66%/33%. It is
possible that subjects used the probability structure to develop a response bias or to do predictive
probability matching. To determine if psychophysical performance was in any way affected, we
tested three different stimulus and response probability structures (Fig. S1). If the subject’s
decision was biased by the probability structure of the stimulus set, the psychometric curves
would shift to maximize the number of correct responses. Condition 1 equalized the stimulus
probability. Condition 2 equalized response probability such that the probability of a “long”
response was 50% on each trial. Condition 3 equalized both stimulus and response probability by
Figure S1 – Effect of manipulating base rates on psychophysical performance. (A) Blue regions represent theprobability density functions for the three probability structures. (B) Psychometric functions for the three probabilityfunctions. Data shown is from a single subject. Error bars are standard deviations from a boot strap analysis in whichone third of the trials for each stimulus were sampled to calculate a mean. This was repeated 1000 times to determinethe spread around the mean.

2
using two overlapping but not identical stimulus sets (i.e. lengths 40-60 for categorical boundary
1 and lengths 50-70 for categorical boundary 2). The three psychometric functions were not
significantly different from each other (Table S1) indicating that the subjects were unaware of
the underlying stimulus probability structure.
Table S1 – ANOVA of cue type by probability structure
2-way ANOVA Red Cue Green Cue
Subject 1 F=1.02, p=0.37 F=0.86, p=0.43
Subject 2 F=2.11, p=0.14 F=0.76, p=0.48
Subject 3 F=2.37, p=0.11 F=1.11, p=0.34

3
The design matrix (Fig. S2) for performing multiple linear regression, contained
regressors constructed by convolving a step function with a hemodynamic response function. It
is important to model each event in the trial so that variance from the auditory feedback, for
example, is not misattributed to the decision regressors. To account for as much variance as
possible, there were six regressors for each trial: cue regressor, delay regressor, unmodulated
response time regressor, uncertainty regressor, correct auditory feedback regressor, and incorrect
auditory feedback regressor.
By modeling each event in the trial, the likelihood of misattributing variance is reduced,
however, it raises the possibility that one or more of the regressors are collinear. To evaluate
whether the regression model was rank deficient, we calculated the eigenvalues of the design
matrix. Any eigenvalues near zero indicate the presence of collinearities among the predictor
variables. A measure of collinearity is the condition number of the matrix. This is the ratio of the
largest to smallest eigenvalues of the matrix. Condition number values greater than 30 indicate
potential problems with collinearity among predictor variables (Belsley, Kuh, Welsch, 1980).
We set a condition number threshold at 20 for excluding data sets from our analysis. None of the
data sets reached this threshold.
Delay
Unmodulated
Cue
Uncertainty
Auditory Correct
Auditory Error
Trial 1 Trial 2 Trial 3
Figure S2 – Design matrix for the multiple linear regression. The unmodulated regressor was designed to modelnon-categorization-related processes. The uncertainty regressor was designed to model categorization-relatedactivity processes in the brain. Both regressors explicitly modeled the response time for each trial. However, onlythe uncertainty regressor had an additional modulation in height that was proportional to the categorizationuncertainty for that stimulus. This design matrix was then convolved with a standard hemodynamic responsefunction.

4
Moreover, the statistical test in linear regression takes into account the orthogonality of
the design matrix. As the design matrix becomes less orthogonal, statistical threshold becomes
more difficult to reach. Thus, our confidence that a voxel is significant in a rank deficient matrix
is no different than in a non-rank deficient matrix. The problem with rank deficiency is that the
result may be highly data-specific and thus may not generalize across subjects. In our case, the
results were consistent across all subjects
(Fig. S3), suggesting that rank deficiency is
not a problem.
We also performed an alternative
regression analysis in which we
orthogonalized the unmodulated regressor
with respect to the uncertainty regressor,
effectively attributing any common
variance between the two regressors to the
unmodulated regressor. The remaining
variance was then tested for a significant
relationship with the uncertainty regressor.
The null hypothesis in this type of analysis is that all the variance can be explained by the
unmodulated response time regressor and none by the uncertainty regressor. The resulting
activation pattern was nearly identical to that in Fig. 3, except that significant voxels in the
uncertainty activation map had even greater Z-scores.
Figure S3 – Consistency of activation across subjects.Colored voxels represent the number of subjects thatshowed significant uncertainty-related activation. The mapindicates that the MFG-AI-VS-dmTh network wasconsistently present across subjects. The map wasgenerated by taking the fixed-effects group analysis foreach subject, binarizing it, and summing the binary mapsacross subjects. The range of values for each voxel is 0 to10.

5
Most imaging studies provide evidence for
the hypothesis that any task requiring focused
attention results in correlated activity across much
of the brain. This is expected, since most tasks
place a load on a wide range of cognitive
processes, such as, signal detection, spatial
attention, working memory, motor planning,
outcome evaluation, etc. Thus, any brain region
involved in any of these processes, should show
correlated activity. Fig. S4 (top panel) shows
activity that was present during the decision period
that was not modulated by categorization
uncertainty; the activity is widely distributed
throughout the brain. This regressor is, however,
modulated in time; that is, the amplitude of the
regressor after convolution with an HRF, is
dependent on the trial RT. Thus, the activity is correlated with any cognitive process that shows a
constant load per unit time over the duration of the trial and can be interpreted as non-specific
processing (i.e. signal detection, spatial attention, working memory, etc) present during any task
requiring focused attention.
By having the unmodulated regressor in the model, we have effectively accounted for this
source of variance and segregated it from the variance related to categorization uncertainty. It is
Figure S4 – Unmodulated activation. Activitycorrelated to the task was present in manybrain regions.

6
important to point out that most studies in decision making have not done this. That is,
uncertainty related activity is often attributed to an “unmodulated” regressor.
7
The psychophysical functions were highly consistent across all 10 subjects (Fig. S5A).
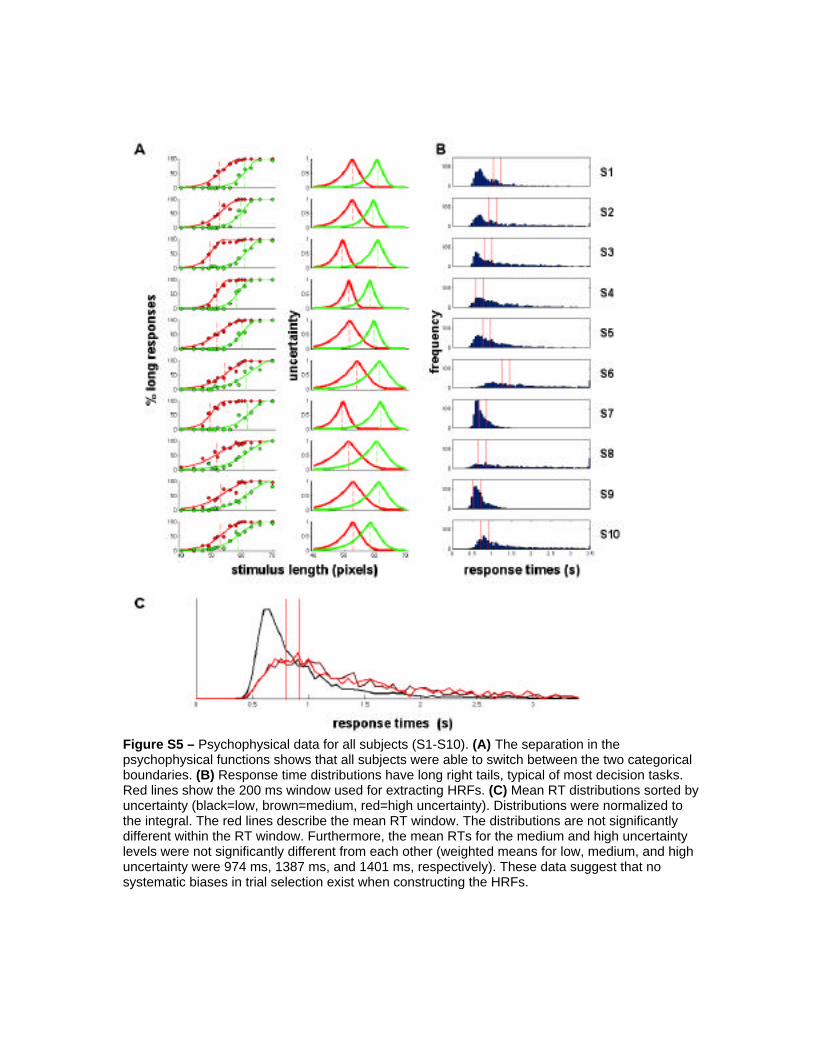
Figure S5 – Psychophysical data for all subjects (S1-S10). (A) The separation in thepsychophysical functions shows that all subjects were able to switch between the two categoricalboundaries. (B) Response time distributions have long right tails, typical of most decision tasks.Red lines show the 200 ms window used for extracting HRFs. (C) Mean RT distributions sorted byuncertainty (black=low, brown=medium, red=high uncertainty). Distributions were normalized tothe integral. The red lines describe the mean RT window. The distributions are not significantlydifferent within the RT window. Furthermore, the mean RTs for the medium and high uncertaintylevels were not significantly different from each other (weighted means for low, medium, and highuncertainty were 974 ms, 1387 ms, and 1401 ms, respectively). These data suggest that nosystematic biases in trial selection exist when constructing the HRFs.

8
Response times varied significantly across trials (Fig. S5B). For this reason, we modeled the
response times explicitly in our regression model. Increases in the BOLD signal can originate
from differences in signal duration (i.e. response time) or in signal intensity (i.e. categorization
uncertainty). If the relationship between the BOLD signal and response time was not perfectly
linear, differences in the duration of the categorization process could be misattributed to
differences in intensity of the categorization process. To control for this possibility, we fixed the
duration of the categorization process by choosing a 200 ms RT window from which to average
HRFs. Because, uncertainty and RT are partially correlated any given RT window will not have
the same number of high and low uncertainty trials. That is, the probability density function is
broader for high uncertainty than low uncertainty trials, resulting in fewer high uncertainty trials
in most RT windows. For this reason, we chose RT windows that maximized the number of high
uncertainty trials. The 200 ms window used for extracting HRFs is shown for each subject.

9
To further test the validity of
this analysis, we used three other
non-overlapping RT windows to
extract HRFs. These windows are
suboptimal in that sometimes the
estimate for the low uncertainty
trials is good, while the estimate for
high uncertainty trials is not; other
windows show the reverse pattern.
Sometimes, the estimate is
suboptimal for all three trial types
due to the differences in subjects
RT distributions (e.g. compare RT
histograms for S6 and S7).
Moreover, the fewer low, medium,
or high uncertainty trials that are
contained within a window, the
worse the estimate of that HRF.
Nevertheless, Fig. S6A shows the
same pattern for categorization and non-categorization regions as in Fig. 4, suggesting that no
bias exists for the optimal windows. Categorization regions show increasing hemodynamic
responses as a function of uncertainty, whereas oculomotor/attention regions show no
relationship with uncertainty.
Figure S6 – HRF integrals for three RT windows. (A) Thecategorization network shows activity positively correlated withuncertainty (top row); the oculomotor/attention network showsactivity not correlated with uncertainty. (B) Red lines show the 200ms window used for extracting HRFs and calculating the integrals in(A) for the 10 subjects.
10
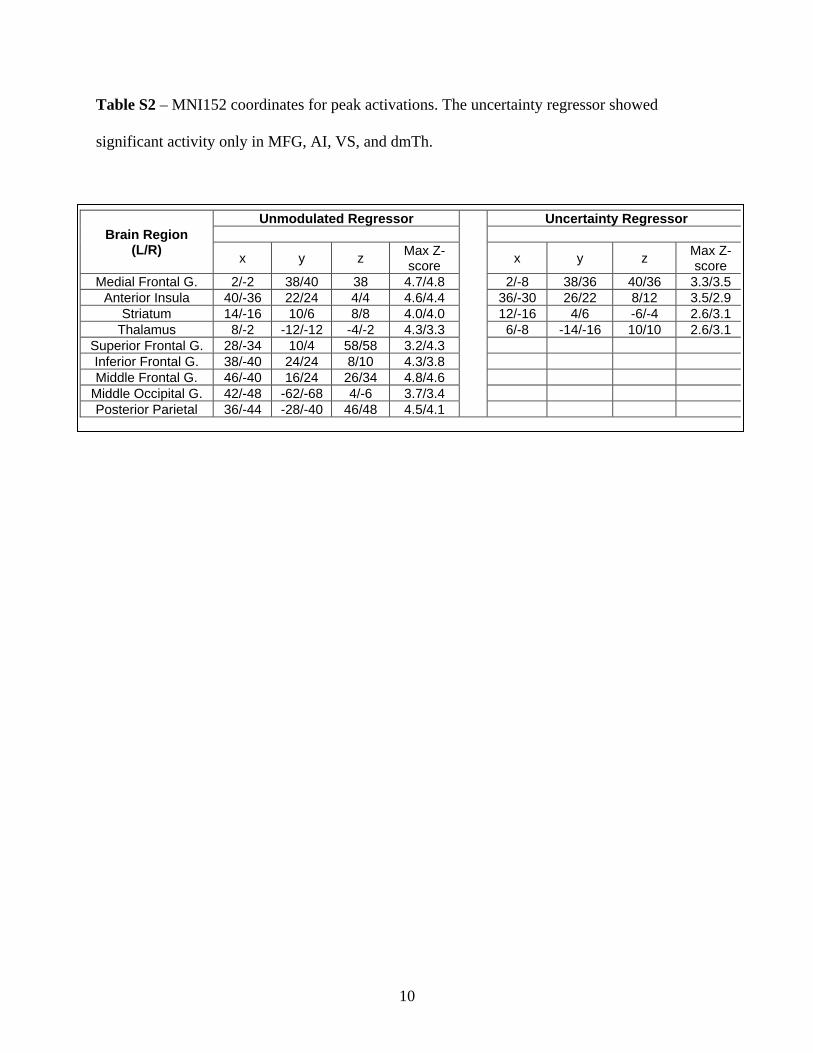
Table S2 – MNI152 coordinates for peak activations. The uncertainty regressor showed
significant activity only in MFG, AI, VS, and dmTh.
Unmodulated Regressor Uncertainty RegressorBrain Region
(L/R)x y z
Max Z-score
x y zMax Z-score
Medial Frontal G. 2/-2 38/40 38 4.7/4.8 2/-8 38/36 40/36 3.3/3.5Anterior Insula 40/-36 22/24 4/4 4.6/4.4 36/-30 26/22 8/12 3.5/2.9
Striatum 14/-16 10/6 8/8 4.0/4.0 12/-16 4/6 -6/-4 2.6/3.1Thalamus 8/-2 -12/-12 -4/-2 4.3/3.3 6/-8 -14/-16 10/10 2.6/3.1
Superior Frontal G. 28/-34 10/4 58/58 3.2/4.3Inferior Frontal G. 38/-40 24/24 8/10 4.3/3.8Middle Frontal G. 46/-40 16/24 26/34 4.8/4.6
Middle Occipital G. 42/-48 -62/-68 4/-6 3.7/3.4Posterior Parietal 36/-44 -28/-40 46/48 4.5/4.1