Neurodiagnostic Profession Salary and Benefits …...Neurodiagnostic Profession Salary and Benefits...
16
Neurodiagnostic Profession Salary and Benefits Report 2015 LAB MANAGEMENT Executive Summary
Transcript of Neurodiagnostic Profession Salary and Benefits …...Neurodiagnostic Profession Salary and Benefits...
Neurodiagnostic Profession Salary and Benefits Report
2015
LAB MANAGEMENT
Executive Summary
2 | P a g e
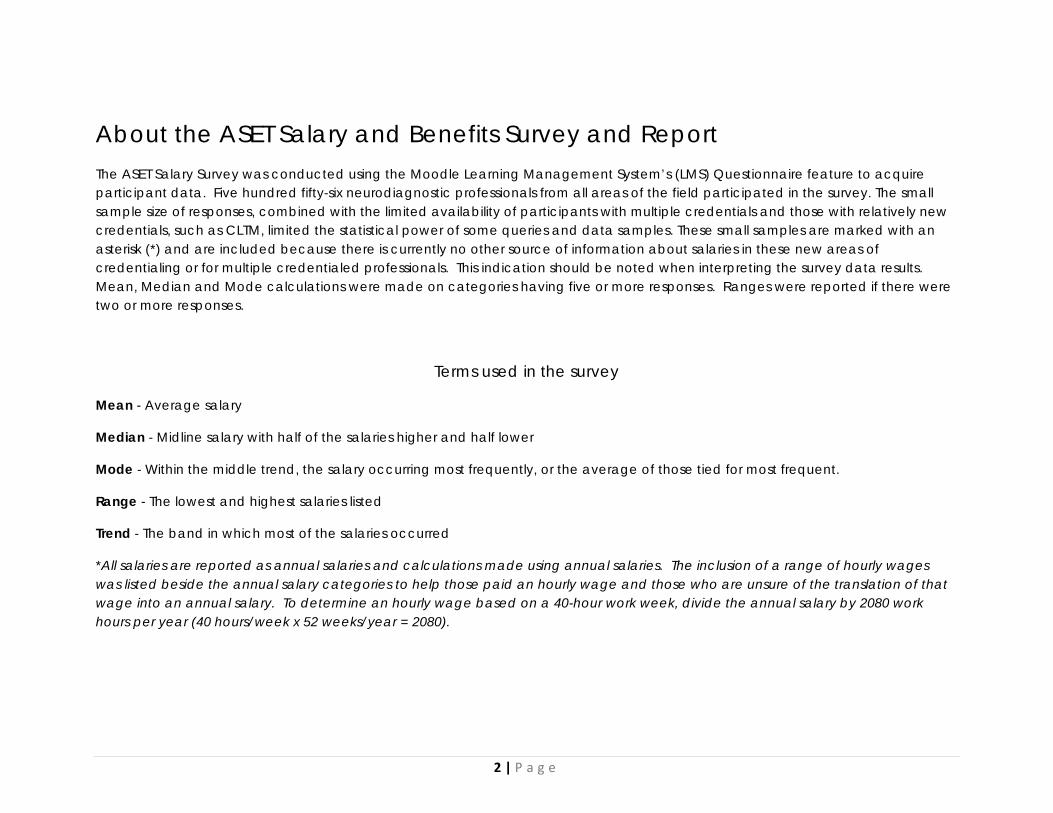
About the ASET Salary and Benefits Survey and Report The ASET Salary Survey was conducted using the Moodle Learning Management System’s (LMS) Questionnaire feature to acquire participant data. Five hundred fifty-six neurodiagnostic professionals from all areas of the field participated in the survey. The small sample size of responses, combined with the limited availability of participants with multiple credentials and those with relatively new credentials, such as CLTM, limited the statistical power of some queries and data samples. These small samples are marked with an asterisk (*) and are included because there is currently no other source of information about salaries in these new areas of credentialing or for multiple credentialed professionals. This indication should be noted when interpreting the survey data results. Mean, Median and Mode calculations were made on categories having five or more responses. Ranges were reported if there were two or more responses.
Terms used in the survey
Mean - Average salary
Median - Midline salary with half of the salaries higher and half lower
Mode - Within the middle trend, the salary occurring most frequently, or the average of those tied for most frequent.
Range - The lowest and highest salaries listed
Trend - The band in which most of the salaries occurred
*All salaries are reported as annual salaries and calculations made using annual salaries. The inclusion of a range of hourly wages was listed beside the annual salary categories to help those paid an hourly wage and those who are unsure of the translation of that wage into an annual salary. To determine an hourly wage based on a 40-hour work week, divide the annual salary by 2080 work hours per year (40 hours/week x 52 weeks/year = 2080).

3 | P a g e
Participant Demographics
Total participants 556
ASET members 85%
Male 28%
Female 72%
Age
Region
CT, DE, MA, ME, NH, NJ, NY, PA, RI, VT 18%
DC, MD, NC, VA, WV 7%
AL, FL, GA, MS, SC 11%
IL, IN, KY, MI, OH, TN 17%
IA, KS, MN, MO, NE, ND, SD, WI 14%
AR, LA, OK, TX 12%
AZ, CO, IN, MT, NM, NV, UT, WY 9%
CA, WA, OR 11%
AK, HI <1%
Other 1%
3%
12%
16%
12%
11%
12%
14%
14%
5%
1%
0% 5% 10% 15% 20%
21-25
26-30
31-35
36-40
41-45
46-50
51-55
56-60
61-65
66 or older

4 | P a g e
General Information
Years in the field of Neurodiagnostics
Educational Requirements for current position
High school grad or GED 30% Graduate of Accredited certificate program in Neurodiagnostics 11%
Graduate of certification program in Neurodiagnostics (Accreditation not required) 6%
Associates Degree in Neurodiagnostics 11% Associates Degree non-specific 7% Associates Degree in science field 4% Bachelor’s Degree 20% Master’s Degree 2% Ph.D. 1% Other* 7%
*Other: R.N., CMA, CNIM, R. EEG T., Certificate of Healthcare Management, Some work experience minimal 1 to 3 or 5 years, management experience, work experience and OJT, licensure in Audiology or Chiropractic.
Credentials required for job
R. EEG T. 37%
R. EP T. 7%
RPSGT 4%
CPSGT <1%
R.NCS.T. 4%
RRT <1%
CRT <1%
CNCT 2%
CLTM 2%
CNIM 17%
DABNM <1% Other (Lab Spec Adv, R.T. or R.E.T. Canadian Registry, MHA, ABRET Eligibility, RN, BSN, any one ABRET registry)
4%
No credentials required for position 22%
3% 6%
12% 17%
10% 11% 7%
12% 7%
16%
Years

5 | P a g e
Primary Job, chief function
Lab Director (budget, hire/fire, etc.) 5%
Supervisor (supervise other technologists) 1%
Lead Technologist or Chief Technologist 19%
Staff Technologist 53%
One Technologist Lab (one person department) 12%
Trainee (currently training on the job) <1%
Student (earning no salary or wages) <1% Technologist Assistant (working under supervision of registered technologist) 1%
Program Director of a Formal School 1% Instructor/Educator In A School Or Clinical Training Site 1%
Clinical Coordinator in a Formal Training Program <1%
Research <1%
Instrument Company 1%
Neurophysiologist (Ph.D. or M.D.) 1%
Other* 5%
*Other: Manager, Director, Former Program Director, EKG/EEG Supervisor, Neurophysiologist, Sleep/EEG Technologist, EEG Reader.
Describe Employer
General Hospital 35%
Specialty Hospital or Veterans Administration 2%
Specialty Hospital Pediatric 7%
Specialty Hospital Physical Rehab <1%
University or Teaching Hospital 25% Outpatient Clinic (free standing, HMO, Hospital Sponsored) 4%
Multi-specialty Office or Large Clinic 2%
Physician Office (Neurology, etc.) 8%
Service Contractor, Home Health, Mobile Service, IONM Company 13%
School of Neurodiagnostics 1%
Instrument Company 1%
Research Institute or Facility 1%
Self-Employed 1%
Other* 2%
*Other: Primary practice, Rehab, Level 1 Trauma Hospital, company that manages nonclinical staff, pediatric neurology.

6 | P a g e
Primary Employer Ownership
Federal (VA or Military) 2%
State 6%
County or City 3%
University 10% Private for Profit (hospital, physicians practice, corporation) 32%
Private Not for Profit (hospital, clinic, etc.) 38%
Not Sure? 7%
Other* 1%
*Other: Academic Health Center, Government/provincial, Corporate, Public Company, Associates, Catholic Hospital.
Procedures Performed by Your Position
EEG (routine) 76%
Ambulatory, EEG Recording 41%
Ambulatory, EEG Scanning 24%
LTM/EMU Monitoring for Epilepsy 47%
Remote Neurotelemetry Monitoring (off site) for Epilepsy 15%
Neurotelemetry Scanning for Epilepsy 33%
Neurotelemetry Monitoring for ICU/cEEG 31% Remote Neurotelemetry Monitoring (off site) for ICU/cEEG 14%
Ictal SPECT 12%
Wada Testing 20%
Clinical Auditory Evoked Potentials 42%
Clinical Visual Evoked Potentials 43%
Clinical Somatosensory Evoked Potentials 40%
Motor Evoked Potentials in IONM 29%
Surgical EEG Monitoring 38%
Surgical EP Monitoring 32%
Surgical Surface EMG/Nerve Conduction Monitoring 25%
Electrocortical EEG 22%
Stereotactic EEG 3%
Polysomnograms 6%
Polysomnogram Scoring 5%
CPAP, BiPAP Administration 5%
Multiple Sleep Latency (MSLT) 6%
Maintenance of Wakefulness Test (MWT) 4%
Ambulatory PSG/Taped at Home Studies 3%
Nerve Conduction Studies 29% Needle EMG Assisting (set up instrument, take notes, prep patient) 25%
Adjustments to Vagal Nerve Stimulator 2%
Cerebral Death Tracings Using EEG 44%
Cerebral Death Tracings Using EP 14%
Nasopharynageal EEG 1%
Sphenoidal EEG 3%
7 | P a g e
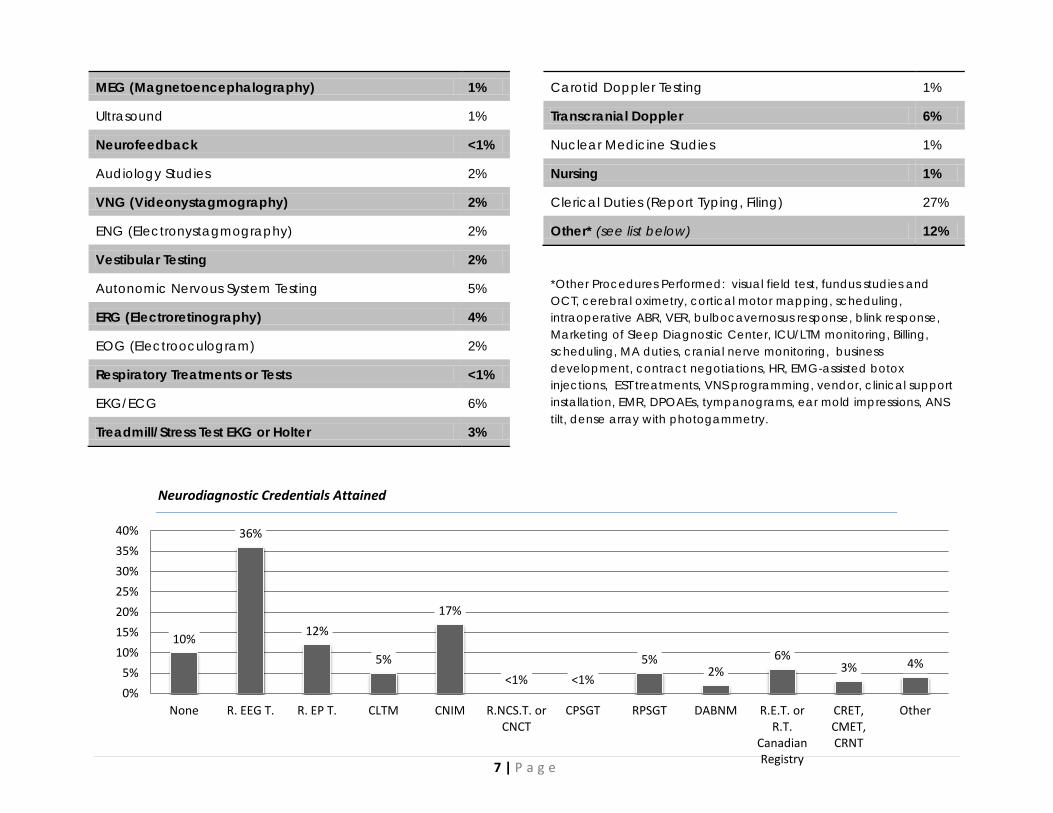
MEG (Magnetoencephalography) 1%
Ultrasound 1%
Neurofeedback <1%
Audiology Studies 2%
VNG (Videonystagmography) 2%
ENG (Electronystagmography) 2%
Vestibular Testing 2%
Autonomic Nervous System Testing 5%
ERG (Electroretinography) 4%
EOG (Electrooculogram) 2%
Respiratory Treatments or Tests <1%
EKG/ECG 6%
Treadmill/Stress Test EKG or Holter 3%
Carotid Doppler Testing 1%
Transcranial Doppler 6%
Nuclear Medicine Studies 1%
Nursing 1%
Clerical Duties (Report Typing, Filing) 27%
Other* (see list below) 12%
*Other Procedures Performed: visual field test, fundus studies and OCT, cerebral oximetry, cortical motor mapping, scheduling, intraoperative ABR, VER, bulbocavernosus response, blink response, Marketing of Sleep Diagnostic Center, ICU/LTM monitoring, Billing, scheduling, MA duties, cranial nerve monitoring, business development, contract negotiations, HR, EMG-assisted botox injections, EST treatments, VNS programming, vendor, clinical support installation, EMR, DPOAEs, tympanograms, ear mold impressions, ANS tilt, dense array with photogammetry.
Neurodiagnostic Credentials Attained
10%
36%
12%
5%
17%
<1% <1% 5%
2% 6%
3% 4%
0% 5%
10% 15% 20% 25% 30% 35% 40%
None R. EEG T. R. EP T. CLTM CNIM R.NCS.T. or CNCT
CPSGT RPSGT DABNM R.E.T. or R.T.
Canadian Registry
CRET, CMET, CRNT
Other
8 | P a g e
74% reported that their employer pays more in salary to staff with credentials.
The complete Salary and Benefits report will include percentages and figures for many questions regarding the field of Neurodiagnostics; including but not limited to:
• Examples of Incentives Employer Provides to take and pass exams • Highest Level of Education Attained • Specific Neurodiagnostic Training • Examples of Employer Paid Professional Development • Examples of Employer Paid Benefits

9 | P a g e
Highest Level of Education Attained
8% 9%
5%
12%
4%
22%
28%
6% 4% 4%
0%
5%
10%
15%
20%
25%
30%

10 | P a g e
Specific Neurodiagnostic Training
44%
10%
26%
15%
5%
12%
32%
1% <1%
56%
0%
10%
20%
30%
40%
50%
60%
* CAAHEP Accredited - 65%, *Not Accredited - 18%, *Don't know if program was accredited - 16%

11 | P a g e
Neurodiagnostic Professionals Salary Ranges
The complete Salary and Benefits report will include percentages and figures for many questions regarding the field of Neurodiagnostics; including but not limited to:
• Salaries by Credentials • Salaries by Education • Salaries by National Region • Salaries by Facility Type • Salary Ranges for Self-Employed Neurodiagnostic Professionals

12 | P a g e
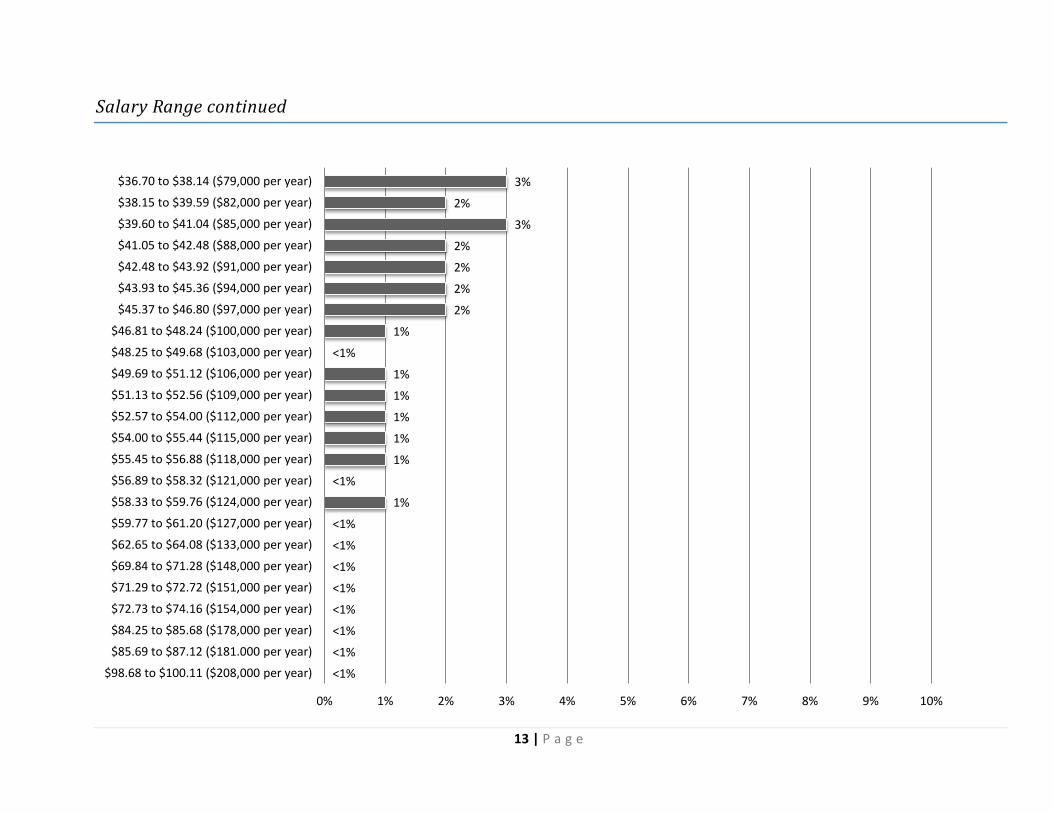
Salary Ranges for Neurodiagnostic Field
Mean Median Mode Total Range/ Trend
Average Salary Neurodiagnostic Professionals $66,757 $61,000 $61,000 $16,000 to $208,000
$40,000 to $76,000
Salary Range
4% 3%
5% 5%
6% 9%
6% 5%
8% 5%
6% 4% 4%
3% 1%
<1% <1% <1% <1% <1%
0% 1% 2% 3% 4% 5% 6% 7% 8% 9% 10%
$35.25 to $36.69 ($76,000 per year) $33.80 to $35.24 ($73,000 per year) $32.35 to $33.79 ($70,000 per year) $30.90 to $32.34 ($67,000 per year) $29.45 to $30.89 ($64,000 per year) $28.00 to $29.44 ($61,000 per year) $26.55 to $27.99 ($58,000 per year) $25.10 to $26.54 ($55,000 per year) $23.65 to $25.09 ($52,000 per year) $22.20 to $23.64 ($49,000 per year) $20.75 to $22.19 ($46,000 per year) $19.30 to $20.74 ($43,000 per year) $17.85 to $19.29 ($40,000 per year) $16.40 to $17.84 ($37,000 per year) $14.95 to $16.39 ($34,000 per year) $13.50 to $14.94 ($31,000 per year) $12.05 to $13.49 ($28,000 per year) $10.60 to $12.04 ($25,000 per year)
$9.15 to $10.59 ($22,000 per year) $7.25 to $7.69 ($16,000 per year)
Trend
[Total responses 556]
13 | P a g e
<1%
<1%
<1%
<1%
<1%
<1%
<1%
<1%
1%
<1%
1%
1%
1%
1%
1%
<1%
1%
2%
2%
2%
2%
3%
2%
3%
9%
0% 1% 2% 3% 4% 5% 6% 7% 8% 9% 10%
$98.68 to $100.11 ($208,000 per year)
$85.69 to $87.12 ($181.000 per year)
$84.25 to $85.68 ($178,000 per year)
$72.73 to $74.16 ($154,000 per year)
$71.29 to $72.72 ($151,000 per year)
$69.84 to $71.28 ($148,000 per year)
$62.65 to $64.08 ($133,000 per year)
$59.77 to $61.20 ($127,000 per year)
$58.33 to $59.76 ($124,000 per year)
$56.89 to $58.32 ($121,000 per year)
$55.45 to $56.88 ($118,000 per year)
$54.00 to $55.44 ($115,000 per year)
$52.57 to $54.00 ($112,000 per year)
$51.13 to $52.56 ($109,000 per year)
$49.69 to $51.12 ($106,000 per year)
$48.25 to $49.68 ($103,000 per year)
$46.81 to $48.24 ($100,000 per year)
$45.37 to $46.80 ($97,000 per year)
$43.93 to $45.36 ($94,000 per year)
$42.48 to $43.92 ($91,000 per year)
$41.05 to $42.48 ($88,000 per year)
$39.60 to $41.04 ($85,000 per year)
$38.15 to $39.59 ($82,000 per year)
$36.70 to $38.14 ($79,000 per year)
Salary Range continued
14 | P a g e
Management Survey respondents were neurodiagnostic technologist managers, directors, supervisors and technologists working alone or senior in their department.
The Management section of the complete Salary and Benefits report will include percentages and figures for many questions regarding the field of Neurodiagnostics; including but not limited to:
• Changes in the last two years • Changes in your staff during the last two years • Changes for your department planned in the next year • Current job opening in your department • Length of time that job openings in company/department remained unfilled in the last two years • The change in number of EEG procedures in the past two years within department
15 | P a g e
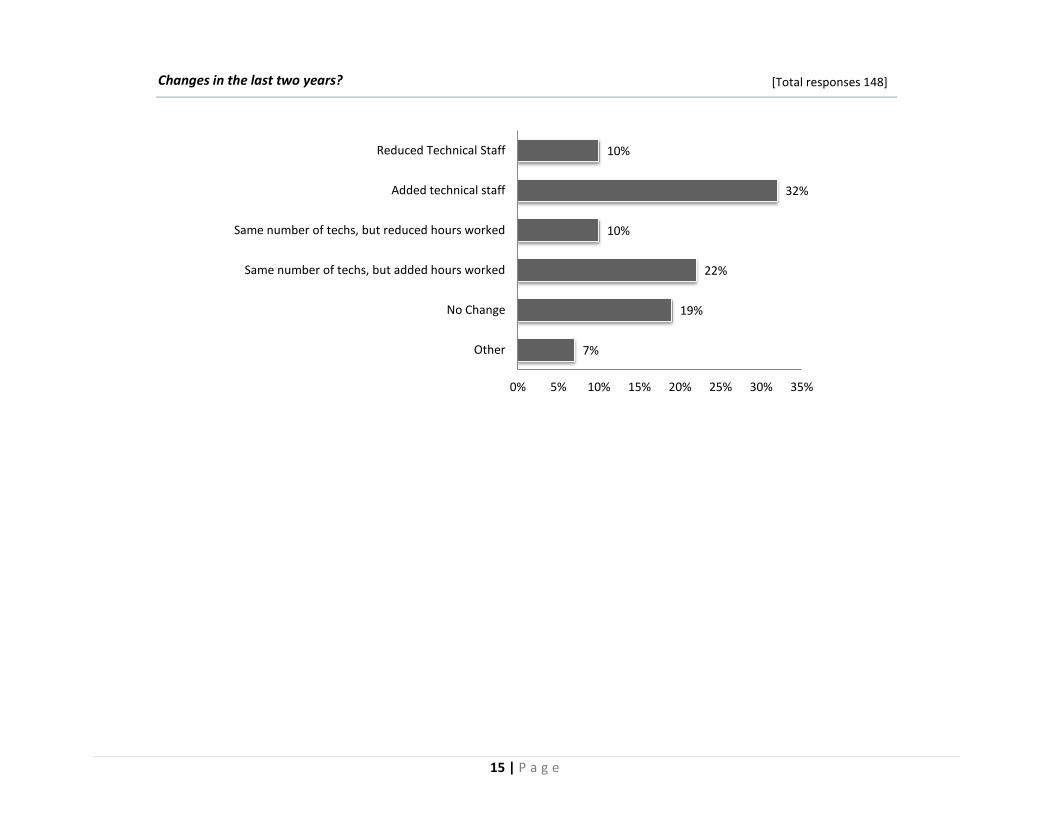
Changes in the last two years?
7%
19%
22%
10%
32%
10%
0% 5% 10% 15% 20% 25% 30% 35%
Other
No Change
Same number of techs, but added hours worked
Same number of techs, but reduced hours worked
Added technical staff
Reduced Technical Staff
[Total responses 148]

16 | P a g e
402 East Bannister Rd, Ste A, Kansas City, MO 64131 816.931.1120 www.aset.org [email protected]