Neurobiology of Disease - uniroma1.it
10
Increased excitability in tat-transgenic mice: Role of tat in HIV-related neurological disorders Silvia Zucchini a, b, ⁎ , 1 , Anna Pittaluga c, d, 1 , Egidio Brocca-Cofano e, 1 , Maria Summa c, d , Marina Fabris e , Rita De Michele e , Angela Bonaccorsi e , Graziella Busatto f , Giuseppe Barbanti-Brodano g , Giuseppe Altavilla f , Gianluca Verlengia a , Pierangelo Cifelli a, h , Alfredo Corallini g , Antonella Caputo e, 2 , Michele Simonato a, b, 2 a Department of Medical Sciences, Neuroscience Center, University of Ferrara, National Institute of Neuroscience, Italy b Laboratory of Technologies for Advanced Therapy (LTTA), Technopole of Ferrara, Italy c Department of Pharmacy, Section of Pharmacology and Toxicology, University of Genoa, Italy d Center of Excellence for Biomedical Research, University of Genoa, Italy e Department of Molecular Medicine, University of Padua, Italy f Department of Medicine, University of Padua, Italy g Department of Experimental and Diagnostic Medicine, Section of Microbiology, University of Ferrara, Italy h RiMED Foundation, Palermo, Italy abstract article info Article history: Received 31 August 2012 Revised 3 February 2013 Accepted 19 February 2013 Available online 27 February 2013 Keywords: HIV-1-tat-transgenic mice HIV-1 associated neurocognitive disorders Seizures Kainate Neurodegeneration HIV-1 associated neurocognitive disorders (HAND) are a major complication of HIV-1 infection. The mechanism(s) underlying HAND are not completely understood but, based on in vitro studies, the HIV-1 Tat protein may play an important role. In this study, the effect of prolonged exposure to endogenously produced Tat in the brain was investigated using a tat-transgenic (TT) mouse model constitutively expressing the HIV-1 tat gene. We found that stimulus-evoked glutamate exocytosis in the hippocampus and cortex was significantly increased in TT as compared with wild-type control (CC) mice, while GABA exocytosis was unchanged in the hippocampus and decreased in the cortex. This suggests that Tat generates a latent hyper-excitability state, which favors the detri- mental effects of neurotoxic and/or excitotoxic agents. To challenge this idea, TT mice were tested for susceptibility to kainate-induced seizures and neurodegeneration, and found to exhibit significantly greater responses to the convulsant agent than CC mice. These results support the concept that constitutive expression of tat in the brain generates a latent excitatory state, which may increase the negative effects of damaging insults. These events may play a key role in the development of HAND. © 2013 Elsevier Inc. All rights reserved. Introduction HIV-1 associated neurocognitive disorders (HAND), a major complica- tion of HIV-1 infection, comprise mild (minor neurocognitive disorders, MND) to severe (HIV-1 associated dementia, HAD) impairments (Lindl et al., 2010; Navia et al., 1986; Selnes, 2005; Singer et al., 2010; Tattevin et al., 2006). Seizures are often observed in HAND patients (Bartolomei et al., 1999; Modi et al., 2002). The mechanism(s) underlying HAND are not completely understood. Histologically, brain biopsy material exhibits microglial activation, neuro- nal loss, astrocytosis, vasculitis and demyelination (Everall et al., 1999; Lindl et al., 2010; Masliah et al., 1992). However, only perivascular macrophages and microglial cells are productively infected by the virus, while HIV replication is limited in astrocytes, and neurons are resistant to infection (Lindl et al., 2010). Infected cells may release viral components and/or soluble neurotoxins (e.g. chemokines, cytokines, excitatory amino acids) that alter neuronal function (Giulian et al., 1990; Kaul et al., 2005; Nath and Geiger, 1998). Among viral components, the Tat protein may be particularly impor- tant in HAND pathogenesis. First, it is highly expressed in the brain of HIV-1 infected patients (Wessenligh, 1993; Westendorp et al., 1995). Second, besides its essential role for HIV-1 gene expression, replication and cell-to-cell transmission (Ensoli et al., 1993), it is actively released by infected cells and internalized by a variety of cells (Ferrari et al., 2003; Frankel and Pabo, 1988) where it translocates to the nucleus mod- ulating the expression of transcription factors and cytokines (Mengozzi et al., 1999; Minghetti et al., 2004). Third, extracellular Tat may interact with surface receptors, including chemokine (Albini et al., 1998; Brailoiu et al., 2008; Eugenin et al., 2003), NMDA (Behnisch et al., 2004; Eugenin et al., 2007; Longordo et al., 2006; Prendergast et al., 2002) and G protein coupled receptors (Feligioni et al., 2003; Haughey Neurobiology of Disease 55 (2013) 110–119 ⁎ Corresponding author at: Department of Clinical and Experimental Medicine, Section of Pharmacology, University of Ferrara, Via Fossato di Mortara 17-19, 44121 Ferrara, Italy. Fax: + 39 0532 455205. E-mail address: [email protected] (S. Zucchini). Available online on ScienceDirect (www.sciencedirect.com). 1 S. Zucchini, A. Pittaluga and E. Brocca-Cofano equally contributed to the study. 2 M. Simonato and A. Caputo share the position of senior author. 0969-9961/$ – see front matter © 2013 Elsevier Inc. All rights reserved. http://dx.doi.org/10.1016/j.nbd.2013.02.004 Contents lists available at SciVerse ScienceDirect Neurobiology of Disease journal homepage: www.elsevier.com/locate/ynbdi
Transcript of Neurobiology of Disease - uniroma1.it

Neurobiology of Disease 55 (2013) 110–119
Contents lists available at SciVerse ScienceDirect
Neurobiology of Disease
j ourna l homepage: www.e lsev ie r .com/ locate /ynbd i
Increased excitability in tat-transgenic mice: Role of tat in HIV-relatedneurological disorders
Silvia Zucchini a,b,⁎,1, Anna Pittaluga c,d,1, Egidio Brocca-Cofano e,1, Maria Summa c,d, Marina Fabris e,Rita De Michele e, Angela Bonaccorsi e, Graziella Busatto f, Giuseppe Barbanti-Brodano g, Giuseppe Altavilla f,Gianluca Verlengia a, Pierangelo Cifelli a,h, Alfredo Corallini g, Antonella Caputo e,2, Michele Simonato a,b,2
a Department of Medical Sciences, Neuroscience Center, University of Ferrara, National Institute of Neuroscience, Italyb Laboratory of Technologies for Advanced Therapy (LTTA), Technopole of Ferrara, Italyc Department of Pharmacy, Section of Pharmacology and Toxicology, University of Genoa, Italyd Center of Excellence for Biomedical Research, University of Genoa, Italye Department of Molecular Medicine, University of Padua, Italyf Department of Medicine, University of Padua, Italyg Department of Experimental and Diagnostic Medicine, Section of Microbiology, University of Ferrara, Italyh RiMED Foundation, Palermo, Italy
⁎ Corresponding author at: Department of Clinical and ExPharmacology, University of Ferrara, Via Fossato di MortaFax: +39 0532 455205.
E-mail address: [email protected] (S. Zucchini)Available online on ScienceDirect (www.scienced
1 S. Zucchini, A. Pittaluga and E. Brocca-Cofano equall2 M. Simonato and A. Caputo share the position of se
0969-9961/$ – see front matter © 2013 Elsevier Inc. Allhttp://dx.doi.org/10.1016/j.nbd.2013.02.004
a b s t r a c t
a r t i c l e i n f oArticle history:Received 31 August 2012Revised 3 February 2013Accepted 19 February 2013Available online 27 February 2013
Keywords:HIV-1-tat-transgenic miceHIV-1 associated neurocognitive disordersSeizuresKainateNeurodegeneration
HIV-1 associatedneurocognitive disorders (HAND) are amajor complication ofHIV-1 infection. Themechanism(s)underlying HAND are not completely understood but, based on in vitro studies, the HIV-1 Tat protein may play animportant role. In this study, the effect of prolonged exposure to endogenously produced Tat in the brain wasinvestigated using a tat-transgenic (TT) mouse model constitutively expressing the HIV-1 tat gene. We foundthat stimulus-evoked glutamate exocytosis in the hippocampus and cortex was significantly increased in TT ascompared with wild-type control (CC) mice, while GABA exocytosis was unchanged in the hippocampus anddecreased in the cortex. This suggests that Tat generates a latent hyper-excitability state, which favors the detri-mental effects of neurotoxic and/or excitotoxic agents. To challenge this idea, TTmicewere tested for susceptibilityto kainate-induced seizures and neurodegeneration, and found to exhibit significantly greater responses to theconvulsant agent than CC mice. These results support the concept that constitutive expression of tat in the braingenerates a latent excitatory state, which may increase the negative effects of damaging insults. These eventsmay play a key role in the development of HAND.
© 2013 Elsevier Inc. All rights reserved.
Introduction
HIV-1 associated neurocognitive disorders (HAND), amajor complica-tion of HIV-1 infection, comprise mild (minor neurocognitive disorders,MND) to severe (HIV-1 associated dementia, HAD) impairments (Lindlet al., 2010; Navia et al., 1986; Selnes, 2005; Singer et al., 2010; Tattevinet al., 2006). Seizures are often observed in HAND patients (Bartolomeiet al., 1999; Modi et al., 2002).
The mechanism(s) underlying HAND are not completely understood.Histologically, brain biopsymaterial exhibits microglial activation, neuro-nal loss, astrocytosis, vasculitis and demyelination (Everall et al., 1999;Lindl et al., 2010; Masliah et al., 1992). However, only perivascular
perimentalMedicine, Section ofra 17-19, 44121 Ferrara, Italy.
.irect.com).y contributed to the study.nior author.
rights reserved.
macrophages and microglial cells are productively infected by the virus,while HIV replication is limited in astrocytes, and neurons are resistantto infection (Lindl et al., 2010). Infected cells may release viralcomponents and/or soluble neurotoxins (e.g. chemokines, cytokines,excitatory amino acids) that alter neuronal function (Giulian et al.,1990; Kaul et al., 2005; Nath and Geiger, 1998).
Among viral components, the Tat protein may be particularly impor-tant in HAND pathogenesis. First, it is highly expressed in the brain ofHIV-1 infected patients (Wessenligh, 1993; Westendorp et al., 1995).Second, besides its essential role for HIV-1 gene expression, replicationand cell-to-cell transmission (Ensoli et al., 1993), it is actively releasedby infected cells and internalized by a variety of cells (Ferrari et al.,2003; Frankel and Pabo, 1988)where it translocates to the nucleusmod-ulating the expression of transcription factors and cytokines (Mengozziet al., 1999; Minghetti et al., 2004). Third, extracellular Tat may interactwith surface receptors, including chemokine (Albini et al., 1998;Brailoiu et al., 2008; Eugenin et al., 2003), NMDA (Behnisch et al.,2004; Eugenin et al., 2007; Longordo et al., 2006; Prendergast et al.,2002) and G protein coupled receptors (Feligioni et al., 2003; Haughey

111S. Zucchini et al. / Neurobiology of Disease 55 (2013) 110–119
et al., 1999; Musante et al., 2010), leading to impaired transmission(Behnisch et al., 2004) and/or neurotoxic events (Kim et al., 2003; Kinget al., 2006; Nath and Geiger, 1998; Sabatier et al., 1991).
Most studies have thus far been conducted in vitro, making it diffi-cult to extrapolate the findings to the disease settings. Other studieswere conducted in a mouse model in which the expression of Tat inastrocytes was inducible and experimentally restricted to definedtime periods (Bruce-Keller et al., 2008; Kim et al., 2003). Here, wehave evaluated the effect of prolonged exposure to Tat in the intactbrain, using a tat-transgenic (TT) mouse model in which the tat geneis constitutively expressed, in a fashion similar to HIV-1 infection(Altavilla et al., 1999; Corallini et al., 1993). Phenotypic features of TTmice reminiscent of HIV-1 infection include tumors and Kaposi'ssarcoma-like skin lesions (Altavilla et al., 1999; Corallini et al., 1993).We found that stimulus-evoked glutamate exocytosis in the hippocam-pus and cortex was significantly increased in TT as compared withwild-type control (CC) mice, while GABA exocytosis was decreased inthe cortex and unchanged in the hippocampus. This suggests that Tatgenerates a latent hyper-excitability state, which favors the detrimentaleffects of neurotoxic and/or excitotoxic agents. In keeping with thisidea, TT mice were found to be more susceptible to kainate-inducedseizures and neurodegeneration than CC mice.
Materials and methods
Animals
Adult (6 to 8-month-old) male TT and CC mice were used for allexperiments [a total of 43 CC and 59 TT mice, 31 of the latter with lowskin phenotype and 28 with high skin phenotype (see below)]. Theexperimental procedures were approved by the Ethical Committees ofthe Universities of Ferrara and Genova, in accordance with the Europeanlegislation (EU Directive 2010/63/EU) and were approved by the ItalianMinistry of Health (protocol number 29823-10). Experiments wereperformed following the Guide for the Care and the Use of laboratoryanimals of the National Institutes of Health (NIH publication no. 86-23,revised 1987). Adequate measure was taken to minimize pain ordiscomfort.
TTmice of the BDF strain carrying the complete HIV-1 tat cDNAweredescribed previously (Altavilla et al., 1999; Corallini et al., 1993). CCanimalswere normal BDFmice. Two-month-old TTmicewere routinelyscreened by PCR for the presence of the transgene on DNA extractedfrom the tail (as described below). tat-Positive male and female micewere separated and observed regularly twice a week. Male mice werecontrolled for the development of Kaposi's sarcoma-like skin lesionsin the back (Altavilla et al., 1999; Corallini et al., 1993). These lesionsdevelop in about 30% of the mice, starting from the third to the fifthmonth of age. The intensity of the lesions was given a score rangingfrom 0 (no lesions) to 6. Scores correspond to: 0.5, thickening of theskin andmild alopecia; 1, intense alopeciawith skin redness; 2, alopeciaand crusts; 3, deep and large lesions with several crusts; 4, crusts andpartial exposure of dermis; 5, exposure of the muscle layer; and 6,detachment of the skin from the muscle (Altavilla et al., 1999;Corallini et al., 1993).
Genotyping and Tat expression analysis: PCR, RT-PCR and Western blot
The genotype of each animal was assessed by PCR on genomic DNAisolated from the tail of two-month old mice and from the brain at theend of the experiments. The tat transgene was amplified using theprimers 5′GAAGCATCCAGGAAGTCAGCC3′ (forward), and 5′ACCTTCTTCTTCTATTCCTTCGGG3′ (reverse), as described (Altavilla et al., 1999;Corallini et al., 1993). The control of the PCR reaction was pCV-TatDNA, a plasmid containing an insert of complete tat cDNA (Arya etal., 1985). PCR products were analyzed by electrophoresis on 1.5%agarose-gels.
Tat expression in the brain was evaluated by means of real-timeRT-PCR and Western blot analysis. To this purpose, the brains of CCand TT mice were manually divided in two parts (hemibrains) by asagittal cut. One hemibrain was used to assess tat transcript levels,and the contralateral one was used to evaluate Tat protein expression.Total RNA was extracted from 100 mg forebrain tissue using theQiagen RNeasy Plus mini kit (Qiagen, Hilden, Germany), followingthe supplier's instructions. The quantity and the quality of the RNAwere first evaluated by spectroscopy and verified by agarose gel elec-trophoresis. One μg RNA was then transcribed into cDNA using theQuantiTect Reverse Transcription kit (Qiagen).
Before retrotranscription into cDNA, the absence of contaminatingDNA was controlled: RNA samples have been incubated in gDNAWipeout buffer for 10 min at 42 °C, as indicated in the QuantiTectReverse Transcription kit (Qiagen). These RNA samples, together withthe RNAs retrotranscribed into cDNA using the same QuantiTect ReverseTranscription kit (Qiagen) have been tested in PCR quantitative analysis.For the analysis of tat gene expression, the SYBR Green real-time PCR de-tection method was employed, using the QuantiTect SYBR green PCR kit(Qiagen). Primers for HIV-tat were 5′ATGGAGCCAGTAGATCCTA3′ (for-ward) and 5′TGCTTTGATAGAGAAACTTGATG3′ (reverse) (Peng et al.,2010). The primers for the housekeeping gene Rpl13 5′GTGAGGTGCCCTACAGTGAGATAC3′ (forward) and 5′GATGGTGCGAGCCACTTTCTTG3′(reverse) were used in the same run as control for reverse transcriptionand for the normalization of tat gene expression values. After an initialstep of denaturation at 95 °C for 5 min, the qPCR run consisted of 35 -cycles at 95 °C for 10 s and 54 °C for 30 s. All samples were run in tripli-cate with the Real Time thermal analyzer Rotor-GeneTM 6000 (Corbett,Cambridge, UK). Data were normalized to the housekeeping gene Rpl13and expressed as relative RNA levels: a TT(L) sample was used as refer-ence and all data were divided by that reference value.
ForWestern blot analysis, the brain tissue from CC and TTmice (oneanimal per experiment) was homogenized in ice-cold lysis buffer(0.05 M Tris, pH 7.4, containing a protease inhibitor cocktail). Sampleswere incubated for 5 min on ice, before centrifuging at 14,000 rpm for45 min at 4 °C. Collected supernatants (20 μl/lane) and recombinantTat solution (10–100 ng/20 μl/lane) were separated onto sodiumdodecyl sulfate-polyacrylamide gel electrophoresis (10% polyacryl-amide) and then transferred onto polyvinylidene fluoride membranes.Non-specific binding sites were blocked by incubating membranes for1 h at room temperature with Tris-buffered saline (TBS buffer: 0.02 MTris, 0.150 M NaCl, protease inhibitor cocktail, pH 7.4) containing 5%(w/v) non-fat dried milk. Membranes were then incubated overnightat 4 °C with mouse anti-Tat (mouse monoclonal, ID9D5 now EVA3021; 1:500, NIBSC, Centre for AIDS Reagents) and anti-β-actin(mouse monoclonal; 1:2000, Sigma Aldrich Inc., St. Louis, MO) primaryantibodies, the latter was used as an internal control. After extensivewashings, membranes were incubated for 1 h at room temperaturewith an anti-mouse horseradish peroxidase-linked secondary antibody(1:2000, Sigma Aldrich Inc., St. Louis, MO) and immunoreactivitydetected using an enhanced chemiluminescence Western blottingdetection system (EuroClone, Milano, Italy).
Neurotransmitter release
CC and TT mice were killed by decapitation, brain cortices and hip-pocampi were rapidly removed, and purified synaptosomes were pre-pared within minutes, according to Dunkley et al. (1986), with minormodifications. In order to evaluate tat expression, the remaining braintissue was used for RNA and protein extractions, as described above.Cortical and hippocampal tissues were homogenized in 10 volumes of0.32 M sucrose, and buffered to pH 7.4 with Tris (final concentration0.01 M) using a glass Teflon tissue grinder (clearance 0.25 mm). Thehomogenate was centrifuged at 1000 ×g for 5 min to remove nucleiand debris, and the supernatantwas gently stratified on a discontinuousPercoll gradient (6%, 10%, and 20% v/v in Tris-buffered sucrose) and

112 S. Zucchini et al. / Neurobiology of Disease 55 (2013) 110–119
centrifuged at 33,500 ×g for 5 min. The layer between 10% and 20%Percoll (synaptosomal fraction)was collected andwashed by centrifuga-tion. The synaptosomal pellets were always resuspended in a physiolog-ical medium (superfusion medium) having the following composition(mM): NaCl, 125; KCl, 3; MgSO4, 1.2; CaCl2, 1.2; NaH2PO4, 1; NaHCO3,22; glucose, 10; pH 7.2–7.4, and aeration with 95% O2 and 5% CO2. Themedium contained aminooxyacetic acid (50 μM) to avoid GABA metab-olism. Synaptosomal protein contents were determined according toBradford (1976).
Identical portions of the synaptosomal suspensions were layered onmicroporousfilters at the bottomof parallel superfusion chambers (UgoBasile, Comerio, Varese, Italy) thermostated at 37 °C and superfusedat 0.5 ml/min with a standard physiological solution aerated with 95%O2 and 5% CO2. The synaptosomal protein content amounted to0.23 ± 0.074 mg protein/chamber. It should be stressed that this tech-nique is particularly appropriate to investigate presynaptic receptors. Infact, the continuous up–down superfusion of the synaptosome mono-layers prevents indirect effects due to any released compound, i.e. en-dogenous compounds are immediately removed and cannot activatetargets located on the neighboring nerve terminals (Musante et al.,2011). Thus, if any endogenous Tat was produced and released by syn-aptosomes, it would have been immediately removed and could nothave affected neurotransmitter release.
In experiments aimed at investigating the impact of exogenous Taton the spontaneous release of endogenous glutamate and GABA fromCC synaptosomes, synaptosomes were equilibrated during 36 min ofsuperfusion and then 4 consecutive 3-min fractions (termed b1–b4)were collected. The Tat protein (HIV-1 Clade B HAN2, Centre for AIDSReagents, UK) was introduced at the end of the first fraction (b1;t = 39 min) and maintained until the end of the superfusion.When studying the impact of Tat on endogenous glutamate andGABA exocytosis evoked by a mild depolarizing stimulus, CC corticaland hippocampal synaptosomes were transiently (90 s at t = 39 min)exposed to a solution containing 12 mM KCl (NaCl substituting for anequimolar concentration of KCl). Tat was added concomitantly to thedepolarizing stimulus. In these experiments, fractions were collectedaccording to the following scheme: two 3-min fractions (basal release),one before (t = 36–39 min, b1) and one after (t = 45–48 min, b3)a 6-min sample (t = 39–45 min; evoked release, b2) containingthe transmitter released by the depolarizing stimulus. When indicated,Tat was denatured by heating it at 90 °C for 30 min and then added tothe superfusionmedium. Superfusionwas always performedwith ame-dium containing dialyzed 0.1% Polypep to avoid Tat sticking to glasswalls and tubings.
Collected fractions and superfused synaptosomes were analyzed forthe endogenous neurotransmitter content. Endogenous glutamate andGABA were measured by HPLC analysis after precolumn derivatizationwith o-phthalaldehyde and separation on a C18 reverse-phase chro-matographic column (10 × 4.6 mm, 3 μm; at 30 °C; Chrompack,Middleburg, The Netherlands) coupled with fluorimetric detection (ex-citation wavelength, 350 nm; emission wavelength, 450 nm). Buffersand gradient program are described elsewhere (Luccini et al., 2007).Homoserine was used as an internal standard.
The amount of endogenous amino acid from synaptosomes ineach superfusate fraction was expressed as picomoles per milli-gram of protein (pmol/mg protein). The effects of Tat on the basalrelease of endogenous transmitters were evaluated by calculatingthe ratio between the amino acid content in the fraction wherethe maximal effect was reached (the third fraction collected) andthe amount in the first fraction and comparing this ratio with thecorresponding ratio obtained under control conditions (no drugadded). The high K+-induced overflow was estimated bysubtracting the neurotransmitter content into the first and thethird fractions collected (basal release, b1 and b3) from that inthe 6-min fraction collected during and after the depolarizationpulse (evoked release, b2).
VGLUT immunohistochemistry
CC and TT mice were killed and their brains were rapidly re-moved. One hemibrain was cut and used for RNA and protein extrac-tions, as described above. The other hemibrain was immersed in 10%formaline and then paraffine-embedded. Coronal sections (6 μmthick) were cut at the level of the dorsal hippocampus, mountedonto poly-lysine-coated slides and analyzed by immunohistochem-istry as previously described (Paradiso et al., 2009; Zucchini et al.,2008). Briefly, sections were deparaffinized (2 washes in xylol10 min, 5 min in ethanol 100%, 5 min in ethanol 95%) and thenrehydrated in distilled water for 5 min and in PBS 1× for 10 min.After incubation in H2O2 3 V for 15 min at room temperature, theywere rapidly rinsed in distilled water and washed again in PBS,then incubated with Ultra V Block (Ultra Vision Detection System;Lab Vision Corporation) for 5 min at room temperature, to blocknonspecific background staining. After washing in PBS 1× for5 min, sections were incubated overnight at 4 °C in a humid atmo-sphere with the primary antibody against VGLUT (rabbit polyclonal;1:500 dilution; Synaptic Systems). After rinsing in PBS 1×, they wereincubated with biotinylated goat anti-polyvalent serum (Ultra Vi-sion Detection System) at room temperature for 10 min, washedin PBS 1× for 5 min and then incubated in Streptavidin Peroxidase(Ultra Vision Detection System) at room temperature for 10 min. Thereaction product was detected as a brown substrate using a 3,3-diaminobenzidinetetrahydrochloride (DAB) substrate kit for peroxidase(Vector Laboratories). Finally, sections were washed three times inPBS 1× (5 min each), counterstained with hematoxylin for 2 minand washed again in PBS 1× (5 min). Coverslips were mountedusing Gel/mount (Biomeda). The specificity of immunolabelingwas verified in all experiments by controls in which the primary an-tibody was omitted (Supplementary Fig. S1). All tissues were processedidentically and side-by-side, using the same solutions and reagents.
Kainate treatment and seizure classification
Kainate (Sigma-Aldrich) was administered i.p. (15 mg/kg), and thebehavior of animals was observed for 2 h thereafter. This dose waschosen because it produces approximately half-maximal seizureresponses in CC animals. Seizures were classified as follows (Bregola etal., 2002; Janumpalli et al., 1998): 1, chewing and drooling; 2, headnodding; 3, unilateral forelimb clonus; 4, bilateral forelimb clonus; 5,bilateral forelimb and hindlimb clonuses with falling; 6, running orjumping seizure; 7, tonic hindlimb extension; 8, death. A previously de-scribed scoring system, the cumulative seizure score, was employed toestimate seizure susceptibility (Bregola et al., 2002). Seizure severitywas rated as the sumof the scores recorded in each 5-min interval duringthe 2 h following kainate injection. The latency to the first severe (class 4or higher) seizure was also recorded. The cumulative seizure score wasstatistically evaluated by using theMann–Whitney U test and the latencyto the first severe seizure was evaluated by ANOVA and post-hocNewman–Keuls tests.
Analysis of neurodegeneration
For the analysis of seizure-induced neurodegeneration, mice werekilled 24 h after kainate administration, and their brains were fixed in10% formaldehyde. First, the fixed brains were subjected to standardhistological procedures and stained with hematoxilin and eosin to accu-rately identify the regions of interest. Damaged neurons were thendetected using the Fluoro-Jade B (FJ) (Schmued and Hopkins, 2000), oncoronal sections cut at the level of the dorsal hippocampus (Paxinosand Franklin, 2001). FJ analysis was conducted using a Leica microscope(DMRA2, Leica). The degree of cell damage was quantified blinded bytwo investigators, based on two distinct approaches. The first was apreviously described scoring system named “neurodegeneration score”

113S. Zucchini et al. / Neurobiology of Disease 55 (2013) 110–119
(Zucchini et al., 2002). The score range spanned from 0 (absence ofFJ-positive neurons) to 7 (maximal neurodegeneration pattern). Ascore of 1 was given for the observation of fluorescent neurons eitherin the hilus, in the CA3 pyramidal layer, or in the CA1 pyramidal layer.Whenever a very intense neurodegeneration was observed in the CA3or CA1 pyramidal layer (many positive cells with confluent fluores-cence), the score related to that subarea was increased by 0.5. Another0.5 score was added when interneuronal fluorescence was detectablein the stratum oriens and/or radiatum. Therefore, the score related toCA3 and to CA1 could reach a maximal value of 2. Finally, when damagewas observed in extra hippocampal regions (thalamus and cortex), theneurodegeneration score was further increased by 2 points. Thus, themaximal neurodegeneration score was 7: CA1 score 2 plus CA3 2 plusdentate gyrus 1 plus extra-hippocampal regions 2. The second quantifi-cation method was based on the thresholding of FJ digital images(Paradiso et al., 2009; Zucchini et al., 2008). Images of the hippocampuswere captured using a Leica DFC300FX camera and transformed intogray levels. Using Photoshop CS5, the hippocampus was cut out andthe mean ± standard deviation gray level was calculated. FJ-positivepixels were identified by thresholding at the gray level correspondingto the mean plus three standard deviations. Using this approach, onlythose pixels that were significantly above background (that is, positiveto FJ) were selected. Data were then expressed as percent of FJ-positivepixels over total hippocampal pixels. Four regularly spaced sections(100 μm interval) were examined for each animal, and the score usedfor statistical analysis was the average of these multiple estimates.Alternatively, the mean percent of FJ-positive pixels in the 4 sectionsexaminedwas calculated for each animal and used for statistical analysis.
NeuroTrace 594 red fluorescent (NT; Molecular Probes, Inc., Eugene,OR, USA) staining has been performed in a subset of brain sectionsafter FJ staining, to identify degenerating neurons. After rehydration in0.1 M PBS, (pH 7.4), sections were treated with PBS plus 0.1% TritonX-100 10 min, washed twice for 5 min in PBS then stained by NT(1:100), for 20 min at room temperature. Sections were washed in PBSplus 0.1% Triton X-100, twice with PBS, then let stand for 2 h at roomtemperature in PBS.
Statistical analysis
For neurotransmitter release data, comparisons between experimen-tal groups were performed by using ANOVA and post hoc the Dunnett'stest. For in vivo data, ANOVA and post-hoc Newman–Keuls test wereused for the analysis of latency and the Mann–Whitney U test for theanalysis of the cumulative seizure score. Differences between groupswere considered significant when P b 0.05.
Results
Expression of Tat in TT mice brain
Male TT mice were monitored for the development of Kaposi'ssarcoma-like skin lesions in the back. Based on the severity of the lesions,mice were divided in two groups, characterized, respectively, by lowgrade skin phenotype, TT(L), with lesion scores between 0 and 2, andhigh grade skin phenotype, TT(H), with lesion scores between 3 and 6.
Expression of the tat gene in the brain of TT mice was then analyzedby real time RT-PCR analysis. No PCR amplification has been observedwith RNA samples not transcribed into DNA (data not shown). Theresults reported in Fig. 1A show that tat mRNA is expressed in thebrain of all TT mice. However, tat gene expression was higher in thebrain of TT(H) mice as compared to TT(L) mice. Accordingly, expressionof the Tat protein was detected in the brains of TT mice byWestern blotanalysis (Fig. 1B). In agreement with the results of real time RT-PCR, Tatprotein expression differed between TT(H) and TT(L) mice, because itwas clearly detectable only in mice displaying the high skin phenotype.These results confirm our previous data on tat gene expression in the
tissues of TTmice (Altavilla et al., 1999; Corallini et al., 1993) and suggestthat the skin phenotype can be used as a surrogate marker of tat geneexpression in the brain, allowing to stratify the animals in the twosubgroups for the subsequent experiments. Confirmation of the correctsubgroup allocation of each mouse was obtained by RT-PCR at the endof the experiments.
Effects of exogenous Tat administration on glutamate and GABA release
It has been previously shown that exogenous Tat, while not affectingbasal release, exerts opposite effects on glutamate and GABA overflowevoked by mild depolarization from nerve terminals isolated from thecortex of adult mice (Musante et al., 2010). These findings were con-firmed in the present study. Acute Tat failed to affect the spontaneous re-lease of both glutamate (1 nM Tat: 92.7 ± 6.8% of control, data from 3experiments run in triplicate) and GABA (1 nM Tat: 94.8 ± 6.6%, datafrom 3 experiments run in triplicate) in CC mice. Again consistent withthe previous findings (Musante et al., 2010), Tat (0.03–3 nM) facilitated12 mM KCl-induced glutamate overflow in a concentration-dependentmanner but inhibited GABA overflow from CC cortical nerve endings(Figs. 2A and B). Facilitation of glutamate as well as inhibition ofGABA overflow could not be observed when exposing synapto-somes to a heat shock denatured protein (for glutamate: control:294 ± 22 pmol/mg prot; 1 nM denatured Tat: 344 ± 52 pmol/mgprot, n.s.; for GABA: control: 294 ± 22 pmol/mg prot; 1 nM denaturedTat: 314 ± 37 pmol/mg prot, n.s; data from 3 experiments run intriplicate).
We then extended these data to hippocampal synaptosomes. In CChippocampal synaptosomes, Tat had no effect on the spontaneousrelease of endogenous glutamate (1 nM Tat: 95.8 ± 4.3% of control,data from 3 experiments run in triplicate) and GABA (1 nM Tat:111.3 ± 6.7% of control, data from 3 experiments run in triplicate).However, Tat (0.03–3 nM) concentration dependently facilitated the12 mM K+-evoked glutamate overflow (Fig. 2C), while failing tomodify that of GABA (Fig. 2D), at variance with the inhibition ob-served in the cortex. Again, Tat-induced changes in high K+-evokedglutamate overflow were prevented by protein heat shock denatur-ation (control: 189 ± 18 pmol/mg prot; 1 nM denatured Tat:225 ± 31 pmol/mg prot; n.s., data from three experiments run intriplicate).
Glutamate and GABA release from nerve terminals isolated from TT mice
The spontaneous and the depolarization-evoked release of endoge-nous glutamate and GABA was then investigated in cortical and hippo-campal glutamatergic and GABAerigic nerve terminals isolated from CC,TT(L) and TT(H) mice. In both brain areas, the basal, spontaneousrelease of glutamate and GABA from TTmice did not significantly differfrom that fromCCmice (Fig. 3). However, the 12 mMK+-evoked gluta-mate overflow from cortical synaptosomes isolated from TT(L) wassignificantly increased compared with that from CC mice, and thatfrom TT(H) was further and significantly increased compared withTT(L) mice (Fig. 3A), indicating that this effect correlates with thelevel of Tat expression in the brain. Similarly, the endogenous glutamaterelease induced by high K+ from hippocampal terminals was increasedin TT mice, and in TT(H) significantly more than in TT(L) (Fig. 3C). Incontrast, the high K+-evoked release of GABA from TT cortical synapto-somes was significantly reduced when compared with CC mice, themaximum inhibition being observed in TT(H) mice (Fig. 3B), and thatfrom hippocampal synaptosomes was not modified (Fig. 3D). Becauseof the features of the experimental approach we employed (the up–down superfusion of synaptosomal monolayers) indirect effects dueto residual endogenous Tat released by the nerve terminals could notaccount for changes in neurotransmitter release. In fact, the techniqueof superfusion ensures the immediate removal of released endogenous

Fig. 1. Analysis of tat gene expression in the brain of TT mice. (A) tat mRNA levels in the brains of TT(L) and TT(H) mice, as measured by real time RT-PCR. Controls were wild-typeBDF mice (CC). Results were normalized to the housekeeping gene Rpl13 and are expressed as relative RNA levels: a TT(L) sample was used as reference and all data were dividedby that reference value. Data are the means of at least three independent determinations. (B) Tat protein expression in the brain, as estimated using Western blot analysis. Equalamounts of brain lysates from CC and TT mice (one CC and one TT mouse per experiment) were electrophoresed, transferred to membranes and probed with antiserum directagainst the Tat protein. The level of Tat protein was compared to the internal standard β-actin, and specificity was verified using lanes with recombinant Tat. The blot is represen-tative of the five blots of homogenates separately obtained from 5 CC and 5 TT mice, run in different days.
114 S. Zucchini et al. / Neurobiology of Disease 55 (2013) 110–119
compounds, preventing indirect effects on the neighboring synapto-somes (Musante et al., 2011; Raiteri and Raiteri, 2000).
VGLUT expression
The observation that endogenous expression of Tat leads to the po-tentiation of glutamate release in a preparation inwhich nerve terminalsare isolated (thus, not directly exposed to Tat at the time of the experi-ment) is puzzling. Possible interpretations of this finding may be thatTat can induce long-term increases in the amount of releasable
Fig. 2. Effects of Tat on 12 mM K+-evoked release of glutamate (A, C) and GABA (B, D) fKCl-evoked release in the absence of Tat. Gray bars: 12 mM KCl-evoked release in the preand correspond to the 12 mM K+-induced overflow. Data are means ± SEM of 3–7 experi*P b 0.05 vs. control; **P b 0.01 vs. control; ANOVA and post hoc Dunnett's test.
glutamate, either by increasing the number of glutamatergic terminalsor the density of glutamatergic vesicles within each terminal. The formerhypothesis seems less likely because the basal (Ca2+-independent,non-vesicular) release of glutamate should increase if the number ofglutamatergic terminals increases (Muzzolini et al., 1997), and this wasnot the case in TT synaptosomes. To further investigate this idea, immu-nohistochemistry was used to assay expression of the glutamatergicvesicular transporter VGLUT1, a marker of glutamate release vesicles(Fadda et al., 2007). VGLUT1 immunoreactivity is normally abundant inmany cortical and hippocampal areas, most prominently in the deeper
rom mouse cortical (A, B) and hippocampal (C, D) synaptosomes. Open bar: 12 mMsence of Tat (concentrations as indicated). Results are expressed as pmol/mg proteinments run in triplicate (three superfusion chambers for each experimental condition).
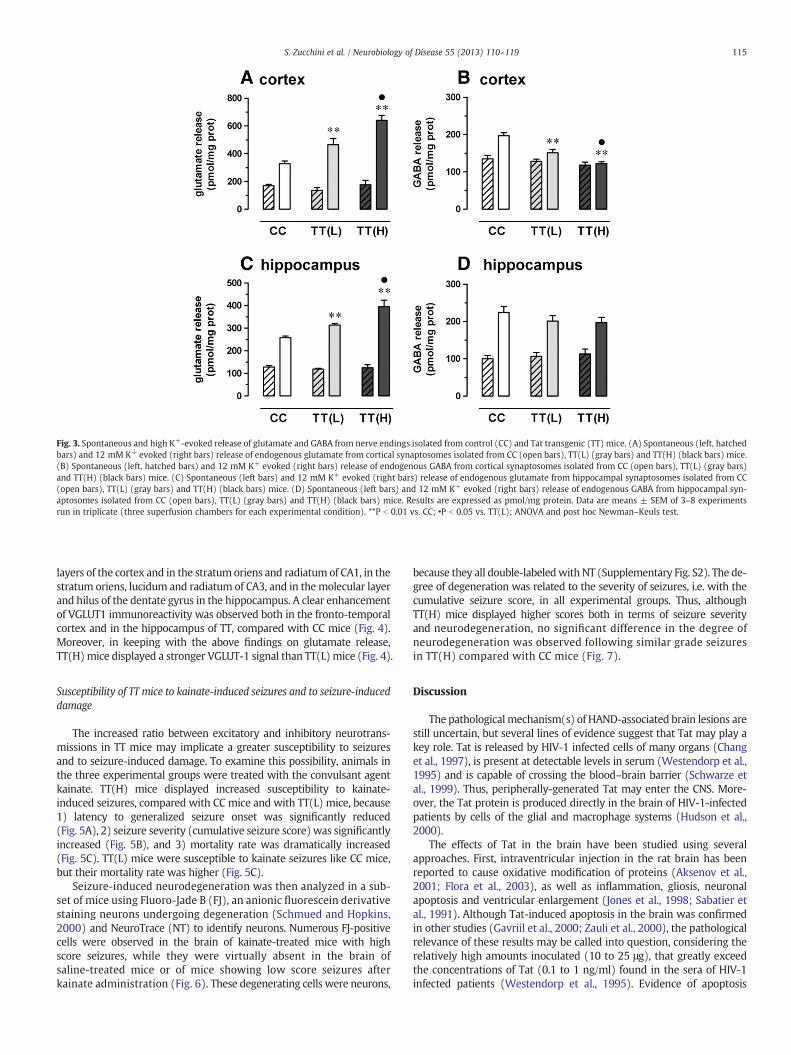
Fig. 3. Spontaneous and high K+-evoked release of glutamate and GABA from nerve endings isolated from control (CC) and Tat transgenic (TT) mice. (A) Spontaneous (left, hatchedbars) and 12 mM K+ evoked (right bars) release of endogenous glutamate from cortical synaptosomes isolated from CC (open bars), TT(L) (gray bars) and TT(H) (black bars) mice.(B) Spontaneous (left, hatched bars) and 12 mM K+ evoked (right bars) release of endogenous GABA from cortical synaptosomes isolated from CC (open bars), TT(L) (gray bars)and TT(H) (black bars) mice. (C) Spontaneous (left bars) and 12 mM K+ evoked (right bars) release of endogenous glutamate from hippocampal synaptosomes isolated from CC(open bars), TT(L) (gray bars) and TT(H) (black bars) mice. (D) Spontaneous (left bars) and 12 mM K+ evoked (right bars) release of endogenous GABA from hippocampal syn-aptosomes isolated from CC (open bars), TT(L) (gray bars) and TT(H) (black bars) mice. Results are expressed as pmol/mg protein. Data are means ± SEM of 3–8 experimentsrun in triplicate (three superfusion chambers for each experimental condition). **P b 0.01 vs. CC; •P b 0.05 vs. TT(L); ANOVA and post hoc Newman–Keuls test.
115S. Zucchini et al. / Neurobiology of Disease 55 (2013) 110–119
layers of the cortex and in the stratum oriens and radiatum of CA1, in thestratum oriens, lucidum and radiatum of CA3, and in themolecular layerand hilus of the dentate gyrus in the hippocampus. A clear enhancementof VGLUT1 immunoreactivity was observed both in the fronto-temporalcortex and in the hippocampus of TT, compared with CC mice (Fig. 4).Moreover, in keeping with the above findings on glutamate release,TT(H)mice displayed a stronger VGLUT-1 signal than TT(L)mice (Fig. 4).
Susceptibility of TT mice to kainate-induced seizures and to seizure-induceddamage
The increased ratio between excitatory and inhibitory neurotrans-missions in TT mice may implicate a greater susceptibility to seizuresand to seizure-induced damage. To examine this possibility, animals inthe three experimental groups were treated with the convulsant agentkainate. TT(H) mice displayed increased susceptibility to kainate-induced seizures, compared with CC mice and with TT(L) mice, because1) latency to generalized seizure onset was significantly reduced(Fig. 5A), 2) seizure severity (cumulative seizure score) was significantlyincreased (Fig. 5B), and 3) mortality rate was dramatically increased(Fig. 5C). TT(L) mice were susceptible to kainate seizures like CC mice,but their mortality rate was higher (Fig. 5C).
Seizure-induced neurodegeneration was then analyzed in a sub-set of mice using Fluoro-Jade B (FJ), an anionic fluorescein derivativestaining neurons undergoing degeneration (Schmued and Hopkins,2000) and NeuroTrace (NT) to identify neurons. Numerous FJ-positivecells were observed in the brain of kainate-treated mice with highscore seizures, while they were virtually absent in the brain ofsaline-treated mice or of mice showing low score seizures afterkainate administration (Fig. 6). These degenerating cells were neurons,
because they all double-labeledwithNT (Supplementary Fig. S2). The de-gree of degeneration was related to the severity of seizures, i.e. with thecumulative seizure score, in all experimental groups. Thus, althoughTT(H) mice displayed higher scores both in terms of seizure severityand neurodegeneration, no significant difference in the degree ofneurodegeneration was observed following similar grade seizuresin TT(H) compared with CC mice (Fig. 7).
Discussion
The pathologicalmechanism(s) of HAND-associated brain lesions arestill uncertain, but several lines of evidence suggest that Tat may play akey role. Tat is released by HIV-1 infected cells of many organs (Changet al., 1997), is present at detectable levels in serum (Westendorp et al.,1995) and is capable of crossing the blood–brain barrier (Schwarze etal., 1999). Thus, peripherally-generated Tat may enter the CNS. More-over, the Tat protein is produced directly in the brain of HIV-1-infectedpatients by cells of the glial and macrophage systems (Hudson et al.,2000).
The effects of Tat in the brain have been studied using severalapproaches. First, intraventricular injection in the rat brain has beenreported to cause oxidative modification of proteins (Aksenov et al.,2001; Flora et al., 2003), as well as inflammation, gliosis, neuronalapoptosis and ventricular enlargement (Jones et al., 1998; Sabatier etal., 1991). Although Tat-induced apoptosis in the brain was confirmedin other studies (Gavriil et al., 2000; Zauli et al., 2000), the pathologicalrelevance of these results may be called into question, considering therelatively high amounts inoculated (10 to 25 μg), that greatly exceedthe concentrations of Tat (0.1 to 1 ng/ml) found in the sera of HIV-1infected patients (Westendorp et al., 1995). Evidence of apoptosis

Fig. 4. VGLUT1-like immunoreactivity (LI) in the dorsal hippocampus (A–C) and cortex (D–F) of CC (A, D), TT(L) (B, E) and TT(H) (C, F) mice. Shown are representative coronalbrain sections at the level of the dorsal hippocampus, exhibiting DAB-labeled VGLUT1-LI. Omitting the primary antibody to estimate nonspecific signal yielded completely negativelabeling (data not shown). Note a widespread increase in VGLUT1-LI in TT, and especially in TT(H), mice.
116 S. Zucchini et al. / Neurobiology of Disease 55 (2013) 110–119
after inoculation in the striatum of the amounts of Tat (10 ng) that bet-ter approximate its levels in pathology has beenmore recently reported(Agrawal et al., 2007, 2012).
A second approach has been testing the effects of bath-applied Tat onneural cells. It has been found that Tat activates calcium release fromIP3-sensitive intracellular stores (Haughey et al., 1999), and induces cal-cium influx in neural cells (Cheng et al., 1998) increasing cell death. Fur-thermore, Tat enhances glutamate-mediated excitotoxicity in neuronsthrough the activation of NMDA receptors (Haughey et al., 2001; Li etal., 2008; Prendergast et al., 2002). Importantly, these latter effects weredemonstrated at subtoxic concentrations, i.e. at concentrations close tothose found clinically in serum. One intriguing implication of these obser-vations is that, at clinically relevant concentrations, Tat per se may notproduce neuronal damage, but increase the effects of neurotoxic agentsthat stimulate the release of glutamate, ultimately leading to the excessiveactivation of NMDA receptors.
Thus, these findings should be integrated with the analysis of possi-ble effects at a presynaptic level. Again, initial studies have beenconducted using acute, “pharmacological” administration, and provedthat Tat can deeply influence central neurotransmission (Brailoiu etal., 2008; Eugenin et al., 2003; Feligioni et al., 2003; Ferris et al., 2009;Longordo et al., 2006; Musante et al., 2010; Zhu et al., 2009). Thesefindings have been extended in the present study. We found that the
Fig. 5. Latency to generalized seizure onset (A), seizure severity, expressed as cumulative sein CC, TT(L) and TT(H)mice. The latency to the first severe (class 4 or higher) seizure is reported.the 2 h following kainate injection. Types of seizures have been classified as described in MateriaNewman–Keuls tests were used for the statistical analysis of latency and the Mann–Whitney U
effect of exogenous Tat is neurotransmitter- and area-specific. Tat didnot affect the release of glutamate and GABA under basal condition,i.e. in the absence of depolarizing stimuli (Feligioni et al., 2003;Musante et al., 2010), but increased stimulus-evoked glutamate exocy-tosis in the hippocampus and cortex in TTmice, while GABA exocytosiswas unchanged in the hippocampus and even decreased in the cortex.
As stated above for other kinds of studies, however, these findings arebased on the acute administration of relatively high concentrations ofTat, andmay not reflect the situation of chronic exposure to low concen-trations as during HIV infection. In this sense, the TTmodel may bemorepredictive of the actual situation in human HAND patients. Consistentwith the observation that acutely applied Tat does not affect the basal,unstimulated release of glutamate and GABA, its constitutive expressionin TT mice also failed to affect the spontaneous release of both neuro-transmitters. However, high K+-evoked glutamate overflowwas signifi-cantly increased in the cortex and hippocampus of TT, as compared withcontrol mice, while GABA overflow was reduced in the cortex and notaltered in the hippocampus. These findings are perfectly coherent withthose with acute Tat. Importantly, the intensity of all significant alter-ations in the release of glutamate and GABA correlated with tat geneexpression levels and with the skin phenotype, suggesting that a directrelationship exists between the amount of Tat in the brain and functionalalterations.
izure score (B) and mortality rate (C) after systemic administration of kainate (15 mg/kg)Cumulative scorewas rated as the sum of the scores recorded in each 5-min interval duringls andmethods. Data are themean ± SEM of 19mice per group. The ANOVA and post-hoctest for the analysis of the cumulative score. *P b 0.05.

Fig. 6. Anatomical distribution of kainate-induced neurodegeneration. The dorsal hippocampal FJ-stained sections prepared from saline-treated (A, B) and from kainate-treated(C, D) CC (A, C) and TT(H) (B, D) mice are shown. After saline treatment, FJ-positive neurons were not observed in CC (A) and TT(H) (B) hippocampi. After kainate treatment, thedegree of neurodegeneration correlated with the severity of seizures in both groups, although a tendency to greater neurodegeneration was observed in TT mice. (C) Represen-tative FJ staining in a CC mouse killed 24 h after kainate administration. This animal experienced seizures with a cumulative score of 93 (a relatively high seizure score for CCmice). Note the FJ-positive neurons in CA3 and CA1 pyramidal layers (neurodegeneration score: 5). (D) Representative FJ staining in a TT(H) mouse killed 24 h after kainateadministration. This animal experienced seizures with a cumulative score of 63 (an average seizure score for TT mice). Note the numerous FJ-positive cells in CA3 and CA1pyramidal layers (neurodegeneration score: 5).
117S. Zucchini et al. / Neurobiology of Disease 55 (2013) 110–119
It cannot be predicted if the Tat-induced changes in neurotransmit-ter exocytosis depend on the Tat interactionwith cell membrane recep-tors or it implies its cellular translocation to the nucleus andmodulationof gene expression. The first hypothesis is attractive because Tat isknown to act as a promiscuous agonist at different receptors(mGluR1, NMDA, CCR2) most of which are differently located onglutamatergic and GABAergic nerve terminals (Brailoiu et al., 2008;
Fig. 7. Relationship between the severity of seizures (cumulative seizure score) andneurodegeneration (neurodegeneration score—similar results were obtained calculat-ing the percentage of FJ-positive pixels). The linear regressions for control (CC, opencircles, dashed line) and transgenic (TT(H), solid circles, solid line) mice are shown.Note that some TT(H) mice could not be included in the analysis because they diedduring the period of observation post-kainate injection.
Musante et al., 2010). In line with this hypothesis, chronic drug treat-ments influencing presynaptic receptor-mediated functions have beenreported to cause neuronal adaptations that may be retained ex vivo,in isolated nerve terminals, where they emerge as changes in neuro-transmitter exocytosis (Pittaluga et al., 2007). Changes in the exocytoticmachinery in terms of the number of release vesicles or in terms of theefficiency of vesicular storagemight account for these adaptive changes.This hypothesis is supported by our observation, consistent with the re-lease data, that a marker of glutamate synaptic vesicles, GLUT1, is in-creased in the hippocampus and cortex of TT mice, in a Tatexpression-dependent manner. This increased density of glutamatesynaptic vesicles is likely to account for the observed increase indepolarization-evoked release.
Interestingly, the data obtained with low concentration Tat (includ-ing those reported here in TT mice) support the notion that its effectsare stimulation-dependent: in the nervous tissue exposed to Tat, gluta-mate release is not altered under resting conditionswhereas,when stim-ulation occurs, more glutamate than the normal is released (presentdata), allowing the activation of NMDA receptors that are phosphorylat-ed (Haughey et al., 2001) and will elicit currents much greater than thenormal, to a potentially dangerous level. Thus, the increased bioavailabil-ity of extracellular glutamate may represent a mechanism throughwhich Tat exerts detrimental effects on neurons (Nath and Geiger,1998). It should also be kept in mind that neurons do not represent theunique source of anomalous glutamate outflow, because Tat has beenreported to increase glutamate spillover from astrocytes (Eugenin etal., 2003) and microglial cells (Gupta et al., 2010). Whether these eventscould be affected in TT mice remains to be established.

118 S. Zucchini et al. / Neurobiology of Disease 55 (2013) 110–119
The reduced stimulus-evoked GABA release at the cortical levelalso deserves some comments. It is well known that glutamate andGABA reciprocally modulate their release. In particular, GABA exertsa negative feedback on glutamate by activating presynaptic inhibito-ry GABAB heteroreceptors (Bonanno and Raiteri, 1993). The de-creased stimulus-evoked GABA release in the TT cortex willattenuate this presynaptic mechanism of heteroregulation, furtherfacilitating glutamate release and increasing the susceptibility toexcitotoxicity. Based on our results, the cortex should be particularlyexposed to neurotoxic events.
Taken together, these data strongly suggest that the balance be-tween excitatory (glutamate) and inhibitory (GABA) neurotransmis-sions is highly unstable in the Tat-exposed brain, with a strong risk tolean pathologically towards hyper-excitation. This situation isexpected to favor seizure susceptibility and seizure-related damage.In fact, seizures are often observed in HIV-1 infected patients (Doreet al., 1996) also in the absence of opportunistic infections(Bartolomei et al., 1999; Modi et al., 2002). Accordingly, Tat wasreported to be epileptogenic when administered i.c.v. (Sabatier etal., 1991). Analysis of the susceptibility to kainate-induced seizuresand neurodegeneration in the TT model seems particularly well suit-ed to challenge this hypothesis, in that: 1) Tat concentration in thebrain is very likely low and subtoxic, since we did not detect anyovert neurological symptom or neuronal cell damage in TT miceunder normal conditions, i.e. in the absence of excitatory stimuli;2) the neurotoxic effect of kainate is largely dependent on the activa-tion of NMDA receptors, being prevented by NMDA receptor antago-nists (Virgili et al., 1992; Zucchini et al., 2002).
In linewith expectation, we found that TTmice are highly susceptibleto the effect of kainate and are predisposed to develop convulsiveseizures leading to cell damage. The intensity of the seizures and of theneurodegeneration correlated with the levels of Tat in the brain andwith the severity of the skin lesions, suggesting that both the brainsyndrome and the skin phenotype are due to the expression of Tat inthe different organs of TT mice. These observations are consistent withthe concept that Tat facilitates excitotoxicity in vivo. Most likely, Tatalone cannot account for all aspects of HAND, but these results supportits role as a key pathogenetic cofactor. As such, Tat may represent amolecular target for the prevention of HAND development in AIDSpatients.
Supplementary data to this article can be found online at http://dx.doi.org/10.1016/j.nbd.2013.02.004.
Acknowledgments
This work was supported by grants to AC from the National AIDSProject (Ministero della Sanità, Rome, Italy); grants to MS from theMIUR (Ministry for Instruction, University and Research) and fromlocal funds of the University of Ferrara; and grants to AP from the MIUR(project no. 2009P7WHNR_003) and from local funds of the Universityof Genova (Progetto Ricerca Ateneo). PC work was supported by theRiMED Foundation.
We are grateful to A. Peverati, A. Bevilacqua, P. Zucchini, I. Pivanti andE. Magri for the excellent technical assistance and to A. Camerino for theanimal care. We thank the FIT Biotech Oyj Plc, Tampere, Finland, theCentre for AIDS Reagents, the EU Programme EVA/MRC (contractQLKZ-CT-1999-00609), and the UK Medical Research Council for kindlyproviding us with the HIV-1 viral protein Tat and with a monoclonalAnti-Tat antibody.
References
Agrawal, L., et al., 2007. Preventing HIV-1 Tat-induced neuronal apoptosis using antioxi-dant enzymes: mechanistic and therapeutic implications. Virology 363, 462–472.
Agrawal, L., et al., 2012. HIV-1 Tat neurotoxicity: a model of acute and chronic expo-sure, and neuroprotection by gene delivery of antioxidant enzymes. Neurobiol.Dis. 45, 657–670.
Aksenov, M.Y., et al., 2001. Oxidative damage induced by the injection of HIV-1 Tat proteinin the rat striatum. Neurosci. Lett. 305 (1), 5–8.
Albini, A., et al., 1998. HIV-1 Tat protein mimicry of chemokines. Proc. Natl. Acad. Sci.U. S. A. 95, 13153–13158.
Altavilla, G., et al., 1999. Morphological, histochemical, immunohistochemical, and ultra-structural characterization of tumors, dysplastic and non-neoplastic lesions arising inBK virus/tat transgenic mice. Am. J. Pathol. 154, 1231–1244.
Arya, S.K., et al., 1985. Trans-activator gene of human T-lymphotropic virus type III(HTLV-III). Science 229, 69–73.
Bartolomei, F., et al., 1999. Isolated, chronic, epilepsia partialis continua in an HIV-infectedpatient. Arch. Neurol. 56, 111–114.
Behnisch, T., et al., 2004. HIV secreted protein Tat prevents long-term potentiation inthe hippocampal CA1 region. Brain Res. 1012, 187–189.
Bonanno, G., Raiteri, M., 1993. Functional evidence for multiple GABAB receptor subtypesin the rat cerebral cortex. J. Pharmacol. Exp. Ther. 262, 114–118.
Bradford, M.M., 1976. A rapid and sensitive method for the quantitation of microgramquantities of protein utilizing the principle of protein–dye binding. Anal. Biochem.72, 248–254.
Brailoiu, G.C., et al., 2008. Excitatory effects of human immunodeficiency virus 1 Tat oncultured rat cerebral cortical neurons. Neuroscience 151, 701–710.
Bregola, G., et al., 2002. Involvement of the neuropeptide nociceptin/orphanin FQ inkainate seizures. J. Neurosci. 22, 10030–10038.
Bruce-Keller, A.J., et al., 2008. Morphine causes rapid increases in glial activation and neu-ronal injury in the striatum of inducible HIV-1 Tat transgenicmice. Glia 56, 1414–1427.
Chang, H.C., et al., 1997. HIV-1 Tat protein exits from cells via a leaderless secretorypathway and binds to extracellular matrix-associated heparan sulfate proteogly-cans through its basic region. AIDS 12, 1421–1431.
Cheng, J., et al., 1998. Neuronal excitatory properties of human immunodeficiency virustype 1 Tat protein. Neuroscience 82, 97–106.
Corallini, A., et al., 1993. Systemic expression of HIV-1 tat gene in transgenic mice inducesendothelial proliferation and tumors of different histotypes. Cancer Res. 53, 5569–5575.
Dore, G.J., et al., 1996. Prospective analysis of seizure occurring in human immunode-ficiency virus type-1 infection. J. NeuroAIDS 1, 59–69.
Dunkley, P.R., et al., 1986. A rapid method for isolation of synaptosomes on Percollgradient. Brain Res. 372, 115–129.
Ensoli, B., et al., 1993. Release, uptake, and effects of extracellular human immunodeficiencyvirus type 1 Tat protein on cell growth and viral transactivation. J. Virol. 67, 277–287.
Eugenin, E.A., et al., 2003. MCP-1 (CCL2) protects human neurons and astrocytes fromNMDA or HIV-tat-induced apoptosis. J. Neurochem. 85, 1299–1311.
Eugenin, E.A., et al., 2007. HIV-tat induces formation of an LRP–PSD-95–NMDAR–nNOScomplex that promotes apoptosis in neurons and astrocytes. Proc. Natl. Acad. Sci.U. S. A. 104, 3434–3438.
Everall, I.P., et al., 1999. Cortical synaptic density is reduced in mild to moderate humanimmunodeficiency virus neurocognitive disorder. Brain Pathol. 9, 209–217.
Fadda, P., et al., 2007. Reduction of corticostriatal glutamatergic fibers in basic fibro-blast growth factor deficient mice is associated with hyperactivity and enhanceddopaminergic transmission. Biol. Psychiatry 62, 235–242.
Feligioni, M., et al., 2003. The human immunodeficiency virus-1 protein Tat and its discretefragments evoke selective release of acetylcholine from human and rat cerebrocorticalterminals through species-specific mechanisms. J. Neurosci. 23, 6810–6818.
Ferrari, A., et al., 2003. Caveolae-mediated internalization of extracellular HIV-1 tat fu-sion proteins visualized in real time. Mol. Ther. 8, 284–294.
Ferris,M.J., et al., 2009. The human immunodeficiency virus-1-associated protein, Tat1-86,impairs dopamine transporters and interacts with cocaine to reduce nerve terminalfunction: a no-net-flux microdialysis study. Neuroscience 159, 1292–1299.
Flora, G., et al., 2003. Methamphetamine potentiates HIV-1 Tat protein-mediated activationof redox-sensitive pathways in discrete regions of the brain. Exp. Neurol. 179 (1), 60–70.
Frankel, A.D., Pabo, C.O., 1988. Cellular uptake of the Tat protein from human immuno-deficiency virus. Cell 55, 1189–1193.
Gavriil, E.S., et al., 2000. Tat mediates apoptosis in vivo in the rat central nervoussystem. Biochem. Biophys. Res. Commun. 267 (1), 252–256.
Giulian, D., et al., 1990. Secretion of neurotoxins by mononuclear phagocytes infectedwith HIV-1. Science 250, 1593–1596.
Gupta, S., et al., 2010. HIV-Tat elicits microglial glutamate release: role of NAPDH oxidaseand the cystine-glutamate antiporter. Neurosci. Lett. 485, 233–236.
Haughey, N.J., et al., 1999. Involvement of inositol 1,4,5-trisphosphate-regulated storesof intracellular calcium in calcium dysregulation and neuron cell death caused byHIV-1 protein Tat. J. Neurochem. 73, 1363–1374.
Haughey, N.J., et al., 2001. HIV-1 Tat through phosphorylation of NMDA receptors po-tentiates glutamate excitotoxicity. J. Neurochem. 78, 457–467.
Hudson, L., et al., 2000. Detection of human immunodeficiency virus regulatory proteinTat in CNS tissues. J. Neurovirol. 6, 145–155.
Janumpalli, S., et al., 1998. A point mutation (D79N) of the alpha2A adrenergic receptorabolishes the antiepileptogenic action of endogenous norepinephrine. J. Neurosci. 18,2004–2008.
Jones, M., et al., 1998. Intraventricular injection of human immunodeficiency virus type 1(HIV-1) tat protein causes inflammation, gliosis, apoptosis, and ventricular enlarge-ment. J. Neuropathol. Exp. Neurol. 57 (6), 563–570.
Kaul, M., et al., 2005. HIV-1 infection and AIDS: consequences for the central nervoussystem. Cell Death Differ. 12, 878–892.
Kim, B.O., et al., 2003. Neuropathologies in transgenic mice expressing human immuno-deficiency virus type 1 Tat protein under the regulation of the astrocyte-specific glialfibrillary acidic protein promoter and doxycycline. Am. J. Pathol. 162, 1693–1707.
King, J.E., et al., 2006. HIV Tat and neurotoxicity. Microbes Infect. 8, 1347–1357.Li, W., et al., 2008. NMDA receptor activation by HIV-Tat protein is clade dependent.
J. Neurosci. 28, 12190–12198.

119S. Zucchini et al. / Neurobiology of Disease 55 (2013) 110–119
Lindl, K.A., et al., 2010. HIV-1 associated neurocognitive disorder: pathogenesis andtherapeutic opportunities. J. Neuroimmune Pharmacol. 5, 294–309.
Longordo, F., et al., 2006. The human immunodeficiency virus-1 protein Tat upregulatesNMDA receptor function by acting at mGluR1 receptors coexisting on human and ratbrain noradrenergic neurons. J. Pharmacol. Exp. Ther. 317, 1097–1105.
Luccini, E., et al., 2007. N-methyl-D-aspartate autoreceptors respond to low and highagonist concentrations by facilitating, respectively, exocytosis and carrier-mediated release of glutamate in rat hippocampus. J. Neurosci. Res. 85, 3657–3665.
Masliah, E., et al., 1992. Spectrum of human immunodeficiency virus-associated neo-cortical damage. Ann. Neurol. 32, 321–329.
Mengozzi, M., et al., 1999. Human immunodeficiency virus replication induces mono-cyte chemotactic protein-1 in human macrophages and U937 promonocytic cells.Blood 93, 1851–1857.
Minghetti, L., et al., 2004. Multiple actions of the human immunodeficiency virus type-1 Tat protein on microglial cell functions. Neurochem. Res. 29, 965–978.
Modi, G., et al., 2002. New onset seizures in HIV-infected patients without intracranial masslesions or meningitis—a clinical, radiological and SPECT scan study. J. Neurol. Sci. 202,29–34.
Musante, V., et al., 2010. The HIV-1 viral protein Tat increases glutamate and decreasesGABA exocytosis from human and mouse neocortical nerve endings. Cereb. Cortex20, 1974–1984.
Musante, V., et al., 2011. Presynaptic glycine GlyT1 transporter–NMDA receptorinteraction: relevance to NMDA autoreceptor activation in the presence of Mg2+
ions. J. Neurochem. 117, 516–527.Muzzolini, A., et al., 1997. Characterization of glutamate and [3H]D-aspartate outflow from
various in vitro preparations of the rat hippocampus. Neurochem. Int. 31, 113–124.Nath, A., Geiger, J.D., 1998. Neurobiological aspects of HIV infections: neurotoxic mech-
anisms. Prog. Neurobiol. 54, 19–33.Navia, B.A., Jordan, B.D., Price, R.W., 1986. The AIDS dementia complex: I. Clinical fea-
tures. Ann. Neurol. 19, 517–524.Paradiso, B., et al., 2009. Localized delivery of fibroblast growth factor-2 and brain-
derived neurotrophic factor reduces spontaneous seizures in an epilepsy model.Proc. Natl. Acad. Sci. U. S. A. 106, 7191–7196.
Paxinos, G., Franklin, K.B.J., 2001. The Mouse Brain in Stereotaxic Coordinates, Secondedition. Academic Press, New York.
Peng, J., et al., 2010. The HIV-1 transgenic rat as a model for HIV-1 infected individualson HAART. J. Neuroimmunol. 218 (1–2), 94–101.
Pittaluga, A., et al., 2007. Antidepressant treatments and function of glutamateionotropic receptors mediating amine release in hippocampus. Neuropharma-cology 53, 27–36.
Prendergast, M.A., et al., 2002. Neurotoxic effects of the human immunodeficiency virustype-1 transcription factor Tat require function of a polyamine sensitive-site on theN-methyl-D-aspartate receptor. Brain Res. 954, 300–307.
Raiteri, L., Raiteri, M., 2000. Synaptosomes still viable after 25 years of superfusion.Neurochem. Res. 25, 1265–1274.
Sabatier, J.M., et al., 1991. Evidence for neurotoxic activity of tat from human immuno-deficiency virus type 1. J. Virol. 65, 961–967.
Schmued, L.C., Hopkins, K.J., 2000. Fluoro-Jade B: a high affinity fluorescent marker forthe localization of neuronal degeneration. Brain Res. 874, 123–130.
Schwarze, S.R., et al., 1999. In vivo protein transduction: delivery of a biologically activeprotein into the mouse. Science 285 (5433), 1569–1572.
Selnes, O.A., 2005. Memory loss in persons with HIV/AIDS: assessment and strategiesfor coping. AIDS Read. 15, 289–292.
Singer, E.J., et al., 2010. Neurological presentation of AIDS. Neurol. Clin. 28, 253–275.Tattevin, P., et al., 2006. Confusion, memory disorders, and ophthalmoparesis in a pa-
tient with AIDS. Lancet 367, 368.Virgili, M., et al., 1992. Protection from kainic acid neuropathological syndrome by
NMDA receptor antagonists: effect of MK-801 and CGP 39551 on neurotransmitterand glial markers. Neuropharmacology 5, 469–474.
Wessenligh, S.L., 1993. Intracerebral cytokine messenger RNA expression in acquiredimmunodeficiency syndrome dementia. Ann. Neurol. 33, 576–582.
Westendorp, M.O., et al., 1995. Sensitization of T cells to CD95-mediated apoptosis byHIV-1 Tat and gp120. Nature 375, 497–500.
Zauli, G., et al., 2000. HIV-1 Tat-mediated inhibition of the tyrosine hydroxylasegene expression in dopaminergic neuronal cells. J. Biol. Chem. 275 (6),4159–4165.
Zhu, J., et al., 2009. HIV-1 Tat protein-induced rapid and reversible decrease in [3H]dopamine uptake: dissociation of [3H]dopamine uptake and [3H]2beta-carbomethoxy-3-beta-(4-fluorophenyl)tropane (WIN 35,428) binding in ratstriatal synaptosomes. J. Pharmacol. Exp. Ther. 329, 1071–1083.
Zucchini, S., et al., 2002. Neuroprotective activity of CHF3381, a putative N-methyl-D-aspartate receptor antagonist. NeuroReport 13, 2071–2074.
Zucchini, S., et al., 2008. FGF-2 overexpression increases excitability and seizure sus-ceptibility but decreases seizure-induced cell loss. J. Neurosci. 49, 13112–13124.