Neuro-QoL Technical Report Development and Initial ...
247
Neuro-QoL Technical Report Development and Initial Validation of Patient-reported Item Banks for use in Neurological Research and Practice March 2015 Submitted to the National Institute of Neurological Disorders and Stroke (NINDS) on behalf of the Neuro-QoL investigators Neuro-QoL is the Quality of Life in Neurological Disorders Measurement System Please cite as follows: Neuro-QoL Technical Report, March 2015: www.neuroqol.org Do not cite or distribute without permission from Dr. David Cella, Principal Investigator.
Transcript of Neuro-QoL Technical Report Development and Initial ...

Neuro-QoL Technical Report
Development and Initial Validation of Patient-reported Item Banks for use in
Neurological Research and Practice
March 2015
Submitted to the National Institute of Neurological Disorders and Stroke (NINDS)
on behalf of the Neuro-QoL investigators
Neuro-QoL is the Quality of Life in Neurological Disorders Measurement System Please cite as follows: Neuro-QoL Technical Report, March 2015: www.neuroqol.org
Do not cite or distribute without permission from Dr. David Cella, Principal Investigator.

Contents
Overview ......................................................................................................................................................................... 3
Development of item banks ........................................................................................................................................... 3
Sampling and Pilot Testing .............................................................................................................................................. 7
Item Statistics................................................................................................................................................................ 11
Neuro-QoL Field Testing and Clinical Validation........................................................................................................... 13
Methods .................................................................................................................................................................... 13
Measures .................................................................................................................................................................. 15
Statistical Analyses .................................................................................................................................................... 17
Disease-specific Measures and Results ........................................................................................................................ 18
Stroke ........................................................................................................................................................................ 18
Amytrophic Lateral Sclerosis (ALS) ........................................................................................................................... 23
Multiple Sclerosis (MS) ............................................................................................................................................. 28
Parkinson’s Disease ................................................................................................................................................... 33
Adult Epilepsy ........................................................................................................................................................... 38
Pediatric Epilepsy ...................................................................................................................................................... 44
Muscular Dystrophies ............................................................................................................................................... 48
General Conclusions/Discussion ................................................................................................................................... 53
For Further Information ................................................................................................................................................ 53
Publications ................................................................................................................................................................... 54
References .................................................................................................................................................................... 57
APPENDIX A – Statistics Tables and Figures .................................................................................................................. 60
Item Statistics- Adult: Included, Excluded, Calibrated, and Uncalibrated ................................................................ 60
Item Statistics- Pediatric: Included, Excluded, Calibrated, and Uncalibrated .......................................................... 96
Additional Instrument Statistics ............................................................................................................................. 120
Figures ..................................................................................................................................................................... 124
APPENDIX B - Neuro-QoL Technical Report Version 1.0 ............................................................................................. 127
2
Overview
The National Institute of Neurological Disorders and Stroke (NINDS) funded Neuro-QoL to create a clinically-relevant and psychometrically-robust health-related quality of life (HRQL) assessment tool for both adults and children. The specific goals of Neuro-QoL include: (1) the development of a core set of questions that address dimensions of HRQL that are universal to patients with chronic neurological disorders, (2) the development of supplemental questions that address HRQL concerns specific to particular groups of patients based on disease status and other sociodemographic variables such as age and ethnicity, and (3) to create a publically available, adaptable and sustainable system, which allows clinical researchers to have access to a common item repository and be able to administer computerized adaptive testing (CAT). The measures are intended to be responsive to the needs of researchers that are working with a variety of neurological disorders across a wide range of settings, which enables the facilitation of comparisons of data across clinical trials that focus on disparate diseases. The Neuro-QoL items, item banks, and scales are the result of a rigorous development process that included literature review, qualitative and cognitive interviewing, general population and clinical population testing, and state-of-the-art item response theory (IRT) analyses. The purpose of this Technical Report is to provide the reader with information about the methodology used to create Neuro-QoL, and to provide psychometric information for the items, scales, and banks that comprise Neuro-QoL.
Development of item banks
Based on our assessment of the needs of NINDS-funded researchers, Neuro-QoL focused on five adult conditions (stroke, multiple sclerosis, Parkinson’s disease, epilepsy, and amyotrophic lateral sclerosis [ALS]) and two pediatric conditions (epilepsy and muscular dystrophy). The Neuro-QoL item banks and scales were created using a rigorous set of steps, which were guided by best practices, very similar to those used in the National Institutes of Health (NIH) Patient-Reported Outcomes Management Information System (PROMIS) initiative,1-5 as well as guidance from the Food and Drug Administration on the creation of patient-reported outcomes to be used in clinical trials, which in turn are used to support label claims for medications and other medical interventions.6 There were six phases of item development: 1) identification of extant items, using a systematic search for existing questions in currently available scales, 2) item classification and selection, 3) item review and revision by trained professionals who reviewed the wording of each question and revised them in accord with conventions adopted by the Neuro-QoL group, 4) focus group input on domain coverage to confirm domain definitions and to identify new areas of item development for future item banks, 5) cognitive interviews with patients to assess their understanding of individual items, and 6) final revision before field testing. Questions that survived this process were field tested and their psychometric properties were evaluated using classical test theory and item response theory models. The list of adult and pediatric Neuro-QoL domains is listed in Tables 1 and 2, respectively.
3

Table 1 – Neuro-QoL Domains for Adults
Phys
ical
Func
tion/
Heal
th
Upper Extremity Function – Fine Motor, ADL (Bank) One's ability to carry out various activities involving digital, manual and reach-related functions, ranging from fine motor to self-care (activities of daily living). Lower Extremity Function – Mobility (Bank) One's ability to carry out various activities involving the trunk region and increasing degrees of bodily movement, ambulation, balance or endurance. Bowel/Bladder Function (Item Pool) Functional problems related to storage and emptying, such as incontinence or constipation, urgency, leakage and discomfort. Sexual Function (Item Pool) A person's overall evaluation of, satisfaction with and quality of sexual activities, including interest, discomfort, functioning and ability to achieve orgasm.
Sym
ptom
s
Fatigue (Bank) Sensations ranging from tiredness to an overwhelming, debilitating and sustained sense of exhaustion that decreases one’s capacity for physical, functional, social and mental activities. Sleep Disturbance (Bank) Perceptions of sleep quality, sleep depth, and restoration associated with sleep; perceived difficulties with getting to sleep or staying asleep; and perceptions of the adequacy of and satisfaction with sleep.
Men
tal Em
otio
nal H
ealth
Depression (Bank) Experience of loss and feelings of hopelessness, negative mood (e.g., sadness, guilt), decrease in positive affect (e.g., loss of interest), information-processing deficits (e.g., problems in decision-making), negative views of the self (e.g., self-criticism, worthlessness), and negative social cognition (e.g., loneliness). Anxiety (Bank) Unpleasant thoughts and/or feelings related to fear (e.g., fearfulness, feelings of panic), helplessness, worry and hyperarousal (e.g., tension, nervousness, restlessness).
Stigma (Bank) Perceptions of self and publically enacted negativity, prejudice and discrimination as a result of disease-related manifestations. Positive Affect and Well-Being (Bank) Aspects of a person’s life that relate to a sense of well-being, life satisfaction or an overall sense of purpose and meaning. Emotional and Behavioral Dyscontrol (Bank) A set of disease and/or treatment related manifestations including disinhibition, emotional lability, irritability, impatience, and impulsiveness. End of Life Concerns (Pending ) Issues and concerns that emerge at the end of one's life (including basic functioning across physical, social, emotional, cognitive and existential domains, as well as overall satisfaction with care and symptom palliation).
Cogn
itive
Hea
lth Cognitive Function (Bank)*
Perceived difficulties in cognitive abilities (e.g., memory, attention, and decision making, or in the application of such abilities to everyday tasks (e.g., planning, organizing, calculating, remembering and learning). Communication (Scale) Perceived difficulties related to oral expression, language production, articulation, comprehension and organization.
Soci
al
Ability to Participate in Social Roles and Activities (Bank) Degree of involvement in one’s usual social roles, activities and responsibilities, including work, family, friends and leisure. Satisfaction with Social Roles and Activities (Bank) Satisfaction with involvement in one's usual social roles, activities and responsibilities, including work, family, friends and leisure.
*The Cognitive Function item bank consists of Applied Cognition – General Concerns and Applied Cognition - Executive Function banks from Neuro-QoL version 1., which were jointly co-calibrated in the current version 2.
4

Table 2 – Neuro-QoL Domains for Pediatric Populations
Phys
ical
Func
tion/
Heal
th Upper Extremity Function – Fine Motor, ADL (Uncalibrated scale)
One's ability to carry out various activities involving digital, manual and reach-related functions, ranging from fine motor to self-care (activities of daily living).
Lower Extremity Function – Mobility (Uncalibrated scale) One's ability to carry out various activities involving the trunk region and increasing degrees of bodily movement, ambulation, balance or endurance.
Sym
ptom
s
Fatigue (Bank) Sensations ranging from tiredness to an overwhelming, debilitating and sustained sense of exhaustion that decreases one’s capacity for physical, functional, social and mental activities. Pain (Bank) An unpleasant sensory or emotional experience associated with actual or potential tissue damage, or described in terms of such damage. Conceptually divided into components of quality (e.g. the nature, characteristics, intensity, frequency, and duration of pain), behaviors (e.g. verbal and nonverbal actions that communicate pain to others) and interference (e.g. impact of pain on physical, mental, and social activities).
Men
tal Em
otio
nal H
ealth
Depression (Bank) Experience of loss and feelings of hopelessness, negative mood (e.g., sadness, guilt), decrease in positive affect (e.g., loss of interest), information-processing deficits (e.g., problems in decision-making), negative views of the self (e.g., self-criticism, worthlessness), and negative social cognition (e.g., loneliness). Anxiety (Bank) Unpleasant thoughts and/or feelings related to fear (e.g., fearfulness, feelings of panic), helplessness, worry and hyperarousal (e.g., tension, nervousness, restlessness).
Stigma (Bank) Perceptions of self and publically enacted negativity, prejudice and discrimination as a result disease-related manifestations. Anger (short form) Angry mood (e.g., irritability, frustration), verbal aggression, and efforts to control anger.
Cogn
itive
Hea
lth
Cognitive Function (Bank)* Perceived difficulties in everyday cognitive abilities such as memory, attention, concentration, processing speed and organization skill.
Soci
al H
ealth
Social Relations – Interaction with Peers (Bank) Degree of involvement with one's peers in usual social roles, activities and responsibilities Social Relations – Interaction with Adults (uncalibrated) Degree of involvement with adults in one’s usual social roles, activities and responsibilities
*The pediatric Cognitive Function v2.0 bank was originally named Applied Cognition – General Concerns v1.0. The items are the same, but the calibrations are different.
5

Neuro-QoL investigators and expert consultants identified candidate instruments and items via literature searches and previous item banking projects (e.g., PROMIS; Cella, et al.2010).2 Our team created an item library, which included information on the time frame of the response requested, the exact wording of the item stem and response options, and any context (e.g., specific instructions) for the respondent to consider when answering questions. For each domain, the investigative team constructed a comprehensive item pool. Some items included in the Neuro-QoL library are from the NIH PROMIS and the Activity Measure for Post Acute Care.7 Teams of three or more domain experts then assigned items to the Neuro-QoL domains through an iterative, multi-step process. We then organized items into domains, sub-domains, factors, and facets, and then reviewed items to determine if they should proceed through detailed item review, revision, and testing. Once all items were assigned to a domain area, content experts systematically removed items from individual pools. Content experts removed items when there was apparent semantic redundancy. In these cases, we selected the item that was more consistent with the concept definition, or the item that was clearest. Some items in development were found to lack cultural relevance or sensitivity, to lack gender neutrality, to be difficult to translate, or to exhibit excessive disease specificity. We discarded these items. Items that survived this initial review underwent a subsequent, more thorough review, which was conducted by two scientists appointed as co-chairs of the content domain, we well as additional, independent content experts. We also revised the majority of the items to ensure general consistency across banks, to assure comprehensiveness in measuring the domain, to ensure clear, understandable and precise language, to easily facilitate linguistic translation, and to maintain adaptability to the data collection and analysis strategies planned. Teams of domain experts reviewed and synthesized findings to make further decisions about which items to carry forward in testing. Final item pools were reviewed by 63 patients with neurological disorders using telephone-based cognitive interviews in English and Spanish to assess the content validity of items, clarify concepts, and refine language and response options. During interviews, patients reviewed each item in individual semi-structured interviews that focused on item comprehension and relevance. Patients and experts also identified areas for new item development, for which additional items were written or revised. For children, cognitive interviews were conducted with individuals aged 10-18. Overall, the primary goal was to use the data to better understand the dimensional structure of items that specifically pertained to the various domain areas of Neuro-QoL. Additionally, the results informed the revision of items in the item pools and facilitated new item development prior to the first wave of testing.
6

Sampling and Pilot Testing
Adult samples
A complete discussion of the development and testing of adult items is discussed in Gershon et al.8 Data collection occurred in two waves. The first wave was divided into two parts. Testing from January 31, 2008 to March 10, 2008 is referred to as Wave 1a, and included clinical samples for domains targeted to certain neurological conditions. Wave 1b occurred from September 11, 2008 to September 24, 2008, and was sampled from the U.S. general population. Wave 2 validation testing occurred from January 15, 2009 to January 30, 2010, and included clinical samples. The sampling plan facilitated obtaining item calibrations for the different domain areas, estimating profile scores for varied subgroups, confirming factor structure, and conducting item and bank analyses. We had over 500 candidate items, so participants could not respond to all of the items. We estimated that participants would respond to four questions per minute, with the maximum number of items administered for each respondent approximately 150. This led to a response time on average of 37 minutes. For Wave 1a, the response data were collected by YouGovPolimetrix (www.polimetrix.com). Their standard respondent pool for an internet-based survey is taken from a predetermined panel of people who typically respond to the company’s online surveys. Chosen panelists receive modest compensation (under a $10 value) for their participation. Wave 1b data was collected through Greenfield Online, which is also an online panel organization, who offers a similar service to YouGovPolimetrix. Greenfield Online was chosen for Wave 1b because their services proved more economical for this particular sample and they use a similar method to YouGovPolimetrix. All participants completed a socio-demographic form consisting of approximately 20 auxiliary items that measured global health perceptions, and socio-demographic variables including age, gender, race/ethnicity, relationship status, educational attainment, and employment status, income, number of hospitalizations, disability days, use of prescription medication, height, weight. In addition, participants answered a series of health questions about the presence and degree of limitations as they related to multiple neurological conditions affecting adults including stroke, multiple sclerosis, Parkinson’s disease, epilepsy and ALS. For some calibrations, we combined data from multiple samples to overcome difficulties associated with infrequent responses to items and stability of parameter estimates in Item Response Theory models. The cognitive function items were subsequently tested with an English-speaking adult sample from the general population (PROsetta Stone wave 2). We enlisted the services of an internet survey company (www.op4g.com) that maintains a panel of respondents from the general population. Since Op4G Internet panel respondents were not likely to be representative of the US general population, we imposed in our contracting with them minimum requirements for age, gender, race, ethnicity and education of the participants, to approximate the 2010 US Census distributions. A randomly selected group of adult English-speaking panel members received an e-mail notifying them of a new survey opportunity. After receiving information about the study and providing consent, they completed a set of sociodemographic, education and comorbidity items before filling out the Neuro-QoL items. The characteristics of the adult calibration samples are provided in Table 3.
7

Table 3 – Calibration samples for adult items Sub-domain Status Calibration Sample Upper Extremity Function - Fine Motor, ADL Item bank Wave 1b (General Population) +
Wave 2 Lower Extremity Function - Mobility Item bank Wave 1b (General Population) +
Wave 2 Urinary/Bladder Function Item pool – Not
tested Not tested
Bowel Function Item pool – Not tested
Not tested
Sexual Function Item pool – Not tested
Not tested
Fatigue Item bank Wave 1a Sleep Disturbance Item bank Wave 1a + Wave 2 ( Depression Item bank Wave 1b (General Population) Anxiety Item bank Wave 1b (General Population) Stigma Item bank Wave 1a Positive Affect and Well-Being Item bank Wave 1b Emotional and Behavioral Dyscontrol Item bank Wave 1a End of Life Concerns Item pool – Not
tested Not tested
Cognitive Function Item bank PROsetta Stone w2 (General Population)*
Communication Item pool Not calibrated Ability to Participate in Social Roles and Activities
Item bank Wave 1b
Satisfaction with Social Roles and Activities Item bank Wave 1b * Cognitive Function Item Bank was calibrated using PROsetta Stone w2 sample and then linked to PROMIS Cognitive Function (v2) Sample sizes: Note: Some participants were dropped from some IRT analyses due to missing data. Wave 1a; N = 553 clinical participants (stroke, n = 209; epilepsy, n = 183; multiple sclerosis, n = 84; Parkinson’s, n = 59; ALS, n = 18) Wave 1b; Participants were divided into four groups (A-D). Group A completed the Ability to Participate in Social Roles and Activities and Satisfaction with Social Roles and Activities items, N = 549. Group B completed Lower Extremity (Mobility) items and the Upper Extremity (Fine Motor, ADL) items, N = 518. Group C completed the Positive Affect and Well-Being, Depression, and Anxiety items, N = 513. Group D completed the Applied Cognition – General Concerns items, N = 533. Wave 2; N = 581 clinical participants (stroke, n = 101; epilepsy, n = 119; multiple sclerosis, n = 161; Parkinson’s, n = 120; ALS, n =80) PROsetta Stone w2; N=1009 general population
8
Pediatric samples
A complete discussion of the development and testing of pediatric items is discussed in Lai et al.9 Generic domains (emotional health, social health and physical health) were field tested on samples drawn from the U.S. pediatric general population whereas targeted domains (stigma, fatigue, pain and cognition) were field tested on children with either epilepsy or muscular dystrophy. This was done because the generic item pools could be feasibly answered by a person without a medical condition, whereas the targeted item pools are typically symptoms or side effects of a disease process. We recruited the samples from internet panel companies: Greenfield Online (www.greenfield.com) and YouGovPolimetrix (www.polimetrix.com) for the US general population and clinical samples, respectively. Similar recruitment strategies were used by these two companies. Specifically, companies sent e-mails to invite parents of potential participants from their database to participate in the field testing. Potential participants were screened by the companies via internet to ensure their eligibility (i.e., English-speaking, ages of 10-18, and for disease related domains, with a diagnosis of either epilepsy or muscular dystrophy). After parents signed an online consent on behalf of their children, parents were asked to complete a series of sociodemographic and clinical information questions (for disease samples only) and children then completed appropriate Neuro-QoL items. Because of the difficulty in recruiting children with epilepsy and muscular dystrophy via a panel company, we also recruited eligible patients from epilepsy clinics at Children’s Memorial Hospital (Chicago, IL), NorthShore University HealthSystem (Evanston, Illinois) and the University of California at Davis Medical Center. One exception is the physical health related domains – Upper Extremity function (Fine motor, ADL) and Lower Extremity function (Mobility). Items written in these two domains were targeted to children with moderate to severe limitations seen in rehabilitation clinics, so we also tested these items in clinical samples in order to minimize floor effects. Procedures similar to those used by the online panel companies were implemented, except that paper versions of the informed consent and assent forms were used by research staff. After informed consent was obtained from parents of children and assent was obtained from children aged 12 and older, parents completed the demographic and clinical information (clinical sample only) and children completed the Neuro-QoL items. The pediatric cognitive function and fatigue items were subsequently tested with a pediatric English-speaking sample from the general population (PROsetta Stone wave 3). Again, we enlisted the services of an internet survey company (www.op4g.com) that maintains a panel of respondents from the general population to gain access to the panel members’ children. We specified requirements for age, gender, race and ethnicity of the pediatric participants to approximate the 2010 US Census distributions. A randomly selected group of adult English-speaking panel members received an e-mail notifying them of a new survey opportunity for children. They were asked if they had a child ages 8 to 17. If they responded “yes”, they were given information about the study and asked if they would give permission for their child to participate. Those parent / guardians who consented to have their child participate in the survey were then asked about the age of the child who would be participating, and to complete a set of sociodemographic, education and comorbidity items about that child. The parent /guardian was then asked to invite the child to the computer to complete the survey independently. The survey was administered only after the child also agreed to participate. A total of 507 pediatric respondents, ages 8 to 17, participated in the study.
Table 4 presents the nature of the pediatric calibration samples.
9

Table 4 – Calibration samples for pediatric items Sub-domain Status Calibration Sample Depression Item bank Wave 1b (General Population) Anxiety Item bank Wave 1b (General Population) Anger Item bank Wave 1b (General Population) Upper Extremity Function a Scale Not calibrated Lower Extremity Function a Scale Not calibrated Social Relations- Interaction with Peers b
Item bank Wave 1b (General Population)
Social Relations– Interaction with Adults
Item pool Not calibrated
Fatigue Item bank PROsetta Stone w3 (General Population) Pain Item bank Wave 1a + Wave 2 (muscular dystrophy and
epilepsy)
Cognitive Function Item bank PROsetta Stone w3 (General Population) Stigma Item bank Wave 1a + Wave 2 (muscular dystrophy and
epilepsy) Note. a We chose not to calibrate Upper extremity Function and Lower extremity Function because of high skewness in the distributions of these constructs. b For Sociability, we identified two sub-domains, which were different from the original conceptualization: interaction with peers and interaction with adults. We did not calibrate the latter sub-domain because of poor model fit. Thus, we do not recommend creating a summary score from these items. Sample sizes: Note: Some participants were dropped from some IRT analyses due to missing data. Wave 1a; Participants with epilepsy (n = 50) and muscular dystrophy (n = 9) Wave 1b; N = 513 general population participants. Wave 2; Participants with epilepsy (n = 61) and muscular dystrophy (n = 51) PROsetta Stone w3; N=507 general population
10

Item Statistics
Item response theory: An overview. IRT is based on the notion that a person’s response to a test item is a function of that person’s location on a latent trait. 10 The relationship between performance on an item and a latent trait is described by a mathematical function, which is known as an item characteristic curve. In IRT, the probability of responding to an item in a particular way (e.g., responding “1” for “Never” on a Neuro-QoL item) is a function of the person’s level of the latent trait. For most IRT models, there are five parameters calculated per item: an item slope parameter and four threshold parameters. The number of threshold parameters is equal to the number of response options minus one. The item slope parameter indicates how well an item can discriminate between different levels of a construct. For that reason, it is sometimes known as a discrimination parameter. 11 The threshold parameter is related to a point on a continuum at which a person is more likely than not to endorse an item in a particular way. A threshold parameter is sometimes referred to as a difficulty parameter because in some analyses they are related to how difficult it is for the items to be endorsed in a particularly way. The predicted probability of responding to an item in a particular way is determined by a person’s level on a latent trait, as well as the slope and threshold parameters. During our data-analytic phase, we used a process of iterative analysis and discussion with content domain experts; item-by-item level decisions were made as to whether an individual item should be: (1) calibrated and included in the bank, (2) not calibrated but retained for possible future calibration (e.g., items consistent with the domain being measured but having local dependence, responses concentrated in few of the available response options), or (3) excluded from further consideration (e.g. outside of concept; problematic item wording). All models were fit assuming unidimensionality, without local dependence between other items in the bank. Item response theory models used in Neuro-QoL. Neuro-QoL psychometricians calibrated each item bank using IRT. Calibration refers to fitting the items into an IRT model such that its item slope and threshold parameters are estimated. The calibrated item parameters can then be used to underlie computer adaptive tests and inform the creation of short forms. The final Neuro-QoL item banks were calibrated using different IRT modeling depending on the sample size. For adults and pediatric generic domains, Samejima’s (1997) graded response model was used. For pediatric targeted domains where sample size was less than 200, a 1-PL IRT model was used, in which a common slope parameter was estimated for all items. IRT analyses were conducted using MULTILOG or IRTPRO (adult Cognitive Function, Pediatric Cognitive Function and Pediatric Fatigue). Before fitting IRT models, we examined datasets by examining descriptive statistics such as frequencies and means, as well as statistics based on classical psychometric analyses such as corrected item-total correlations. We also evaluated data quality by assessing an item’s response distribution, including a search for out-of-range values. We tested IRT model assumptions (monotonicity, unidimensionality/local independence) and model fit (using S-G2 & S-X2) and made modifications to our models as needed. Tables 3 and 4 present information about the calibration samples for adults and pediatrics, respectively. The tables in APPENDIX A present the calibrated Neuro-QoL item banks, as well as the list of items that were retained but not calibrated, and the items that were excluded altogether. Items were excluded based on psychometric analyses and the judgment of content experts. In addition to the calibrated item banks, there are additional sets of items grouped into item pools for bowel/bladder function, sexual function, end- of- life concerns, communication difficulty, and interaction with adults (pediatric). Items that met requirements of unidimensionality, but do not fit an IRT model, are treated as “scales” rather than calibrated item banks. The distinction is that whereas a scale can
11

be summed to obtain a total summary score, a calibrated bank can be administered using an array of different short forms, including CAT, to produce a summary score on the same, common metric. Examples of uncalibrated scales include pediatric upper extremity function and pediatric lower extremity function. Assessment of unidimensionality. For each item pool, we strove to compile lists of items that measured a single construct consistent with the definition of content experts. We conducted formal tests of whether our item pools measured a single dimension. The challenge of dimensionality assessment is to develop approaches to assess whether a scale has a strong enough general factor so that it is essentially unidimensional. Essential dimensionality (e.g., McDonald, 1981) is defined as the degree to which a test score is influenced by a common factor underlying an item set. No complex item set will ever perfectly meet strictly defined unidimensionality assumptions (see McDonald, 1981); therefore, we sought to confirm that the trait level estimates are predominantly influenced by a general factor. Unidimensionality was examined for each item bank using confirmatory factor analysis guided by fit statistics as well as conceptual input from domain experts. As part of our confirmatory factor analyses, we also assessed local dependence, which refers to covariation between two or more items not accounted for by the unidimensional IRT model. Local dependence was assessed by examining the residual correlations between items. Differential item functioning. An item displays differential item functioning (DIF) when the probabilities of responding in different categories differ by population for the same underlying level of the attribute. Items were evaluated for DIF by contrasting the IRT parameters across a variety of demographic groups. IRT-based hierarchical ordinal logistic regression (OLR) approach as implemented in LORDIF12 was used for evaluation of DIF. In this approach a series of logistic models predicting the probability of item response were run and compared. The independent variables in Model 1 are the trait estimate (e.g., raw scale score), group and the interaction between group and trait. Model 2 included main effects of trait and group, and Model 3 included only the trait estimate. Non-uniform DIF was detected if there was a statistically significant difference in the likelihood for Model 1 and Model 2, and uniform DIF is evident if there is a significant difference in the likelihoods for Models 2 and 3. Items flagged for DIF were further discussed before making a final decision with regard to inclusion vs. exclusion based on how much impact DIF items had on final scales.
12

Neuro-QoL Field Testing and Clinical Validation
Our second phase of field testing was conducted from January 2009 through June 2010. The purpose was to evaluate the reliability, validity and responsiveness of Neuro-QoL short forms and scales in clinical neurology populations. A total of 581 adult and 113 pediatric patients were recruited to reflect the five adult and two pediatric neurological conditions targeted by Neuro-QoL. Proxies for stroke (N = 84) and the two pediatric samples (N = 113) also completed forms. Administration of Neuro-QoL Short Forms and clinical validation measures (both cross-disease and disease-specific), physician ratings and chart review was conducted at baseline and at a 180-day follow up (to assess responsiveness). Test-retest reliability of the Neuro-QoL Short Forms was evaluated at 7 days. Table 5 lists the number of patients with each respective neurological condition (and proxies) who completed each assessment. Table 5 – Field Testing/Clinical Validation Sample
Number completing assessment
Baseline 7-day 180-day
Multiple Sclerosis 161 125 132 Parkinson’s disease 120 116 108 Adult Epilepsy 119 119 109 Stroke 101 95 90 Stroke Proxies 84 78 73 ALS 80 77 59 Pediatric Epilepsy 62 60 56 Pediatric Epilepsy Proxies 62 60 56 Muscular Dystrophy 51 48 48 Muscular Dystrophy Proxies 51 48 48 Total: 891 826 779
Methods Participating Sites. Participants were recruited from several clinical sites, including: Ann & Robert H. Lurie Children's Hospital of Chicago (formally, Children’s Memorial Hospital of Chicago), Cleveland Clinic Foundation, Dartmouth-Hitchcock Medical Center, NorthShore University HealthSystem, Northwestern University Feinberg School of Medicine, Rehabilitation Institute of Chicago, University of California – Davis, University of Chicago, University of Puerto Rico, and University of Texas Health Science Center. Site Procedures. Each accrual site had a coordinator who assumed overall responsibility for the project at that particular site. All procedures were approved by the NorthShore University HealthSystem Institutional Review Board (IRB) as well as IRBs at each respective institution. Site coordinators identified, enrolled and conducted assessments with eligible participants according to criteria and procedures specified in the Manual of Procedures. Because our goal was to produce a generalizable measurement platform, eligibility criteria were broad. Table 6 lists our general inclusion/exclusion criteria.
13

Table 6. Clinical Validation Sample Inclusion/Exclusion Criteria
INCLUSION CRITERIA EXCLUSION CRITERIA
Group Age Gender Language
Diagnosed Neurological Condition Proxy
Children
Epilepsy: 10-18 MD: 10-21*
Proportional breakdown of males and females according to incidence rates of respective conditions
English
Epilepsy, Muscular Dystrophy
Proxies (primary care givers) of children with epilepsy or muscular dystrophy
• Younger/older than age limits
• Non-English speaking • Cognitive impairment that
would prevent informed consent and/or completion of test items with the assistance of an interviewer (as determined by recruiting staff).
• Does not have a proxy (for
adults with stroke or children with epilepsy or muscular dystrophy) Adults >18 English
Stroke, MS, ALS, Parkinson's Disease, Epilepsy
Proxies of patients with stroke
*Due to the nature and developmental impact of muscular dystrophy, participants may be ≤21 years of age to meet eligibility requirements. Additional, disease-specific exclusion criteria were: presence of non-epileptic seizures for epilepsy, and being non-community dwelling for stroke. Recruitment and Testing. Various recruitment methods were utilized including: 1) approaching patients in clinics and 2) mailing letters of invitation to physician-identified patients informing them that someone would contact them about the study at their next clinic appointment. Informed consent or assent (for pediatric participants) was obtained from each subject and covered all three assessments (baseline, 7 days, and 180 days). There was a 5-9 day window for the test-retest assessment and a 5-7 month window for the responsiveness assessment. After a patient was identified and approached, the site coordinator arranged a meeting to introduce and describe the study, confirm eligibility, explain participants’ rights, and obtain informed consent and HIPPA authorization if the eligible participant was interested. Site personnel then either administered the baseline evaluation at that time or else scheduled it for another time. Baseline evaluations, consisting of Neuro-QoL instruments, concurrent validity measures, and sociodemographic and clinical data forms, lasted approximately 90 minutes. Some measures, including the Neuro-QoL instruments, were self-reported via a computer. Other measures were administered by study staff (e.g., performance-based cognitive measures). Medical professional ratings and chart review were also conducted at baseline and as part of the 180-day follow up. Participants were reimbursed according to local IRB-approved standards.
14

Measures
General Forms Socio-demographic form. This form provides patient characteristics (e.g., age, gender, race, ethnicity and education). This information was collected at baseline via chart review and/or face-to-face interview. Clinical information form. This form records disease specific information (e.g., date of diagnosis, treatments) for each participant. It was gathered via chart review and through interviews with patients and/or parents at baseline and 180-day follow-up interviews. Neuro-QoL Short Forms All short forms provided raw scores which were converted to T-Scores; with a T = 50 indicating average function compared to the reference population and a standard deviation of 10. Neuro-QoL T-scores referenced to a general population sample are indicated by GPT (General Population T-Score) while those referenced to a clinical sample are indicated by CT (Clinical T-Score). General Function – Adults Only Barthel Index. The Barthel Index was developed by Mahoney and Barthel13 and is one of the best known and most widely used instruments to assess basic activities of daily living (ADL). The Barthel Index assesses the degree of independence a patient has in performing various self-care and mobility ADL tasks. The weighted ordinal scale assesses 10 items of ADL in the following subgroups: personal care (including eating), dressing, personal hygiene and bathing, continence of urine and stool, mobility (including transfer from a bed and toilet), walking, and steps. The index has high test-retest reliability (r=0.89), inter-rater reliability (r>0.95),(Granger, Albrecht, & Hamilton, 1979) and internal consistency (Cronbach’s alpha = 0.98).(Shinar et al., 1987) We administered this by standardized interview. Instrumental Activities of Daily Living Scale. The Lawton Instrumental Activities of Daily Living Scale,14is an interviewer administered measure which includes 8 items: telephoning, shopping, food preparation, housekeeping, laundry, transportation, medications, and handling finances. Each task is graduated in a 3- or 4-level scale. The scale measures performance in contrast to ability. General Function – Adults and Children Karnofsky Performance Status Scale (KPSS). 15 The KPSS is a rating of functional impairment and offers a simple if coarse breakdown of activity level across patients regardless of diagnosis. KPSS criteria are based on descriptive categories from 0-100. Ratings were made by providers. Cognitive Function – Adults and Children Oral Digit Symbol Modalities. 16 This is a test of speed of information processing, but is also thought to assess visual acuity and figural memory. A timed coding task using a key as reference, examinees pair specific numbers (0-9) with designated geometric figures that are matched up in the key; examinees attempt to complete as many matches as quickly as possible in 90 seconds. Written and oral forms are highly correlated (in normal adults >.78). Because some participants may have greater motor deficits compared to others, we administered the oral version. Symbol Search.17 A test of mental speed, this is a timed orthographic measure of visual attention, scanning, and motor speed. Participants must determine if a target nonsense figure is present in a string of figures and mark a corresponding “yes” or “no” box presented at the end of each item. Digit Symbol Coding. 17 This is a timed paper/pencil symbol substitution task of mental, visual and motor speed. Using a key of paired numbers and symbols, participants must draw corresponding nonsense symbols below rows of numbers.
15

Health Related Quality of Life – Adults (including proxies) and Children EQ-5D.18,19 This is a 15-item self-report measure of health status developed by the EuroQoL Group in order to provide a simple, generic measure of HRQL for clinical and economic appraisal. Applicable to a wide range of health conditions and treatments, it provides a simple descriptive profile and a single index value for health status. Domains include: mobility, self-care, usual activities, pain/discomfort and anxiety/depression. PROMIS Global Health Scale. 20 Global health refers to evaluations of health in general rather than specific elements of health. The PROMIS global health items include global ratings of the five primary PROMIS domains (physical function, fatigue, pain, emotional distress, social health) and general health perceptions that cut across domains. It can be scored into a Global Physical Health component and Global Mental Health component. Global items allow respondents to weigh together different aspects of health to arrive at a ‘bottom-line” indicator of their health status. Global health items have been found to be consistently predictive of important future events such as health care utilization and mortality. Global HRQL Question. 21A single item from the Functional Assessment of Chronic Illness Therapy (FACIT), “I am content with the quality of my life right now,” was used as a global measure of quality of life. Health Related Quality of Life – Children and Pediatric proxies Pediatric Quality of Life Inventory, Multidimensional Fatigue Scale (PedsQL™-MFS) 22,23 The PedsQL - MFS is a self-report measure consisting of both a general quality of life measure (PedsQLTM) and a fatigue specific measure (MFS). The PedsQLTM is designed to measure core health dimensions in children from 2 to 18 years old. The measure consists of 23 items in four scales: physical functioning, emotional functioning, social functioning, and school functioning. Children/Teens completed a self-report assessment. Proxies completed the parent/caregiver form. The MFS consists of 18 items across three domains: general fatigue (6 items), sleep/rest fatigue (6 items), and cognitive fatigue (6 items). Pain – Adults (including proxies) and Children Pain question. A single (0-10) item that asks patients to rate, from “none” (0) to “the worst pain you can think of (“10”), the severity of their worst pain during the past week. Responsiveness – Adults and Children Karnofsky Performance Status Scale (KPSS). 15Described above. Global rating of change. This measurement strategy assumes that a patient can judge whether over the course of a specified period, their self-reported health status has changed. Typically, such questions require patients to remember a prior health state and compare it to how they are currently feeling.24,25 In this study, participants were asked to rate how much their Physical, Emotional, Cognitive, Social/Family and Symptomatic Well-being and their overall quality of life had changed over the past 6 months according to the following scale: +3 = “Very much better” to -3 = “Very much worse”. Such global transition ratings have the advantage of being easy to interpret and they enhance the interpretability of HRQL scores when found to be correlated with the target instrument. For instance, if the correlation between a global rating of change and the change score on a target instrument is over 0.5, the validity of the target instrument is supported. Global transition ratings have been widely used in HRQL outcome assessments to augment the interpretation of HRQL scores. 26-28 Proxies completed a proxy version of this measure.
16

Statistical Analyses
The following analyses were conducted for all clinical groups.
1. Means, standard deviations, and other distributional statistics were calculated for all scores at the baseline and follow-up assessments.
2. Internal consistency reliability - Internal consistency analyses were performed for each Neuro QoL measure using Cronbach’s alpha coefficients.
3. Test-retest reliability - Intraclass correlation coefficients and corresponding 95% confidence intervals were calculated to assess the test-retest reliability of the Neuro-QoL measures using the baseline and 7-day assessments.
4. Concurrent validity was assessed at baseline by Spearman rho correlations between Neuro-QoL short forms and disease-specific and cross-disease measures.
5. Known groups validity was evaluated at baseline by comparing mean Neuro-QoL scores between patients grouped by clinical anchors such as disease severity. Analysis of variance (ANOVA) was used to test for differences between groups. Effect sizes (mean difference / pooled standard deviation) were calculated to aid in interpretation of group differences.
6. Responsiveness -To demonstrate the sensitivity of the Neuro-QoL measures for detection of change, we evaluated general linear models using each patient's change score. We conducted responsiveness analyses on the Neuro-QoL banks using several criteria for change. One criterion used across all adult conditions was the Karnofsky Performance Status, and another was the self-reported Global Rating of Change (GRC) described above. Here we report the results from the GRC-based change. Beginning with the 7-level GRC (range: 1= very much better; 4 = about the same; 7 = very much worse), we collapsed the three “better” categories into one, and the three “worse” categories into one, leaving three categories (“better;” “about the same;” “worse”). These three categories were compared using one-way analysis of variance followed by least significant difference testing of adjacent groups when the overall F statistic was significant. For each analysis, we required that at least 10 patients be represented in each of these three categories. If fewer than ten patients were represented in a category, it was collapsed with the adjacent category and the two remaining groups were compared using a t-test. There were six GRC questions. Five of them queried patients specifically about change in Physical well-being, Cognitive Well-Being, Emotional well-being, Social/Family Well-being, and Disease-related Symptoms. The sixth GRC item asked about overall quality of life. The list below indicates which of the 13 adult item bank change scores were compared across GRC categories:
Physical well-being: Upper Extremity and Lower Extremity Function; Fatigue; Sleep Disturbance Cognitive well-being: Cognitive Function Emotional well-being: Depression; Anxiety; Stigma; Positive Affect and Well-Being; Emotional and Behavioral Dyscontrol Social well-being: Social Function (Ability to Participate in Social Roles and Activities and Satisfaction with Social Roles and Activities); Stigma Symptoms: Fatigue; Sleep Disturbance; Emotional and Behavioral Dyscontrol; Depression; Anxiety Overall: ALL
This resulted in 31 planned comparisons for adult clinical validation sample (no adjustment made for multiple comparisons). Results for these responsiveness analyses are presented below. Only those that achieved statistical significance will be summarized.
17

Disease-specific Measures and Results
Stroke
Disease-Specific Measures Stroke Specific Quality of Life (SS-QOL) scale.(Williams, Weinberger, Harris, Clark, & Biller, 1999) The SSQOL is a 49 item self-report measure containing domains of energy, family roles, language, mobility, mood, personality, self-care, social roles, thinking, vision, upper extremity function and work-productivity. Items are scored on a 5-point Likert scale. Although relatively new, initial psychometric properties are good. The American Heart Association Stroke Outcome Classification (AHA.SOC). 29,30The AHA.SOC score provides a mechanism to comprehensively document stroke impairments and disabilities in a single summary stroke score. The system can be used by healthcare providers to reliably assess recovery, measure responses to treatment, and describe the long-term impact of stroke on survivors. Results Sample characteristics. 101 subjects were recruited from 5 centers. Participants were primarily male (55%), white (73%), and non-Hispanic (90%) with average age=59 years (SD=14). Fifty-seven percent were married, 73% had a high school or greater education. Thirteen percent were retired, 33% on disability and 19% were employed either full or part time. Average time post-stroke was 5.4 years (SD=5), with 22% reporting no or minimal deficits, 58% mild/moderate deficits and 20% severe deficits. The primary stroke type was an infarction (71%). As shown in Table 7, respondents reported worse cognitive and physical function and social well-being than the general population reference group, but more positive affect and well-being. When compared to a clinical reference group, they reported less depression, fatigue and sleep disturbance, better emotional and behavior control and average stigma. Reliability: Table 7 shows that the internal consistency and 1 week test-retest reliability of the short forms is high, with Cronbach’s alphas ranging from .78 to .94 and ICCs ranging from .57 to .89.
18

Table 7. Descriptive and reliability statistics for Neuro-QoL short form T-scores
*For these banks, a high score indicates better function; for all other banks a high score indicates worse function **Time 1 (baseline) vs. Time 2 (7 days), single measures ICC M GPT – Mean General Population T-Score; MCT- Mean Clinical T-Score Validity: Table 8 shows Spearman rho correlations between Neuro-QoL short form T-scores and stroke specific measures. Table 9 presents Spearman rho correlations between Neuro-QoL short form T-Scores and cross-disease measures. Table 8. Correlations for Neuro-QoL short form T-scores with stroke-specific measures
*p < .05; **p < .01; ***p < .001
Neuro-QoL Short Form Nitems Npersons M GPT MCT SD α T-R ICCs** Positive Affect & Well Being* 9 100 54.92 8.02 .94 .71 Cognitive Function 8 101 49.66 9.66 .94 .78 Lower Extremity (Mobility)* 8 89 42.73 7.98 .87 .89 Upper Extremity (Fine Motor, ADL)* 8 101 38.45 9.38 .83 .79 Ability to Participate in Social Roles and Activities*
8 100 46.08 7.09 .93 .76
Satisfaction with Social Roles and Activities*
8 100 45.30 5.49 .83 .57
Depression 8 100 47.23 7.48 .92 .69 Anxiety 8 100 50.82 6.61 .89 .61 Stigma 8 100 51.94 6.33 .91 ..71 Fatigue 8 100 45.03 8.78 .93 .71 Sleep Disturbance 8 99 46.33 8.25 .78 .61 Emotional and Behavioral Dyscontrol 8 99 45.58 8.47 .89 .66
Neuro-QoL Short Form AHA SOC Number of Neurological Domains
Impaired
AHA SOC Severity of Impairment
AHA SOC Level of Function
SS-QOL Total Score
Positive Affect & Well Being -.17 -.28** -.33*** .61*** Cognitive Function -.19 -.31*** -.16 .56*** Lower Extremity (Mobility) -.23* -.48*** -.44*** .62*** Upper Extremity (Fine Motor, ADL) -.33*** -.60*** .54*** .62***
Ability to Participate in Social Roles and Activities -.34*** -.40*** -.44*** .72***
Satisfaction with Social Roles and Activities -.18 -.35*** -.39*** .63***
Depression .18 .30** .36*** -.62*** Anxiety .14 .13 .09 -.50*** Stigma .28** .39*** .35*** -.55*** Fatigue .06 .16 .26* -.60*** Sleep Disturbance .09 .17 .17 -.48*** Emotional and Behavioral Dyscontrol .11 .18 .10 -.49***
19

Table 9. Correlations for Neuro-QoL short form T-scores with cross-disease measures
*p < .05; **p < .01; ***p < .001
Neuro-QoL Short Form
Barthel Index
Lawton IADL Scale
Symbol Digit Modalities #
Correct
Symbol Search
Raw Score
Digit Symbol
Coding # Correct
PROMIS Global
Physical
PROMIS Global Mental
Pain Scale (0-10)
EQ-5D Index Score
Global HRQL (0-4)
Positive Affect & Well Being
.36*** .24* .28** .23* .14 .46*** .66*** -.26** .38*** .52***
Cognitive Function ..20* .28** .23* .19 .18 .19 .44*** -.10 .25* .26** Lower Extremity Function -Mobility
.66*** .44*** .35*** .38*** .32** .62*** .33** -.36*** .62*** .42***
Upper Extremity -Fine Motor, ADL
.65*** .42*** .34*** .38*** .35*** .47*** .38*** -.16 .59*** .36***
Ability to Participate in Social Roles and Activities
.44*** .43*** .21* .22* .17 .56*** .58*** -.30** .54*** .48***
Satisfaction with Social Roles and Activities
.45*** .31*** .22* .26* .21* .56*** .49*** -.43*** .55*** .49***
Depression -.39*** -.21* -.20 -.24* -.04 -.48*** -.66*** .34*** -.46*** -.49*** Anxiety -.17 -.15 -.01 -.03 .10 -.39*** -.55*** .31** -.31** -.36*** Stigma -.35*** -.22* -.18 -.22* -.15 -.32** -.44*** .26* -.32*** -.52*** Fatigue -.43*** -.30** -.22* -.26* -.03 -.63*** -.49*** .34*** -.38*** -.38*** Sleep Disturbance -.22* -.12 -.21* -.22* -.09 -.39*** -.40 .27** -.24* -.34*** Emotional and Behavioral Dyscontrol
-.19 -.05 -.05 -.03 .05 -.25* -.48*** .22* -.29** -.41***
20

Known groups validity: AHA severity level was used to split the sample into 3 groups: no/minimal neurological deficit; mild/moderate neurological deficit; severe neurological deficit. These groups differed significantly on all Neuro-QoL short forms except Anxiety, Fatigue, Sleep Disturbance and Emotional and Behavioral Dyscontrol. Effect sizes ranged from -.68 to 2.55. Responsiveness: Of the 31 planned comparisons, 15 were statistically significant and one exhibited a trend toward significance, in the predicted direction. Physical Well-Being: Of the four planned comparisons [Lower Extremity Function-Mobility, Upper Extremity Function - Fine Motor, ADL, Fatigue, and Sleep Disturbance] three were statistically significant, all in the predicted direction. Specifically, significant differences were observed in Lower Extremity Function – Mobility between patients who reported worsening at six months with those who reported improving in this domain, and those that stayed the same (F=6.11, p<.01). Similarly, significant differences were observed in Upper Extremity Function - Fine Motor, ADL (F=6.83, p<.01) and Sleep Disturbance (F=4.08, p<.05) between patients who reported worsening at six months, those who reported staying the same, and those that improved in this domain. Social/Family Well-Being: Of the three planned comparisons [Ability to Participate in Social Roles and Activities, Satisfaction with Social Roles and Activities, Stigma] all three were statistically significant in the predicted direction. Specifically, significant differences were observed in Ability to Participate in Social Roles and Activities (F=3.76, p<.05) and Stigma (F=5.55, p<.01) between each of the three change groups (improved, no change, declined). Similarly, significant differences were observed in Satisfaction with Social Roles and Activities (F=5.86, p<.01) between patients who reported worsening at six months, those who reported staying the same, and those that improved in this domain. Emotional Well-Being: Of the five planned comparisons [Depression, Anxiety, Emotional and Behavioral Dyscontrol, Stigma, Positive Affect and Well-being] four were statistically significant, all in the predicted direction. Specifically, statistically significant differences were observed between patients who reported worse Anxiety at six months with those who reported the same levels, and those that reported less anxiety in this domain (F=3.42; p<.05). Similarly, significant differences were observed in Depression (F=13.53, p<.01), Stigma (F=7.40, p<.01) and Positive Affect and Well-being (F=6.35, p<.01) between patients who reported worsening at six months, those who reported staying the same, and those that improved in this domain. Cognitive Well-Being: One planned comparison [Cognitive Function] was not significant and did not trend toward significance. T-tests were used to examine differences between those that reported improved cognitive function compared to those that reported diminished cognitive function or no change. These groupings were used due to a small sample size (n=7) in the group reporting decline in cognitive function. Symptomatic Well-Being: Of the five planned comparisons [Fatigue, Sleep Disturbance, Emotional and Behavioral Dyscontrol, Depression, Anxiety] one was statistically significant in the predicted direction. Specifically, differences were observed in Sleep Disturbance at six months between patients who reported worsening, staying the same and improving in this domain (F=3.49; p<.05). Overall Quality of Life: Of the thirteen planned comparisons [all Neuro-QoL short forms] one exhibited a trend toward significance, and four were statistically significant, all in the predicted direction. Specifically, a trend toward statistical significance was observed between patients who reported change in Positive Affect and Well-being and those that reported change in overall quality of life(F=2.98, p=.06). In addition, statistically significant differences were observed between patients who reported worse Sleep Disturbance (F=5.45, p<.01), Depression (F=8.28, p<.01), Stigma (F=4.75, p<.05), and Lower Extremity Function – Mobility (F=4.02, p<.05) at six months with those who reported staying the same or improving in these domains.
21

Conclusions The validity of the Neuro-QoL measures for adults with stroke is supported with satisfactory internal
consistency, test-retest reliability and significant correlations with many external validity measures. All Neuro-QoL short forms except Cognitive Function were responsive to self-reported change in
conceptually-related aspects of well-being.
22

Amytrophic Lateral Sclerosis (ALS)
Disease-specific measures Amyotrophic Lateral Sclerosis Assessment Scale (ALSAQ31-33) The ALSAQ is comprised of 40 items across 5 subscales tapping the major domains affected by ALS. The subscales include physical mobility, activities of daily living, eating and drinking, communication and emotional functioning. All 40 items can also be summed together to obtain a total score for ALS QOL. Recently, the scale authors published data on the score differences that might be considered to meaningfully differentiate between subgroups or within groups of subjects over time.34 This makes the ALSAQ particularly valuable for evaluating the convergent validity and responsiveness of the Neuro-QoL item banks. Amyotrophic Lateral Sclerosis Functional Rating Scale-Revised (ALSFRS-R 35). The original scale, the ALSFRS, has 10 items that assess activities of daily living, such as speech, swallowing, handwriting, and dressing and hygiene that are specifically affected by the disease. In 1999, three additional items were added to better assess respiratory function. Both the original and revised versions have been used successfully as clinical trial outcome measures.36 Because of the importance of respiratory problems in the ALS population, we administered the 12-item ALSFRS-R. Results Sample characteristics: Participants (N=80) were primarily male (65%), white (94%), and non-Hispanic (98%) with average age=59 years (SD=12.3). Seventy-six percent were married, 46% had a college or advanced degree. Thirty-six percent were retired, 38% on disability, 17% were employed full- and 8% were employed part time. Average time since diagnosis was 2.0 years (SD=3.6). The mean ALSFRS-R score = 32.0 (SD=8.6) with range = 8-48. Mean T-Scores and standard deviations on the short forms are shown in Table 10. ALS patients reported significantly worse physical and social function compared to a general population reference group but similar cognitive function and more positive affect. When compared to a clinical neurological reference group, they showed greater stigma, less sleep disturbance, fatigue, depression, and emotional and behavioral dyscontrol and similar anxiety. Reliability: Internal consistency and 1 week test-retest reliability of the short forms is shown in Table 10. Cronbach’s alphas range from .79 to .96 and ICCs from .48 to .92.
23

Table 10. Descriptive and reliability statistics for Neuro-QoL short form T-scores Neuro-QoL Short Form Nitems Nsubjects M GPT MCT SD α T-R ICCs**
Positive Affect & Well Being* 9 76 54.0 7.7 .94 .66
Cognitive Function* 8 77 58.33 6.7 .80 .66
Lower Extremity Function (Mobility)* 8 57 37.6 9.9 .93 .84
Upper Extremity Function (Fine Motor, ADL)* 8 77 30.8 11.6 .96 .92
Ability to Participate in Social Roles and Activities* 8 77 42.6 7.1 .89 .48
Satisfaction with Social Roles and Activities* 8 77 42.4 5.0 .86 .59
Depression 8 77 46.6 6.4 .92 .55
Anxiety 8 77 51.5 5.4 .88 .60
Stigma 8 76 53.0 4.9 .86 .71
Fatigue 8 77 47.3 8.2 .93 .80
Sleep Disturbance 8 77 46.7 7.9 .79 .77
Emotional and Behavioral Dyscontrol 8 75 45.8 8.2 .89 .72 *For these banks, a high score indicates better function; for all other banks a high score indicates worse function **Time 1 (baseline) vs. Time 2 (7 days), single measures ICC M GPT – Mean General Population T-Score; MCT- Mean Clinical T-Score
24

Validity: Table 11 shows Spearman rho correlations between Neuro-QoL short form T-scores and ALS specific measures. Table 12 presents Spearman rho correlations between Neuro-QoL short form T-Scores and cross-disease measures. Table 11. Correlations for Neuro-QoL short form T-scores with ALS-specific measures
*p < .05; **p < .01; ***p < .001
ALSAQ ALSFRS-R
Symbol Digit Modalities
ADL
Communica-
tion
Emotional
functioning
Eating & drinking
Physical Mobility
Total
Bulbar
Fine
Motor
Gross Motor
Respiratory
Depression -.01 .03 .04 .76*** .04 .23 .21 .09 .13 .18 .15 Anxiety .08 .14 -.04 .53*** .04 .24 .09 .04 -.02 .02 .21 Stigma .03 .20 .42*** .55*** .38** .10 -.15 -.33** -.18 .03 .07 Positive Affect & Well-being .11 0.0 .04 -.66*** .05 -.18 -.21 -.11 -.22 -.12 .04 Cognitive Function .55*** -.12 -.15 -.30* -.23 .03 -.06 .09 -.07 -.19 -.05 Lower Extremity Function - Mobility .05 -.67*** -.05 -.34 0.0 -.65*** .33 -.04 .34 .66*** .07 Upper Extremity Function - Fine motor, ADL .15 -.88*** -.21 -.14 -.25 -.43*** .66*** .24 .79*** .54*** .13 Ability to participate in social roles & activities .10 -.55*** -.19 -.44*** -.09 -.41*** .30* .07 .28 .31* .13 Satisfaction with social roles & activities .16 -.43*** -.18 -.50*** -.07 -.52*** .24 .07 .21 .30* .13 Fatigue 0.0 .06 .13 .49*** .16 .06 .10 -.03 .11 .15 .01 Sleep Disturbance -.24 .12 .14 .35* .24 0.0 .03 -.11 .04 .21 .04 Emotional & Behavioral Dyscontrol .01 .23 -.06 .34* -.11 .37** -.03 .03 -.12 .10 0.13 Sleep Disturbance -.24 .12 .14 .35* .24 0.0 .03 -.11 .04 .21 .04 Emotional & Behavioral Dyscontrol .01 .23 -.06 .34* -.11 .37** -.03 .03 -.12 .10 0.13
25
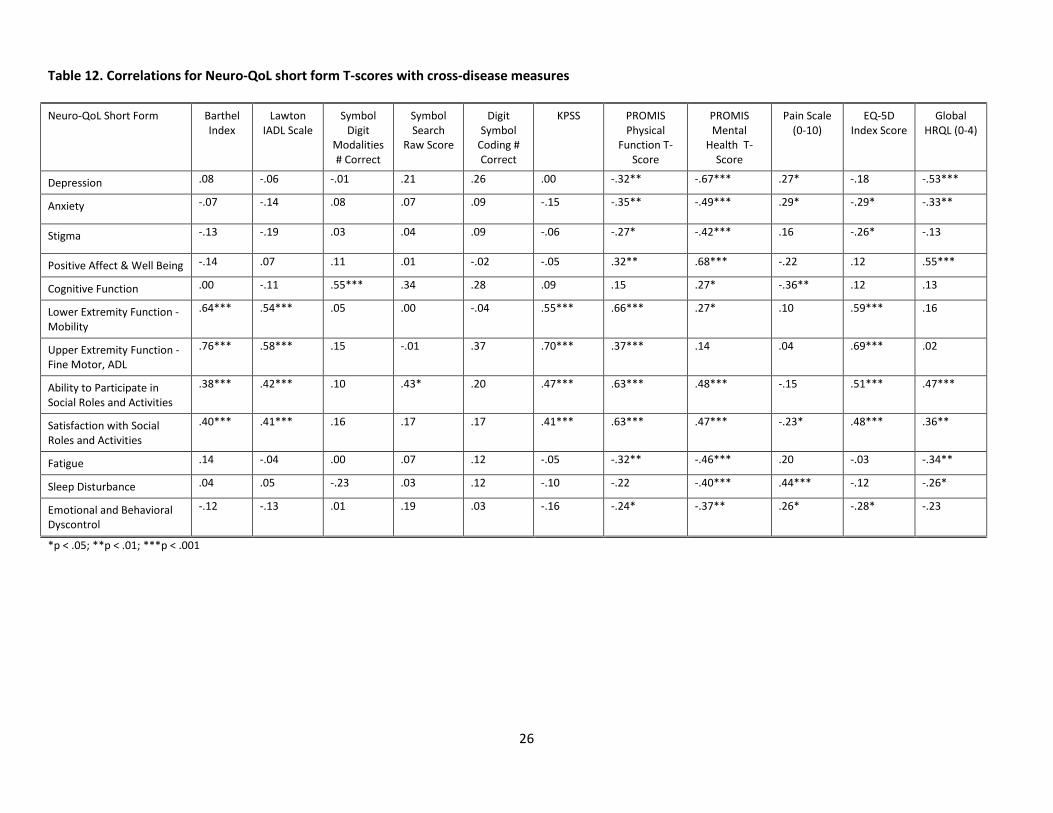
Table 12. Correlations for Neuro-QoL short form T-scores with cross-disease measures Neuro-QoL Short Form Barthel
Index Lawton
IADL Scale Symbol
Digit Modalities # Correct
Symbol Search
Raw Score
Digit Symbol
Coding # Correct
KPSS PROMIS Physical
Function T- Score
PROMIS Mental
Health T-Score
Pain Scale (0-10)
EQ-5D Index Score
Global HRQL (0-4)
Depression .08 -.06 -.01 .21 .26 .00 -.32** -.67*** .27* -.18 -.53***
Anxiety -.07 -.14 .08 .07 .09 -.15 -.35** -.49*** .29* -.29* -.33**
Stigma -.13 -.19 .03 .04 .09 -.06 -.27* -.42*** .16 -.26* -.13
Positive Affect & Well Being -.14 .07 .11 .01 -.02 -.05 .32** .68*** -.22 .12 .55***
Cognitive Function .00 -.11 .55*** .34 .28 .09 .15 .27* -.36** .12 .13
Lower Extremity Function - Mobility
.64*** .54*** .05 .00 -.04 .55*** .66*** .27* .10 .59*** .16
Upper Extremity Function - Fine Motor, ADL
.76*** .58*** .15 -.01 .37 .70*** .37*** .14 .04 .69*** .02
Ability to Participate in Social Roles and Activities
.38*** .42*** .10 .43* .20 .47*** .63*** .48*** -.15 .51*** .47***
Satisfaction with Social Roles and Activities
.40*** .41*** .16 .17 .17 .41*** .63*** .47*** -.23* .48*** .36**
Fatigue .14 -.04 .00 .07 .12 -.05 -.32** -.46*** .20 -.03 -.34**
Sleep Disturbance .04 .05 -.23 .03 .12 -.10 -.22 -.40*** .44*** -.12 -.26*
Emotional and Behavioral Dyscontrol
-.12 -.13 .01 .19 .03 -.16 -.24* -.37** .26* -.28* -.23
*p < .05; **p < .01; ***p < .001
26

Known groups validity: In the baseline assessment, the extent to which ALS patients agreed with the statement "I am content with my quality of life right now" was significantly associated with the following Neuro-QoL short forms: Depression, Anxiety, Positive psychological functioning, Social role - participation, Social role - satisfaction, and Fatigue. The corresponding effect sizes ranged from .22 to 2.86. Responsiveness: Of the 31 planned comparisons, 4 were statistically significant and 1 exhibited a trend toward significance, all in the predicted direction.
Physical Well-being: Of the four planned comparisons, one was significant. Specifically, patients who reported a worsening of their physical well-being showed significantly worse Upper Extremity Function scores than those who reported no change (t=-2.17; p<.05).
Social/Family Well-being: Of the three planned comparisons, one was significant. Specifically, patients who reported decreased social/family well-being showed a greater decline in satisfaction with social roles and activities than those who reported no change or improvement in social/family well-being (t=-2.29; p<.05). . Emotional Well-being: Of the five planned comparisons, one was significant. Patients who reported decreasing emotional well-being showed increased scores on the Depression Short Form (F=3.30; p<.05). Cognitive Well-being: The number of participants reporting change in cognitive well-being was not conducive to responsiveness analysis using ANOVA or T-test. 5 participants reported decline in cognitive well-being, and 3 reported increased well-being, thus categories could not be collapsed to create 2 categories with n of at least 10 participants. Symptomatic Well-being: Of the five planned comparisons, none were significant. Overall Quality of Life: Of the thirteen planned comparisons, one was significant and one approached significance. Specifically, patients who reported a decrease in overall quality of life also showed significant worsening of upper extremity function (t=-3.17; p<.01) and a trend toward increasing fatigue (t=-1.68; p<.10). Conclusions:
• The study sample represented a wide range of functioning, similar to an ALS clinic population • Internal consistency was high for 11, and adequate for 2, of the 13 Neuro-QoL scales • The Intraclass Correlation Coefficients (ICC) ranged from .48 (ability to participate in social roles and
activities) to .92 (upper extremity), suggesting that further evaluation of test-retest reliability is warranted in some cases.
• Convergent and discriminant validity appear to be excellent, with correlations of the expected strength and in the expected direction
• Several Neuro-QoL short forms (Upper Extremity Function, Cognitive Function, and Depression) demonstrated responsiveness to self-reported change. The remaining short forms did not.
27

Multiple Sclerosis (MS)
Disease-Specific Measures Functional Assessment of Multiple Sclerosis (FAMS). The FAMS was developed by Cella and Aaronson and includes 44 questions, divided into six subscales: mobility, symptoms, emotional well-being (depression), general contentment, thinking/fatigue, and family/social well-being. Fifteen un-scored questions are included because of their clinical value. Multiple Sclerosis Functional Composite Measure (MSFC). The MSFC was developed as an outcome measure by the National MS Society’s Clinical Outcomes Assessment Task Force to address the poor reliability and sensitivity of available MS rating scales.37 The MSFC consists of three objective quantitative tests of neurological functioning: arm, leg and cognitive function. Arm function is assessed with the nine-hole peg test; leg function with the timed 25-foot walk, and cognitive function with the Paced Auditory Serial Addition Test (PASAT) (being substituted with Oral Symbol Digit test for this study). The MSFC correlates with MRI parameters,38-40 measures of disability,41-43 and has predictive validity.42,44,45 MSFC scores are sensitive to change.37,46. It demonstrates excellent intra-rater (ICC =.97) and inter-rater (ICC =0.95 - 0.96) reliability42,47 for technicians trained with standardized procedures. Scores on the three MSFC components are transformed into Z scores, and then combined into a total MSFC Z score, providing a continuous scale of measurement. The MS Performance Scales is a medical professional reported measure of MS-related disability. The Performance Scales measure disability in eight domains of function: mobility, hand function, vision, fatigue, cognition, bladder/bowel, sensory, and spasticity. The construct and criterion validity of the subscales of the Performance Scales has been established.48 Results Sample characteristics. Participants (N=161) were primarily female (86%), white (88%), and non-Hispanic (93%) with average age=49.8 years (SD=10.5 ). 58.4% were married, 90% had some college or a college degree. Thirty-seven percent were on disability and 34% were employed full time. MSFC scores ranged from -2.90 to 1.7, with mean=0.0 (SD=.69). Mean MS Performance Scale score = 16.04 (SD=9.18; range = 0-35). Mean T-Scores and standard deviations on the short forms are shown in Table 13. MS patients reported worse physical, social and cognitive function compared to a general population reference group but greater positive affect. When compared to a clinical neurological reference group, they showed less depression and better emotional and behavioral control but similar levels of stigma, sleep disturbance, fatigue and anxiety. Reliability: Internal consistency and 1 week test-retest reliability of the short forms is shown in Table 13. Cronbach’s alphas range from .81 to .95 and ICCs from .72 to .91.
28
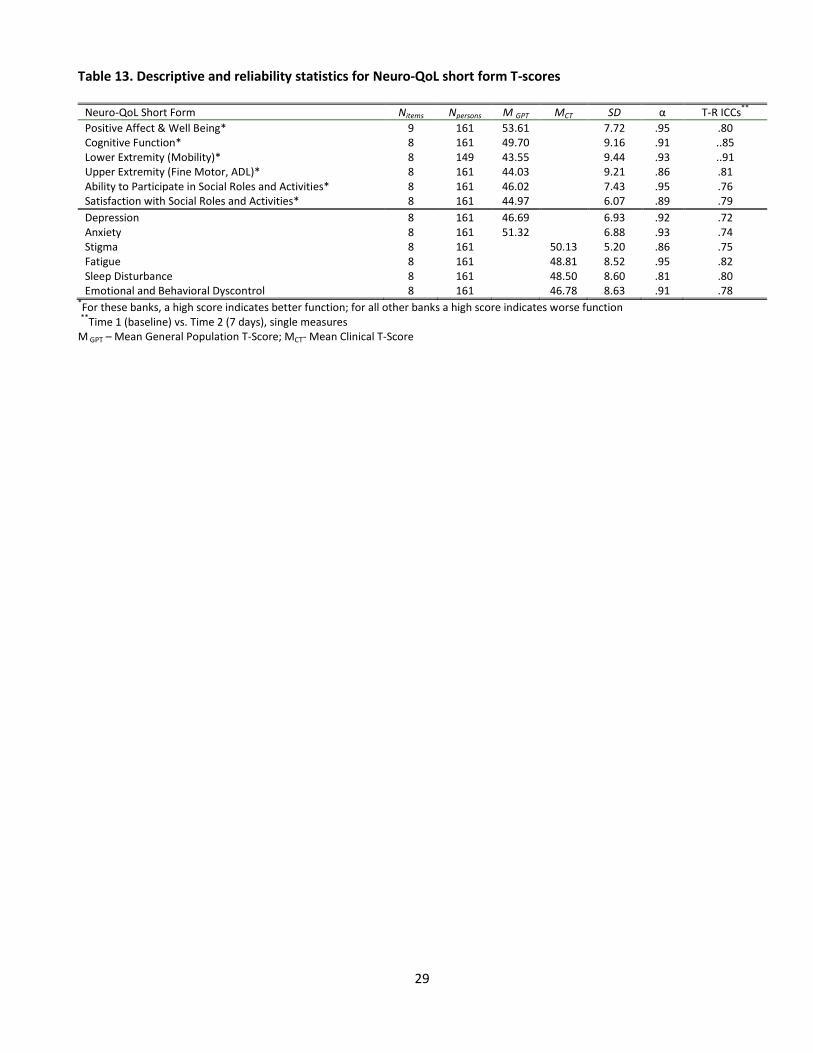
Table 13. Descriptive and reliability statistics for Neuro-QoL short form T-scores
*For these banks, a high score indicates better function; for all other banks a high score indicates worse function **Time 1 (baseline) vs. Time 2 (7 days), single measures M GPT – Mean General Population T-Score; MCT- Mean Clinical T-Score
Neuro-QoL Short Form Nitems Npersons M GPT MCT SD α T-R ICCs** Positive Affect & Well Being* 9 161 53.61 7.72 .95 .80 Cognitive Function* 8 161 49.70 9.16 .91 ..85 Lower Extremity (Mobility)* 8 149 43.55 9.44 .93 ..91 Upper Extremity (Fine Motor, ADL)* 8 161 44.03 9.21 .86 .81 Ability to Participate in Social Roles and Activities* 8 161 46.02 7.43 .95 .76 Satisfaction with Social Roles and Activities* 8 161 44.97 6.07 .89 .79 Depression 8 161 46.69 6.93 .92 .72 Anxiety 8 161 51.32 6.88 .93 .74 Stigma 8 161 50.13 5.20 .86 .75 Fatigue 8 161 48.81 8.52 .95 .82 Sleep Disturbance 8 161 48.50 8.60 .81 .80 Emotional and Behavioral Dyscontrol 8 161 46.78 8.63 .91 .78
29

Validity: Table 14 shows Spearman rho correlations between Neuro-QoL short form T-scores and MS specific measures. Table 15 presents Spearman rho correlations between Neuro-QoL short form T-Scores and cross-disease measures. Table 14. Correlations for Neuro-QoL short form T-scores with MS-specific measures
*p < .05; **p < .01; ***p < .001
Neuro-QoL Short Form FAMS FAMS Mobility
FAMS Symptoms
FAMS Emotional
Well-Being
FAMS General
Contentment
FAMS Thinking
and Fatigue
FAMS Family/Social
Well-Being
FAMS Additional Concerns
MS Functional Composite
The MS Performance
Scales
Depression -.71*** -.41*** -.48*** -.76*** -.72*** -.57*** -.58*** -.63*** -.15 .48*** Anxiety -.60*** -.28*** -.43*** -.62*** -.57*** -.60*** -.49*** -.58*** -.09 .32*** Stigma -.76*** -.71*** -.44*** -.69*** -.66*** -.55*** -.60*** -.60*** -.39*** .67*** Positive Affect & Well Being
.77*** .50*** .45*** .78*** .86*** .58*** .60*** .67*** .16* -.50***
Cognitive Function .66*** .39*** .51*** .40*** .48*** .79*** .52*** .56*** .24** -.61*** Lower Extremity Function - Mobility
.59*** .86*** .46*** .44*** .41*** .35*** .23*** .46*** .55*** -.75***
Upper Extremity Function -Fine Motor, ADL
.58*** .66*** .42*** .45*** .44*** .45*** .30*** .46*** .59*** -.73***
Ability to Participate in Social Roles and Activities
.81*** .71*** .57*** .67*** .73*** .66*** .54*** .65*** .24** -.68***
Satisfaction with Social Roles and Activities
.83*** .72*** .55*** .72*** .72*** .66*** .58*** .63*** .32*** -.71***
Fatigue -.81*** -.52*** -.67*** -.63*** -.67*** -.84*** -.58*** -.64*** -.17* .63*** Sleep Disturbance -.67*** -.32*** -.56*** -.60*** -.62*** -.69*** -.53*** -.62*** -.03 .44*** Emotional and Behavioral Dyscontrol
-.60*** -.32*** -.45*** -.51*** -.47*** -.65*** -.52*** -.61*** -.21** .44***
30

Table 15. Correlations for Neuro-QoL short form T-scores with cross-disease measures
*p = .05; **p = .01; ***p = .001
Neuro-QoL Short Form
Barthel Index
Karnofsky Performance
Scale
Lawton IADL Scale
Symbol Digit
Modalities # Correct
Symbol Search
Raw Score
Digit Symbol
Coding # Correct
PROMIS Physical Function T- Score
PROMIS Mental Health T-Score
Pain Scale (0-10)
EQ-5D Index Score
Global HRQL (0-4)
Depression -.23** -.28*** -.27*** -.05 -.10 -.20* -.54*** -.75*** .42*** -.46*** -.66*** Anxiety -.07 -.15 -.20* -.05 -.04 -.10 -.46*** -.69*** .35*** -.40*** -.52*** Stigma -.45*** -.59*** -.43*** -.18* -.23** -.30*** -.64*** -.59*** .43*** -.56*** -.54*** Positive Affect & Well Being
.22** .28*** .27*** .01 .05 .12 .61*** .81*** -.40*** .48*** .81***
Cognitive Function .20** .25** .31*** .26*** .15 .26*** .53*** .58*** -.40*** .51*** .42*** Lower Extremity Function - Mobility
.68*** .80*** .42*** .25** .38*** .50*** .65*** .31*** -.49*** .65*** .35***
Upper Extremity Function - Fine Motor, ADL
.59*** .62*** .51*** .33*** .40*** .53*** .65*** .42*** -.43*** .60*** .36***
Ability to Participate in Social Roles and Activities
.41*** .45*** .39*** .09 .14 .24** .77*** .69*** -.49*** .59*** .71***
Satisfaction with Social Roles and Activities
.47*** .51*** .41*** .13 .17* .28*** .73*** .68*** -.50*** .62*** .68***
Fatigue -.23** -.28*** -.30*** -.05 -.05 -.12 -.72*** -.69*** .46*** -.52*** -.62*** Sleep Disturbance -.14 -.19* -.16* -.01 -.04 -.08 -.59*** -.69*** .44*** -.44*** -.57*** Emotional and Behavioral Dyscontrol
-.16* -.27*** -.27*** -.11 -.06 -.11 -.47*** -.62*** .35*** -.41*** -.44***
31
Known groups validity: Patients grouped according to MSFC quartile scored significantly differently on all Neuro-QoL SFs, except Anxiety, Depression, and Emotional & Behavioral Dyscontrol, with effect sizes ranging from .47 to 2.15. Responsiveness: Of the 31 planned comparisons, 18 were statistically significant and 3 exhibited a trend toward significance, in the predicted direction.
Physical Well-being: Of the four planned comparisons, one was significant and one exhibited a trend toward significance, both in the predicted direction. Specifically, patients who reported a worsening of their physical well-being showed worsening of scores on Physical Function – Lower Extremity (extended assessment; F=4.36; p<.05) and a trend toward worse fatigue (F=2.36; p<.10).
Social/Family Well-being: Of the three planned comparisons, one was significant. Specifically, patients who reported improved social/family well-being at 6 months also reported decreasing stigma (F=3.98, p<.05). Emotional Well-being: Of the five planned comparisons, all were significant. Patients who reported worsening emotional well-being also reported increased depression (F=14.82; p<.0001), anxiety (F=7.28; p<.01), stigma (F=3.36; p<.05) and emotional and behavioral dyscontrol (F=3.19; p<.05) and decreased positive affect and well-being. Cognitive Well-being: The one planned comparison was significant and in the predicted direction. Patients who reported worsening cognitive well-being showed worsening cognitive function (F=8.54; p<.001). Symptomatic Well-being: Of the five planned comparisons, three were significant. Patients who reported worsened symptomatic well-being showed worsening on the Depression Short Form (F=5.02; p<.01). Patients who reported improved symptomatic well-being showed decreased fatigue (F=6.45; p<.01) and improved emotional and behavioral control (F=3.14; p<.05). Overall Quality of Life: Of the twelve planned comparisons, seven were significant and one showed a trend toward significance. Patients who reported decreased overall quality of life also showed worsening depression (F=8.99; p<.001), anxiety (F=5.57; p<.05), stigma (F=4.05; p<.05), positive affect (F=13.10; p<.00001) ability to participate in social roles and activities (F=3.91; p<.05), fatigue (F=3.12; p<.05), emotional and behavioral dyscontrol (F=3.39; p<.05) and a trend toward decreased upper extremity function (F=2.51; p<.10). Conclusions
• The study sample was generally representative of MS clinic populations • The 12 Neuro-QoL scales demonstrated high internal consistency • The Intraclass Correlation Coefficients (ICC) were acceptable, ranging from .72 (depression) to .91 (lower
extremity) • Convergent validity with generic and legacy measures was good; correlations were of the expected
strength and direction and short forms discriminated between patients grouped according to disease severity.
• There is some initial evidence for Neuro-QoL short form responsiveness to self-reported change in MS patients, particularly for the short forms assessing emotional and cognitive well-being, where all planned comparisons were significant.
32

Parkinson’s Disease
Disease-specific measures Montreal Cognitive Assessment (MoCA). 49 Designed as a rapid screening instrument for mild cognitive dysfunction, it assesses different cognitive domains: attention and concentration, executive functions, memory, language, visuoconstructional skills, conceptual thinking, calculations, and orientation. Scores range from 0-31, with scores below 26 considered abnormal. Parkinson’s disease Questionnaire-39 (PDQ-39). 50,51 The thirty nine items of this self-report measure assess eight dimensions: mobility, activities of daily living, emotional well-being, bodily discomfort, stigma, social support cognition and communication. Scale and summary scores are available, ranging from 0-100, with higher scores indicating greater problems. Unified Parkinson’s Disease Rating Scale (UPDRS).52 The UPDRS is the most widely used measure of disability and impairment associated with PD. It is a composite scale consisting of 4 parts: Mentation, Behavior and Mood (UPDRS mental score); ADLs (UPDRS ADL score), Motor Function (motor score); and Complications of therapy. The first 3 subscales are quantitative five point scales (0-4). The complications of therapy is a yes/no scale. For this study, UPDRS Motor Function scoring was modified as follows: only the most affected side or body part was rated. All ratings were made by physicians or other medical personnel. Hoehn and Yahr staging.53 The Hoehn and Yahr staging consists of 5 disease severity categories ranging from 0.0 (no signs of disease) to 5.0 (wheelchair bound or bedridden unless aided). The staging was obtained through chart review or through direct contact with the patient’s physician or other medical personnel. Patient Health Questionnaire-9 (PHQ-9). 54 This is a 9-item subset of the PHQ, and assesses self-reported depression. The nine items of the PHQ-9 come directly from the nine DSM-IV signs and symptoms of major depression. Results Sample characteristics: Participants were primarily male (62%), white (95%), and non-Hispanic (97%) with average age=65. Seventy-four percent were married, 55% had a college or advanced degree. Fifty-eight percent were retired and 20% were employed either full or part time. Most (76%) were in mild stages of the disease: Hoehn and Yahr 1 (N=19; 16%), 2 (N=72; 60%), 3 (N=23; 19%), 4 (N=6; 5%). Average time since PD diagnosis was 7.1 years. 80% were taking L-Dopa either alone or in combination with other anti-PD medications and 9% reported undergoing prior PD surgery. A majority of patients (55%) were primarily affected on their right side; most experienced no (43%) or little (33%) activity limitation due to motor fluctuations. Mean T-Scores and standard deviations on the Neuro-QoL short forms are shown in Table 16. PD patients reported worse cognitive, physical and social function compared to a general population reference group but more positive affect and well-being. When compared to a clinical neurological population, they showed less sleep disturbance, fatigue and depression and a greater sense of emotional and behavioral control. Reliability: Internal consistency and 1 week test-retest reliability of the short forms is shown in Table 16. Cronbach’s alphas range from .81 to .94 and ICCs from .6880 to .80.
33

Table 16. Descriptive and reliability statistics for Neuro-QoL short form T-scores
*For these banks, a high score indicates better function; for all other banks a high score indicates worse function **Time 1 (baseline) vs. Time 2 (7 days); M GPT – Mean General Population T-Score; MCT- Mean Clinical T-Score
Neuro-QoL Short Form Nitems Npersons MGPT MCT SD α T-R ICCs** Positive Affect & Well Being* 9 120 54.40 7.53 .94 ..76 Cognitive Function* 8 120 50.46 7.25 .85 .78 Lower Extremity Function (Mobility)* 8 118 45.80 7.54 .85 .78 Upper Extremity Function (Fine Motor, ADL)* 8 120 42.28 8.34 .81 .72 Ability to Participate in Social Roles and Activities* 8 120 47.85 6.83 .94 .71 Satisfaction with Social Roles and Activities* 8 119 46.21 5.70 .89 .67 Depression 8 119 45.85 6.86 .91 .68 Anxiety 8 120 50.82 6.80 .91 .77 Stigma 8 120 49.29 4.65 .85 .80 Fatigue 8 119 46.04 7.75 .93 .78 Sleep Disturbance 8 120 47.70 7.98 .81 .79 Emotional and Behavioral Dyscontrol 8 120 43.49 8.36 .90 .73
34

Validity: Spearman rho correlations between the Neuro-QoL short forms and the PD-specific measures are shown in Table 17 and between the Neuro-QoL short forms and the cross-disease instruments in Table 18 Table 17. Correlations for Neuro-QoL short form T-scores with PD-specific measures
PDQ-39 UPDRS****
Neuro-QoL Short Form Mobility ADL EWB Stigma Social support
CI Comm BD Total Part 1 Part 2 Part 3 MoCA Total
PHQ-9 Total
Positive Affect & Well Being -.48*** -.36*** -.56*** -.17 -.45*** -.41*** -.44*** -.18 -.29*** -.30*** -.27** -.07 .17 -.50*** Cognitive Function
-.39*** -.40*** -.29** -.19* -.41*** -.56*** -.48*** -.25** -.23* -.29*** -.23** -.24** .31*** -.35*** Lower Extremity Function - Mobility -.72*** -.61*** -.36*** -.23* -.32*** -.38*** -.41*** -.38*** -.58*** -.22* -.59*** -.14 .04 -.33*** Upper Extremity Function-Fine Motor, ADL
-.46*** -.76*** -.37*** -.35*** -.40*** -.42*** -.41*** -.24** -.34*** -.14 -.44*** -.11 .09 -.27** Ability to Participate in Social Roles and Activities
-.69*** -.46*** -.43*** -.24** -.44*** -.43*** -.55*** -.36*** -.37*** -.37*** -.41*** -.13 .21* -.50*** Satisfaction with Social Roles and Activities
-.62*** -.48*** -.51*** -.29*** -.52*** -.38*** -.50*** -.31*** -.39*** -.30*** -.46*** -.23* .25** -.55*** Depression
.38*** .36*** .68*** .19* .36*** .33*** .35*** .18 .21* .32*** .21* .02 -.13 .47*** Anxiety
.39*** .40*** .70*** .38*** .28** .41*** .30*** .24** .22* .35*** .20* .03 -.06 .42*** Stigma
.49*** .46*** .51*** .52*** .44*** .34*** .45*** .40*** .19* .18 .28** .18 -.20* .46*** Fatigue
.67*** .47*** .56*** .36*** .39*** .53*** .54*** .54*** .35*** .28** .39*** .20* -.17 .63*** Sleep Disturbance
.47*** .47*** .47*** .39*** .35*** .54*** .46*** .46*** .24** .31*** .32*** .21* -.14 .54*** Emotional & Behav’l Dyscontrol .35*** .45*** .49*** .27** .46*** .40*** .33*** .20* .12 .22* .18* .05 -.17 .33***
*p = .05; **p = .01; ***p = .001; **** Non-standard scoring was used for UPDRS Part 3; EWB=Emotional Well-being; CI=Cognitive Impairment; Comm=Communication
35

Table 18. Correlations for Neuro-QoL short form T-scores with cross-disease measures
*p ≤ .05; **p ≤ .01; ***p ≤ .001
Neuro-QoL Short Form
Barthel Index
Lawton IADL Scale
Oral Symbol Digit
Modalities # Correct
Symbol Search
Raw Score
Digit Symbol Coding # Correct
PROMIS Global
Physical
PROMIS Global Mental
EQ-5D Index Score
Global HRQL (0-4)
Positive Affect & Well Being .24** .17 .16 .20* .13 .45*** .74*** .41*** .64*** Cognitive Function .32*** .18* .30*** .22* .22* .34*** .46*** .19* .27** Lower Extremity (Mobility) .51*** .07 .10 .02 .05 .55*** .35*** .57*** .23* Upper Extremity (Fine Motor, ADL) .46*** .27** .11 .03 .02 .39*** .37*** .41*** .29*** Ability to Participate in Social Roles and Activities .26** .11 .20* .23* .16 .55*** .64*** .44*** .52*** Satisfaction with Social Roles and Activities .31*** .18 .15 .19 .17 .46*** .64*** .45*** .53*** Depression -.30*** -.12 -.16 -.09 .001 -.36*** -.65*** -.41*** -.54*** Anxiety -.37*** -.12 -.12 -.06 -.01 -.45*** -.61*** -.42*** -.45*** Stigma -.33*** -.14 -.02 -.03 -.51*** -.42*** -.51*** -.38*** -.43*** Fatigue -.35*** .02 -.06 -.08 -.005 -.62*** -.53*** -.44*** -.39*** Sleep Disturbance -.26** -.07 -.06 -.01 .01 -.48*** -.44*** -.32*** -.28** Emotional and Behavioral Dyscontrol -.28** -.12 -.11 -.004 .10 -.35*** -.38*** -.30*** -.27**
36

Known groups validity: Patients in H & Y Stage 1 or 2 scored significantly differently on all Neuro-QoL SFs, except Cognitive Function and Emotional & Behavioral Dyscontrol, than did patients in Stages 3 or 4, with effect sizes ranging from .5 to 1.11. Responsiveness: Of the 31 planned comparisons, 7 were statistically significant and 1 exhibited a trend toward significance, in the predicted direction.
Physical Well-being: Of the four planned comparisons, two were significant in the predicted direction. Specifically, patients who reported a worsening of their physical well-being showed worsening of scores on Fatigue (F=8.13; p<.01) and Lower Extremity Function (extended assessment; F=4.69; p< .05).
Cognitive Well-being: The one planned comparison was not significant. Emotional Well-being: Of the five planned comparisons, one showed a trend toward significance. Patients who reported changes in emotional well-being also exhibited a trend toward having changes in positive affect and well-being (F=2.58; p<.10). Social/Family Well-being: Of the three planned comparisons, none were significant. Symptomatic Well-being: Of the five planned comparisons, one was significant. Specifically, patients who reported worsening symptomatic well-being also demonstrated worsening scores on Fatigue (extended assessment; F=3.32; p<.05). Overall Quality of Life: Of the thirteen planned comparisons, four were significant. Patients who reported a worsening of overall quality of life showed decreasing positive affect and well-being (F=6.73; p<.01), ability to participate in social activities (F=4.04; p<.05), and upper extremity function (extended assessment, F=5.33; p<.01) and increasing fatigue (extended assessment, F=3.63; p<.05). Conclusions:
• The Neuro-QoL measures demonstrated high internal consistency. • Test-retest reliability was acceptable, but lower than expected for Depression and Satisfaction with Social
Roles and Activities. • Convergent validity was supported by correlations with generic and PD-specific measures in the expected
directions. Correlations were generally modest in strength, warranting additional validation in PD samples. Neuro-QoL measures showed good discrimination between patients at different levels of disease severity.
• There was only limited evidence for responsiveness to self-reported changes in different domains of well-being.
37

Adult Epilepsy
Disease-Specific Measures Quality of Life in Epilepsy-31(QOLIE-31). 55,56 The QOLIE-31 is an HRQL survey for adults (>18) with epilepsy. Derived from the QOLIE-89, this scale contains domains that include seizure worry, emotional wellbeing, energy/ fatigue, cognition, medication effects, social effects, health status and overall quality of life. Good psychometric evidence has been reported in previous studies. Liverpool Seizure Severity Scale (LSSS). The LSSS is a 12 item scale that assesses experiences during and immediately after a seizure such as loss of consciousness and post-ictal confusion. Each item is scored on a Likert scale, with higher scores indicating greater seizure severity. Reported test retest reliabilities range from 0.74 – 0.80. 57,58 A modified scoring system requires patients to rate only their most severe seizure and demonstrates adequate reliability, construct validity and responsiveness to change.59 Liverpool Adverse Events Profile (LAEP). 60The LAEP is a 19 item self-report scale that assesses the frequency of antiepileptic drug side effects. Using a 4-point Likert scale (1= never a Problem – 4=always a problem), scores are summed to create a total score (ranging from 19-76, higher scores indicating more symptoms). Results Sample characteristics. Participants were primarily male (51%), white (85%), and non-Hispanic (75%) with average age=47.3 (Range = 18-93). Forty-seven percent were married, 67% had some college or beyond. Fourteen percent were retired, 22% on disability and 37% were employed either full or part time. Average time since epilepsy diagnosis was 18.5 years (SD=13.9). Generalized seizures were most frequently experienced (57%) followed by focal seizures (25%). Mean number of seizures in the past 3 months = 10.7 (SD=37.6). 95% were taking medication for their seizure disorder, with 64% of those on polytherapy. Twelve percent had undergone surgery for their epilepsy. Mean T-Scores and standard deviations on the short forms are shown in Table 19. Epilepsy patients reported significantly worse cognitive and social function compared to a general population reference group but similar levels of physical function and greater positive affect and well-being. When compared to a clinical neurological population, they showed similar levels of stigma, greater anxiety, but less depression, sleep disturbance, fatigue, and sense of emotional and behavioral dyscontrol. Reliability: Internal consistency and 1 week test-retest reliability of the short forms is shown in Table 19. Cronbach’s alphas range from .86 to .95 and ICCs from .40 to .80.
38

Table 19. Descriptive and reliability statistics for Neuro-QoL short form T-scores Neuro-QoL Short Form Nitems Npersons M GPT MCT SD α T-R ICCs**
Positive Affect & Well Being* 9 118 53.8 8.2 0.95 0.70
Cognitive Function* 8 119 47.8 9.3 0.92 0.76
Lower Extremity Function -Mobility* 8 114 50.4 9.0 0.92 0.80
Upper Extremity Function -Fine Motor, ADL* 8 119 49.0 7.7 0.88 0.77
Ability to Participate in Social Roles and Activities* 8 119 45.3 7.2 0.94 0.40
Satisfaction with Social Roles and Activities* 8 119 45.9 6.5 0.89 0.57
Depression 8 118 47.9 8.3 0.95 0.71
Anxiety 8 118 52.3 8.1 0.93 0.72
Stigma 8 119 50.6 6.7 0.91 0.75
Fatigue 8 119 45.6 9.4 0.95 0.74
Sleep Disturbance 8 119 48.2 9.8 0.86 0.67 Emotional and Behavioral Dyscontrol 8 119 46.3 10.1 0.93 0.74 *For these banks, a high score indicates better function; for all other banks a high score indicates worse function **Time 1 (baseline) vs. Time 2 (7 days)
M GPT – Mean General Population T-Score; MCT- Mean Clinical T-Score
39

Validity: Spearman correlations between Neuro-QoL short forms and epilepsy-specific and cross-disease measures are shown in Tables 20 and 21. Table 20. Correlations for Neuro-QoL short form T-scores with epilepsy-specific measures
Neuro-QoL Short Form
QOLIE-31 Liverpool Seizure Severity Scale
Liverpool Adverse Events Profile Total Cognitive Energy/
Fatigue Emotional Well-Being
Medication Effects
Overall Quality of Life
Social Function
Seizure Worry
Positive Affect & Well Being .737 ** .522 ** .543 ** .671 ** .423 ** .617 ** .643 ** .520 ** -.361 ** -.563 **
Cognitive Function .657 ** .768 ** . 483 ** .423 ** .384 ** .447 ** .378 ** .355 ** -0.061 -.650 ** Lower Extremity Function - Mobility .330 ** .338 ** .280 ** 0.183 .213 * 0.168 .249 ** .212 * -0.198 -.393 **
Upper Extremity Function - Fine Motor, ADL
.334 ** .281 ** .271 ** .205 * 0.123 .210 * .299 ** .232 * -0.207 -.355 **
Ability to Participate in Social Roles and Activities
.646 ** .486 ** .466 ** .536 ** .419 ** .458 ** .599 ** .427 ** -.307 * -.523 **
Satisfaction with Social Roles and Activities
.544 ** .386 ** .472 ** .464 ** .316 ** .383 ** .487 ** .409 ** -0.22 -.340 **
Depression -.642 ** -.430 ** -.520 ** -.699 ** -.310 ** -.573 ** -.524 ** -.438 ** .386 ** .451 ** Anxiety -.617 ** -.421 ** -.526 ** -.690 ** -.352 ** -.453 ** -.476 ** -.550 ** .442 ** .482 ** Stigma -.577 ** -.361 ** -.419 ** -.504 ** -.359 ** -.419 ** -.570 ** -.497 ** .408 ** .481 ** Fatigue -.584 ** -.405 ** -.665 ** -.441 ** -.381 ** -.299 ** -.500 ** -.510 ** .487 ** .610 ** Sleep Disturbance -.528 ** -.413 ** -.460 ** -.421 ** -.367 ** -.329 ** -.428 ** -.471 ** .380 ** .634 ** Emotional and Behavioral Dyscontrol
-.579 ** -.479 ** -.453 ** -.539 ** -.342 ** -.386 ** -.483 ** -.393 ** .332 * .553 **
*p < .05; **p < .01
40

Table 21. Spearman's Rho Correlations for Neuro-QoL short form T-scores with cross-disease measures
Neuro-QoL Short Form Barthel Index
Lawton IADL Scale
Symbol Digit Modalities # Correct
Symbol Search Raw Score
Digit Symbol Coding # Correct
PROMIS Global Physical
PROMIS Global Mental
Pain Scale 0-10
EQ-5D Index Score
Global HRQL
Positive Affect & Well Being .185 * .186 * -0.088 -0.03 0.005 .480 ** .732 ** -.395 ** .486 ** .597 ** Cognitive Function .317 ** .241 ** -0.038 -0.060 0.089 .515 ** .520 ** -.341 ** .448 ** .329 ** Lower Extremity Function (Mobility) .527 ** .220 ** 0.150 0.126 0.169 .450 ** .283 ** -.330 ** .490 ** .215 * Upper Extremity Function (Fine Motor, ADL ) .597 ** .390 ** 0.157 0.094 .318 ** .494 ** .278 ** -.387 ** .515 ** 0.172 Ability to Participate in Social Roles and Activities .357 ** .223** 0.030 -0.001 0.107 .493 ** .617 ** -.359 ** .495 ** .462 ** Satisfaction with Social Roles and Activities .270 ** 0.025 0.020 0.049 0.116 .457 ** .530 ** -.313 ** .427 ** .568 ** Depression -0.020 -0.067 0.088 -0.041 -0.062 -.417 ** -.722 ** .290 ** -.407 ** -.641 ** Anxiety -0.055 -0.087 0.063 -0.057 -0.086 -.348 ** -.561 ** .245 ** -.335 ** -.503 ** Stigma -0.140 -.028 * 0.115 0.006 -0.065 -.371 ** -.530 ** .194 * -.351 ** -.380 ** Fatigue -0.160 -0.045 0.087 -0.004 -0.075 -.526 ** -.455 ** .261 ** -.357 ** -.283 ** Sleep Disturbance -0.120 -0.065 0.128 0.113 0.082 -.423 ** -.429 ** 0.172 -.337 ** -.247 ** Emotional and Behavioral Dyscontrol -0.175 -0.038 0.169 0.082 -0.010 -.298 ** -.498 ** 0.093 -.301 ** -.393 **
* =p< .05; ** = p< 0.01
41

Known groups validity: Statistically significant known group differences were observed between Leeds Seizure Severity Scale quartile groups and the following Neuro-QoL short forms: Anxiety (F=5.15, p<.01), Depression (F=5.71, p<.01), Emotional and Behavioral Dyscontrol (F=4.32, p<.01), Fatigue (F=9.08, p<.01), Positive Affect and Well-being (F=6.3, p<.01), Sleep Disturbance (F=3.36, p<.01), Stigma (F=4.65, p<.01) and Upper Extremity - Fine Motor, ADL (F=4.07, p<.01). Responsiveness: Of the 31 planned comparisons, seven were statistically significant and eight exhibited a trend toward significance, in the predicted direction. Physical Well-Being: Of the four planned comparisons [Lower Extremity Function-Mobility, Upper Extremity Function - Fine Motor, ADL, Fatigue, and Sleep Disturbance] two were statistically significant and one exhibited a trend toward significance, all in the predicted direction. Specifically, a trend toward significance was observed between patients who reported worse Physical Function – Lower Extremity at six months with those who reported better functioning (F=2.74; p=.069). Statistically significant differences were observed between patients who reported worsening at six months with those who reported staying the same or improving in both Fatigue (F=5.11; p<.01) and Sleep Disturbance (F=3.47, p<.05). Social/Family Well-Being. Of the three planned comparisons [Ability to Participate in Social Roles and Activities, Satisfaction with Social Roles and Activities, Stigma] one exhibited a trend toward significance, in the predicted direction. Specifically, a trend toward significance was observed between patients who reported worse Ability to Participate in Social Roles and Activities at six months with those who reported improvements in this domain (F=2.56; p=.082). Emotional Well-Being. Of the five planned comparisons [Depression, Anxiety, Emotional and Behavioral Dyscontrol, Stigma, Positive Affect and Well-being] two were statistically significant and two exhibited a trend toward significance, all in the predicted direction. Specifically, a trend toward significance was observed between patients who reported worse Anxiety (F=2.62; p=.077) and Emotional Behavioral Dyscontrol (F=3.05; p=.051) at six months with those who reported improvements in this domain. Statistically significant differences were observed between patients who reported change in Depression at six months with those who reported change in this domain (F=4.82; p<.01) and between patients who reported change in Positive Affect and Well-being with those who reported change in this domain (F= 7.21, p<.01). Cognitive Well-Being. The one planned comparison was not significant. Symptomatic Well-Being. Of the five planned comparisons [Fatigue, Sleep Disturbance, Emotional and Behavioral Dyscontrol, Depression, Anxiety] one was statistically significant in the predicted direction, and one exhibited a trend toward significance. Differences were observed between patients who reported change in Depression at six months with those who reported change in this domain (F=4.01; p<.05). Differences between those who reported change in fatigue as well as change in this domain trended toward significance (F=2.37; p=.099) Overall Quality of Life. Of the twelve planned comparisons [all Neuro-QoL short forms] two were statistically significant and four exhibited a trend toward significance, all in the predicted direction. A trend toward significance was observed between patients who reported change in their scores of Emotional and Behavioral Dyscontrol (F=2.90, p=.060), Anxiety (F=2.85, p=.062), Fatigue (F=2.71, p=.071), and Ability to Participate in Social Roles and Activities (F=2.70, p=.072). Statistically significant differences were observed between patients who reported change in Depression over time with those who reported change in this domain (F=3.62; p<.05). Significant differences were also observed between patients who reported change in Positive Affect and Well-being at six months compared to those who reported change in this domain (F=6.19, p<.01).
42

Conclusions:
• The 12 Neuro-QoL scales demonstrated high internal consistency, ranging from .86 (Sleep disturbance) to
.95 (Depression) • The Intraclass Correlation Coefficients (ICC) were generally acceptable, ranging from .40 (Ability to
Participate in Social Roles and Activities ) to .80 (Lower Extremity Function – Mobility) • Convergent and discriminant validity were good, with correlations of the expected strength and in the
expected direction. Neuro-QoL measures discriminated between patients at different levels of disease severity.
• There is initial evidence of responsiveness. Self-reported changes in physical, emotional and symptomatic well-being and overall quality of life were reflected in significant changes in conceptually-related Neuro-QoL short forms.
43

Pediatric Epilepsy
Sample characteristics. Participants (N=61) were primarily male (62.3%), white (75.9%), and non-Hispanic (75.4%) with average age=13.4 (SD=2.6; range = 10 to 18). At baseline, 17.8% reported having seizures daily, 13.3% weekly, 35.6% monthly and 33.3% yearly, and all patients were taking anti-epilepsy drugs at the time of testing. Mean T-Scores and standard deviations on the short forms are shown in Table 22. Pediatric epilepsy patients reported better function/less symptoms on all domains compared to the reference group. Reliability: Internal consistency and 1 week test-retest reliability of the self-report short forms is shown in Table 22. Cronbach’s alphas range from .44 to .86 and ICCs from .26 to .94. Table 22. Descriptive and reliability statistics for Neuro-QoL short form T-scores
Neuro-QoL Short Form Nitems Npersons MGPT MCT SD Alpha T-R**ICCs Social Relations – Interactions with Peers* 8 59 52.70 9.77 .62 .60 Cognitive Function* 8 61 48.42 7.25 .68 .76 Depression 8 59 45.16 7.13 .70 .71 Anxiety 8 58 49.02 7.58 .70 .49 Stigma 8 61 45.23 5.76 .44 .75 Fatigue 8 61 49.07 7.33 .50 .68 Pain 10 59 46.88 6.87 .64 .26 Lower Extremity Function –Mobility* 20 56 95.65*** 9.06 .77 .78 Upper Extremity Function -Fine Motor, ADL* 20 59 96.72*** 8.34 .86 .94 * For these banks, a high score indicates better function; for all other banks a high score indicates worse function **Time 1 (baseline) vs. Time 2 (7 days) *** These two scales were not calibrated using IRT due to skewed distributions. Possible scores range from 0 (unable to do) -100 (without difficulty). M GPT – Mean General Population T-Score; MCT- Mean Clinical T-Score
44

Validity: Spearman rho correlations between the Neuro-QoL short forms and the pediatric disease measures are shown in Table 23 and between the Neuro-QoL short forms and the cross-disease instruments in Table 24. Table 23. Correlations for Neuro-QoL short form T-scores with disease-specific measures
*p < .05; **p < .01; ***p < .001 MFS = Multidimensional Fatigue Scale
Neuro-QoL Short Form
PedsQL Core
PedsQL Emotional
Functioning
PedsQL Physical
Functioning
PedsQL Psychosocial
Health
PedsQL School
Functioning
PedsQL Social
Functioning
MFS MFS Cognitive Fatigue
MFS General Fatigue
MFS Sleep/Rest
Fatigue Depression -.70*** -.66*** -.36** -.68*** -.51*** -.49*** -.63*** -.59*** -.64*** -.47*** Anxiety -.60*** -.51*** -.19 -.55*** -.46*** -.37** -.47*** -.44*** -.49*** -.39** Stigma -.50*** -.41** -.14 -.57*** -.42** -.61*** -.34** -.40** -.36** -.14 Cognitive Function .53*** .40** .09 .53*** .53*** .37** .58*** .66*** .54*** .30* Lower Extremity Function - Mobility
-.46*** -.44*** -.21 -.45*** -.28* -.53*** -.40** -.38** -.45*** -.21
Upper Extremity Function - Fine Motor, ADL
-.41** -.25 -.18 -.38** -.30* -.46*** -.35** -.39** -.31* -.17
Fatigue -.28* -.30* -.07 -.33* -.31* -.16 -.42*** -.47*** -.42*** -.22 Pain -.48*** -.48*** -.25 -.46*** -.33* -.28* -.48*** -.43*** -.36** -.45*** Social Relations – Interactions with Peers
.49*** .38** .18 .43*** .22 .56*** .39** .26* .50*** .27*
45

Table 24. Correlations for Neuro-QoL short form T-scores with cross-disease measures
*p < .05; **p < .01; ***p < .001
Neuro-QoL Short Form Karnofsky Performance
Scale
Symbol Digit Modalities #
Correct
Symbol Search Raw
Score
Digit Symbol Coding # Correct
PROMIS Physical Function T-Score
PROMIS Mental Health
T-Score
Pain Scale (0-10)
EQ-5D Index Score
Global HRQL (0-
4)
Depression -.20 .08 -.10 .20 -.57*** -.71*** .23 -.32* -.43*** Anxiety -.16 .10 .01 .10 -.57*** -.60*** .19 -.33* -.40** Stigma -.25 .01 -.15 .14 -.28* -.34** .01 -.37** -.24 Cognitive Function .18 .19 .31* .09 .44*** .54*** -.24 .43*** .29* Lower Extremity Function - Mobility
-.27* .08 -.16 .17 -.36** -.32* .37** -.42** -.24
Upper Extremity Function - Fine Motor, ADL
-.30* -.17 -.45*** -.11 -.38** -.30* .38** -.55*** -.14
Fatigue -.10 .02 -.20 .11 -.326* -.34** .28* -.48*** -.37** Pain -.25 -.13 -.08 .00 -.44*** -.35** .57*** -.36** -.40** Social Relations – Interactions with Peers
.28* .13 .12 .09 .45*** .34** -.30* .27* .30*
46
Known groups validity: Patients with different seizure frequency (daily, weekly, monthly and yearly) scored significantly differently on Cognitive Function (F=3.84; p=0.016). The same groupings of seizure frequency yielded results approaching significance for the anxiety (F=2.57; p=0.068) and fatigue measures (F=2.56; p=0.068). Responsiveness: Similar to adult patients, we conducted responsiveness analyses on the Neuro-QoL banks using the Karnofsky Performance Status and the self-reported Global Rating of Change (GRC). Here we report the results from the GRC-based change. Beginning with the 7-level GRC (range: +3= very much better; 0 = about the same; -3 = very much worse), we collapsed the three “better” categories into one, and the three “worse” categories into one, leaving three categories (“better;” “about the same;” “worse”). These three categories were compared using one way analysis of variance followed by least significant difference testing of adjacent groups when the overall F statistic was significant. For each analysis, we required that at least 10 patients be represented in each of these three categories. If fewer than ten patients were represented in a category, it was collapsed with the adjacent category and the two remaining groups were compared using a t-test. For pediatric epilepsy, less than 10 patients reported decline in well-being for each GRC question, thus t-tests were used to compare those that declined or reported no change to those that improved. There were six GRC questions. Five of them queried patients specifically about change in Physical well-being, Cognitive well-being, Emotional well-being, Social/Family well-being, and Symptomatic Well-being (Disease-related Symptoms). The sixth GRC item asked about overall quality of life. The following indicates which of the 9 pediatric item bank change scores were compared across GRC categories: Physical well-being Physical Function (Upper extremity and Lower extremity); Fatigue; Pain Cognitive well-being: Cognitive Function Emotional well-being: Depression; Anxiety; Stigma; Social well-being: Social Relation- Interaction with peers; Stigma Symptoms: Fatigue; Depression; Anxiety; Pain Overall: ALL This resulted in 23 planned comparisons for each wave two clinical validation sample (no adjustment made for multiple comparisons). Of the 23 planned comparisons, none were statistically significant.
Conclusions:
• The current sample was generally high functioning. • The 9 Neuro-QoL measures demonstrated high internal consistency. The Intraclass Correlation Coefficients
(ICC) were acceptable, ranging from .26 (Pain) to .94 (Upper Extremity Function- Fine motor, ADL) • Convergent validity associations with generic and legacy measures were of the expected strength and
direction • Responsiveness was not as good as we expected. It is hypothesized that this was due to the high
functioning samples recruited in the testing with only a few patients reporting that they were getting worse at the 6-month follow-up. To test this hypothesis, we evaluated the responsiveness of the pedsQL generic (Emotional Functioning, Physical Functioning, Psychosocial Functioning, School Functioning, and Social Functioning). Among 30 possible comparisons, only two significant comparisons were identified: Psychosocial and Social Functioning for Global Rating of Change of the Symptom Well-Being. We therefore concluded that this sample had stable conditions over the study period and thus no significant responsiveness was detected in these analyses.
47

Muscular Dystrophies
Sample characteristics. Patients (N=51) were primarily male (84.3%), white (58.8%), and non-Hispanic (62.7%) with average age=16.3 (SD=3.4; range=10.1 to 21.9). Seventy-seven percent were full time students, 2% were in school part time, and 4% were employed part-time. Of them, 5.9% (n=3) reported falling daily, 9.8% (n=5) weekly, 9.8% (n=5) monthly, 19.6% (n=10) rarely fall, yet 54.9% (n=28) were unable to ambulate without a wheelchair. One patient reported previous spine fracture, 11 (22%) limb fractures, and 17 (33.3%) received lower extremity or orthopedic surgeries before. Mean T-Scores and standard deviations on the short forms are shown in Table 25. MD patients generally reported better functioning/ less symptom severity than the reference group norm with one exception. The exception was the Social Relations – Interactions with Peers Short Form, on which MD patients scored about 2.5 T-scores worse than the norm. Reliability: Internal consistency and 1 week test-retest reliability of the short forms is shown in Table 25. Cronbach’s alphas range from .81 to .98 and ICCs from .61 to .97.
48

Table 25. Pediatric MD - Descriptive and reliability statistics for Neuro-QoL short form T-scores Neuro-QoL Measures Nitems Npersons MGPT MCT SD α T-R** ICCs Social Relations – Interactions with Peers* 8 50 47.42 10.15 .90 .87
Cognitive Function* 8 51 50.66 7.02 .81 .80
Depression 8 51 46.27 8.77 .91 .62
Anxiety 8 51 50.25 7.45 .85 .72
Stigma 8 51 49.29 7 .26 .90 .68
Fatigue 8 51 47.10 8.17 .81 .66
Pain 10 51 49.58 8.76 .93 .73
Lower Extremity (Mobility)* NOTE 20 22 54.02*** 23.05 .90 .65
Upper Extremity (Fine Motor, ADL) * 20 51 53.63*** 36.13 .98 .97
* For these banks, a high score indicates better function; for all other banks a high score indicates worse function ** Time 1 (baseline) vs. Time 2 (7-days) *** These two scales were not calibrated using Item Response Theory models due to skewed distributions. Possible scores range from 0 -100 M GPT – Mean General Population T-Score; MCT- Mean Clinical T-Score NOTE 28 patients (54.9%) reported using wheelchair only and had missing data on the Lower Extremity Function scale. When assigned “unable to do” for these patients on the Lower Extremity Function items, mean = 23.73.
49

Validity: Spearman rho correlations between the Neuro-QoL short forms and the pediatric disease measures are shown in Table 26 and between the Neuro-QoL short forms and the cross-disease instruments in Table 27. Table 26. Correlations for Neuro-QoL short form T-scores with disease-specific measures
*p < .05; **p < .01; ***p < .001
Neuro-QoL Short Form PedsQL Core
PedsQL Emotional
Functioning
PedsQL Physical
Functioning
PedsQL Psychosocial
Health
PedsQL School
Functioning
PedsQL Social
Functioning
Multidimensional Fatigue Scale
(MFS)
MFS Cognitive Fatigue
MFS General Fatigue
MFS Sleep/Rest
Fatigue Depression -.74*** -.74*** -.01 -.75*** -.59*** -.57*** -.58*** -.55*** -.59*** -.33* Anxiety -.70*** -.72*** -.13 -.72*** -.58*** -.46*** -.57*** -.48*** -.58*** -.40** Stigma -.73*** -.53*** .09 -.74*** -.52*** -.73*** -.48*** -.37** -.51*** -.35* Cognition .59*** .40** .10 .61*** .62*** .40** .59*** .61*** .48*** .36* Lower Extremity Function - Mobility
-.20 -.12 .28 -.20 -.22 -.28 -.08 -.15 -.06 .12
Upper Extremity Function - Fine Motor, ADL
-.04 -.19 -.31* -.04 -.08 .08 .03 -.08 .01 .21
Fatigue -.68*** -.51*** -.04 -.70*** -.61*** -.52*** -.66*** -.57*** -.63*** -.50*** Pain -.73*** -.58*** .09 -.74*** -.57*** -.62*** -.74*** -.53*** -.65*** -.69*** Social Relations – Interactions with Peers
.41** .40** -.01 .42** .41** .32* .36* .38** .37** .13
50

Table 27. Correlations for Neuro-QoL short form T-scores with cross-disease measures
*p < .05; **p < .01; ***p < .001
Neuro-QoL Short Form Karnofsky Performance
Scale
Symbol Digit
Modalities # Correct
Symbol Search
Raw Score
Digit Symbol
Coding # Correct
PROMIS Physical Function T- Score
PROMIS Mental Health T-Score
Pain Scale (0-10)
EQ-5D Index Score
Global HRQL (0-4)
Depression -.05 -.40** -.32* -.35* -.34* -.70*** .27 -.20 -.40** Anxiety .04 -.19 -.22 -.30 -.35* -.48*** .41** -.20 -.28 Stigma -.05 -.33* -.41** -.32* -.42** -.60*** .38** -.23 -.25 Cognition -.16 .29* .27 .30 .34* .34* -.25 -.001 .26 Lower Extremity Function - Mobility -.62** .01 -.22 -.18 -.28 -.32 -.05 -.37 -.10 Upper Extremity Function - Fine Motor, ADL
-.82*** -.26 -.40** -.45** -.35* -.29 -.20 -.72*** -.11
Fatigue .33* -.25 -.32* -.25 -.39** -.37* .37** .19 -.18 Pain .23 -.34* -.22 -.31* -.51*** -.43** .71*** -.26 -.15 Social Relations – Interactions with Peers
-.13 .47*** .27 .37* .05 .49*** -.26 .15 .43**
51

Convergent Validity: The global quality of life item “I am content with the quality of my life right now” (20.4% -Not at all or A little bit; 44.9% - Somewhat or Quite a bit; 34.7% - Very much) was used to evaluate the convergent validity of the pediatric Neuro-QoL measures. Depression, Anxiety, and Social Relation-Interaction with Peers were statistically significant, F=7.32 (p=0.002), 3.51 (p=0.038), and 6.10 (p=0.004), respectively. Cognitive Function approached significance, F=2.97 (p=.06). Post-hoc comparisons showed that all significant comparisons were in the predicted direction, with effect size range from 0.75 to 1.58. Responsiveness: The same 23 planned comparisons as described in pediatric epilepsy were conducted. As in the pediatric epilepsy sample, less than 10 patients reported decline in well-being for each GRC question, thus t-tests were used to compare those that declined or reported no change with those that improved. Results for these responsiveness analyses are presented below. Only those that achieved statistical significance are summarized. Of the 23 planned comparisons, five were statistically significant.
Social/Family Well-being: Of the two planned comparisons, Stigma was significant, t=3.57 (p=.004). Those who reported improved social/family well-being reported a greater decrease in stigma scores than those who reported no change or decline in social/family well-being with an effect size of 0.498. Emotional Well-being: Of the three planned comparisons, Stigma was statistically significant, t=-6.82 (p<0.0001) effect size of 0.667.. Specifically, patients who reported “better” Emotional Well-being exhibited a greater decrease in stigma score than those who reported no change or a decrease in emotional well-being. Cognitive Well-being: The one planned comparison was significant. Those who reported no change or decline in cognitive function exhibited decreased scores on the cognitive function measure from time 1 to time 3, t=2.91 (p=0.017), effect size of -0.261. Overall Well-being: Of seven planned comparisons, two were significant. Stigma was significant, with those reporting increased overall well-being scoring lower on the stigma measure at time 3 than time 1 (t=2.79; p=.002) with an effect size of -0.49. Cognitive Function was also significant (t=3.92; p=0.002). Those reporting no change or decrease in well-being scored lower on the cognitive function measure at time 3 than time 1, with an effect size of -0.28. Conclusions:
• The 9 Neuro-QoL measures demonstrated high internal consistency (alpha range from 0.81-0.98). • The Intraclass Correlation Coefficients (ICC) were acceptable, ranging from .62 (Depression) to .97 (Upper
Extremity Function- Fine motor, ADL) • Convergent validity with generic and legacy measures were of the expected strength and direction • Stigma and Cognitive Function were sensitive to change in all planned comparisons.
52

General Conclusions/Discussion
This manual summarizes the procedures and initial findings from Neuro-QoL item bank development and clinical validation field testing. Overall, the Neuro-QoL short forms demonstrated excellent internal consistency across all diseases. Test-retest reliability was acceptable, but varied between disease groups. It was uniformly high for stroke and MS, but a few short forms had lower than expected ICCS when used with ALS, PD, adult and pediatric epilepsy, and muscular dystrophy patients. Validity of the Neuro-QoL short forms and scales was supported by 1). correlations with generic and disease-specific measures that were of the expected strength and direction; 2). ability of the short forms to discriminate between patients grouped by disease severity level or other clinical factor. Responsiveness to change studies and clinical research reports will accrue over time. Additional Neuro-QoL analyses have been performed since the measures were publicly released in 2010. These analyses resulted in the development of a single adult Cognitive Function item bank comprised of items measuring both executive function and general concerns. This bank replaces the Applied Cognition – Executive Function and Applied Cognition – General Concerns item banks. We also recalibrated the pediatric Fatigue and Cognitive Function item banks using data obtained from a general population sample. All related statistics and tables reflect these changes. Work done by others and ourselves has broadened Neuro-QoL’s applicability by enabling comparisons to non-neurological conditions. These types of comparisons are made possible by work of the PROsetta Stone (www.prosettastone.org) project, which provides tables to convert scores on Neuro-QoL measures to scores on measures from the Patient Reported Outcome Measurement Information System (PROMIS). Finally, additional translations of Neuro-QoL continue to be developed. The latest translations can be requested through Assessment Center (www.assessmentcenter.net ).
For Further Information Neuro-QoL instruments are freely available at www.assessmentcenter.net. The User Manual, and Technical Report, as well as a list of publications, are posted on the Neuro-QoL website (www.neuroqol.org).
53
Publications
Below is the current list of publications focusing on Neuro-QoL instruments and related analyses. Please visit the Neuro-QoL website (www.neuroqol.org) for an updated list.
2015
Han JJ, Kurillo G, Abresch RT, de Bie E, Nicorici Lewis A, Bajcsy R. Upper Extremity 3d Reachable Workspace Analysis in Dystrophinopathy Using Kinect. Muscle Nerve. 2015;Epub ahead of print.
Hughes AJ, Beier M, Hartoonian N, Turner AP, Amtmann D, Ehde DM. Self-Efficacy as a Longitudinal Predictor of Perceived Cognitive Impairment in Individuals with Multiple Sclerosis. Arch. Phys. Med. Rehabil. 2015;Epub ahead of print.
2014
Carlozzi NE, Victorson D, Sung V, et al. Hd-PRO-Triad™ Validation: A Patient-Reported Instrument for the Symptom Triad of Huntington Disease. Tremor Other Hyperkinet Mov. 2014;4(223):1-2. http://www.tremorjournal.org/index.php/tremor/article/download/223/pdf.
Cook KF, Victorson DE, Cella D, Schalet BD, Miller D. Creating Meaningful Cut-Scores for Neuro-Qol Measures of Fatigue, Physical Functioning, and Sleep Disturbance Using Standard Setting with Patients and Providers. Qual. Life Res. 2014;Epub ahead of print:1-15.
Correia H, Pérez B, Arnold B, et al. Spanish Translation and Linguistic Validation of the Quality of Life in Neurological Disorders (Neuro-Qol) Measurement System. Qual. Life Res. 2014;Epub ahead of print:1-4.
Kraft GH, Amtmann D, Bennett SE, et al. Assessment of Upper Extremity Function in Multiple Sclerosis: Review and Opinion. Postgrad. Med. 2014;126(5):np.
Lai J-S, Cella D, Yanez B, Stone A. Linking Fatigue Measures on a Common Reporting Metric. J Pain Symptom Manage 2014;48(4):639-648.
Naidech A, Beaumont J, Berman M, et al. Web-Based Assessment of Outcomes after Subarachnoid and Intracerebral Hemorrhage: A New Patient Centered Option for Outcomes Assessment. Neurocrit. Care. 2014;Epub ahead of print:1-6.
Theeke L, Horstman P, Mallow J, et al. Quality of Life and Loneliness in Stroke Survivors Living in Appalachia. J. Neurosci. Nurs. 2014;46(6):E3-E15
Toyinbo PA, Vanderploeg RD, Donnell AJ, et al. Development and Initial Validation of Military Deployment-Related TBI Quality-of-Life Item Banks. J Head Trauma Rehabil 2014;Epub ahead of print.
Victorson D, Cavazos JE, Holmes GL, et al. Validity of the Neurology Quality-of-Life (Neuro-Qol) Measurement System in Adult Epilepsy. Epilepsy Behav. 2014;31(0):77-84.
2013
Carlozzi NE, Tulsky DS. Identification of health-related quality of life (HRQOL) issues relevant to individuals with Huntington disease. J Health Psychol 2013;18(2):212-225.
Marfeo EE, Ni P, Haley SM, et al. Development of an Instrument to Measure Behavioral Health Function for Work Disability: Item Pool Construction and Factor analysis. Arch. Phys. Med. Rehabil. 2013;94(9):1670-1678.
54

Molina Y, Choi SW, Cella D, Rao D. The Stigma Scale for Chronic Illnesses 8-Item Version (SSCI-8): Development, Validation and Use across Neurological Conditions. Int J Behav Med. 2013;20(3):450-460.
Naidech AM, Beaumont JL, Rosenberg NF, et al. Intracerebral Hemorrhage and Delirium Symptoms: Length of Stay, Function and Quality of Life in a 114-Patient Cohort. Am. J. Respir. Crit. Care Med. 2013;188(11):1331-1337.
Salsman J, Victorson D, Choi S, et al. Development and Validation of the Positive Affect and Well-Being Scale for the Neurology Quality of Life (Neuro-Qol) Measurement System. Qual. Life Res. 2013;22(9):2569-2580.
van der Beek KM, Bos I, Middel B, Wynia K. Experienced Stigmatization Reduced Quality of Life of Patients with a Neuromuscular Disease: A Cross-Sectional Study. Clin. Rehabil. 2013;27(11):1029-1038.
2012
Cella D, Lai JS, Nowinski C, et al. Neuro-Qol: Brief Measures of Health-Related Quality of Life for Clinical Research in Neurology. Neurology. 2012;78:1860-1867.
Gershon R, Lai J, Bode R, et al. Neuro-Qol: Quality of Life Item Banks for Adults with Neurological Disorders: Item Development and Calibrations Based Upon Clinical and General Population Testing. Qual. Life Res. 2012;21(3):475-486.
Lai JS, Nowinski C, Victorson D, et al. Quality-of-Life Measures in Children with Neurological Conditions: Pediatric Neuro-Qol. Neurorehabil. Neural Repair. 2012;26(1):36-47.
Tulsky DS, Jette AM, Kisala PA, et al. Spinal Cord Injury-Functional Index: Item Banks to Measure Physical Functioning in Individuals With Spinal Cord Injury. Arch Phys Med Rehabil 2012;93(10):1722-1732.
2011
Carlozzi NE, Tulsky DS, Kisala PA. Traumatic Brain Injury Patient-Reported Outcome Measure: Identification of Health-Related Quality-of-Life Issues Relevant to Individuals With Traumatic Brain Injury. Arch Phys Med Rehabil 2011;92(10, Supplement):S52-S60.
Cella D, Nowinski C, Peterman A, et al. The Neurology Quality-of-Life Measurement Initiative. Arch. Phys. Med. Rehabil. 2011;92(10 Suppl):S28-36.
Haley SM, Ni P, Lai J-S, et al. Linking the Activity Measure for Post Acute Care and the Quality of Life Outcomes in Neurological Disorders. Arch. Phys. Med. Rehabil. 2011;92(10, Supplement):S37-S43.
Quatrano LA, Cruz TH. Future of Outcomes Measurement: Impact on Research in Medical Rehabilitation and Neurologic Populations. Arch. Phys. Med. Rehabil. 2011;92(10, Supplement):S7-S11.
Tulsky DS, Kisala PA, Victorson D, et al. Developing a Contemporary Patient-Reported Outcomes Measure for Spinal Cord Injury. Arch Phys Med Rehabil 2011;92(10, Supplement):S44-S51. Tulsky DS, Carlozzi NE, Cella D. Advances in Outcomes Measurement in Rehabilitation Medicine: Current Initiatives from the National Institutes of Health and the National Institute on Disability and Rehabilitation Research. Arch Phys Med Rehabil 2011;92(10, Supplement):S1-S6.
2010
Bode RK, Heinemann AW, Butt Z, et al. Development and Validation of Participation and Positive Psychologic Function Measures for Stroke Survivors. Arch. Phys. Med. Rehabil. 2010;91(9):1347-1356.
Heinemann AW, Tulsky D, Dijkers M, et al. Issues in Participation Measurement in Research and Clinical Applications. Arch Phys Med Rehabil 2010;91(9, Supplement 1):S72-S76.
55
Nowinski CJ, Victorson D, Cavazos JE, Gershon R, Cella D. Neuro-Qol and the NIH Toolbox: Implications for Epilepsy. Therapy. 2010;7(5):533-540.
Wilde EA, Whiteneck GG, Bogner J, et al. Recommendations for the Use of Common Outcome Measures in Traumatic Brain Injury Research. Arch Phys Med Rehabil 2010;91(11):1650-1660.e1617.
2005-2009
Cella D, Victorson D, Nowinski C, Peterman A, Miller DM. The Neuro-Qol Project: Using Multiple Methods to Develop a Hrqol Measurement Platform to Be Used in Clinical Research across Neurological Conditions. Quality of Life Research, Symposium 1353, A-14; 2006.
Lynch EB, Butt Z, Heinemann A, et al. A Qualitative Study of Quality of Life after Stroke: The Importance of Social Relationships. J. Rehabil. Med. 2008;40:518-523.
Miller D, Nowinski C, Victorson D, Peterman A, Perez L. The Neuro-Qol Project: Establishing Research Priorities through Qualitative Research and Consensus Development. Qual. Life Res. 2005;14(9):2031.
Perez L, Huang J, Jansky L, et al. Using Focus Groups to Inform the Neuro-Qol Measurement Tool: Exploring Patient-Centered, Health-Related Quality of Life Concepts across Neurological Conditions. J. Neurosci. Nurs. 2007;39(6):342-353.
Rao D, Choi SW, Victorson D, et al. Measuring Stigma across Neurological Conditions: The Development of the Stigma Scale for Chronic Illness (SSCI). Qual. Life Res. 2009;18(5):585-595.
56

References
1. Ader DN. Developing the Patient-Reported Outcomes Measurement Information System (PROMIS). Med. Care. 05 2007;45(5 Suppl 1):S1-S2.
2. Cella D, Riley W, Stone A, et al. The Patient Reported Outcomes Measurement Information System (PROMIS) developed and tested its first wave of adult self-reported health outcome item banks: 2005-2008. J. Clin. Epidemiol. 2010;63(11):1179-1194.
3. DeWalt DA, Rothrock N, Yount S, Stone AA, PROMIS Cooperative Group. Evaluation of Item Candidates: The PROMIS Qualitative Item Review. Med. Care. 05 2007;45(5 Suppl 1):S12-S21.
4. Jansky LJ, Huang JC. A Multi-Method Approach to Assess Usability and Acceptability: A Case Study of the Patient-Reported Outcomes Measurement System (PROMIS) Workshop. Social Science Computer Review. 2009;27(2):267-270.
5. Klem M, Saghafi E, Abromitis R, Stover A, Dew M, Pilkonis P. Building PROMIS item banks: librarians as co-investigators. Qual. Life Res. 2009;18(7):881-888.
6. U. S. Department of Health and Human Services Food and Drug Administration, Center for Drug Evaluation and Research, Center for Biologics Evaluation and Research, Center for Devices and Radiological Health. Guidance for industry patient-reported outcome measures: use in medical product development to support labeling claims. 2009; http://purl.access.gpo.gov/GPO/LPS113413.
7. Haley SM, Coster WJ, Andres PL, et al. Activity outcome measurement for postacute care. Med. Care. 01 2004;42(1 Suppl):I49-I61.
8. Gershon RC, Lai J-S, Bode R, et al. Quality of Life Item Banks for Adults with Neurological Disorders: Item Development and Calibrations Based upon Clinical and General Population Testing. Manuscript in preparation.
9. Lai JS, Nowinski C, Victorson D, et al. Quality of Life Outcomes in Children with Neurological Conditions- Pediatric Neuro-QOL. Manuscript in preparation.
10. Hambleton RK, Swaminathan H, Rogers HJ. Fundamentals of Item Response Theory. Newbury Park, CA: SAGE Publications, Inc.; 1991.
11. Embretson SE, Reise SP. Item Response Theory for Psychologists. Mahwah, N.J.: Lawrence Erlbaum Associates; 2000.
12. Choi S. Development of freeware for an iterative hybrid ordinal logistic regression/IRT DIF. Manuscript in preparation.
13. Mahoney FI, Barthel DW. Functional evalutaion: The Barthel Index. Md. State Med. J. 1965;14:522-528. 14. Lawton MP, Brody EM. Assessment of older people: Self-maintaining and instrumental activities of daily
living. The Gerontologist. 1969;9(3):179-186. 15. Karnofsky DA, Burchenal JH. The Clinical Evaluation of Chemotherapeutic Agents in Cancer. In: Macleod
CM, ed. Evaluation of Chemotherapeutic Agents. New York: Columbia University Press; 1949:191-205. 16. Lewandowski LJ. The Symbol Digit Modalities Test: a screening instrument for brain-damaged children.
Percept. Mot. Skills. 1984;59(2):615-618. 17. Wechsler D. Wechsler Adult Intelligence Scale - Revised (WAIS-R) Manual. New York, NY: The Psychological
Corporation; 1981. 18. Johnson JA, Coons SJ, Ergo A, Szava-Kovats G. Valuation of EuroQOL (EQ-5D) health states in an adult US
sample. Pharmacoeconomics. 1998;13(4):421-433. 19. Rabin R, de Charro F. EQ-5D: a measure of health status from the EuroQol Group. Ann. Med. Jul
2001;33(5):337-343. 20. Hays RD, Bjorner J, Revicki DA, Spritzer K, Cella D. Development of physical and mental health summary
scores from the Patient Reported Outcomes Measurement Information System (PROMIS) global items. Qual. Life Res. 2009;18(7):873-880.
21. Cella D. Manual of the Functional Assessment of Chronic Illness Therapy (FACIT Scales). Version 4 Elmhurst, IL: FACIT.org; 1997.
57

22. Varni JW, Burwinkle TM, Katz ER, Meeske K, Dickinson P. The PedsQL in pediatric cancer: Reliability and
validity of the Pediatric Quality of Life Inventory Generic Core Scales, Multidimensional Fatigue Scale, and Cancer Module. Cancer. 04/01/ 2002;94(7):2090-2106.
23. Varni JW, Seid M, Rode CA. The PedsQL: Measurement model for the pediatric quality of life inventory. Med. Care. 1999;37(2):126-139.
24. Guyatt GH, Osoba D, Wu AW, Wyrwich KW, Norman GR. Methods to explain the clinical significance of health status measures. Mayo Clin. Proc. 04 2002;77(4):371-383.
25. Guyatt GH, Norman GR, Juniper EF, Griffith LE. A critical look at transition ratings. J. Clin. Epidemiol. 09 2002;55(9):900-908.
26. Jaeschke R, Singer J, Guyatt GH. Measurement of health status. Ascertaining the minimal clinically important difference. Control. Clin. Trials. 12 1989;10(4):407-415.
27. Guyatt GH, Berman LB, Townsend M, Pugsley SO, Chambers LW. A measure of quality of life for clinical trials in chronic lung disease. Thorax. 10 1987;42(10):773-778.
28. Osoba D, Brada M, Yung WKA, Prados M. Health-related quality of life in patients treated with temozolomide versus procarbazine for recurrent glioblastoma multiforme. J. Clin. Oncol. 2002;18:1481-1491.
29. Kelly-Hayes PM, Robertson JT, Broderick JP, et al. The American Heart Association Stroke Outcome Classification. Stroke. 1998;29(6):1274.
30. Duncan PW, Wallace D, Lai SM, Johnson D, Embretson S, Laster LJ. The stroke impact scale version 2.0. Evaluation of reliability, validity, and sensitivity to change. Stroke. 10 1999;30(10):2131-2140.
31. Jenkinson C, Fitzpatrick R, Brennan C, Bromberg M, Swash M. Development and validation of a short measure of health status for individuals with amyotrophic lateral sclerosis/motor neurone disease: The ALSAQ-40. J. Neurol. 11 1999;246 Suppl 3:III16-III21.
32. Jenkinson C, Levvy G, Fitzpatrick R, Garratt A. The amyotrophic lateral sclerosis assessment questionnaire (ALSAQ-40): Tests of data quality, score reliability and response rate in a survey of patients. J. Neurol. Sci. 11/01/ 2000;180(1-2):94-100.
33. Jenkinson C, Fitzpatrick R, Brennan C, Swash M. Evidence for the validity and reliability of the ALS assessment questionnaire: The ALSAQ-40. Amyotroph. Lateral Scler. Other Motor Neuron Disord. 12 1999;1(1):33-40.
34. Norquist JM, Fitzpatrick R, Jenkinson C. Health-related quality of life in amyotrophic lateral sclerosis: determining a meaningful deterioration. Qual. Life Res. 10 2004;13(8):1409-1414.
35. Cedarbaum JM, Stambler N, Malta E, et al. The ALSFRS-R: A revised ALS functional rating scale that incorporates assessments of respiratory function. BDNF ALS Study Group (Phase III). Journal of Neurological Sciences. 10/31/ 1999;169(1-2):13-21.
36. Miller R, Bradley W, Cudkowicz M, et al. Phase II/III randomized trial of TCH346 in patients with ALS. Neurology. 08/21/ 2007;69(8):776-784.
37. Cutter GR, Baier ML, Rudick RA, et al. Development of a multiple sclerosis functional composite as a clinical trial outcome measure. Brain. 05 1999;122(Pt 5):871-872.
38. Kalkers N, Bergers L, de Groot V. Concurrent validity of the MS Functional Composite using MRI as a biological disease maker. Neurology. 2001;56:215-219.
39. Kalkers NF, Bergers E, Castelijns JA, et al. Optimizing the association between disability and biological markers in MS. Neurology. 10/09/ 2001;57(7):1253-1258.
40. Fischer JS, Rudick RA, Cutter GR, Reingold SC. The Multiple Sclerosis Functional Composite Measure (MSFC): An integrated approach to MS clinical outcome assessment. National MS Socieyt Clinical Outcomes Assessment Task Force. Mult. Scler. 08 1999;5(4):244-250.
41. Benesova Y, Niedermayerova I. New approach to evaluation of clinical state in patients with multiple sclerosis. Bratisl. Lek. Listy. 2001;102(8):370-371.
42. Cohen JA, Cutter GR, Fischer JS, et al. Use of the multiple sclerosis functional composite as an outcome measure in a phase 3 clinical trial. Arch. Neurol. 06 2001;58(6):961-967.
58

43. Hoogervorst EL, Kalkers NF, Uitdehaag BM, Polman CH. A study validating changes in the multiple sclerosis
functional composite. Arch. Neurol. 01 2002;59(1):113-116. 44. Rudick RA, Cutter G, Baier M, et al. Use of the Multiple Sclerosis Functional Composite to predict disability
in relapsing MS. Neurology. 05/22/ 2001;56(10):1324-1330. 45. Rudick RA, Cutter G, Reingold S. The multiple sclerosis functional composite: A new clinical outcome
measure for multiple sderosis trials. Mult. Scler. 10 2002;8(5):359-365. 46. Fischer JS, LaRocca NG, Miller DM, Ritvo PG, Andrews H, Paty D. Recent developments in the assessment of
quality of life in multiple sclerosis (MS). Mult. Scler. 08 1999;5(4):251-259. 47. Cohen JA, Fischer JS, Bolibrush DM, et al. Intrarater and inerrater reliability of the MS functinoal composite
outcome measure. Neurology. 02/22/ 2000;54(4):802-806. 48. Marrie RA, Goldman M. Validity of performance scales for disability assessment in multiple sclerosis. Mult.
Scler. 11 2007;13(9):1176-1182. 49. Nasreddine ZS, Phillips NA, Bédirian V, et al. Brief Methodological Reports:The Montreal Cognitive
Assessment, MoCA: A Brief Screening Tool For Mild Cognitive Impairment. J. Am. Geriatr. Soc. 2005;53(4):695-699.
50. de Boer AG, Wijker W, Speelman JD, De Haes JC. Quality of life in patients with Parkinson's disease: Development of a questionnaire. J. Neurol. Neurosurg. Psychiatry. 07 1996;61(1):70-74.
51. Peto V, Jenkinson C, Fitzpatrick R. PDQ-39: A review of the development, validation and application of a Parkinson's disease quality of life questionnaire and its associated measures. J. Neurol. 05 1998;245 Suppl 1:S10-S14.
52. Goetz CG, Fahn S, Martinez-Martin P, et al. Movement Disorder Society-sponsored revision of the Unified Parkinson's Disease Rating Scale (MDS-UPDRS): Process, format, and clinimetric testing plan. Mov. Disord. 01 2007;22(1):41-47.
53. Goetz CG, Poewe W, Rascol O, et al. Movement Disorder Society Task Force report on the Hoehn and Yahr staging scale: status and recommendations. Mov. Disord. 09 2004;19(9):1020-1028.
54. Kroenke K, Spitzer RL, Williams JBW. The PHQ-9 Validity of a Brief Depression Severity Measure. J. Gen. Intern. Med. 2001;16(9):606-613.
55. Devinsky O, Vickrey BG, Cramer J, et al. Development of the quality of life in epilepsy inventory. Epilepsia. 11 1995;36(11):1089-1104.
56. Cramer JA, Arrigo C, Van Hammee G, Bromfield EB. Comparison between the QOLIE-31 and derived QOLIE-10 in a clinical trial of levetiracetam. Epilepsy Res. 08 2000;41(1):29-38.
57. Smith DF, Baker GA, Dewey M, Jacoby A, Chadwick DW. Seizure frequency, patient-perceived seizure severity and the psychosocial consequences of intractable epilepsy. Epilepsy Res. 1991;9(3):231-241.
58. Rapp S, Shumaker S, Smith T, Gibson P, Berzon R, Hoffman R. Adaptation and evaluation of the Liverpool Seizure Severity Scale and Liverpool Quality of Life battery for American epilepsy patients. Qual. Life Res. 08 1998;7(6):467-477.
59. Scott-Lennox J, Bryant-Comstock L, Lennox R, Baker GA. Reliability, validity and responsiveness of a revised scoring system for the Liverpool Seizure Severity Scale. Epilepsy Res. 04 2001;44(1):53-63.
60. Panelli RJ, Kilpatrick C, Moore SM, Matkovic Z, D'Souza WJ, O'Brien TJ. The Liverpool Adverse Events Profile: Relation to AED Use and Mood. Epilepsia. 2007;48(3):456-463.
59

APPENDIX A – Statistics Tables and Figures
Item Statistics- Adult: Included, Excluded, Calibrated, and Uncalibrated Table 28: IRT parameters for the calibrated items in the Cognitive Function bank. For items NQCOG15r1 through NQCOG40r1, the rating scale is: 5 = None; 4 = A little; 3 = Somewhat; 2 = A lot; 1 = Cannot Do. For items NQCOG46r1 through NQCOG86r1, item context is In the past 7 days, and the rating scale is: 5= Never; 4= Rarely (once); 3 = Sometimes (2-3 times0; 2 = Often (once a day); 1= Very Often (several times a day) Neuro-QoL Item Name
PROMIS Item Name
Item Content
Item
slop
e
Thre
shol
d 1
Thre
shol
d 2
Thre
shol
d 3
Thre
shol
d 4
NQCOG15r1 How much DIFFICULTY do you currently have keeping track of time (eg., using a clock)?
1.48 -3.50 -2.27 -1.31 -0.37
NQCOG16r1 How much DIFFICULTY do you currently have checking the accuracy of financial documents, (e,g., bills, checkbook, or bank statements)?
1.77 -3.22 -1.87 -1.09 -0.20
NQCOG22r1 How much DIFFICULTY do you currently have reading and following complex instructions (e.g., directions for a new medication)?
1.99 -2.78 -1.93 -1.05 -0.18
NQCOG24r1 How much DIFFICULTY do you currently have planning for and keeping appointments that are not part of your weekly routine, (e.g., a therapy or doctor appointment, or a social gathering with friends and family)?
2.00 -3.02 -1.88 -0.97 -0.13
NQCOG25r1 How much DIFFICULTY do you currently have managing your time to do most of your daily activities?
1.91 -2.94 -1.86 -0.85 0.22
NQCOG26r1 How much DIFFICULTY do you currently have planning an activity several days in advance (e.g., a meal, trip, or visit to friends)?
2.02 -3.06 -1.83 -0.91 -0.18
NQCOG31r1 How much DIFFICULTY do you currently have getting things organized? 1.79 -2.86 -1.68 -0.81 0.30 NQCOG38r1 How much DIFFICULTY do you currently have remembering where things were
placed or put away (e.g., keys)? 1.87 -3.04 -1.82 -0.83 0.45
NQCOG39r1 How much DIFFICULTY do you currently have remembering a list of 4 or 5 errands without writing it down?
1.75 -2.57 -1.50 -0.61 0.68
NQCOG40r1 How much DIFFICULTY do you currently have learning new tasks or instructions? 2.27 -2.75 -1.80 -0.90 0.10 NQCOG46r1 I made simple mistakes more easily. 2.51 -2.28 -1.74 -0.87 0.29 NQCOG53r1 Words I wanted to use seemed to be on the “tip of my tongue.” 1.90 -2.38 -1.56 -0.45 0.86
60

NQCOG64r1 I had to read something several times to understand it. 2.28 -2.36 -1.61 -0.56 0.53 NQCOG65r1 I had trouble keeping track of what I was doing if I was interrupted. 3.25 -2.14 -1.39 -0.63 0.34 NQCOG66r1 I had difficulty doing more than one thing at a time. 3.16 -1.98 -1.46 -0.62 0.18 NQCOG67r1 I had trouble remembering whether I did things I was supposed to do, like taking a
medicine or buying something I needed. 2.35 -2.25 -1.53 -0.73 0.11
NQCOG68r1 I had trouble remembering new information, like phone numbers or simple instructions.
2.59 -2.09 -1.43 -0.73 0.10
NQCOG69r1 I walked into a room and forgot what I meant to get or do there. 1.67 -2.61 -1.62 -0.53 0.80 NQCOG70r1 I had trouble remembering the name of a familiar person. 2.53 -2.45 -1.64 -0.85 0.01 NQCOG72r1 I had trouble thinking clearly. 3.74 -1.95 -1.41 -0.76 0.05 NQCOG73r1 I reacted slowly to things that were said or done. 3.93 -1.95 -1.41 -0.79 -0.07 NQCOG74r1 I had trouble forming thoughts. 3.10 -1.89 -1.41 -0.81 -0.11 NQCOG75r1 My thinking was slow. 3.23 -1.86 -1.37 -0.75 -0.06 NQCOG77r1 I had to work really hard to pay attention or I would make a mistake. 3.02 -1.96 -1.36 -0.70 0.01 NQCOG80r1 I had trouble concentrating. 3.32 -1.90 -1.41 -0.61 0.20 NQCOG83r1 I had trouble getting started on very simple tasks. 3.47 -1.93 -1.40 -0.75 -0.03 NQCOG84r1 I had trouble making decisions. 3.18 -1.96 -1.36 -0.70 0.03 NQCOG86r1 I had trouble planning out steps of a task. 3.73 -2.04 -1.45 -0.83 -0.12
61

Table 29: Uncalibrated items from the Cognitive Function bank. For items item, the item context is In the past 7 days, and the response scale is: 5= Never; 4= Rarely (once); 3= Sometimes (2-3 times); 2= Often (once a day); 1= Very Often (several times a day) Neuro-QoL Item Name Item Content NQCOG43 I got confused, for example, I did not know where I was. NQCOG44 I had difficulty paying attention for a long period of time. NQCOG45 I felt like my mind went blank. NQCOG47 After I made a mistake, I got stuck and couldn’t figure out a new way to go. NQCOG48 “I had trouble recognizing my mistakes right away NQCOG49 I had trouble saying what I mean in conversations with others. NQCOG50 I was told that I start talking before the other person finishes. NQCOG51 I was told that I repeat myself. NQCOG52 I was a worse listener than usual NQCOG54 I had trouble finding the right word(s) to express myself. NQCOG55 I used the wrong word when I referred to an object. NQCOG56 I communicated by gestures, for example, moving my head, pointing or sign language. NQCOG57 My speech was understood only by a few people who know me well. NQCOG58 I had to repeat myself so others could understand me. NQCOG59 I slurred or stuttered while speaking. NQCOG60 I had to talk very slowly to make myself understood. NQCOG62 I had trouble recalling the name of an object. NQCOG63 I had trouble recognizing familiar words on a page. NQCOG71 I forgot to do things like turn off the stove or turn on my alarm clock. NQCOG76 My thinking was confused. NQCOG78 I had trouble adding or subtracting numbers in my head. NQCOG79 I made mistakes when writing down phone numbers. NQCOG81 I had trouble spelling words correctly when writing. NQCOG82 I had trouble keeping track of the day or date. NQCOG85 When I had something to do that takes a long time, I had trouble deciding where to start. NQCOG87 I needed medical instructions repeated because I could not keep them straight. NQCOG88 When I was reading I needed to use a ruler or my finger to keep track of which line I was on.
62

For each item, the item context is How much DIFFICULTY do you currently have…, and the response scale is: 5= None; 4= A little; 3= Somewhat; 2= A lot; 1= Cannot Do
Neuro-QoL Item Name Item Content NQCOG05 making yourself understood to familiar people over the phone? NQCOG06 making yourself understood to other people during ordinary conversations? NQCOG07 describing something that has happened to you so that others can understand you? NQCOG09 putting words together to form grammatically correct sentences? NQCOG12 reading simple material (e.g., a menu or the TV or radio guide)? NQCOG13 reading the newspaper or magazine? NQCOG14 understanding information on food labels? NQCOG17 counting the correct amount of money when making purchases? NQCOG18 doing calculations in your head while shopping (e.g., 30% off, etc.)? NQCOG19 using information on the bill to figure out where to call if you have a problem?
NQCOG20 carrying on a conversation with a familiar person in a noisy environment (e.g., at a party or meeting)?
NQCOG21 following a series of dialing instructions (e.g., a recorded message "Press 1 for...")? NQCOG23 looking up a phone number or address in the phone book? NQCOG27 have taking care of complicated tasks like managing a checking account or getting appliances
fixed? NQCOG28 do you currently have keeping important personal papers such as bills, insurance documents and
tax forms organized? NQCOG29 handling an unfamiliar problem (e.g., getting the refrigerator fixed)?
NQCOG30 planning for and completing regularly scheduled weekly tasks, such as taking out the trash or doing laundry?
NQCOG32 planning what to do in the day? NQCOG33 explaining how to do something involving several steps to another person? NQCOG34 using a local street map to locate a new store or doctor's office?
NQCOG35 dialing familiar numbers such as a family member or doctor (without losing your place or misdialing)?
NQCOG36 reading a long book (over 100 pages) over a number of days? NQCOG37 remembering to take medications at the appropriate time? NQCOG41 using a map to tell where to go? NQCOG42 understanding pictures that explain how to assemble something?
63

Table 30: Items excluded from the Cognitive Function item bank For each item, the item context is How much DIFFICULTY do you currently have…, and the response scale is: 5= None; 4= A little; 3= Somewhat; 2= A lot; 1= Cannot Do Neuro-QoL Item Name Item Content NQCOG01 writing notes to yourself, such as appointments or 'to do' lists? NQCOG02 composing a brief note or e-mail to someone? NQCOG03 understanding familiar people during ordinary conversations? NQCOG04 understanding family and friends on the phone?
NQCOG08 carrying on a conversation with a small group of familiar people (e.g., family or a few friends)?
NQCOG10 organizing what you want to say? NQCOG11 speaking clearly enough to use the telephone? NQCOG61 My speech was difficult for others to understand
64

Table 31: IRT parameters for the calibrated items in the Upper Extremity bank. For items NQUEX03 through NQUEX15, the rating scale is: 5 = No Difficulty; 4 = A Little Difficulty; 3 = Some Difficulty; 2 = A Lot of Difficulty; 1 = Can’t Do. For items NQUEX19 through NQUEX44, the rating scale is: 5 = Without Any Difficulty; 4 = With a Little Difficulty; 3 = With Some Difficulty; 2 = With Much Difficulty; 1 = Unable to Do. Neuro-QoL Item Name
PROMIS Item Name
Item Content
Item
slop
e
Thre
shol
d 1
Thre
shol
d 2
Thre
shol
d 3
Thre
shol
d 4
NQUEX03 How much DIFFICULTY do you currently have using a spoon to eat a meal? 2.66 -3.71 -3.12 -2.39 -1.94 NQUEX04 How much DIFFICULTY do you currently have putting on a pullover shirt? 3.95 -3.05 -2.50 -2.01 -1.39 NQUEX05 How much DIFFICULTY do you currently have taking off a pullover shirt? 3.63 -3.06 -2.48 -1.94 -1.29 NQUEX06 How much DIFFICULTY do you currently have removing wrappings from small
objects? 3.25 -3.06 -2.19 -1.64 -1.04 NQUEX15 How much DIFFICULTY do you currently have opening medications or vitamin
containers (e.g., childproof containers, small bottles)? 2.51 -2.99 -2.27 -1.75 -0.99 NQUEX19 PFA22 Are you able to open previously opened jars? 2.87 -3.22 -2.73 -2.16 -1.47 NQUEX20 PFA50 Are you able to brush your teeth? 3.13 -3.66 -3.22 -2.68 -2.03 NQUEX23 PFB22 Are you able to hold a plate full of food? 3.62 -2.68 -2.30 -1.92 -1.38 NQUEX28 PFA35 Are you able to open and close a zipper? 4.24 -2.86 -2.29 -2.03 -1.47 NQUEX29 PFA40 Are you able to turn a key in a lock? 4.68 -2.95 -2.55 -2.11 -1.63 NQUEX30 PFA43 Are you able to write with a pen or pencil? 2.11 -3.97 -2.61 -2.00 -1.43 NQUEX31 PFA47 Are you able to pull on trousers? 3.50 -3.03 -2.57 -2.01 -1.33 NQUEX32 PFA54 Are you able to button your shirt? 4.19 -2.51 -2.07 -1.68 -1.17 NQUEX33 PFA55 Are you able to wash and dry your body? 3.51 -2.98 -2.56 -1.98 -1.44 NQUEX36 PFB21 Are you able to pick up coins from a table top? 3.08 -3.32 -2.57 -2.01 -1.33 NQUEX37 PFB26 Are you able to shampoo your hair? 3.54 -2.78 -2.50 -2.15 -1.64 NQUEX38 PFB41 Are you able to trim your fingernails? 3.66 -2.25 -2.02 -1.75 -1.27 NQUEX39 PFA46 Are you able to cut your toe nails? 2.60 -1.98 -1.68 -1.23 -0.61 NQUEX41 PFA09 Are you able to bend down and pick up clothing from the floor? 2.26 -2.94 -2.32 -1.74 -1.07 NQUEX44 Are you able to make a phone call using a touch tone key-pad? 2.45 -3.94 -3.47 -2.76 -2.08
65

Table 32: Uncalibrated items from the Upper Extremity bank. Neuro-QoL Item Name
PROMIS Item Name Item Content Rating Scale
NQUEX01 How much DIFFICULTY do you currently have using a fork to eat a meal?
5 = No Difficulty 4 = A Little Difficulty 3 = Some Difficulty 2 = A Lot of Difficulty 1 = Can't Do
NQUEX02 How much DIFFICULTY do you currently have applying spreads to bread using a knife?
5 = No Difficulty 4 = A Little Difficulty 3 = Some Difficulty 2 = A Lot of Difficulty 1 = Can't Do
NQUEX07 How much DIFFICULTY do you currently have chopping or slicing vegetables (e.g., onions or peppers)?
5 = No Difficulty 4 = A Little Difficulty 3 = Some Difficulty 2 = A Lot of Difficulty 1 = Can't Do
NQUEX08 How much DIFFICULTY do you currently have reaching behind your back to put a belt through a loop?
5 = No Difficulty 4 = A Little Difficulty 3 = Some Difficulty 2 = A Lot of Difficulty 1 = Can't Do
NQUEX09 How much DIFFICULTY do you currently have shaving your neck and face safely and thoroughly with an electric razor?
5 = No Difficulty 4 = A Little Difficulty 3 = Some Difficulty 2 = A Lot of Difficulty 1 = Can't Do
NQUEX10 How much DIFFICULTY do you currently have shaving your legs and underarms safely and thoroughly with an electric razor?
5 = No Difficulty 4 = A Little Difficulty 3 = Some Difficulty 2 = A Lot of Difficulty 1 = Can't Do
NQUEX11 How much DIFFICULTY do you currently have playing cards or Bingo or other light recreational activities?
5 = No Difficulty 4 = A Little Difficulty 3 = Some Difficulty 2 = A Lot of Difficulty 1 = Can't Do
66

Neuro-QoL Item Name
PROMIS Item Name Item Content Rating Scale
NQUEX12 How much DIFFICULTY do you currently have picking up a gallon carton of milk with one hand and setting it on the table?
5 = No Difficulty 4 = A Little Difficulty 3 = Some Difficulty 2 = A Lot of Difficulty 1 = Can't Do
NQUEX13
How much DIFFICULTY do you currently have pounding a nail with a hammer to hang a picture?
5 = No Difficulty 4 = A Little Difficulty 3 = Some Difficulty 2 = A Lot of Difficulty 1 = Can't Do
NQUEX14 How much DIFFICULTY do you currently have holding a screw and screwing it in tight with a manual screwdriver?
5 = No Difficulty 4 = A Little Difficulty 3 = Some Difficulty 2 = A Lot of Difficulty 1 = Can't Do
NQUEX16 How much DIFFICULTY do you currently have cleaning yourself after a bowel movement?
5 = No Difficulty 4 = A Little Difficulty 3 = Some Difficulty 2 = A Lot of Difficulty 1 = Can't Do
NQUEX17 How much DIFFICULTY do you currently have pulling up and fastening your pants after a bowel movement?
5 = No Difficulty 4 = A Little Difficulty 3 = Some Difficulty 2 = A Lot of Difficulty 1 = Can't Do
NQUEX18 How much DIFFICULTY do you currently have putting a Band-Aid or gauze pad on yourself?
5 = No Difficulty 4 = A Little Difficulty 3 = Some Difficulty 2 = A Lot of Difficulty 1 = Can't Do
NQUEX21 PFB16 Are you able to press with your index finger (for example ringing a doorbell)?
5 = Without Any Difficulty 4 = With a Little Difficulty 3 = With Some Difficulty 2 = With Much Difficulty 1 = Unable to Do
NQUEX22 PFB19 Are you able to squeeze a new tube of toothpaste?
5 = Without Any Difficulty 4 = With a Little Difficulty 3 = With Some Difficulty 2 = With Much Difficulty 1 = Unable to Do
67

Neuro-QoL Item Name
PROMIS Item Name Item Content Rating Scale
NQUEX24 PFB33 Are you able to remove something from your back pocket?
5 = Without Any Difficulty 4 = With a Little Difficulty 3 = With Some Difficulty 2 = With Much Difficulty 1 = Unable to Do
NQUEX25
Are you able to wash your face with a washcloth?
5 = Without Any Difficulty 4 = With a Little Difficulty 3 = With Some Difficulty 2 = With Much Difficulty 1 = Unable to Do
NQUEX26 PFC49 Are you able to water a house plant?
5 = Without Any Difficulty 4 = With a Little Difficulty 3 = With Some Difficulty 2 = With Much Difficulty 1 = Unable to Do
NQUEX27 PFA28 Are you able to open a can with a hand can opener?
5 = Without Any Difficulty 4 = With a Little Difficulty 3 = With Some Difficulty 2 = With Much Difficulty 1 = Unable to Do
NQUEX34 PFB15 Are you able to change the bulb in a table lamp?
5 = Without Any Difficulty 4 = With a Little Difficulty 3 = With Some Difficulty 2 = With Much Difficulty 1 = Unable to Do
NQUEX35 PFB20 Are you able to cut a piece of paper with scissors?
5 = Without Any Difficulty 4 = With a Little Difficulty 3 = With Some Difficulty 2 = With Much Difficulty 1 = Unable to Do
NQUEX40 PFA52 Are you able to tie your shoelaces?
5 = Without Any Difficulty 4 = With a Little Difficulty 3 = With Some Difficulty 2 = With Much Difficulty 1 = Unable to Do
NQUEX42 PFB34 Are you able to change a light bulb overhead?
5 = Without Any Difficulty 4 = With a Little Difficulty 3 = With Some Difficulty 2 = With Much Difficulty 1 = Unable to Do
NQUEX43 PFC42 Are you able to open a tight or new jar?
5 = Without Any Difficulty 4 = With a Little Difficulty 3 = With Some Difficulty 2 = With Much Difficulty 1 = Unable to Do
68

Table 33: IRT parameters for the Lower Extremity item bank. Neuro-QoL Item Name
PROMIS Item Name
Item Content Rating scale Item
slop
e
Thre
shol
d 1
Thre
shol
d 2
Thre
shol
d 3
Thre
shol
d 4
NQMOB01
How much DIFFICULTY do you currently have standing up from an armless straight chair (e.g., dining room chair)?
5 = No Difficulty 4 = A Little Difficulty 3 = Some Difficulty 2 = A Lot of Difficulty 1 = Can't Do 3.83 -2.50 -1.90 -1.24 -0.47
NQMOB03
How much DIFFICULTY do you currently have sitting down on and standing up from a chair with arms?
5 = No Difficulty 4 = A Little Difficulty 3 = Some Difficulty 2 = A Lot of Difficulty 1 = Can't Do 3.25 -3.22 -2.48 -1.70 -0.91
NQMOB04
How much DIFFICULTY do you currently have moving from sitting at the side of the bed to lying down on your back?
5 = No Difficulty 4 = A Little Difficulty 3 = Some Difficulty 2 = A Lot of Difficulty 1 = Can't Do 2.56 -3.23 -2.41 -1.79 -1.11
NQMOB06
How much DIFFICULTY do you currently have standing up from a low, soft couch?
5 = No Difficulty 4 = A Little Difficulty 3 = Some Difficulty 2 = A Lot of Difficulty 1 = Can't Do 3.64 -2.38 -1.42 -0.90 -0.03
NQMOB08
How much DIFFICULTY do you currently have going up and down a flight of stairs inside, using a handrail?
5 = No Difficulty 4 = A Little Difficulty 3 = Some Difficulty 2 = A Lot of Difficulty 1 = Can't Do 3.33 -2.46 -1.77 -1.21 -0.54
NQMOB09
How much DIFFICULTY do you currently have walking on uneven surfaces (e.g., grass, dirt road or sidewalk)?
5 = No Difficulty 4 = A Little Difficulty 3 = Some Difficulty 2 = A Lot of Difficulty 1 = Can't Do 3.85 -2.58 -1.72 -1.04 -0.35
NQMOB11
How much DIFFICULTY do you currently have walking around one floor of your home?
5 = No Difficulty 4 = A Little Difficulty 3 = Some Difficulty 2 = A Lot of Difficulty 1 = Can't Do 3.77 -2.95 -2.47 -1.92 -1.24
NQMOB16
How much DIFFICULTY do you currently have taking a 20-minute brisk walk, without stopping to rest?
5 = No Difficulty 4 = A Little Difficulty 3 = Some Difficulty 2 = A Lot of Difficulty 1 = Can't Do 2.68 -1.48 -1.09 -0.70 -0.10
69

Neuro-QoL Item Name
PROMIS Item Name
Item Content Rating scale Item
slop
e
Thre
shol
d 1
Thre
shol
d 2
Thre
shol
d 3
Thre
shol
d 4
NQMOB17
How much DIFFICULTY do you currently have walking on a slippery surface, outdoors?
5 = No Difficulty 4 = A Little Difficulty 3 = Some Difficulty 2 = A Lot of Difficulty 1 = Can't Do 2.85 -1.85 -1.08 -0.51 0.38
NQMOB21
How much DIFFICULTY do you currently have climbing stairs step over step without a handrail? (alternating feet)?
5 = No Difficulty 4 = A Little Difficulty 3 = Some Difficulty 2 = A Lot of Difficulty 1 = Can't Do 3.75 -1.58 -1.07 -0.64 -0.07
NQMOB23
How much DIFFICULTY do you currently have walking in a dark room without falling?
5 = No Difficulty 4 = A Little Difficulty 3 = Some Difficulty 2 = A Lot of Difficulty 1 = Can't Do 2.34 -2.52 -1.73 -1.20 -0.51
NQMOB25 PFA12 Are you able to push open a heavy door?
5 = Without any Difficulty 4 = With a Little Difficulty 3 = With Some Difficulty 2 = With Much Difficulty 1 = Unable to Do 2.78 -2.67 -1.86 -1.21 -0.37
NQMOB28 PFA23 Are you able to go for a walk of at least 15 minutes?
5 = Without any Difficulty 4 = With a Little Difficulty 3 = With Some Difficulty 2 = With Much Difficulty 1 = Unable to Do 2.93 -1.83 -1.54 -1.18 -0.66
NQMOB30 PFA30 Are you able to step up and down curbs?
5 = Without any Difficulty 4 = With a Little Difficulty 3 = With Some Difficulty 2 = With Much Difficulty 1 = Unable to Do 3.89 -2.44 -1.93 -1.42 -0.80
NQMOB31 PFA31 Are you able to get up off the floor from lying on your back without help?
5 = Without any Difficulty 4 = With a Little Difficulty 3 = With Some Difficulty 2 = With Much Difficulty 1 = Unable to Do 3.26 -1.71 -1.25 -0.80 -0.18
NQMOB32 PFA45 Are you able to get out of bed into a chair?
5 = Without any Difficulty 4 = With a Little Difficulty 3 = With Some Difficulty 2 = With Much Difficulty 1 = Unable to Do 3.45 -2.89 -2.33 -1.76 -1.19
70

Neuro-QoL Item Name
PROMIS Item Name
Item Content Rating scale Item
slop
e
Thre
shol
d 1
Thre
shol
d 2
Thre
shol
d 3
Thre
shol
d 4
NQMOB33 PFA53 Are you able to run errands and shop?
5 = Without any Difficulty 4 = With a Little Difficulty 3 = With Some Difficulty 2 = With Much Difficulty 1 = Unable to Do 3.02 -2.26 -1.88 -1.36 -0.79
NQMOB26 PFA56 Are you able to get in and out of a car?
5 = Without any Difficulty 4 = With a Little Difficulty 3 = With Some Difficulty 2 = With Much Difficulty 1 = Unable to Do 3.30 -3.05 -2.29 -1.47 -0.67
NQMOB37 PFC45 Are you able to get on and off the toilet?
5 = Without any Difficulty 4 = With a Little Difficulty 3 = With Some Difficulty 2 = With Much Difficulty 1 = Unable to Do 3.63 -3.04 -2.46 -1.81 -1.23
71

Table 34: Uncalibrated items from the Lower Extremity bank. Neuro-QoL Item Name
PROMIS Item Name Item Content Rating Scale
NQMOB02 How much DIFFICULTY do you currently have sitting down on an armless straight chair (e.g., dining room chair)?
5 = No Difficulty 4 = A Little Difficulty 3 = Some Difficulty 2 = A Lot of Difficulty 1 = Can't Do
NQMOB05 How much DIFFICULTY do you currently have moving from lying on your back to sitting on the side of the bed?
5 = No Difficulty 4 = A Little Difficulty 3 = Some Difficulty 2 = A Lot of Difficulty 1 = Can't Do
NQMOB07 How much DIFFICULTY do you currently have sitting down on a low, soft couch?
5 = No Difficulty 4 = A Little Difficulty 3 = Some Difficulty 2 = A Lot of Difficulty 1 = Can't Do
NQMOB10 How much DIFFICULTY do you currently have opening a window above shoulder height, while standing?
5 = No Difficulty 4 = A Little Difficulty 3 = Some Difficulty 2 = A Lot of Difficulty 1 = Can't Do
NQMOB12 How much DIFFICULTY do you currently have getting into and out of a truck, bus, shuttle van, or sport utility vehicle?
5 = No Difficulty 4 = A Little Difficulty 3 = Some Difficulty 2 = A Lot of Difficulty 1 = Can't Do
NQMOB13 How much DIFFICULTY do you currently have running 45 minutes?
5 = No Difficulty 4 = A Little Difficulty 3 = Some Difficulty 2 = A Lot of Difficulty 1 = Can't Do
NQMOB14 How much DIFFICULTY do you currently have running up and down an incline?
5 = No Difficulty 4 = A Little Difficulty 3 = Some Difficulty 2 = A Lot of Difficulty 1 = Can't Do
72

Neuro-QoL Item Name
PROMIS Item Name Item Content Rating Scale
NQMOB15 How much DIFFICULTY do you currently have walking 45 minutes on an even surface?
5 = No Difficulty 4 = A Little Difficulty 3 = Some Difficulty 2 = A Lot of Difficulty 1 = Can't Do
NQMOB18
How much DIFFICULTY do you currently have getting into and out of a kneeling position?
5 = No Difficulty 4 = A Little Difficulty 3 = Some Difficulty 2 = A Lot of Difficulty 1 = Can't Do
NQMOB19 How much DIFFICULTY do you currently have using an escalator?
5 = No Difficulty 4 = A Little Difficulty 3 = Some Difficulty 2 = A Lot of Difficulty 1 = Can't Do
NQMOB20 How much DIFFICULTY do you currently have crossing the road at a 4-lane traffic light with curbs?
5 = No Difficulty 4 = A Little Difficulty 3 = Some Difficulty 2 = A Lot of Difficulty 1 = Can't Do
NQMOB22 How much DIFFICULTY do you currently have going up and down three flights of stairs inside, using a handrail?
5 = No Difficulty 4 = A Little Difficulty 3 = Some Difficulty 2 = A Lot of Difficulty 1 = Can't Do
NQMOB24 How much DIFFICULTY do you currently have walking in a busy place (e.g., crowded store) without losing your balance?
5 = No Difficulty 4 = A Little Difficulty 3 = Some Difficulty 2 = A Lot of Difficulty 1 = Can't Do
NQMOB27 PFA39 Are you able to run at a fast pace for two miles?
5 = Without any Difficulty 4 = With a Little Difficulty 3 = With Some Difficulty 2 = With Much Difficulty 1 = Unable to Do
NQMOB29 Are you able to run or jog for 10 minutes?
5 = Without any Difficulty 4 = With a Little Difficulty 3 = With Some Difficulty 2 = With Much Difficulty 1 = Unable to Do
73

Neuro-QoL Item Name
PROMIS Item Name Item Content Rating Scale
NQMOB34 PFB9 Are you able to jump up and down?
5 = Without any Difficulty 4 = With a Little Difficulty 3 = With Some Difficulty 2 = With Much Difficulty 1 = Unable to Do
NQMOB35
Are you able to run for 5 minutes?
5 = Without any Difficulty 4 = With a Little Difficulty 3 = With Some Difficulty 2 = With Much Difficulty 1 = Unable to Do
NQMOB36 How difficult is it for you to go for a walk of at least 15 minutes?
5 = Without any Difficulty 4 = With a Little Difficulty 3 = With Some Difficulty 2 = With Much Difficulty 1 = Unable to Do
NQASD02 How much DIFFICULTY do you currently have walking on uneven surfaces (e.g., grass, dirt road or sidewalk) with your walking aid?
5 = No Difficulty 4 = A Little Difficulty 3 = Some Difficulty 2 = A Lot of Difficulty 1 = Can't Do
NQASD03 How much DIFFICULTY do you currently have sitting down or standing up from a low, soft couch with your walking aid?
5 = No Difficulty 4 = A Little Difficulty 3 = Some Difficulty 2 = A Lot of Difficulty 1 = Can't Do
NQASD04 How much DIFFICULTY do you currently have sitting down on an armless straight chair, using a wheelchair?
5 = No Difficulty 4 = A Little Difficulty 3 = Some Difficulty 2 = A Lot of Difficulty 1 = Can't Do
NQASD05 How much DIFFICULTY do you currently have propelling / driving a wheelchair for at least 15 minutes?
5 = No Difficulty 4 = A Little Difficulty 3 = Some Difficulty 2 = A Lot of Difficulty 1 = Can't Do
NQASD06 How much DIFFICULTY do you currently have going up and down three flights of stairs inside, using a handrail with your walking aid?
5 = No Difficulty 4 = A Little Difficulty 3 = Some Difficulty 2 = A Lot of Difficulty 1 = Can't Do
74

Neuro-QoL Item Name
PROMIS Item Name Item Content Rating Scale
NQASD08 How much DIFFICULTY do you currently have getting into and out of a truck, bus, shuttle van, or sport utility vehicle with your walking aid?
5 = No Difficulty 4 = A Little Difficulty 3 = Some Difficulty 2 = A Lot of Difficulty 1 = Can't Do
NQASD07 How much DIFFICULTY do you currently have going up and down a flight of stairs inside, using a handrail with your walking aid?
5 = No Difficulty 4 = A Little Difficulty 3 = Some Difficulty 2 = A Lot of Difficulty 1 = Can't Do
NQASD09 How much DIFFICULTY do you currently have getting into and out of a truck, bus, shuttle van, or sport utility vehicle from a wheelchair?
5 = No Difficulty 4 = A Little Difficulty 3 = Some Difficulty 2 = A Lot of Difficulty 1 = Can't Do
NQASD10 How much DIFFICULTY do you currently have descending 3-5 stairs without a handrail with your walking aid?
5 = No Difficulty 4 = A Little Difficulty 3 = Some Difficulty 2 = A Lot of Difficulty 1 = Can't Do
NQASD11 How much difficulty do you currently have going for a walk of at least 15 minutes with your walking aid?
5 = Without any difficulty 4 = With a little difficulty 3 = With some difficulty 2 = With much difficulty 1 = Unable to do
NQASD12 Are you able to get in and out of a car with your walking aid?
5 = Without any difficulty 4 = With a little difficulty 3 = With some difficulty 2 = With much difficulty 1 = Unable to do
NQASD13 Are you able to get in and out of a car from a wheelchair?
5 = Without any difficulty 4 = With a little difficulty 3 = With some difficulty 2 = With much difficulty 1 = Unable to do
75

Table 35: IRT parameters for the Fatigue item bank For each item, item context is In the past 7 days, and the rating scale is: 1 = Never; 2 = Rarely; 3 = Sometimes; 4 = Often; 5 = Always
Neuro-QoL Item Name Item Stem Ite
m sl
ope
Thre
shol
d 1
Thre
shol
d 2
Thre
shol
d 3
Thre
shol
d 4
NQFTG01 I needed help doing my usual activities because of my fatigue. 2.72 -0.68 0.00 0.94 1.86 NQFTG02 I had to limit my social activity because I was tired. 3.61 -0.75 -0.13 0.75 1.91 NQFTG03 I needed to sleep during the day. 1.89 -1.20 -0.41 0.84 1.88 NQFTG04 I had trouble starting things because I was too tired. 3.84 -0.92 -0.25 0.82 1.88
NQFTG05 I had trouble finishing things because I was too tired. 3.74 -1.05 -0.30 0.80 1.92
NQFTG06 I was too tired to do my household chores. 4.24 -0.96 -0.25 0.66 1.67
NQFTG07 I was too tired to leave the house. 3.94 -0.60 0.05 0.94 1.91 NQFTG08 I was too tired to take a short walk. 2.97 -0.68 -0.09 0.69 1.57 NQFTG09 I was too tired to eat. 2.71 -0.20 0.69 1.81 2.72 NQFTG10 I was frustrated by being too tired to do the things I wanted to do. 4.15 -0.72 -0.24 0.43 1.17 NQFTG11 I felt that I had no energy. 4.58 -1.18 -0.42 0.33 1.30 NQFTG12 I was so tired that I needed to rest during the day. 3.52 -1.11 -0.38 0.62 1.42 NQFTG13 I felt exhausted. 4.68 -0.93 -0.25 0.60 1.42
NQFTG14 I felt tired. 3.99 -1.64 -0.74 0.31 1.34 NQFTG15 I felt fatigued. 4.53 -1.30 -0.47 0.41 1.37
NQFTG16 I felt weak all over. 3.13 -0.66 0.04 0.89 1.69
NQFTG17 I needed help doing my usual activities because of weakness. 3.30 -0.27 0.36 1.20 2.09 NQFTG18 I had to limit my social activity because I was physically weak. 3.29 -0.28 0.36 1.04 1.85
NQFTG20 I had to force myself to get up and do things because I was physically too weak. 3.15 -0.36 0.26 1.04 2.01
The Fatigue Item Bank had one uncalibrated item: (NQFTG19) I had enough physical strength to do the things I wanted to do.
76

Table 36: IRT parameters for the Sleep Disturbance short form For each item, the item context is In the past 7 days, and the rating scale is: 1 = Never; 2 = Rarely; 3 = Sometimes; 4 = Often; 5 = Always
Neuro-QoL Item Name Item Stem Ite
m sl
ope
Thre
shol
d 1
Thre
shol
d 2
Thre
shol
d 3
Thre
shol
d 4
NQSLP02 I had to force myself to get up in the morning. 1.59 -0.59 0.32 1.33 2.29 NQSLP03 I had trouble stopping my thoughts at bedtime. 2.30 -0.59 0.14 1.03 2.00
NQSLP04 I was sleepy during the daytime. 1.60 -1.82 -0.77 0.69 1.95 NQSLP05 I had trouble sleeping because of bad dreams. 1.67 0.53 1.57 2.53 3.52 NQSLP07 I had trouble falling asleep. 2.24 -0.62 0.28 1.26 2.15 NQSLP12 Pain woke me up. 1.34 0.05 0.84 2.00 3.45
NQSLP13 I avoided or cancelled activities with my friends because I was tired from having a bad night's sleep. 2.47 0.50 1.12 2.09 2.97
NQSLP18 I felt physically tense during the middle of the night or early morning hours. 1.80 0.57 1.13 2.31 3.76
77

Table 37: Uncalibrated items for the Sleep Disturbance short form For each item, the item context is In the past 7 days, and the rating scale is: 1 = Never; 2 = Rarely; 3 = Sometimes; 4 = Often; 5 = Always Neuro-QoL Item Name Item Stem NQSLP19 During the night I was awakened by stiffness and had trouble getting back to sleep. NQSLP20 I had restless feelings in my legs in the evening or night. NQSLP08 I had an urge to move my legs when I was sitting still or lying down. NQSLP09 My legs jerked or twitched repeatedly during sleep.
NQSLP10 I experienced numbness or tingling in my arms or legs which woke me from sleep at night.
NQSLP14 I had hallucinations at night (seeing or hearing things that do not exist). NQSLP16 I screamed during sleep. NQSLP17 I kicked, punched, or swung my arms during sleep.
Table 38: Items excluded from the Sleep Disturbance short form For each item, the item context is: In the past 7 days, and the rating scale is: 1 = Never; 2 = Rarely; 3 = Sometimes; 4 = Often; 5 = Always Neuro-QoL Item Name
PROMIS Item Name Item Stem
NQSLP01 Sleep50 I woke up too early and could not fall back asleep. NQSLP06 Sleep87 I had trouble staying asleep. NQSLP11 I experienced tremor upon waking. NQSLP15 Taking medicine helped me sleep.
78

Table 39: IRT parameters for the Depression item bank For each item, the item context is In the past 7 days, and the response scale is: 1 = Never; 2 = Rarely; 3 = Sometimes; 4 = Often; 5 = Always. Neuro-QoL Item Name
PROMIS Item Name
Item Stem Item
slop
e
Thre
shol
d 1
Thre
shol
d 2
Thre
shol
d 3
Thre
shol
d 4
NQDEP02 EDDEP04 I felt worthless. 4.77 -0.10 0.29 1.03 1.62 NQDEP03 EDDEP05 I felt that I had nothing to look forward to. 4.43 -0.21 0.37 0.87 1.54 NQDEP04 EDDEP06 I felt helpless. 4.32 -0.22 0.37 0.98 1.53 NQDEP05 EDDEP07 I withdrew from other people. 3.47 -0.20 0.28 1.03 1.71 NQDEP06 EDDEP08 I felt that everything I did was an effort. 2.66 -0.54 0.08 0.92 1.50 NQDEP07 EDDEP09 I felt that nothing could cheer me up. 4.67 -0.11 0.45 1.12 1.76 NQDEP08 EDDEP10 I was critical of myself for my mistakes. 2.67 -0.67 -0.06 0.88 1.59 NQDEP10 EDDEP17 I felt sad. 3.71 -0.72 -0.02 0.79 1.54 NQDEP11 EDDEP19 I felt that I wanted to give up on everything. 4.52 0.05 0.44 1.03 1.66 NQDEP12 EDDEP28 I felt lonely. 3.68 -0.32 0.19 0.92 1.65 NQDEP13 EDDEP29 I felt depressed. 5.79 -0.31 0.22 0.94 1.42 NQDEP14 EDDEP31 I felt discouraged about the future. 3.99 -0.52 0.05 0.68 1.33 NQDEP18 EDDEP35 I found that things in my life were overwhelming. 3.44 -0.28 0.25 1.03 1.68 NQDEP19 EDDEP36 I felt unhappy. 4.70 -0.69 0.01 0.84 1.74 NQDEP20 EDDEP38 I felt unloved. 3.23 -0.08 0.43 1.16 1.70 NQDEP21 EDDEP39 I felt I had no reason for living. 4.38 0.38 0.78 1.33 1.92 NQDEP23 EDDEP41 I felt hopeless. 5.24 0.02 0.49 1.15 1.72 NQDEP24 EDDEP45 I felt that nothing was interesting. 4.12 -0.08 0.49 1.22 1.91 NQDEP25 EDDEP46 I felt pessimistic. 2.76 -0.46 0.26 1.06 1.79 NQDEP26 EDDEP47 I had trouble keeping my mind on what I was doing. 2.42 -0.50 0.23 1.29 2.14 NQDEP27 EDDEP48 I felt that my life was empty. 4.99 -0.03 0.37 1.06 1.65 NQDEP28 EDDEP54 I felt emotionally exhausted. 3.59 -0.28 0.17 0.94 1.54 NQDEP29 EDDEP55 I felt like I needed help for my depression. 3.25 0.25 0.67 1.17 1.63 NQDEP30 EDDEP56 I had trouble enjoying things that I used to enjoy. 3.89 -0.10 0.39 1.08 1.58
79

Table 40: Uncalibrated items for the Depression item bank For each item, the item context is In the past 7 days, and the response scale is: 1 = Never; 2 = Rarely; 3 = Sometimes; 4 = Often; 5 = Always. Neuro-QoL Item Name PROMIS Item Name Item Stem NQDEP01 I felt lonely even when I was with other people. NQDEP09 EDDEP16 I felt like crying. NQDEP15 EDDEP32 I wished I were dead and away from it all. NQDEP16 EDDEP33 I thought about suicide. NQDEP17 EDDEP34 I had crying spells. NQDEP22 EDDEP40 I felt that others would be better off if I were dead.
80

Table 41: IRT parameters for the Anxiety item bank. For each item, the item context is In the past 7 days, and the response scale is: 1 = Never; 2 = Rarely; 3 = Sometimes; 4 = Often; 5 = Always. Neuro-QoL Item Name
PROMIS Item Name
Item Stem
Item
slop
e
Thre
shol
d 1
Thre
shol
d 2
Thre
shol
d 3
Thre
shol
d 4
NQANX02 I felt fearful about my future. 2.34 -0.73 0.14 0.88 1.69 NQANX03 EDANX05 I felt anxious. 3.06 -0.74 0.03 0.94 1.72 NQANX04 EDANX06 I worried about my physical health. 1.40 -1.05 -0.03 1.10 2.17 NQANX05 EDANX07 I felt like I needed help for my anxiety. 2.94 0.13 0.68 1.43 1.97 NQANX07 I felt nervous when my normal routine was disturbed. 3.01 -0.30 0.39 1.16 1.91 NQANX09 EDANX18 I had sudden feelings of panic. 3.45 0.20 0.95 1.57 2.29 NQANX11 EDANX20 I was easily startled. 2.08 -0.25 0.61 1.48 2.26 NQANX12 EDANX26 I felt fidgety. 2.96 -0.27 0.43 1.29 1.96 NQANX13 EDANX27 I felt something awful would happen. 3.24 -0.01 0.61 1.40 2.03 NQANX14 EDANX30 I felt worried. 3.01 -0.82 0.01 0.90 1.57 NQANX17 EDANX32 I suddenly felt scared for no reason. 2.46 0.75 1.31 2.03 2.56 NQANX18 I worried about dying. 1.64 0.48 1.23 2.33 2.89 NQANX20 EDANX41 My worries overwhelmed me. 3.99 0.10 0.66 1.30 1.91 NQANX21 EDANX42 I felt shy. 1.64 -0.18 0.73 1.52 2.25 NQANX22 EDANX46 I felt nervous. 4.29 -0.39 0.37 1.10 1.77 NQANX23 EDANX48 Many situations made me worry. 4.36 -0.35 0.45 1.07 1.63 NQANX24 EDANX49 I had difficulty sleeping. 1.52 -0.77 0.06 0.98 1.81 NQANX25 EDANX51 I had trouble relaxing. 2.95 -0.48 0.29 1.05 1.81 NQANX26 EDANX53 I felt uneasy. 5.52 -0.32 0.42 1.09 1.71 NQANX27 EDANX54 I felt tense. 4.07 -0.44 0.23 1.06 1.70 NQANX28 EDANX55 I had difficulty calming down. 3.30 -0.03 0.66 1.41 2.00
81

Table 42: Uncalibrated items for the Anxiety item bank. For each item, the item context is In the past 7 days, and the response scale is: 1 = Never; 2 = Rarely; 3 = Sometimes; 4 = Often; 5 = Always. Neuro-QoL Item Name PROMIS Item Name Item Stem NQANX01
I was afraid of what the future holds for me.
NQANX06 EDANX13 I had a racing or pounding heart. NQANX08 EDANX17 I had trouble falling asleep. NQANX10 EDANX19 My sleep was restless. NQANX15
I felt nervous when I was left alone.
NQANX16 EDANX33 I felt terrified. NQANX19
I was preoccupied with my worries.
82

Table 43: IRT parameters for the Stigma item bank. For each item, the item context is Lately, and the response scale is: 1 = Never; 2 = Rarely; 3 = Sometimes; 4 = Often; 5 = Always. Neuro-QoL Item Name
Item Stem
Item
slop
e
Thre
shol
d 1
Thre
shol
d 2
Thre
shol
d 3
Thre
shol
d 4
NQSTG01 Because of my illness, some people seemed uncomfortable with me. 3.44 0.10 0.75 1.43 2.40 NQSTG02 Because of my illness, some people avoided me. 4.06 0.35 0.89 1.56 2.20 NQSTG03 Because of my illness, I felt emotionally distant from other people. 3.53 -0.05 0.38 0.99 1.67 NQSTG04 Because of my illness, I felt left out of things. 4.00 -0.06 0.35 0.94 1.61 NQSTG05 Because of my illness, people were unkind to me. 3.31 0.65 1.26 2.10 3.09 NQSTG06 Because of my illness, people made fun of me. 2.85 0.89 1.48 2.29 2.96 NQSTG07 Because of my illness, I felt embarrassed in social situations. 3.99 0.17 0.62 1.27 1.90 NQSTG08 Because of my illness, people avoided looking at me. 3.92 0.67 1.23 1.81 2.70 NQSTG09 Because of my illness, strangers tended to stare at me. 2.65 0.74 1.35 2.04 2.54 NQSTG10 Because of my illness, I worried about other people's attitudes towards me. 3.28 0.35 0.77 1.30 1.97 NQSTG11 Because of my illness, I was treated unfairly by others. 3.76 0.54 1.12 1.82 2.32 NQSTG12 I was unhappy about how my illness affected my appearance. 2.67 0.17 0.62 1.19 1.63 NQSTG13 Because of my illness, it was hard for me to stay neat and clean. 2.43 0.51 0.99 1.74 2.42 NQSTG14 Because of my illness, people tended to ignore my good points. 4.19 0.52 1.02 1.66 2.13 NQSTG15 Because of my illness, I worried that I was a burden to others. 3.28 -0.16 0.22 0.93 1.47 NQSTG16 I felt embarrassed about my illness. 3.46 0.18 0.59 1.18 1.69 NQSTG17 I felt embarrassed because of my physical limitations. 3.39 -0.07 0.35 1.02 1.61 NQSTG18 I felt embarrassed about my speech. 1.94 0.61 0.98 1.69 2.43 NQSTG19 Because of my illness, I felt different from others. 3.35 -0.11 0.42 0.96 1.45 NQSTG20 I tended to blame myself for my problems. 1.66 -0.34 0.31 1.24 2.16 NQSTG21 Some people acted as though it was my fault I have this illness. 2.88 0.50 0.95 1.54 2.19 NQSTG22 I avoided making new friends to avoid telling others about my illness. 3.09 0.54 0.98 1.43 1.93 NQSTG25 People with my illness lost their jobs when their employers found out about it. 1.49 0.01 0.62 1.81 2.89 NQSTG26 I lost friends by telling them that I have this illness. 2.52 0.88 1.39 1.96 2.69
83

Table 44: The Stigma item bank – Excluded items For each item, the item context is Lately, and the response scale is: 1 = Never; 2 = Rarely; 3 = Sometimes; 4 = Often; 5 = Always. Neuro-QoL Item Name
Item Stem
NQSTG23 I was careful who I told that I have this illness NQSTG24 I worried that people who know I have this illness will tell others
84

Table 45: IRT parameters for the Positive Affect and Well-Being item bank. For each item, the item context is Lately, and the response scale is: 1 = Never; 2 = Rarely; 3 = Sometimes; 4 = Often; 5 = Always. Neuro-QoL Item Name
Item Stem
Item
slop
e
Thre
shol
d 1
Thre
shol
d 2
Thre
shol
d 3
Thre
shol
d 4
NQPPF02 I was able to enjoy life. 2.86 -1.64 -0.84 0.14 1.24 NQPPF03 I felt a sense of purpose in my life. 3.70 -1.37 -0.68 0.20 1.04 NQPPF04 I could laugh and see the humor in situations. 2.73 -1.86 -1.26 -0.16 0.79 NQPPF05 I was able to be at ease and feel relaxed. 3.04 -1.64 -0.85 0.03 1.28 NQPPF06 I looked forward with enjoyment to upcoming events. 3.43 -1.55 -0.91 0.10 1.04 NQPPF07 Many areas of my life were interesting to me. 4.01 -1.47 -0.67 0.18 1.07 NQPPF08 I felt emotionally stable. 2.66 -1.63 -1.05 -0.18 0.78 NQPPF10 I felt lovable. 3.05 -1.67 -0.82 0.10 0.99 NQPPF11 I felt confident. 3.44 -1.55 -0.82 0.01 0.96 NQPPF12 I felt hopeful. 4.96 -1.65 -0.83 0.12 0.88 NQPPF13 I had a good life. 5.21 -1.50 -0.88 0.01 0.70 NQPPF14 I had a sense of well-being. 6.61 -1.41 -0.71 0.07 0.82 NQPPF15 My life was satisfying. 5.83 -1.38 -0.70 0.17 0.89 NQPPF16 I had a sense of balance in my life. 4.92 -1.39 -0.60 0.20 0.96 NQPPF17 My life had meaning. 5.60 -1.39 -0.85 0.00 0.69 NQPPF18 My life was peaceful. 3.19 -1.64 -0.80 0.07 1.17 NQPPF19 My life was worth living. 4.16 -1.89 -1.06 -0.29 0.31 NQPPF20 My life had purpose. 5.10 -1.52 -0.90 -0.12 0.53 NQPPF21 I was living life to the fullest. 3.65 -1.13 -0.44 0.36 1.13 NQPPF22 I felt cheerful. 4.59 -1.65 -0.88 0.09 1.12 NQPPF23 In most ways my life was close to my ideal. 3.63 -0.84 -0.27 0.48 1.47 NQPPF24 I had good control of my thoughts. 2.83 -1.87 -1.04 -0.11 0.76 NQPPF26 Even when things were going badly, I still had hope. 3.19 -1.89 -1.08 -0.10 0.74
85

Table 46: The Positive Affect and Well-Being item bank – Uncalibrated items Neuro-QoL Item Name Item Stem NQPPF01 I felt happy about the future. NQPPF09 I was able to relax. NQPPF25 I had good control of my emotions. NQPPF27 I felt loved and wanted.
86

Table 47: IRT parameters for the Emotional and Behavioral Dyscontrol item bank. For each item, the item context is In the past 7 days, and the response scale is: 1 = Never; 2 = Rarely; 3 = Sometimes; 4 = Often; 5 = Always. Neuro-QoL Item Name
PROMIS Item Name
Item Stem
Item
slop
e
Thre
shol
d 1
Thre
shol
d 2
Thre
shol
d 3
Thre
shol
d 4
NQPER01 EDANG09 I felt angry. 1.87 -1.08 0.29 1.66 3.09 NQPER02 EDANG42 I had trouble controlling my temper. 2.67 -0.14 0.90 1.94 2.80 NQPER05 It was hard to control my behavior. 2.85 0.00 0.95 2.11 2.94 NQPER06 I said or did things without thinking. 2.55 -0.59 0.44 1.75 2.79 NQPER07 I got impatient with other people. 3.12 -1.20 -0.05 1.07 2.18 NQPER08 I felt impulsive. 1.98 -0.71 0.48 1.90 3.13 NQPER09 People told me that I talked in a loud or excessive manner. 1.62 0.43 1.34 2.38 3.39 NQPER10 I said or did things that other people probably thought were inappropriate. 2.23 -0.01 1.00 2.25 3.32 NQPER11 I was irritable around other people. 2.99 -0.55 0.43 1.56 2.36 NQPER12 I was bothered by little things. 3.18 -0.96 0.02 1.17 2.12 NQPER13 I suddenly became emotional for no reason. 2.29 -0.26 0.57 1.50 2.75 NQPER14 I felt restless. 1.76 -0.95 -0.02 1.50 3.12 NQPER15 It was hard to adjust to unexpected changes. 2.16 -0.52 0.41 1.57 2.53 NQPER16 I had a hard time accepting criticism from other people. 2.32 -0.66 0.37 1.30 1.99 NQPER17 I became easily upset. 3.61 -0.50 0.36 1.28 2.01 NQPER18 EDANG31 I was stubborn with others. 2.42 -0.77 0.27 1.42 2.37 NQPER19 I was in conflict with others. 2.70 -0.54 0.65 1.79 2.66 NQPER20 I threatened violence toward people or property. 2.05 1.57 2.52 3.04 3.52
87

Table 48: Uncalibrated items for the Emotional and Behavioral Dyscontrol item bank. For each item, the item context is In the past 7 days, and the response scale is: 1 = Never; 2 = Rarely; 3 = Sometimes; 4 = Often; 5 = Always. Neuro-QoL Item Name Item Content NQPER03 It was hard to keep up enthusiasm to get things done. NQPER04 My problems seemed unimportant to me.
88

Table 49: IRT parameters for the Ability to Participate in Social Roles and Activities item bank. For each item, the item context is In the past 7 days; for non-reversed items the rating scale is: 1 = Never; 2 = Rarely; 3 = Sometimes; 4 = Often 5 = Always. For reversed items the rating scale is: 5 = Never; 4 = Rarely; 3 = Sometimes; 2 = Often; 1 = Always
Neuro-QoL Item Name
Item Stem Rating Scale
Item
slop
e
Thre
shol
d 1
Thre
shol
d 2
Thre
shol
d 3
Thre
shol
d 4
NQPRF01 I can keep up with my family responsibilities. 3.87 -2.28 -1.66 -0.98 -0.37 NQPRF02 I have trouble meeting the needs of my family. Reversed 2.97 -2.06 -1.58 -0.84 -0.14 NQPRF03 I am able to do all of my regular family activities. 4.53 -1.88 -1.44 -0.80 -0.28 NQPRF04 I have to limit my regular family activities. Reversed 3.52 -1.93 -1.25 -0.65 -0.18 NQPRF05 I am able to do all of the family activities that people expect me to do. 4.61 -1.83 -1.25 -0.78 -0.23 NQPRF06 I am able to do all of the family activities that I want to do. 4.44 -1.71 -1.15 -0.65 -0.16 NQPRF07 I am able to maintain my friendships as much as I would like. 4.18 -1.75 -1.24 -0.75 -0.16 NQPRF08 I am able to socialize with my friends. 3.73 -1.79 -1.16 -0.52 -0.08 NQPRF09 I am able to do all of my regular activities with friends. 5.27 -1.54 -1.01 -0.51 -0.06 NQPRF11 I can do everything for my friends that I want to do. 5.90 -1.47 -0.96 -0.49 -0.01 NQPRF12 I am able to do all of the activities with friends that people expect me to do. 6.38 -1.60 -1.00 -0.49 -0.05 NQPRF13 I feel limited in my ability to visit friends. Reversed 3.67 -1.45 -1.00 -0.49 0.00 NQPRF14 I am able to do all of the activities with friends that I want to do. 5.45 -1.47 -0.95 -0.51 -0.07 NQPRF15 I feel limited in the amount of time I have to visit friends. Reversed 2.57 -1.69 -1.06 -0.37 0.17 NQPRF16 I have to limit the things I do for fun at home (like reading, listening to music, etc.). Reversed 2.32 -2.11 -1.49 -0.66 0.00 NQPRF17 I can keep up with my social commitments. 5.48 -1.67 -1.08 -0.62 -0.12 NQPRF18 I am able to do all of my regular leisure activities. 4.68 -1.81 -1.14 -0.59 -0.05 NQPRF19 I have to limit my hobbies or leisure activities. Reversed 3.25 -1.68 -1.08 -0.49 0.11 NQPRF20 I am able to do my hobbies or leisure activities. 4.75 -1.75 -1.19 -0.56 0.02 NQPRF21 I am able to do all of the community activities that I want to do. 4.86 -1.47 -0.91 -0.42 0.00 NQPRF22 I am able to do all of the leisure activities that people expect me to do. 5.77 -1.56 -1.03 -0.48 0.03 NQPRF23 I have to do my hobbies or leisure activities for shorter periods of time than usual for me. Reversed 3.13 -1.56 -0.95 -0.39 0.22 NQPRF24 I have to limit social activities outside my home. Reversed 4.49 -1.40 -0.91 -0.41 0.09 NQPRF25 I have trouble keeping in touch with others. Reversed 3.19 -1.80 -1.24 -0.55 0.05 NQPRF26 I am able to participate in leisure activities. 5.00 -1.76 -1.28 -0.51 0.03 NQPRF27 I can do all the leisure activities that I want to do. 5.34 -1.55 -0.98 -0.45 0.02
89

Neuro-QoL Item Name
Item Stem Rating Scale
Item
slop
e
Thre
shol
d 1
Thre
shol
d 2
Thre
shol
d 3
Thre
shol
d 4
NQPRF28 I am able to do all of the community activities that people expect me to do. 5.08 -1.44 -0.90 -0.38 0.14 NQPRF29 I am able to go out for entertainment as much as I want. 3.68 -1.39 -0.83 -0.35 0.19 NQPRF30 I have to limit the things I do for fun outside my home. Reversed 4.18 -1.39 -0.83 -0.26 0.23 NQPRF31 I am doing fewer social activities with groups of people than usual for me. Reversed 3.45 -1.43 -0.95 -0.41 0.12 NQPRF32 I am able to perform my daily routines. 5.92 -1.78 -1.35 -0.78 -0.33 NQPRF33 I am able to run errands without difficulty. 5.09 -1.54 -1.21 -0.68 -0.25 NQPRF34 I can keep up with my work responsibilities (include work at home). 5.63 -1.58 -1.17 -0.60 -0.19 NQPRF35 I am able to do all of my usual work (include work at home). 6.33 -1.56 -1.12 -0.64 -0.17 NQPRF37 I am accomplishing as much as usual at work for me (include work at home). 5.05 -1.53 -1.06 -0.56 -0.05 NQPRF38 My ability to do my work is as good as it can be (include work at home). 4.24 -1.63 -1.20 -0.64 -0.09 NQPRF39 I can do everything for work that I want to do (include work at home). 5.73 -1.46 -1.00 -0.52 -0.01 NQPRF40 I have trouble doing my regular chores or tasks. Reversed 5.22 -1.50 -1.03 -0.48 0.03 NQPRF41 I am able to do all of the work that people expect me to do (include work at home). 6.16 -1.54 -1.09 -0.53 -0.04 NQPRF42 I am limited in doing my work (include work at home). Reversed 4.74 -1.43 -1.03 -0.53 0.00 NQPRF43 I have to do my work for shorter periods of time than usual for me (include work at
home). Reversed 3.84 -1.40 -0.92 -0.41 0.14
NQPRF46 I am able to do all of my usual work. 5.81 -1.48 -1.06 -0.59 -0.15 NQPRF47 I am limited in doing my work. Reversed 4.69 -1.33 -0.99 -0.46 0.02 NQPRF48 I am able to do all of the work that people expect me to do. 5.56 -1.50 -1.08 -0.49 -0.07 NQPRF49 I have to do my work for shorter periods of time than usual for me. Reversed 3.72 -1.43 -0.91 -0.40 0.06
90

Table 50: Excluded items from the Ability to Participate in Social Roles and Activities item bank. For each item, the item context is In the past 7 days; for non-reversed items the rating scale is: 1 = Never; 2 = Rarely; 3 = Sometimes; 4 = Often 5 = Always. For reversed items the rating scale is: 5 = Never; 4 = Rarely; 3 = Sometimes; 2 = Often; 1 = Always Neuro-QoL Item Name Item Stem
Rating Scale
NQPRF10 I have to limit my regular activities with friends. Reversed
NQPRF36 I have trouble taking care of my regular personal and household responsibilities. Reversed
NQPRF44 I am able to work at a volunteer job outside my home. NQPRF45 I am limited in working at a volunteer job outside my home. Reversed
91

Table 51: Items in the Communication pool. Neuro-QoL Item Name Item Context Item Stem Rating Scale
NQCOG01
How much DIFFICULTY do you currently have writing notes to yourself, such as appointments or 'to do' lists?
5 = None 4 = A Little 3 = Somewhat 2 = A lot 1=Cannot Do
NQCOG02
How much DIFFICULTY do you currently have composing a brief note or e-mail to someone?
5 = None 4 = A Little 3 = Somewhat 2 = A lot 1=Cannot Do
NQCOG03
How much DIFFICULTY do you currently have understanding familiar people during ordinary conversations?
5 = None 4 = A Little 3 = Somewhat 2 = A lot 1=Cannot Do
NQCOG04
How much DIFFICULTY do you currently have understanding family and friends on the phone?
5 = None 4 = A Little 3 = Somewhat 2 = A lot 1=Cannot Do
NQCOG08
How much DIFFICULTY do you currently have carrying on a conversation with a small group of familiar people (e.g., family or a few friends)?
5 = None 4 = A Little 3 = Somewhat 2 = A lot 1=Cannot Do
NQCOG10
How much DIFFICULTY do you currently have organizing what you want to say?
5 = None 4 = A Little 3 = Somewhat 2 = A lot 1=Cannot Do
NQCOG11
How much DIFFICULTY do you currently have speaking clearly enough to use the telephone?
5 = None 4 = A Little 3 = Somewhat 2 = A lot 1=Cannot Do
NQCOG61 In the past 7 days My speech was difficult for others to understand
5 = Never 4 = Rarely (once) 3 = Sometimes (two or three times) 2=Often (about once a day) 1 = Very often (several times a day)
92
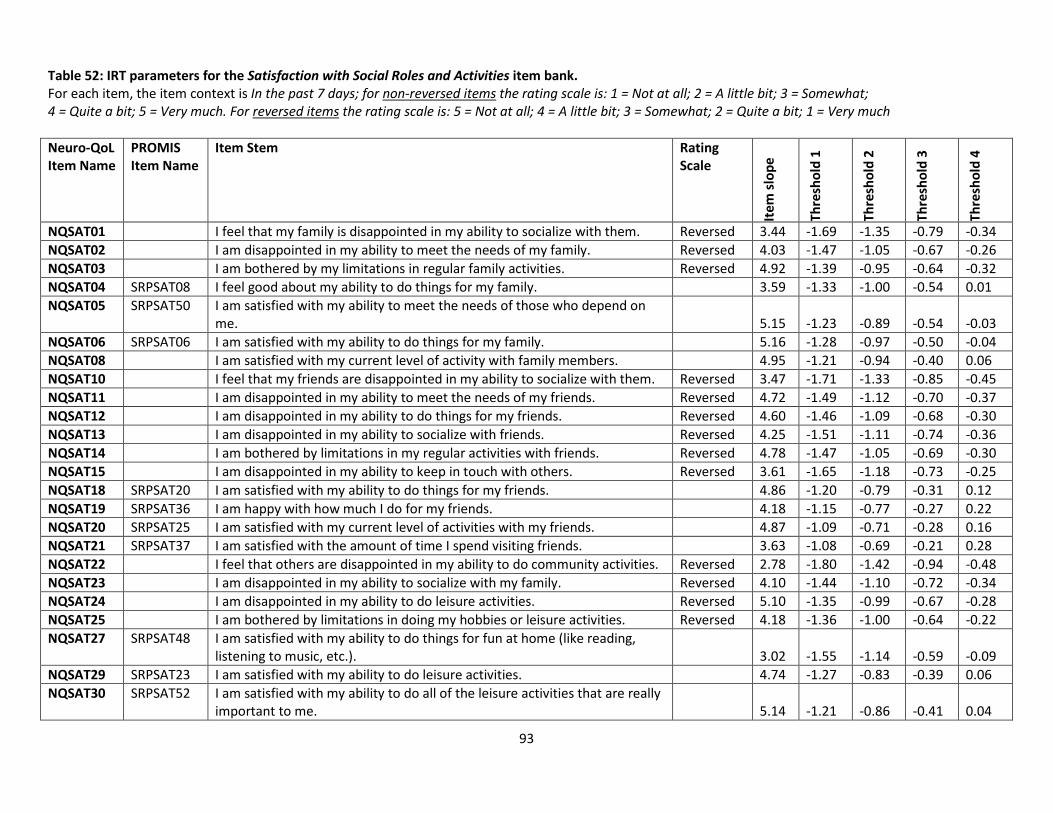
Table 52: IRT parameters for the Satisfaction with Social Roles and Activities item bank. For each item, the item context is In the past 7 days; for non-reversed items the rating scale is: 1 = Not at all; 2 = A little bit; 3 = Somewhat; 4 = Quite a bit; 5 = Very much. For reversed items the rating scale is: 5 = Not at all; 4 = A little bit; 3 = Somewhat; 2 = Quite a bit; 1 = Very much Neuro-QoL Item Name
PROMIS Item Name
Item Stem Rating Scale
Item
slop
e
Thre
shol
d 1
Thre
shol
d 2
Thre
shol
d 3
Thre
shol
d 4
NQSAT01 I feel that my family is disappointed in my ability to socialize with them. Reversed 3.44 -1.69 -1.35 -0.79 -0.34 NQSAT02 I am disappointed in my ability to meet the needs of my family. Reversed 4.03 -1.47 -1.05 -0.67 -0.26 NQSAT03 I am bothered by my limitations in regular family activities. Reversed 4.92 -1.39 -0.95 -0.64 -0.32 NQSAT04 SRPSAT08 I feel good about my ability to do things for my family. 3.59 -1.33 -1.00 -0.54 0.01 NQSAT05 SRPSAT50 I am satisfied with my ability to meet the needs of those who depend on
me. 5.15 -1.23 -0.89 -0.54 -0.03 NQSAT06 SRPSAT06 I am satisfied with my ability to do things for my family. 5.16 -1.28 -0.97 -0.50 -0.04 NQSAT08 I am satisfied with my current level of activity with family members. 4.95 -1.21 -0.94 -0.40 0.06 NQSAT10 I feel that my friends are disappointed in my ability to socialize with them. Reversed 3.47 -1.71 -1.33 -0.85 -0.45 NQSAT11 I am disappointed in my ability to meet the needs of my friends. Reversed 4.72 -1.49 -1.12 -0.70 -0.37 NQSAT12 I am disappointed in my ability to do things for my friends. Reversed 4.60 -1.46 -1.09 -0.68 -0.30 NQSAT13 I am disappointed in my ability to socialize with friends. Reversed 4.25 -1.51 -1.11 -0.74 -0.36 NQSAT14 I am bothered by limitations in my regular activities with friends. Reversed 4.78 -1.47 -1.05 -0.69 -0.30 NQSAT15 I am disappointed in my ability to keep in touch with others. Reversed 3.61 -1.65 -1.18 -0.73 -0.25 NQSAT18 SRPSAT20 I am satisfied with my ability to do things for my friends. 4.86 -1.20 -0.79 -0.31 0.12 NQSAT19 SRPSAT36 I am happy with how much I do for my friends. 4.18 -1.15 -0.77 -0.27 0.22 NQSAT20 SRPSAT25 I am satisfied with my current level of activities with my friends. 4.87 -1.09 -0.71 -0.28 0.16 NQSAT21 SRPSAT37 I am satisfied with the amount of time I spend visiting friends. 3.63 -1.08 -0.69 -0.21 0.28 NQSAT22 I feel that others are disappointed in my ability to do community activities. Reversed 2.78 -1.80 -1.42 -0.94 -0.48 NQSAT23 I am disappointed in my ability to socialize with my family. Reversed 4.10 -1.44 -1.10 -0.72 -0.34 NQSAT24 I am disappointed in my ability to do leisure activities. Reversed 5.10 -1.35 -0.99 -0.67 -0.28 NQSAT25 I am bothered by limitations in doing my hobbies or leisure activities. Reversed 4.18 -1.36 -1.00 -0.64 -0.22 NQSAT27 SRPSAT48 I am satisfied with my ability to do things for fun at home (like reading,
listening to music, etc.). 3.02 -1.55 -1.14 -0.59 -0.09 NQSAT29 SRPSAT23 I am satisfied with my ability to do leisure activities. 4.74 -1.27 -0.83 -0.39 0.06 NQSAT30 SRPSAT52 I am satisfied with my ability to do all of the leisure activities that are really
important to me. 5.14 -1.21 -0.86 -0.41 0.04
93
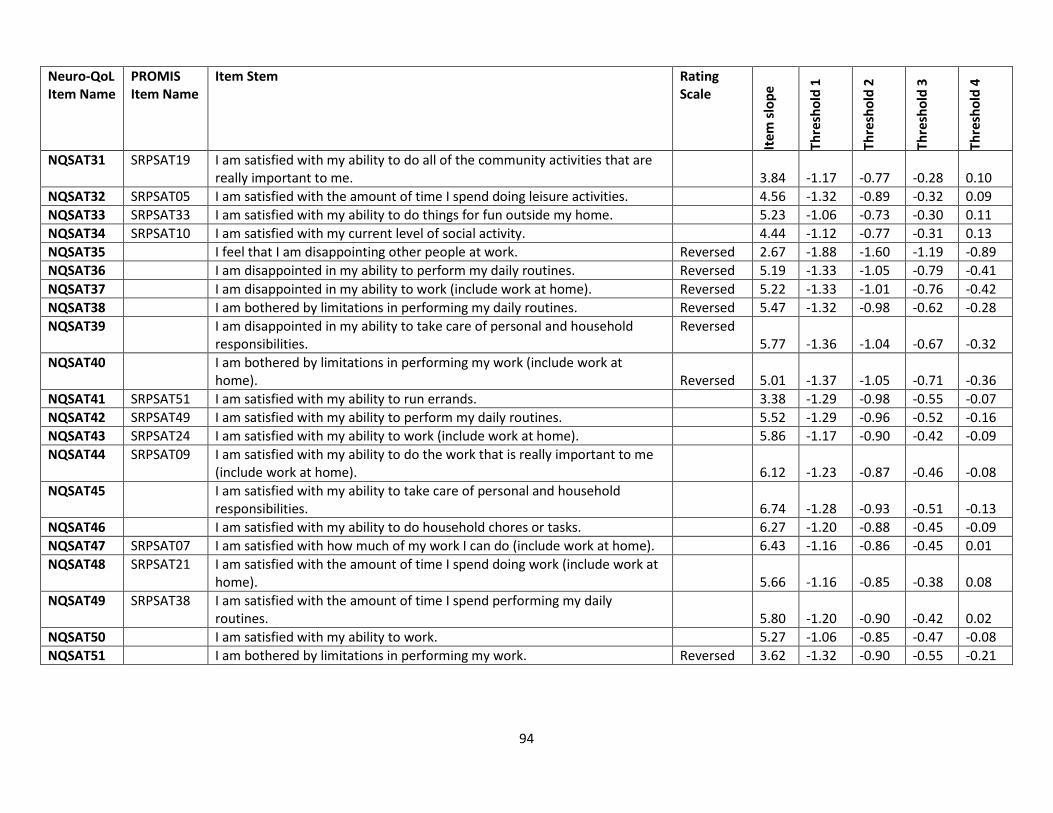
Neuro-QoL Item Name
PROMIS Item Name
Item Stem Rating Scale
Item
slop
e
Thre
shol
d 1
Thre
shol
d 2
Thre
shol
d 3
Thre
shol
d 4
NQSAT31 SRPSAT19 I am satisfied with my ability to do all of the community activities that are really important to me. 3.84 -1.17 -0.77 -0.28 0.10
NQSAT32 SRPSAT05 I am satisfied with the amount of time I spend doing leisure activities. 4.56 -1.32 -0.89 -0.32 0.09 NQSAT33 SRPSAT33 I am satisfied with my ability to do things for fun outside my home. 5.23 -1.06 -0.73 -0.30 0.11 NQSAT34 SRPSAT10 I am satisfied with my current level of social activity. 4.44 -1.12 -0.77 -0.31 0.13 NQSAT35 I feel that I am disappointing other people at work. Reversed 2.67 -1.88 -1.60 -1.19 -0.89 NQSAT36 I am disappointed in my ability to perform my daily routines. Reversed 5.19 -1.33 -1.05 -0.79 -0.41 NQSAT37 I am disappointed in my ability to work (include work at home). Reversed 5.22 -1.33 -1.01 -0.76 -0.42 NQSAT38 I am bothered by limitations in performing my daily routines. Reversed 5.47 -1.32 -0.98 -0.62 -0.28 NQSAT39 I am disappointed in my ability to take care of personal and household
responsibilities. Reversed
5.77 -1.36 -1.04 -0.67 -0.32 NQSAT40 I am bothered by limitations in performing my work (include work at
home). Reversed 5.01 -1.37 -1.05 -0.71 -0.36 NQSAT41 SRPSAT51 I am satisfied with my ability to run errands. 3.38 -1.29 -0.98 -0.55 -0.07 NQSAT42 SRPSAT49 I am satisfied with my ability to perform my daily routines. 5.52 -1.29 -0.96 -0.52 -0.16 NQSAT43 SRPSAT24 I am satisfied with my ability to work (include work at home). 5.86 -1.17 -0.90 -0.42 -0.09 NQSAT44 SRPSAT09 I am satisfied with my ability to do the work that is really important to me
(include work at home). 6.12 -1.23 -0.87 -0.46 -0.08 NQSAT45 I am satisfied with my ability to take care of personal and household
responsibilities. 6.74 -1.28 -0.93 -0.51 -0.13 NQSAT46 I am satisfied with my ability to do household chores or tasks. 6.27 -1.20 -0.88 -0.45 -0.09 NQSAT47 SRPSAT07 I am satisfied with how much of my work I can do (include work at home). 6.43 -1.16 -0.86 -0.45 0.01 NQSAT48 SRPSAT21 I am satisfied with the amount of time I spend doing work (include work at
home). 5.66 -1.16 -0.85 -0.38 0.08 NQSAT49 SRPSAT38 I am satisfied with the amount of time I spend performing my daily
routines. 5.80 -1.20 -0.90 -0.42 0.02 NQSAT50 I am satisfied with my ability to work. 5.27 -1.06 -0.85 -0.47 -0.08 NQSAT51 I am bothered by limitations in performing my work. Reversed 3.62 -1.32 -0.90 -0.55 -0.21
94

Table 53: Excluded items for the Satisfaction with Social Roles and Activities item bank. For each item, the item context is In the past 7 days. All excluded items were reversed-scored; the rating scale is: 5 = Not at all; 4 = A little bit; 3 = Somewhat; 2 = Quite a bit; 1 = Very much Neuro-QoL Item Name Item Stem NQSAT07 I am bothered if I have to depend on my family for help. NQSAT09 I am bothered if I have to depend on others for help. NQSAT16 I am bothered if I have to depend on my friends for help. NQSAT17 I wish I could visit my friends more often. NQSAT28 I wish I could do more social activities outside my home. NQSAT26 I wish I could do more social activities with groups of people.
95
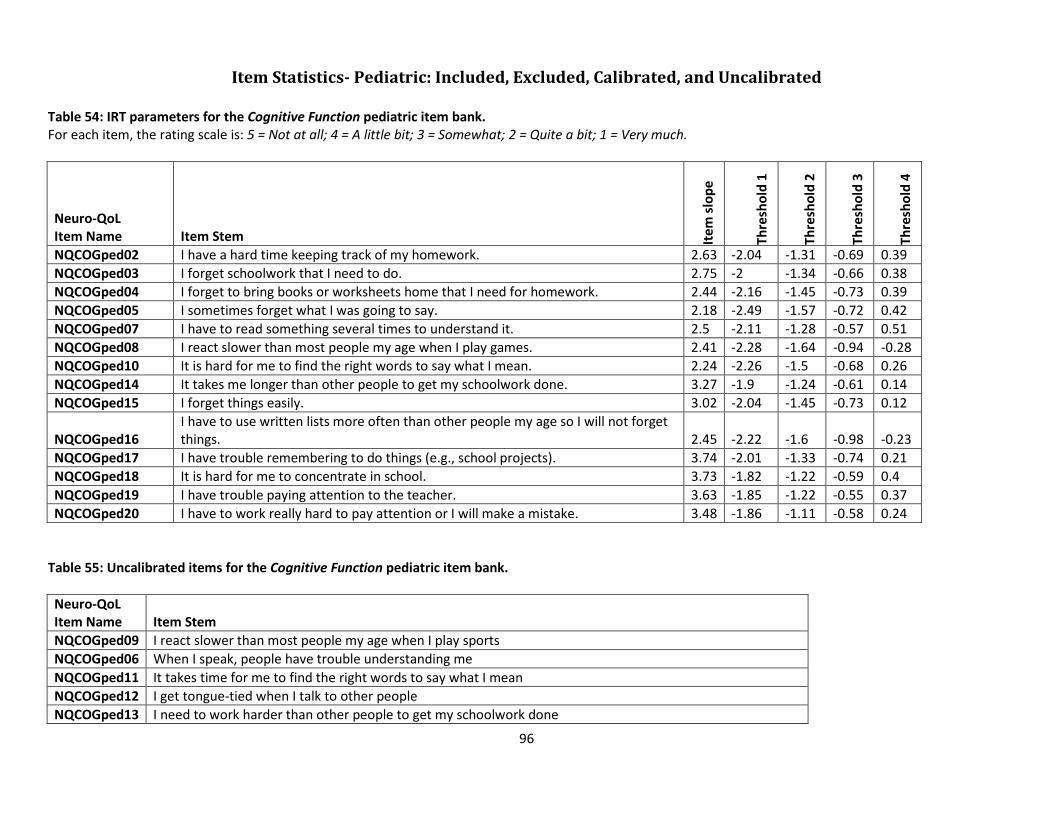
Item Statistics- Pediatric: Included, Excluded, Calibrated, and Uncalibrated
Table 54: IRT parameters for the Cognitive Function pediatric item bank. For each item, the rating scale is: 5 = Not at all; 4 = A little bit; 3 = Somewhat; 2 = Quite a bit; 1 = Very much.
Neuro-QoL Item Name Item Stem Ite
m sl
ope
Thre
shol
d 1
Thre
shol
d 2
Thre
shol
d 3
Thre
shol
d 4
NQCOGped02 I have a hard time keeping track of my homework. 2.63 -2.04 -1.31 -0.69 0.39 NQCOGped03 I forget schoolwork that I need to do. 2.75 -2 -1.34 -0.66 0.38 NQCOGped04 I forget to bring books or worksheets home that I need for homework. 2.44 -2.16 -1.45 -0.73 0.39 NQCOGped05 I sometimes forget what I was going to say. 2.18 -2.49 -1.57 -0.72 0.42 NQCOGped07 I have to read something several times to understand it. 2.5 -2.11 -1.28 -0.57 0.51 NQCOGped08 I react slower than most people my age when I play games. 2.41 -2.28 -1.64 -0.94 -0.28 NQCOGped10 It is hard for me to find the right words to say what I mean. 2.24 -2.26 -1.5 -0.68 0.26 NQCOGped14 It takes me longer than other people to get my schoolwork done. 3.27 -1.9 -1.24 -0.61 0.14 NQCOGped15 I forget things easily. 3.02 -2.04 -1.45 -0.73 0.12
NQCOGped16 I have to use written lists more often than other people my age so I will not forget things. 2.45 -2.22 -1.6 -0.98 -0.23
NQCOGped17 I have trouble remembering to do things (e.g., school projects). 3.74 -2.01 -1.33 -0.74 0.21 NQCOGped18 It is hard for me to concentrate in school. 3.73 -1.82 -1.22 -0.59 0.4 NQCOGped19 I have trouble paying attention to the teacher. 3.63 -1.85 -1.22 -0.55 0.37 NQCOGped20 I have to work really hard to pay attention or I will make a mistake. 3.48 -1.86 -1.11 -0.58 0.24
Table 55: Uncalibrated items for the Cognitive Function pediatric item bank. Neuro-QoL Item Name Item Stem NQCOGped09 I react slower than most people my age when I play sports NQCOGped06 When I speak, people have trouble understanding me NQCOGped11 It takes time for me to find the right words to say what I mean NQCOGped12 I get tongue-tied when I talk to other people NQCOGped13 I need to work harder than other people to get my schoolwork done
96

Table 56: Excluded items for the Cognitive Function pediatric item bank. Neuro-QoL Item Name Item Stem NQCOGped01 I often finish tests or exams after my other classmates
Table 57: IRT parameters for the Stigma pediatric item bank. For each item, the item context is In Lately… . The rating scale is: 1 = Never; 2 = Rarely; 3 = Sometimes; 4 = Often; 5 = Always.
Neuro-QoL Item Name Item Stem Ite
m sl
ope
Thre
shol
d 1
Thre
shol
d 2
Thre
shol
d 3
Thre
shol
d 4
NQSTGped01 Because of my illness, others my age bullied me. 3.06 0.18 0.81 1.41 2.27 NQSTGped02 Because of my illness, others my age seemed uncomfortable with me. 3.06 0.03 0.45 1.15 2.02 NQSTGped03 Because of my illness, others my age avoided me. 3.06 0.28 0.62 1.19 1.94 NQSTGped04 Because of my illness, I felt left out of things. 3.06 -0.32 0.06 0.84 1.56 NQSTGped05 Because of my illness, others my age were mean to me. 3.06 0.22 0.56 1.47 2.04 NQSTGped06 Because of my illness, others my age made fun of me. 3.06 0.24 0.63 1.23 1.77 NQSTGped07 Because of my illness, I felt embarrassed when I was in front of others my age. 3.06 -0.07 0.46 1.21 1.82 NQSTGped08 Because of my illness, others my age tended to stare at me. 3.06 0.06 0.52 1.23 1.60 NQSTGped09 Because of my illness, I worried about what others my age thought about me. 3.06 -0.21 0.32 0.89 1.38 NQSTGped10 Because of my illness, I was treated unfairly by others my age. 3.06 0.19 0.53 1.24 1.71 NQSTGped11 I was unhappy about how my illness affected my appearance. 3.06 0.01 0.54 1.07 1.42 NQSTGped13 Because of my illness, others my age tended to ignore my good points. 3.06 0.18 0.49 1.20 1.79 NQSTGped14 Because of my illness, I worried that I made life harder for my parents or guardians. 3.06 -0.37 0.04 0.77 1.57 NQSTGped15 I felt embarrassed about my illness. 3.06 -0.10 0.29 1.00 1.41 NQSTGped16 I felt embarrassed about the way I talk. 3.06 0.22 0.50 1.40 1.81 NQSTGped17 Because of my illness, I felt different from others my age. 3.06 -0.45 0.09 0.70 1.17 NQSTGped19 I avoided making new friends to avoid talking about my illness. 3.06 0.29 0.63 1.13 1.70 NQSTGped20 I lost friends by telling them that I have this illness. 3.06 0.74 1.03 1.72 2.30
97

Table 58: Uncalibrated items for the Stigma pediatric item bank. For each item, the item context is In Lately… . The rating scale is: 1 = Never; 2 = Rarely; 3 = Sometimes; 4 = Often; 5 = Always. Neuro-QoL Item Name Item Stem NQSTGped12 Because of my illness, it was hard for me to stay neat and clean. NQSTGped18 I tended to blame myself for my problems.
Table 59: IRT parameters for the pediatric Depression item bank. For each item, the item context is In the past 7 days… . For all items except one, the rating scale is: 1 = Never; 2 = Rarely; 3 = Sometimes; 4 = Often; 5 = Always. *** For item NQEMNped32, the rating scale is: 1 = not at all; 2 = a little bit; 3 = somewhat; 4 = quite a bit; 5 = very much
Neuro-QoL Item Name PROMIS Item Name Item Stem Item
slop
e
Thre
shol
d 1
Thre
shol
d 2
Thre
shol
d 3
Thre
shol
d 4
NQEMNped01 I felt too sad to do things with friends. 2.62 -0.03 0.66 1.92 2.60 NQEMNped04 228R1 I felt sad. 2.91 -0.50 0.30 1.48 2.48 NQEMNped08 I was bored. 1.83 -1.53 -0.82 0.81 1.97 NQEMNped09 711R1 I felt lonely. 3.27 -0.49 0.15 1.24 1.98 NQEMNped11 I felt frustrated. 2.60 -1.00 -0.22 1.10 2.06 NQEMNped31 I was less interested in doing things I usually enjoy. 3.93 -0.03 0.70 1.63 2.23 NQEMNped32 *** My mood swings from good feelings to bad feelings. 3.66 -0.20 0.70 1.39 2.09 NQEMNped33 I had trouble sleeping. 2.38 -0.23 0.62 1.47 2.07 NQEMNped34 It was hard for me to care about anything. 4.46 0.15 0.79 1.52 2.26 NQEMNped36 3952aR2 It was hard for me to have fun. 4.78 -0.04 0.58 1.39 2.05 NQEMNped37 I felt that no one loved me. 3.55 0.20 0.81 1.67 2.19 NQEMNped38 I cried more often than usual. 3.33 0.41 1.12 1.81 2.37 NQEMNped39 461R1 I felt alone. 4.51 0.06 0.68 1.52 2.22 NQEMNped40 5035R1 I felt like I couldn't do anything right. 3.91 -0.24 0.42 1.38 1.87 NQEMNped41 5041R1 I felt everything in my life went wrong. 4.97 -0.01 0.57 1.35 1.85 NQEMNped42 I felt too sad to do my schoolwork. 4.76 0.24 0.82 1.54 2.14
One item was not calibrated - NQEMNped35 (PROMIS item ID 2697R1), I wanted to be by myself.
98

Table 60: IRT parameters for the pediatric Anxiety item bank. For each item, the item context is In the past 7 days… .
Neuro-QoL Item Name
PROMIS Item Name Item Stem Rating Scale Ite
m sl
ope
Thre
shol
d 1
Thre
shol
d 2
Thre
shol
d 3
Thre
shol
d 4
NQEMNped22 I felt afraid to go out alone.
1 = Never 2 = Almost Never 3 = Sometimes 4 = Often 5 = Almost Always 3.10 0.23 0.83 1.71 2.21
NQEMNped23 Being worried made it hard for me to be with my friends.
1 = Never 2 = Almost Never 3 = Sometimes 4 = Often 5 = Almost Always 5.32 0.24 0.75 1.54 2.31
NQEMNped24 It was hard to do schoolwork because I was nervous or worried.
1 = Never 2 = Almost Never 3 = Sometimes 4 = Often 5 = Almost Always 4.47 0.06 0.63 1.53 2.14
NQEMNped26 I felt afraid.
1 = Never 2 = Almost Never 3 = Sometimes 4 = Often 5 = Almost Always 4.27 0.01 0.79 1.81 2.23
NQEMNped28 3459bR1 I worried when I was at home.
1 = Never 2 = Almost Never 3 = Sometimes 4 = Often 5 = Almost Always 4.24 0.21 0.91 1.87 2.47
NQEMNped29 5044R1 I felt worried.
1 = Never 2 = Almost Never 3 = Sometimes 4 = Often 5 = Almost Always 3.64 -0.27 0.47 1.63 2.23
NQEMNped43 I worry that my health might get worse.
1 = not at all 2 = a little bit 3 = somewhat 4 = quite a bit 5 = very much 3.96 0.41 1.06 1.63 2.15
99

Neuro-QoL Item Name
PROMIS Item Name Item Stem Rating Scale Ite
m sl
ope
Thre
shol
d 1
Thre
shol
d 2
Thre
shol
d 3
Thre
shol
d 4
NQEMNped46 I worry about doing well in school.
1 = not at all 2 = a little bit 3 = somewhat 4 = quite a bit 5 = very much
1.92
-0.62
0.47
1.27
2.13
NQEMNped02 I become anxious when I go back to the hospital or clinic.
1 = not at all 2 = a little bit 3 = somewhat 4 = quite a bit 5 = very much 1.69 0.33 1.30 1.99 2.79
NQEMNped03 I worry about how my health will affect my future.
1 = not at all 2 = a little bit 3 = somewhat 4 = quite a bit 5 = very much 2.00 0.12 1.04 1.67 2.49
NQEMNped06 Because of my health, I worry about having a boyfriend or girlfriend.
1 = not at all 2 = a little bit 3 = somewhat 4 = quite a bit 5 = very much 2.44 0.43 0.95 1.47 2.15
NQEMNped10 I worry about getting a good job because of my medical condition.
1 = not at all 2 = a little bit 3 = somewhat 4 = quite a bit 5 = very much 2.90 0.57 1.05 1.55 1.97
NQEMNped20 I get nervous more easily than other people.
1 = not at all 2 = a little bit 3 = somewhat 4 = quite a bit 5 = very much 2.86 -0.20 0.78 1.45 2.36
NQEMNped21 I worried when I was away from my family.
1 = Never 2 = Almost Never 3 = Sometimes 4 = Often 5 = Almost Always 2.83 -0.13 0.65 1.44 2.19
NQEMNped25 I got scared easily.
1 = Never 2 = Almost Never 3 = Sometimes 4 = Often 5 = Almost Always 3.74 0.11 0.88 1.74 2.26
100
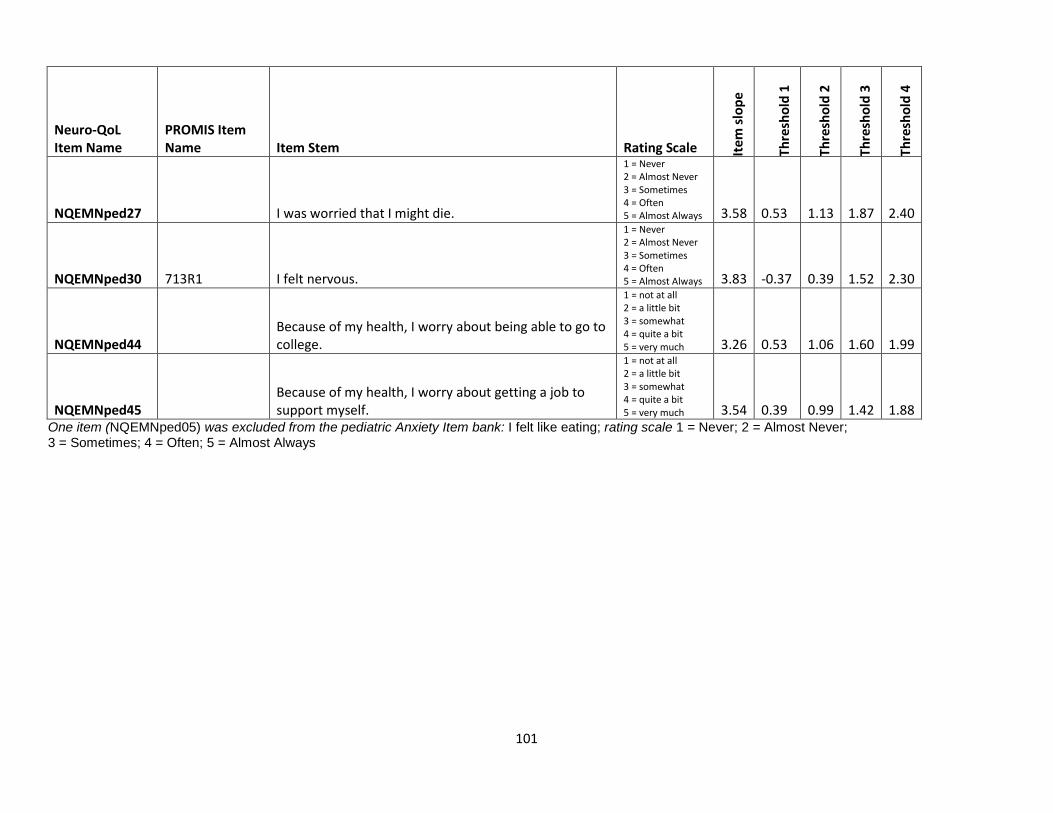
Neuro-QoL Item Name
PROMIS Item Name Item Stem Rating Scale Ite
m sl
ope
Thre
shol
d 1
Thre
shol
d 2
Thre
shol
d 3
Thre
shol
d 4
NQEMNped27 I was worried that I might die.
1 = Never 2 = Almost Never 3 = Sometimes 4 = Often 5 = Almost Always 3.58 0.53 1.13 1.87 2.40
NQEMNped30 713R1 I felt nervous.
1 = Never 2 = Almost Never 3 = Sometimes 4 = Often 5 = Almost Always 3.83 -0.37 0.39 1.52 2.30
NQEMNped44 Because of my health, I worry about being able to go to college.
1 = not at all 2 = a little bit 3 = somewhat 4 = quite a bit 5 = very much 3.26 0.53 1.06 1.60 1.99
NQEMNped45 Because of my health, I worry about getting a job to support myself.
1 = not at all 2 = a little bit 3 = somewhat 4 = quite a bit 5 = very much 3.54 0.39 0.99 1.42 1.88
One item (NQEMNped05) was excluded from the pediatric Anxiety Item bank: I felt like eating; rating scale 1 = Never; 2 = Almost Never; 3 = Sometimes; 4 = Often; 5 = Almost Always
101

Table 61: IRT parameters for the pediatric Anger short form. For each item, the item context is In the past 7 days… . The rating scale is: 1 = Never; 2 = Almost Never; 3 = Sometimes; 4 = Often; 5 = Almost Always
Neuro-QoL Item Name Item Stem Item
slop
e
Thre
shol
d 1
Thre
shol
d 2
Thre
shol
d 3
Thre
shol
d 4
NQEMNped12 Being angry made it hard for me to be with my friends. 3.31 0.04 0.60 1.56 2.41 NQEMNped13 It was hard to do schoolwork because I was angry. 3.22 -0.02 0.54 1.50 2.20 NQEMNped14 I felt angry. 3.79 -0.64 0.17 1.38 2.16 NQEMNped15 I was so mad that I felt like throwing something. 5.91 -0.16 0.45 1.36 1.99 NQEMNped16 I was so mad that I felt like hitting something. 6.57 -0.04 0.60 1.43 1.96 NQEMNped17 I was so mad that I felt like yelling at someone. 4.94 -0.54 0.18 1.18 1.93 NQEMNped18 I was so mad that I felt like breaking things. 5.45 0.06 0.71 1.52 2.17 NQEMNped19 I was so mad that I acted grouchy towards other people. 3.21 -0.68 0.01 1.21 2.05
102
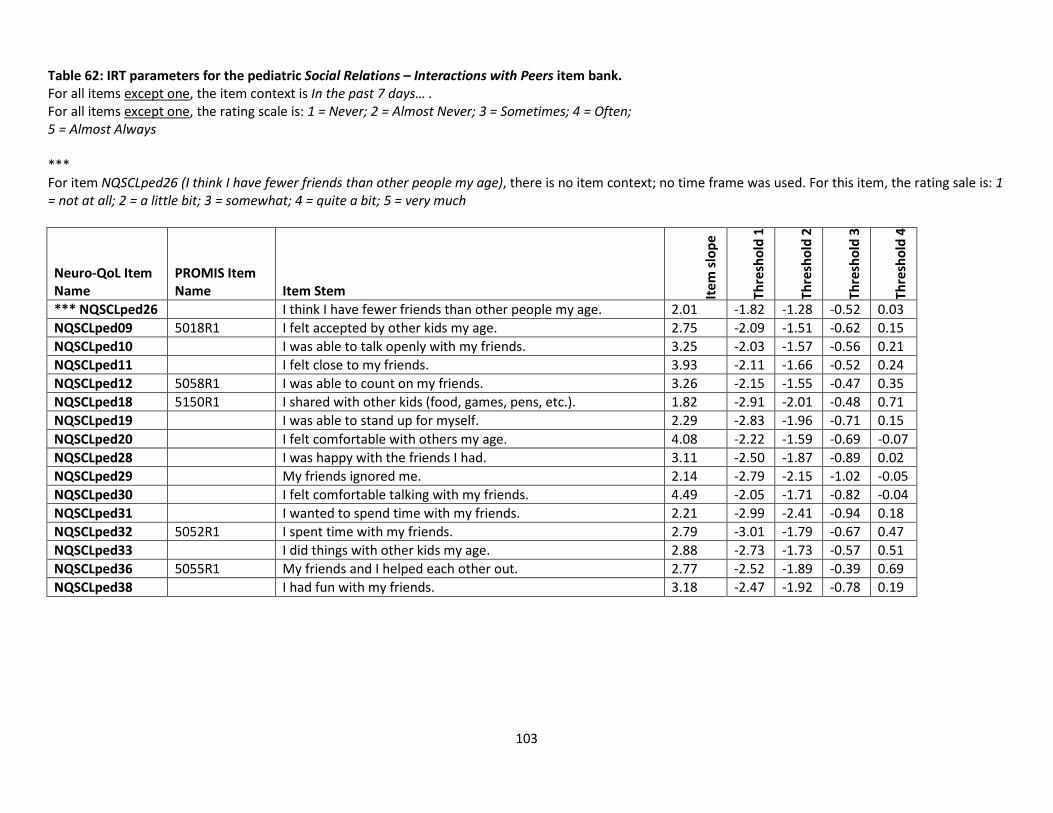
Table 62: IRT parameters for the pediatric Social Relations – Interactions with Peers item bank. For all items except one, the item context is In the past 7 days… . For all items except one, the rating scale is: 1 = Never; 2 = Almost Never; 3 = Sometimes; 4 = Often; 5 = Almost Always *** For item NQSCLped26 (I think I have fewer friends than other people my age), there is no item context; no time frame was used. For this item, the rating sale is: 1 = not at all; 2 = a little bit; 3 = somewhat; 4 = quite a bit; 5 = very much
Neuro-QoL Item Name
PROMIS Item Name Item Stem Ite
m sl
ope
Thre
shol
d 1
Thre
shol
d 2
Thre
shol
d 3
Thre
shol
d 4
*** NQSCLped26 I think I have fewer friends than other people my age. 2.01 -1.82 -1.28 -0.52 0.03 NQSCLped09 5018R1 I felt accepted by other kids my age. 2.75 -2.09 -1.51 -0.62 0.15 NQSCLped10 I was able to talk openly with my friends. 3.25 -2.03 -1.57 -0.56 0.21 NQSCLped11 I felt close to my friends. 3.93 -2.11 -1.66 -0.52 0.24 NQSCLped12 5058R1 I was able to count on my friends. 3.26 -2.15 -1.55 -0.47 0.35 NQSCLped18 5150R1 I shared with other kids (food, games, pens, etc.). 1.82 -2.91 -2.01 -0.48 0.71 NQSCLped19 I was able to stand up for myself. 2.29 -2.83 -1.96 -0.71 0.15 NQSCLped20 I felt comfortable with others my age. 4.08 -2.22 -1.59 -0.69 -0.07 NQSCLped28 I was happy with the friends I had. 3.11 -2.50 -1.87 -0.89 0.02 NQSCLped29 My friends ignored me. 2.14 -2.79 -2.15 -1.02 -0.05 NQSCLped30 I felt comfortable talking with my friends. 4.49 -2.05 -1.71 -0.82 -0.04 NQSCLped31 I wanted to spend time with my friends. 2.21 -2.99 -2.41 -0.94 0.18 NQSCLped32 5052R1 I spent time with my friends. 2.79 -3.01 -1.79 -0.67 0.47 NQSCLped33 I did things with other kids my age. 2.88 -2.73 -1.73 -0.57 0.51 NQSCLped36 5055R1 My friends and I helped each other out. 2.77 -2.52 -1.89 -0.39 0.69 NQSCLped38 I had fun with my friends. 3.18 -2.47 -1.92 -0.78 0.19
103

Table 63: Uncalibrated items for the pediatric Social Relations – Interactions with Peers item bank. For all items except one, the item context is In the past 7 days… . For all items except one, the rating scale is: 1 = Never; 2 = Almost Never; 3 = Sometimes; 4 = Often; 5 = Almost Always *** For item NQSCLped27 (I feel lonely), there is no item context; no time frame was used. For this item, the rating sale is 1 = not at all; 2 = a little bit; 3 = somewhat; 4 = quite a bit; 5 = very much
Neuro-QoL Item Name
PROMIS Item Name Item Stem
NQSCLped01 I got along with my classmates. NQSCLped02 I wished I had more friends. NQSCLped03 9019 I liked being around other kids my age. NQSCLped04 I had trouble getting along with other kids my age. NQSCLped05 I had trouble getting along with my family. NQSCLped06 I was mean to other people. NQSCLped17 I felt different from other kids my age. NQSCLped23 I worried about losing friends. NQSCLped24 I got into fights (hitting, kicking, pushing) with other kids. NQSCLped27 I feel lonely. NQSCLped35 Because of my health, I missed out on important activities.
One item, NQSCLped07, I teased other kids, was excluded from the bank altogether.
104

Table 64: Items for the pediatric Social Relations – Interactions with Adults item pool. For each item, the item context is In the past 7 days…; the rating scale is: 1 = Never; 2 = Almost Never; 3 = Sometimes; 4 = Often; 5 = Almost Always
Neuro-QoL Item Name Item Stem NQSCLped08 I got along with my parents or guardians. NQSCLped13 I felt loved by my parents or guardians. NQSCLped14 I was happy at home. NQSCLped15 My parents or guardians spent enough time with me. NQSCLped16 I got along well with my teachers. NQSCLped21 My teachers accepted me. NQSCLped22 My teachers respected me. NQSCLped25 My parents or guardians seem to know what's important to me. NQSCLped34 I felt comfortable talking with my parents or guardians. NQSCLped37 I argued with my parents or other adults.
105

Table 65: IRT parameters for the pediatric Fatigue item bank. For each item, the item context is In the past 7 days… ; for non-reversed items the rating scale is: 1 = none of the time; 2 = a little bit of time; 3 = some of the time; 4 = most of the time; 5 = all of the time.
Neuro-QoL Item Name Item Stem Rating Scale Ite
m sl
ope
Thre
shol
d 1
Thre
shol
d 2
Thre
shol
d 3
Thre
shol
d 4
NQFTGped01 I felt tired.
2.11 -1.45 -0.23 1.20 2.23 NQFTGped04 I had trouble starting things because I was too tired.
2.11 -0.44 0.61 1.69 2.82
NQFTGped05 I had trouble finishing things because I was too tired.
2.11 -0.50 0.65 1.59 2.42 NQFTGped06 I needed to sleep during the day.
2.11 -0.09 0.49 1.31 2.13
NQFTGped08 Being tired made it hard to play or go out with my friends as much as I would like.
2.11 0.13 0.83 1.42 2.29
NQFTGped11r1 I was too tired to eat.
2.11 0.99 1.63 2.58 NQFTGped12 Being tired makes me sad.
2.11 0.41 0.94 1.76 2.27
NQFTGped13 Being tired makes me mad.
2.11 0.28 0.89 1.55 2.33 NQFTGped07 I got upset by being too tired to do things I wanted to do.
2.11 -0.03 0.77 1.53 2.22
NQFTGped09 I needed help doing my usual things at home.
2.11 -0.08 0.66 1.31 1.92 NQFTGped10 I felt weak.
2.11 -0.09 0.78 1.50 2.64
* The current version 2.1 Pediatric Fatigue Item Bank does not include two positively worded items “NQFTGped02: In the past 7 days… I had energy (or strength)”, and “NQFTGped03: In the past 7 days… I could do my usual things at home” to minimize confusion from children who need to complete both positively and negatively worded items in one instrument. Since these two items were included in version 1.0 Pediatric Fatigue Item Bank, item bank characteristic of the re-calibrated 13-item version (v2.0) are also included in table 73.
106

Table 66: IRT parameters for the pediatric Pain short form. For each item, the item context is In the past 7 days. For all items except one, the rating scale is: 1 = Never; 2 = Rarely; 3 = Sometimes; 4 = Often; 5 = Always. *** For item NQPAIped07 (When you had pain, how long did it last?), the rating scale is: 1 = few seconds; 2 = few minutes; 3 = few hours; 4 = few days (less than a week); 5 = more than a week
Neuro-QoL Item Name
PROMIS Item Name Item Stem Ite
m sl
ope
Thre
shol
d 1
Thre
shol
d 2
Thre
shol
d 3
Thre
shol
d 4
NQPAIped01 I had a lot of pain. 3.96 -0.02 0.56 1.31 1.87 NQPAIped02 My pain was so bad that I needed to take medicine for it. 3.96 0.33 0.78 1.27 1.46 NQPAIped03 2032R1 I missed school when I had pain. 3.96 0.47 0.80 1.46 2.31 NQPAIped04 I had so much pain that I had to stop what I was doing. 3.96 0.42 0.84 1.44 1.90 NQPAIped05 9009 I hurt all over my body. 3.96 0.54 1.00 1.46 2.11 NQPAIped06 I had pain. 3.96 -0.18 0.53 1.29 1.90 *** NQPAIped07 When you had pain, how long did it last? 3.96 -0.23 0.55 1.15 1.73 NQPAIped08 3793R1 I had trouble sleeping when I had pain. 3.96 0.20 0.62 1.12 1.66 NQPAIped09 I had trouble watching TV when I had pain. 3.96 0.65 1.03 1.46 1.88
NQPAIped10 It was hard for me to play or hang out with my friends when I had pain. 3.96 0.18 0.79 1.27 1.53
107

Table 67: Items for the pediatric Lower Extremity Function (Mobility) scale. For each item, the item context is In the past 7 days… . Neuro-QoL Item Name
PROMIS Item Name Item Stem Rating Scale
NQMOBped02r1 2647R2 I could get down on my knees without holding on to something.
4 = With no trouble 3 = With a little trouble 2 = With some trouble 1 = With a lot of trouble 0 = Not able to do
NQMOBped03r1 236R1 I could keep up when I played with other kids.
4 = With no trouble 3 = With a little trouble 2 = With some trouble 1 = With a lot of trouble 0 = Not able to do
NQMOBped04r1 I could walk for 15 minutes.
4 = With no trouble 3 = With a little trouble 2 = With some trouble 1 = With a lot of trouble 0 = Not able to do
NQMOBped05r1 I could walk between rooms.
4 = With no trouble 3 = With a little trouble 2 = With some trouble 1 = With a lot of trouble 0 = Not able to do
NQMOBped08r1 I could get on and off the toilet without using my arms.
4 = With no trouble 3 = With a little trouble 2 = With some trouble 1 = With a lot of trouble 0 = Not able to do
NQMOBped09r1 I could get on and off a low chair.
4 = With no trouble 3 = With a little trouble 2 = With some trouble 1 = With a lot of trouble 0=Not able to do
NQMOBped13r1 I could get up from the floor by myself.
4 = With no trouble 3 = With a little trouble 2 = With some trouble 1 = With a lot of trouble 0 = Not able to do
NQMOBped14r1 I could sit on a bench without support for 15 minutes.
4 = With no trouble 3 = With a little trouble 2 = With some trouble 1 = With a lot of trouble 0 = Not able to do
108

Neuro-QoL Item Name
PROMIS Item Name Item Stem Rating Scale
NQMOBped17r1 I could stand on my tiptoes to reach for something.
4 = With no trouble 3 = With a little trouble 2 = With some trouble 1 = With a lot of trouble 0 = Not able to do
NQMOBped18r1 I could stand on my tiptoes to put something (e.g., 5 lb bag of sugar) on a shelf.
4 = With no trouble 3 = With a little trouble 2 = With some trouble 1 = With a lot of trouble 0 = Not able to do
NQMOBped21r1 I could walk on slightly uneven surfaces (such as cracked pavement).
4 = With no trouble 3 = With a little trouble 2 = With some trouble 1 = With a lot of trouble 0 = Not able to do
NQMOBped24r1 I could walk on rough, uneven surfaces (such as lawns, gravel driveway).
4 = With no trouble 3 = With a little trouble 2 = With some trouble 1 = With a lot of trouble 0 = Not able to do
NQMOBped25r1 I could walk up and down ramps or hills.
4 = With no trouble 3 = With a little trouble 2 = With some trouble 1 = With a lot of trouble 0 = Not able to do
NQMOBped26r1 I could walk up and down curbs.
4 = With no trouble 3 = With a little trouble 2 = With some trouble 1 = With a lot of trouble 0 = Not able to do
NQMOBped29r1 I could get in and out of a bus.
4 = With no trouble 3 = With a little trouble 2 = With some trouble 1 = With a lot of trouble 0 = Not able to do
NQMOBped30r1 2118R1 I could get in and out of a car.
4 = With no trouble 3 = With a little trouble 2 = With some trouble 1 = With a lot of trouble 0 = Not able to do
NQMOBped31r1 2202R2 I could walk across the room.
4 = With no trouble 3 = With a little trouble 2 = With some trouble 1 = With a lot of trouble 0 = Not able to do
109

Neuro-QoL Item Name
PROMIS Item Name Item Stem Rating Scale
NQMOBped32r1 I could walk while wearing a backpack full of books.
4 = With no trouble 3 = With a little trouble 2 = With some trouble 1 = With a lot of trouble 0 = Not able to do
NQMOBped33r1 676R1 I could bend over to pick something up.
4 = With no trouble 3 = With a little trouble 2 = With some trouble 1 = With a lot of trouble 0 = Not able to do
NQMOBped35r1 I could do exercise that others my age can do.
4 = With no trouble 3 = With a little trouble 2 = With some trouble 1 = With a lot of trouble 0 = Not able to do
110

Table 68: Items excluded from the pediatric Lower Extremity Function (Mobility) scale. For each item, the item context is In the past 7 days… . Neuro-QoL Item Name Item Stem Rating Scale
NQMOBped01 I could keep my balance while walking for 30 minutes.
4 = With no trouble 3 = With a little trouble 2 = With some trouble 1 = With a lot of trouble 0 = Not able to do
NQMOBped06 I could run as fast as others my own age.
4 = With no trouble 3 = With a little trouble 2 = With some trouble 1 = With a lot of trouble 0 = Not able to do
NQMOBped07 I could get on and off the toilet.
4 = With no trouble 3 = With a little trouble 2 = With some trouble 1 = With a lot of trouble 0 = Not able to do
NQMOBped10 I could get in and out of an adult-sized chair.
4 = With no trouble 3 = With a little trouble 2 = With some trouble 1 = With a lot of trouble 0 = Not able to do
NQMOBped11 I could get on and off a chair without using my arms.
4 = With no trouble 3 = With a little trouble 2 = With some trouble 1 = With a lot of trouble 0 = Not able to do
NQMOBped12 I could walk for 30 minutes.
4 = With no trouble 3 = With a little trouble 2 = With some trouble 1 = With a lot of trouble 0 = Not able to do
NQMOBped15 I could sit on a bench without back support for 30 minutes.
4 = With no trouble 3 = With a little trouble 2 = With some trouble 1 = With a lot of trouble 0 = Not able to do
111

Neuro-QoL Item Name Item Stem Rating Scale
NQMOBped16 I could keep my balance while walking for 15 minutes.
4 = With no trouble 3 = With a little trouble 2 = With some trouble 1 = With a lot of trouble 0 = Not able to do
NQMOBped19 I could turn my head all the way to the side to look at someone or something.
4 = With no trouble 3 = With a little trouble 2 = With some trouble 1 = With a lot of trouble 0 = Not able to do
NQMOBped22
I lose my balance easily.
4 = With no trouble 3 = With a little trouble 2 = With some trouble 1 = With a lot of trouble 0 = Not able to do
NQMOBped23 I have trouble keeping up with other kids my age when walking.
4 = With no trouble 3 = With a little trouble 2 = With some trouble 1 = With a lot of trouble 0 = Not able to do
NQMOBped27 I could run for 15 minutes.
4 = With no trouble 3 = With a little trouble 2 = With some trouble 1 = With a lot of trouble 0 = Not able to do
NQMOBped28 I could run for 30 minutes.
4 = With no trouble 3 = With a little trouble 2 = With some trouble 1 = With a lot of trouble 0 = Not able to do
NQMOBped34 I could do sports that others my age can do.
4 = With no trouble 3 = With a little trouble 2 = With some trouble 1 = With a lot of trouble 0 = Not able to do
NQMOBped36 I could carry bags (such as shopping bags) while going up a full flight of stairs.
4 = With no trouble 3 = With a little trouble 2 = With some trouble 1 = With a lot of trouble 0 = Not able to do
112

Neuro-QoL Item Name Item Stem Rating Scale
NQMOBped37 I could carry bags (such as shopping bags) while going down a full flight of stairs.
4 = With no trouble 3 = With a little trouble 2 = With some trouble 1 = With a lot of trouble 0 = Not able to do
NQMOBped38 I could ride a bicycle.
4 = With no trouble 3 = With a little trouble 2 = With some trouble 1 = With a lot of trouble 0 = Not able to do
NQMOBped39 I could walk up 2-3 stairs.
4 = With no trouble 3 = With a little trouble 2 = With some trouble 1 = With a lot of trouble 0 = Not able to do
113

Table 69: Items for the Upper Extremity Function (Fine motor, Activities of Daily Living) pediatric scale. For each item, the item context is In the past 7 days… . Neuro-QoL Item Name Item Stem Rating Scale
NQUEXped03r1 I was able to use my fingers to point to something.
4 = With no trouble 3 = With a little trouble 2 = With some trouble 1 = With a lot of trouble 0 = Not able to do
NQUEXped04r1 I was able to take off my socks.
4 = With no trouble 3 = With a little trouble 2 = With some trouble 1 = With a lot of trouble 0 = Not able to do
NQUEXped05r1 I was able to put on and fasten my pants by myself.
4 = With no trouble 3 = With a little trouble 2 = With some trouble 1 = With a lot of trouble 0 = Not able to do
NQUEXped06r1 I was able to button and unbutton my shirt.
4 = With no trouble 3 = With a little trouble 2 = With some trouble 1 = With a lot of trouble 0 = Not able to do
NQUEXped11r1 I was able to use a spoon to bring food up to my mouth.
4 = With no trouble 3 = With a little trouble 2 = With some trouble 1 = With a lot of trouble 0 = Not able to do
NQUEXped13r1 I was able to wipe myself thoroughly after using the toilet.
4 = With no trouble 3 = With a little trouble 2 = With some trouble 1 = With a lot of trouble 0 = Not able to do
NQUEXped14r1 I was able to pull my pants back up after using the toilet.
4 = With no trouble 3 = With a little trouble 2 = With some trouble 1 = With a lot of trouble 0 = Not able to do
NQUEXped15r1 I was able to hold a plate full of food.
4 = With no trouble 3 = With a little trouble 2 = With some trouble 1 = With a lot of trouble 0 = Not able to do
114

Neuro-QoL Item Name Item Stem Rating Scale
NQUEXped19r1 I was able to cut a piece of paper in half with scissors.
4 = With no trouble 3 = With a little trouble 2 = With some trouble 1 = With a lot of trouble 0 = Not able to do
NQUEXped24r1 I was able to take a shower by myself.
4 = With no trouble 3 = With a little trouble 2 = With some trouble 1 = With a lot of trouble 0 = Not able to do
115

Table 70: Items excluded from the Upper Extremity Function (Fine motor, Activities of Daily Living) pediatric scale. For each item, the item context is In the past 7 days… .
Neuro-QoL Item Name Item Stem Rating Scale
NQUEXped25 I was able to take a bath by myself.
4 = With no trouble 3 = With a little trouble 2 = With some trouble 1 = With a lot of trouble 0 = Not able to do
NQUEXped29 I was able to make a phone call using a touch tone key-pad.
4 = With no trouble 3 = With a little trouble 2 = With some trouble 1 = With a lot of trouble 0 = Not able to do
NQUEXped30 I was able to get out of bed by myself.
4 = With no trouble 3 = With a little trouble 2 = With some trouble 1 = With a lot of trouble 0 = Not able to do
NQUEXped32 I was able to put on my shoes by myself.
4 = With no trouble 3 = With a little trouble 2 = With some trouble 1 = With a lot of trouble 0 = Not able to do
NQUEXped33 I was able to open a jar by myself.
4 = With no trouble 3 = With a little trouble 2 = With some trouble 1 = With a lot of trouble 0 = Not able to do
NQUEXped34 I was able to put toothpaste on my toothbrush by myself.
4 = With no trouble 3 = With a little trouble 2 = With some trouble 1 = With a lot of trouble 0 = Not able to do
NQUEXped35 I was able to brush my teeth by myself.
4 = With no trouble 3 = With a little trouble 2 = With some trouble 1 = With a lot of trouble 0 = Not able to do
NQUEXped38 I was able to dry my back with a towel.
4 = With no trouble 3 = With a little trouble 2 = With some trouble 1 = With a lot of trouble 0 = Not able to do
116

Neuro-QoL Item Name Item Stem Rating Scale
NQUEXped40 I was able to put on my clothes by myself.
4 = With no trouble 3 = With a little trouble 2 = With some trouble 1 = With a lot of trouble 0 = Not able to do
NQUEXped41 I was able to zip up my clothes.
4 = With no trouble 3 = With a little trouble 2 = With some trouble 1 = With a lot of trouble 0 = Not able to do
NQUEXped01 I was able to open small containers like snack bags or vitamins (regular screw top).
4 = With no trouble 3 = With a little trouble 2 = With some trouble 1 = With a lot of trouble 0 = Not able to do
NQUEXped02 I was able to wash and dry my hands without help.
4 = With no trouble 3 = With a little trouble 2 = With some trouble 1 = With a lot of trouble 0 = Not able to do
NQUEXped07 I was able to unzip my pants.
4 = With no trouble 3 = With a little trouble 2 = With some trouble 1 = With a lot of trouble 0 = Not able to do
NQUEXped08 I was able to hold a full cup of water in my hand.
4 = With no trouble 3 = With a little trouble 2 = With some trouble 1 = With a lot of trouble 0 = Not able to do
NQUEXped09 I was able to wash my hair without help.
4 = With no trouble 3 = With a little trouble 2 = With some trouble 1 = With a lot of trouble 0 = Not able to do
NQUEXped10 I was able to lift a cup of water to my mouth without spilling.
4 = With no trouble 3 = With a little trouble 2 = With some trouble 1 = With a lot of trouble 0 = Not able to do
NQUEXped12 I was able to use a knife to spread butter or jelly on bread.
4 = With no trouble 3 = With a little trouble 2 = With some trouble 1 = With a lot of trouble 0 = Not able to do
117

Neuro-QoL Item Name Item Stem Rating Scale
NQUEXped16 I was able to carry a tray of food in a cafeteria or restaurant.
4 = With no trouble 3 = With a little trouble 2 = With some trouble 1 = With a lot of trouble 0 = Not able to do
NQUEXped17 I was able to pick up a gallon of milk with one hand and set it on the table.
4 = With no trouble 3 = With a little trouble 2 = With some trouble 1 = With a lot of trouble 0 = Not able to do
NQUEXped18 I was able to get in and out of a tub without help.
4 = With no trouble 3 = With a little trouble 2 = With some trouble 1 = With a lot of trouble 0 = Not able to do
NQUEXped20 I was able to style my hair by myself.
4 = With no trouble 3 = With a little trouble 2 = With some trouble 1 = With a lot of trouble 0 = Not able to do
NQUEXped21 I was able to cover my nose when sneezing.
4 = With no trouble 3 = With a little trouble 2 = With some trouble 1 = With a lot of trouble 0 = Not able to do
NQUEXped22 I was able to use a computer mouse.
4 = With no trouble 3 = With a little trouble 2 = With some trouble 1 = With a lot of trouble 0 = Not able to do
NQUEXped23 I was able to open a can of soda.
4 = With no trouble 3 = With a little trouble 2 = With some trouble 1 = With a lot of trouble 0 = Not able to do
NQUEXped26 I was able to change positions in my bed.
4 = With no trouble 3 = With a little trouble 2 = With some trouble 1 = With a lot of trouble 0 = Not able to do
118
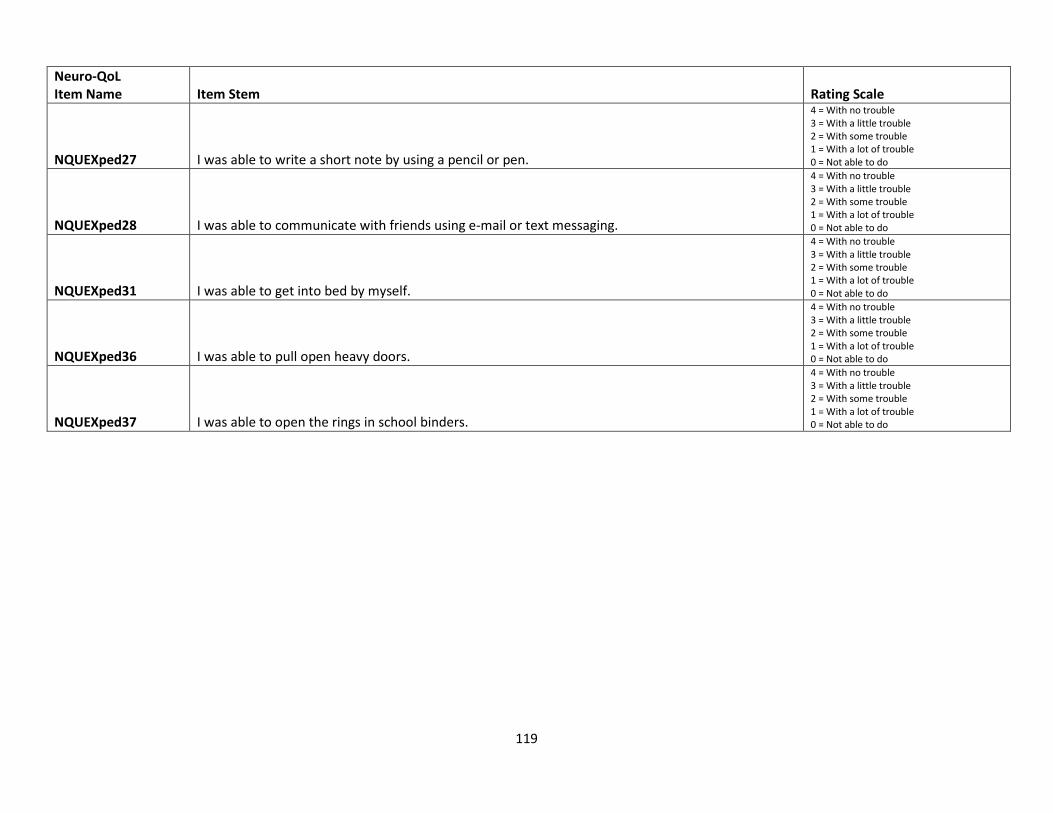
Neuro-QoL Item Name Item Stem Rating Scale
NQUEXped27 I was able to write a short note by using a pencil or pen.
4 = With no trouble 3 = With a little trouble 2 = With some trouble 1 = With a lot of trouble 0 = Not able to do
NQUEXped28 I was able to communicate with friends using e-mail or text messaging.
4 = With no trouble 3 = With a little trouble 2 = With some trouble 1 = With a lot of trouble 0 = Not able to do
NQUEXped31 I was able to get into bed by myself.
4 = With no trouble 3 = With a little trouble 2 = With some trouble 1 = With a lot of trouble 0 = Not able to do
NQUEXped36 I was able to pull open heavy doors.
4 = With no trouble 3 = With a little trouble 2 = With some trouble 1 = With a lot of trouble 0 = Not able to do
NQUEXped37 I was able to open the rings in school binders.
4 = With no trouble 3 = With a little trouble 2 = With some trouble 1 = With a lot of trouble 0 = Not able to do
119

Additional Instrument Statistics
Table 71: Neuro-QoL Item Bank Standard Error and Alpha Reliability by T-scores Neuro-QoL Item Bank N T-Scores
10 20 30 40 50 60 70 80 90 Anxiety 513 SE 9.7 8.8 5.9 2.4 1.4 1.3 1.5 3.4 6.9
Reliability 0.06 0.23 0.65 0.94 0.98 0.98 0.98 0.88 0.53 Depression 513 SE 10.0 9.70 7.1 2.2 1.0 1.0 1.3 5.3 9.4
Reliability 0.00 0.05 0.49 0.95 0.99 0.99 0.98 0.72 0.12 Fatigue 511 SE 9.9 8.90 3.6 1.4 1.3 1.3 1.6 4.2 8.5
Reliability 0.02 0.22 0.87 0.98 0.98 0.98 0.98 0.83 0.28 Upper Extremity Function (Fine motor, ADL) 1095 SE 2.8 1.4 1.2 1.7 4.7 8.9 9.9 10.0 10.0
Reliability 0.92 0.98 0.99 0.97 0.78 0.21 0.02 0.00 0.00 Lower Extremity Function (Mobility) 1046 SE 4.8 1.8 1.4 1.3 1.9 5.1 9.2 10.0 10.0
Reliability 0.77 0.97 0.98 0.98 0.96 0.74 0.15 0.01 0.00 Cognitive Function 1009 SE 4.58 2.35 1.35 1.33 1.38 2.64 6.66 16.91 42.38
Reliability 0.79 0.94 0.98 0.98 0.98 0.93 0.56 0.00 0.00 Emotional and Behavioral Dyscontrol 511 SE 9.8 8.5 4.7 2.2 1.8 1.8 1.8 2.2 4.0
Reliability 0.05 0.28 0.78 0.95 0.97 0.97 0.97 0.95 0.84 Positive Affect and Well-being 513 SE 9.5 5.60 1.6 1.0 1.0 1.1 3.4 8.7 9.9
Reliability 0.10 0.69 0.98 0.99 0.99 0.99 0.88 0.24 0.01 Sleep Disturbance 1087 SE 9.5 8.4 6.4 4.3 3.5 3.2 3.3 3.9 5.3
Reliability 0.09 0.30 0.60 0.81 0.88 0.90 0.89 0.85 0.72 Ability to Participate in Social Roles and Activities 549 SE 9.2 4.5 1.0 0.6 0.6 3.0 8.7 9.9 10.0
Reliability 0.15 0.80 0.99 0.99 0.99 0.91 0.24 0.02 0.00 Satisfaction with Social Roles and Activities 549 SE 9.7 6.4 1.5 0.6 0.7 3.4 9.4 10.0 10.0
Reliability 0.06 0.59 0.98 0.99 0.99 0.88 0.12 0.00 0.00 Stigma 511 SE 9.9 9.7 8.3 4.1 1.5 1.2 1.3 2.3 5.6
Reliability 0.01 0.06 0.31 0.84 0.98 0.99 0.98 0.95 0.69 Higher scores indicate more of that domain. A T-Score distribution has a mean of 50 and standard deviation of 10. SE is on the T-score metric and computed based on the Fisher information conditional on T-score. Reliability is approximated based on the conditional SE.
120

Table 72: Neuro-QoL Item Bank Calibration Sample T-Score Means and Standard Deviations, and Distributions by Percentile Neuro-QoL Item Bank # Items N Mean SD P5 P10 P25 P50 P75 P90 P95 Anxiety 21 513 48.93 9.48 30.98 36.01 42.22 48.93 56.11 60.94 63.16 Depression 24 513 47.68 9.09 32.88 32.88 41.58 47.47 54.66 60.00 62.06 Fatigue 19 511 49.76 9.93 32.88 36.45 42.82 50.01 56.95 61.55 65.64 Upper Extremity Function (Fine motor, ADL)
20 1095 45.12 10.85 27.28 31.05 37.42 45.10 57.00 57.00 57.00
Lower Extremity Function (Mobility) 19 1046 47.03 9.91 30.54 33.96 39.77 46.83 54.30 62.39 62.39 Cognitive Function 28 1009 50.09 10.23 35.03 37.56 41.75 49.85 57.65 64.59 67.9 Emotional and Behavioral Dyscontrol 18 511 49.88 9.67 34.09 38.17 43.49 49.57 56.23 62.28 64.81 Positive Affect and Well-being 23 513 51.28 9.82 36.03 38.78 45.69 51.80 57.67 63.17 68.32 Sleep Disturbance 8 1087 49.98 9.21 35.71 38.04 43.61 49.81 56.27 61.69 65.18 Ability to Participate in Social Roles and Activities
45 549 50.43 9.56 36.10 38.62 42.79 49.04 58.58 64.91 64.91
Satisfaction with Social Roles and Activities
45 549 50.42 9.52 36.06 38.31 42.81 49.23 58.74 63.94 63.94
Stigma 24 511 49.70 9.47 35.62 35.62 41.68 50.49 56.48 61.37 64.39 T-score means, standard deviations and T-scores by percentile are computed for the calibration sample to describe this sample.
121

Table 73. Pediatrics Neuro-QoL Item Bank Standard Error and Reliability by T-scores
Neuro-QoL Item Bank N T-Scores 10 20 30 40 50 60 70 80 90
Cognitive Function 507 SE 12.16 3.87 1.76 1.68 1.82 3.04 10.55 37.03 124.5 Reliability 0.00 0.85 0.97 0.97 0.97 0.91 0.00 0.00 0.00
Anxiety 513 SE 10.0 9.7 8.1 3.8 1.4 1.3 1.3 2.6 7.1 Reliability 0.01 0.06 0.35 0.86 0.98 0.98 0.98 0.93 0.50
Depression 513 SE 9.8 8.9 6.3 3.0 1.3 1.4 1.3 3.0 7.9 Reliability 0.04 0.21 0.61 0.91 0.98 0.98 0.98 0.91 0.38
Fatigue (11-item version)
507 SE 62.01 23.06 9.52 4.28 2.05 1.81 1.82 3.51 11.93 Reliability 0.00 0.00 0.09 0.82 0.96 0.97 0.97 0.88 0.00
Fatigue (13-item version)
507 SE 38.93 16.65 7.71 3.92 2.02 1.77 1.78 3.27 8.49 Reliability 0.00 0.00 0.41 0.85 0.96 0.97 0.97 0.89 0.28
Pain 171 SE 10.0 10.0 9.8 5.7 1.8 1.5 1.7 5.5 9.8 Reliability 0.00 0.00 0.04 0.67 0.97 0.98 0.97 0.70 0.05
Stigma 168 SE 10.0 9.9 8.4 3.4 1.5 1.4 1.7 4.2 8.9 Reliability 0.00 0.02 0.30 0.89 0.98 0.98 0.97 0.83 0.20
Social relations – Interaction with Peers
513 SE 5.4 2.4 1.5 1.7 1.6 2.8 6.8 9.5 9.9 Reliability 0.71 0.94 0.98 0.97 0.97 0.92 0.54 0.11 0.01
Anger 513 SE 10.0 10.0 8.9 3.4 1.5 1.8 1.5 4.7 9.4 Reliability 0.00 0.01 0.22 0.88 0.98 0.97 0.98 0.78 0.11
Note: Higher scores indicate more of that domain. A T-Score distribution has a mean of 50 and standard deviation of 10. SE is on the T-score metric and computed based on the Fisher information conditional on T-score. Reliability is approximated based on the conditional SE.
122

Table 74 – Neuro-QoL Pediatric Item Bank Calibration Sample T-Score Means and Standard Deviations, and Distributions by Percentile
Item Bank # Items N Mean SD P5 P10 P25 P50 P75 P90 P95 Cognitive Function 14 171 50.00 9.69 33.93 37.53 42.4 50.05 56.86 62.4 66.45 Anxiety 19 513 49.89 9.61 35.15 35.15 42.25 49.62 55.72 63.56 66.15 Depression 17 513 49.88 9.68 32.01 36.77 43.31 49.63 56.98 62.40 65.85 Fatigue (11-item version)
11 507 50.00 9.57 33.59 38.15 43.11 49.92 57.26 62.0 64.99
Fatigue (13-item version)
13 507 50.00 9.62 31.64 36.19 43.09 49.96 57.26 61.93 65.12
Pain 10 171 49.68 9.21 38.53 38.53 39.25 49.46 56.23 61.56 64.17 Stigma 18 168 49.55 9.51 35.11 35.11 42.71 49.26 54.84 59.77 68.11 Social relations – Interaction with Peers
16 513 50.09 9.68 35.50 38.04 43.38 49.28 56.52 63.54 67.12
Anger 8 513 49.91 9.59 35.61 35.61 43.33 49.91 57.31 61.55 66.17 T-score means, standard deviations and T-scores by percentile are computed for the calibration sample to describe this sample.
123

Figures
Figure 1. Precision of the item banks across the measurement continuum compared to sample distribution. Area in blue represents the range with a reliability ≥ 95% while the area in yellow represents the range with of reliability between 0.9 and 0.95. Figure 1a. Depression
Figure 1b. Anxiety
Figure 1c. Anger
Figure 1d. Interaction with Peer
Figure 1e. Cognition
Figure 1f. Fatigue
Figure 1g. Pain
Figure 1h. Stigma
NOTE: Precision information is not available for “Upper Extremity (ADL)” and “Lower Extremity (Mobility)” scales as these scales cannot be calibrated using IRT analyses.
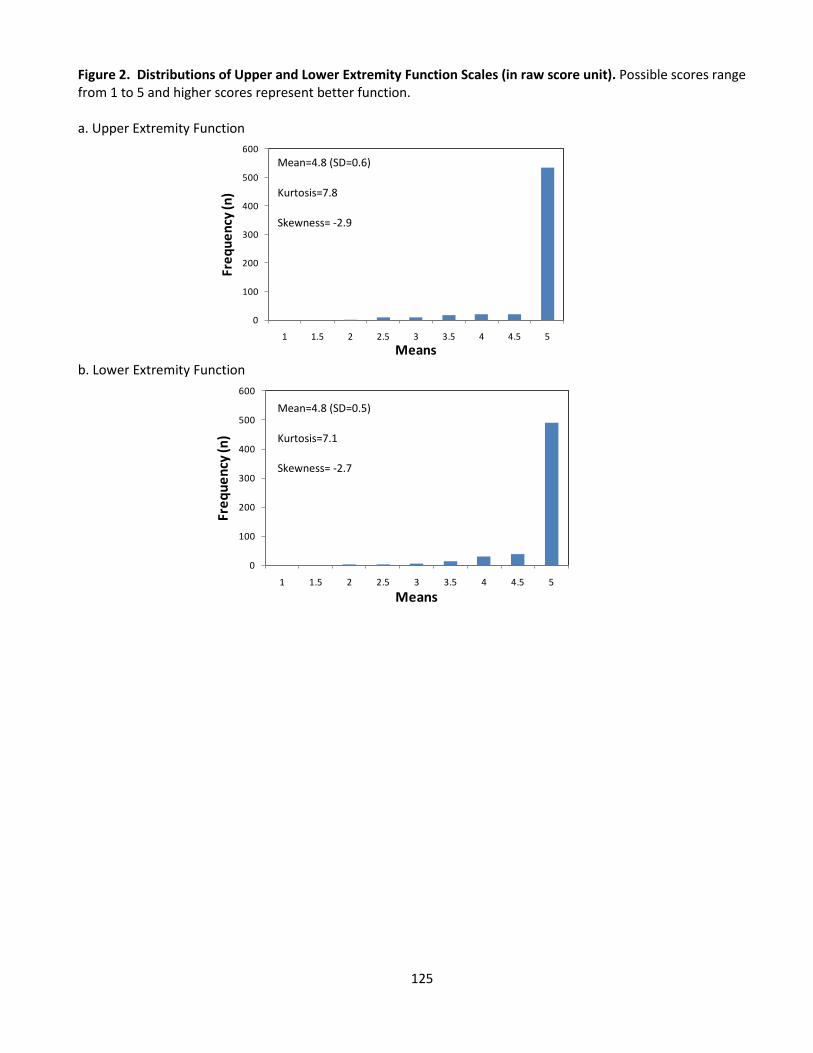
Figure 2. Distributions of Upper and Lower Extremity Function Scales (in raw score unit). Possible scores range from 1 to 5 and higher scores represent better function. a. Upper Extremity Function
b. Lower Extremity Function
0
100
200
300
400
500
600
1 1.5 2 2.5 3 3.5 4 4.5 5
Freq
uenc
y (n
)
Means
0
100
200
300
400
500
600
1 1.5 2 2.5 3 3.5 4 4.5 5
Freq
uenc
y (n
)
Means
Mean=4.8 (SD=0.6)
Kurtosis=7.8
Skewness= -2.9
Mean=4.8 (SD=0.5)
Kurtosis=7.1
Skewness= -2.7
125

126
APPENDIX B - Neuro-QoL Technical Report Version 1.0
127

Neuro-QOL Technical Report
Item Bank Development and
Item Response Theory Statistics
September 28, 2010
Submitted to the
National Institute of Neurological Disorders and Stroke (NINDS) on behalf of the
Neuro-QOL investigators Neuro-QOL is the Quality of Life in Neurological Disorders Measurement System Please cite as follows: Neuro-QOL Technical Report, September 28, 2010: www.neuroqol.org Do not cite or distribute without permission from Dr. David Cella, Principal Investigator.

APPENDIX B- Neuro-QoL Technical Report Version 1.0
Overview
The National Institute of Neurological Disorders and Stroke (NINDS) funded Neuro-QOL to create a clinically-relevant and psychometrically-robust health-related quality of life (HRQL) assessment tool for both adults and children. The specific goals of Neuro-QOL include: (1) the development of a core set of questions that address dimensions of HRQL that are universal to patients with chronic neurological diseases, (2) the development of supplemental questions that address HRQL concerns specific to particular groups of patients based on disease status and other sociodemographic variables such as age and ethnicity, and (3) to create a publically available, adaptable and sustainable system, which allows clinical researchers to have access to a common item repository and computerized adaptive testing (CAT). The measures are intended to be responsive to the needs of researchers that are working with a variety of neurological disorders across a wide range of settings, which enables the facilitation of comparisons of data across clinical trials that focus on disparate diseases. The Neuro-QOL items, item banks, and scales are the result of a rigorous development process that included literature review, qualitative and cognitive interviewing, general population and clinical population testing, and state-of-the-art item response theory (IRT) analyses. The purpose of this Technical Report is to provide the reader with information about the methodology used to create Neuro-QOL, and to provide addition psychometric information for the items, scales, and banks that are included in Neuro-QOL.
Development of item banks
Based on our assessment of the needs of NINDS-funded researchers, Neuro-QOL focused on five adult conditions (stroke, multiple sclerosis, Parkinson’s disease, epilepsy, and amyotrophic lateral sclerosis [ALS]) and two pediatric conditions (epilepsy and muscular dystrophy). The Neuro-QOL item banks and scales were created using a rigorous set of steps, which were guided by best practices, such as those used in the National Institutes of Health (NIH) Patient-Reported Outcomes Management Information System (PROMIS) initiative, 1-5as well as guidance from the Food and Drug Administration on the creation of patient-reported outcomes to be used in clinical trials, which in turn are used to support label claims for medications and other medical interventions.6 There were six phases of item development: 1) identification of extant items, using a systematic search for existing questions in currently available scales, 2) item classification and selection, 3) item review and revision by trained professionals who reviewed the wording of each question and revised them in accord with conventions adopted by the Neuro-QOL group, 4) focus group input on domain coverage to confirm domain definitions and to identify new areas of item development for future item banks, 5) cognitive interviews with patients to assess their understanding of individual items, and 6) final revision before field testing. Questions that survived this process were field tested and evaluated for use in Neuro-QOL. Beyond these 6 steps, psychometric analyses were used to further refine the sets of Neuro-QOL items that are recommended for further use. The list of adult and pediatric Neuro-QOL domains is listed in Tables 1 and 2, respectively.
129

APPENDIX B- Neuro-QoL Technical Report Version 1.0
Neuro-QOL investigators and expert consultants identified candidate instruments and items via literature searches and previous item banking projects. (e.g., PROMIS; Cella, et al.2010) 2 Our team created an item library, which included information on the time frame of the response requested, the exact wording of the item stem and response options, and any context (e.g., specific instructions) for the respondent to consider when answering questions. For each domain, the investigative team constructed a comprehensive item pool. Some items included in the Neuro-QOL library are from the NIH PROMIS and the Activity Measure for Post Acute Care.7 Teams of three or more domain experts then assigned items to the Neuro-QOL domains through an iterative, multi-step process. We then organized items into domains, sub-domains, factors, and facets, and then reviewed items to determine if they should proceed through detailed item review, revision, and testing. Once all items were assigned to a domain area, content experts systematically removed items from individual pools. Content experts removed items when there was apparent semantic redundancy. In these cases, we selected the item that was more consistent with the concept definition, or the item that was clearest. Some items in development were found to lack cultural relevance or sensitivity, to lack gender neutrality, to be difficult to translate, or to exhibit excessive disease specificity. We discarded these items. Items that survived this initial review underwent a subsequent, more thorough review, which was conducted by two scientists appointed as co-chairs of the content domain, we well as additional, independent content experts. We also revised the majority of the items to ensure general consistency across banks, to assure comprehensiveness in measuring the domain, to ensure clear, understandable and precise language, to easily facilitate linguistic translation, and to maintain adaptability to the data collection and analysis strategies planned. Teams of domain experts reviewed and synthesized findings to make further decisions about which items to carry forward in testing. Final item pools were reviewed by 63 patients with neurological disorders using telephone-based cognitive interviews in English and Spanish to assess the content validity of items, clarify concepts, and refine language and response options. During interviews, patients reviewed each item in individual semi-structured interviews that focused on item comprehension and relevance. Patients and experts also identified areas for new item development, for which additional items were written or revised. For children, cognitive interviews were conducted with individuals aged 10-18. Overall, the primary goal was to use the data to better understand the dimensional structure of items that specifically pertained to the various domain areas of Neuro-QOL. Additionally, the results informed the revision of items in the item pools and facilitated new item development prior to the first wave of testing.
Sampling and Pilot Testing Adult samples A complete discussion of the development and testing of adult items is discussed in Gershon et al.,8 Neuro-QOL data collection occurred in two waves from January 31, 2008 to March 10, 2008 for Wave 1a clinical samples for domains targeted to certain neurological conditions and from September 11, 2008 to September 24, 2008 for the Wave 1b U.S. general population sample, and from January 15, 2009 to January 30, 2010 for Wave 2 validation testing. The sampling plan facilitated obtaining item calibrations for the different domain areas, estimating profile scores for varied subgroups, confirming factor structure, and conducting item and bank analyses. We had over 500 candidate items, so participants could not respond to all of the items. We estimated that participants would respond to four questions per minute, with the maximum number of items administered for each respondent approximately 150. This led to a response time on average of 37 minutes. For Wave 1a, the response data were collected by YouGovPolimetrix (www.polimetrix.com). Their standard respondent pool for an internet-based survey is taken from a predetermined panel of people who typically respond to the company’s online surveys. Chosen panelists receive modest compensation (under a $10 value) for their participation. Wave 1b data was collected through Greenfield Online, which is also an online paneling organization,
130

APPENDIX B- Neuro-QoL Technical Report Version 1.0
who offers a similar service to YouGovPolimetrix. Greenfield Online was chosen for Wave 1b because their services proved more economical for this particular sample and they use a similar method to YouGovPolimetrix. All participants completed a socio-demographic form consisting of approximately 20 auxiliary items that measured global health perceptions, and socio-demographic variables including age, gender, race/ethnicity, relationship status, educational attainment, and employment status, income, number of hospitalizations, disability days, use of prescription medication, height, weight,. In addition, participants answered a series of health questions about the presence and degree of limitations as they related to multiple neurological conditions affecting adults including stroke, multiple sclerosis, Parkinson’s disease, epilepsy and ALS. For some calibrations, we combined data from multiple samples to overcome difficulties associated with infrequent responses to items and stability of parameter estimates in Item Response Theory models. The nature of adult calibration samples is listed in Table 3. Pediatric samples A complete discussion of the development and testing of pediatric items is discussed in Lai et al.9 Generic domains (emotional health, social health and physical health) were field tested on samples drawn from the U.S. pediatric general population whereas targeted domains (stigma, fatigue, pain and cognition) were field tested on children with either epilepsy or muscular dystrophy. This was done because the generic item pools could be feasibly answered by a person without a medical condition, whereas the targeted item pools are typically symptoms or side effects of a disease process. We recruited the samples from internet panel companies: Greenfield Online (www.greenfield.com) and YouGovPolimetrix (www.polimetrix.com) for the US general population and clinical samples, respectively. Similar recruitment strategies were used by these two companies. Specifically, companies sent e-mails to invite parents of potential participants from their database to participate in the field testing. Potential participants were screened by the companies via internet to ensure their eligibility (i.e., English-speaking, ages of 10-18, and for disease related domains, with a diagnosis of either epilepsy or muscular dystrophy). After parents signed an online consent on behalf of their children, parents were asked to complete a series of sociodemographic and clinical information questions (for disease samples only) and children then completed appropriate Neuro-QOL items. Because of the difficulty in recruiting children with epilepsy and muscular dystrophy via a panel company, we also recruited eligible patients from epilepsy clinics at Children’s Memorial Hospital (Chicago, IL), NorthShore University HealthSystem (Evanston, Illinois) and the University of California at Davis Medical Center. One exception is the physical health related domains – Upper Extremity function (Fine motor, ADL) and Lower Extremity function (Mobility). Items written in these two domains were targeted to children with moderate to severe limitations seen in rehabilitation clinics, so we also tested these items in clinical samples in order to minimize floor effects. Procedures similar to those used by the online panel companies were implemented, except that paper versions of the informed consent and assent forms were used by research staff. After informed consent was obtained from parents of children and assent was obtained from children aged 12 and older, parents completed the demographic and clinical information (clinical sample only) and children completed the Neuro-QOL items. Table 4 presents the nature of the pediatric calibration samples.
131

APPENDIX B- Neuro-QoL Technical Report Version 1.0
Table 1 – Neuro-QOL Domains for Adults
Phys
ical
Func
tion/
Heal
th
Upper Extremity Function – Fine Motor, ADL (Bank) One's ability to carry out various activities involving digital, manual and reach-related functions, ranging from fine motor to self-care (activities of daily living) Lower Extremity Function – Mobility (Bank) One's ability to carry out various activities involving the trunk region and increasing degrees of bodily movement, ambulation, balance or endurance. Bowel/Bladder Function (Item Pool) Functional problems related to storage and emptying, such as incontinence or constipation, urgency, leakage and discomfort. Sexual Function (Item Pool) A person's overall evaluation of, satisfaction with and quality of sexual activities, including interest, discomfort, functioning and ability to achieve orgasm.
Sym
ptom
s
Fatigue (Bank) Sensations ranging from tiredness to an overwhelming, debilitating and sustained sense of exhaustion that decreases one’s capacity for physical, functional, social and mental activities. Sleep Disturbance (Bank) Perceptions of sleep quality, sleep depth, and restoration associated with sleep; perceived difficulties with getting to sleep or staying asleep; and perceptions of the adequacy of and satisfaction with sleep.
Men
tal Em
otio
nal H
ealth
Depression (Bank) Experience of loss and feelings of hopelessness, negative mood (e.g., sadness, guilt), decrease in positive affect (e.g., loss of interest), information-processing deficits (e.g., problems in decision-making), negative views of the self (e.g., self-criticism, worthlessness), and negative social cognition (e.g., loneliness). Anxiety (Bank) Unpleasant thoughts and/or feelings related to fear (e.g., fearfulness, feelings of panic), helplessness, worry and hyperarousal (e.g., tension, nervousness, restlessness).
Stigma (Bank) Perceptions of self and publically enacted negativity, prejudice and discrimination as a result disease-related manifestations. Positive Affect and Well-Being (Bank) Aspects of a person’s life that relate to a sense of well-being, life satisfaction or an overall sense of purpose and meaning. Emotional and Behavioral Dyscontrol (Bank) A set of disease and/or treatment related manifestations including disinhibition, emotional lability, irritability, impatience, and impulsiveness. End of Life Concerns (Item Pool) Issues and concerns that emerge at the end of one's life (including basic functioning across physical, social, emotional, cognitive and existential domains, as well as overall satisfaction with care and symptom palliation)
Cogn
itive
Hea
lth
Applied Cognition- General Concerns (Bank) Perceived difficulties in everyday cognitive abilities such as memory, attention, and decision making. Applied Cognition- Executive Function (Bank) Perceived difficulties in applications of mental function related to planning, organizing, calculating, working with memory and learning. Communication Difficulty (Pool) Perceived difficulties related to oral expression, language production, articulation, comprehension and organization.
Soci
al
Ability to Participate in Social Roles and Activities (Bank) Degree of involvement in one’s usual social roles, activities and responsibilities, including work, family, friends and leisure Satisfaction with Social Roles and Activities (Bank) Satisfaction with involvement in one's usual social roles, activities and responsibilities, including work, family, friends and leisure
132

APPENDIX B- Neuro-QoL Technical Report Version 1.0
Table 2 – Neuro-QOL Domains for Pediatric Populations
Phys
ical
Func
tion/
Heal
th Upper Extremity Function – Fine Motor, ADL (Bank)
One's ability to carry out various activities involving digital, manual and reach-related functions, ranging from fine motor to self-care (activities of daily living) Lower Extremity Function – Mobility (Bank) One's ability to carry out various activities involving the trunk region and increasing degrees of bodily movement, ambulation, balance or endurance.
Sym
ptom
s
Fatigue (Bank) Sensations ranging from tiredness to an overwhelming, debilitating and sustained sense of exhaustion that decreases one’s capacity for physical, functional, social and mental activities. Pain (Bank) An unpleasant sensory or emotional experience associated with actual or potential tissue damage, or described in terms of such damage. Conceptually divided into components of quality (e.g. the nature, characteristics, intensity, frequency, and duration of pain), behaviors (e.g. verbal and nonverbal actions that communicate pain to others) and interference (e.g. impact of pain on physical, mental, and social activities).
Men
tal
Emot
iona
l Hea
lth
Depression (Bank) Experience of loss and feelings of hopelessness, negative mood (e.g., sadness, guilt), decrease in positive affect (e.g., loss of interest), information-processing deficits (e.g., problems in decision-making), negative views of the self (e.g., self-criticism, worthlessness), and negative social cognition (e.g., loneliness). Anxiety (Bank) Unpleasant thoughts and/or feelings related to fear (e.g., fearfulness, feelings of panic), helplessness, worry and hyperarousal (e.g., tension, nervousness, restlessness). Stigma (Bank) Perceptions of self and publically enacted negativity, prejudice and discrimination as a result disease-related manifestations. Anger Angry mood (e.g., irritability, frustration), verbal aggression, and efforts to control anger.
Cogn
itive
He
alth
Applied Cognition- General Concerns (Bank) Perceived difficulties in everyday cognitive abilities such as memory, attention, concentration, processing speed and organization skill.
Soci
al H
ealth
Social Relations – Interaction with Peers (Bank) Degree of involvement with one's peers in usual social roles, activities and responsibilities Social Relations – Interaction with Adults (Bank) Degree of involvement with adults in one’s usual social roles, activities and responsibilities
133

APPENDIX B- Neuro-QoL Technical Report Version 1.0
Table 3 – Calibration samples for adult items Sub-domain Status Calibration Sample
Upper Extremity Function - Fine Motor, ADL Item bank Wave 1b (General Population) +
Wave 2
Lower Extremity Function - Mobility Item bank Wave 1b (General Population) +
Wave 2 Urinary/Bladder Function Item pool – Not tested Not tested Bowel Function Item pool – Not tested Not tested Sexual Function Item pool – Not tested Not tested Fatigue Item bank Wave 1a Sleep Disturbance Item bank Wave 1a + Wave 2 ( Depression Item bank Wave 1b (General Population) Anxiety Item bank Wave 1b (General Population)1 Stigma Item bank Wave 1a Positive Affect and Well-Being Item bank Wave 1b Emotional and Behavioral Dyscontrol Item bank Wave 1a End of Life Concerns Item pool – Not tested Not tested
Applied Cognition- General Concerns Item bank Wave 1b (General Population) +
Wave 2
Applied Cognition- Executive Function Item bank Wave 1b (General Population) +
Wave 2 Communication Item pool Not calibrated Ability to Participate in Social Roles and Activities
Item bank Wave 1b
Satisfaction with Social Roles and Activities Item bank Wave 1b Sample sizes: Note: Some participants were dropped from some IRT analyses due to missing data. Wave 1a; N = 553 clinical participants (stroke, n = 209; epilepsy, n = 183; multiple sclerosis, n = 84; Parkinson’s, n = 59; ALS, n = 18) Wave 1b; Participants were divided into four groups (A-D). Group A completed the Ability to Participate in Social Roles and Activities and Satisfaction with Social Roles and Activities items, N = 549. Group B completed Lower Extremity (Mobility) items and the Upper Extremity (Fine Motor, ADL) items, N = 518. Group C completed the Positive Affect and Well-Being, Depression, and Anxiety items, N = 513. Group D completed the Applied Cognition – General Concerns items, N = 533. Wave 2; N = 581 clinical participants (stroke, n = 101 ; epilepsy, n = 119; multiple sclerosis, n = 161; Parkinson’s, n = 120; ALS, n =80)
134
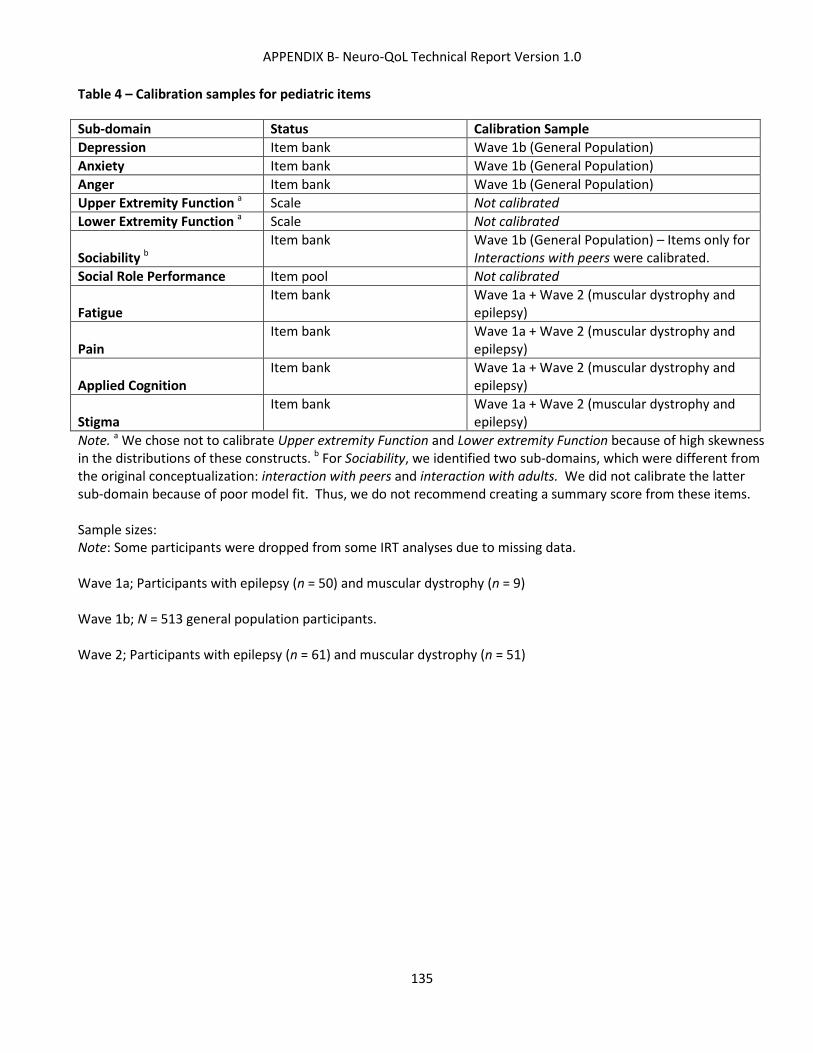
APPENDIX B- Neuro-QoL Technical Report Version 1.0
Table 4 – Calibration samples for pediatric items Sub-domain Status Calibration Sample Depression Item bank Wave 1b (General Population) Anxiety Item bank Wave 1b (General Population) Anger Item bank Wave 1b (General Population) Upper Extremity Function a Scale Not calibrated Lower Extremity Function a Scale Not calibrated
Sociability b Item bank Wave 1b (General Population) – Items only for
Interactions with peers were calibrated. Social Role Performance Item pool Not calibrated
Fatigue Item bank Wave 1a + Wave 2 (muscular dystrophy and
epilepsy)
Pain Item bank Wave 1a + Wave 2 (muscular dystrophy and
epilepsy)
Applied Cognition Item bank Wave 1a + Wave 2 (muscular dystrophy and
epilepsy)
Stigma Item bank Wave 1a + Wave 2 (muscular dystrophy and
epilepsy) Note. a We chose not to calibrate Upper extremity Function and Lower extremity Function because of high skewness in the distributions of these constructs. b For Sociability, we identified two sub-domains, which were different from the original conceptualization: interaction with peers and interaction with adults. We did not calibrate the latter sub-domain because of poor model fit. Thus, we do not recommend creating a summary score from these items. Sample sizes: Note: Some participants were dropped from some IRT analyses due to missing data. Wave 1a; Participants with epilepsy (n = 50) and muscular dystrophy (n = 9) Wave 1b; N = 513 general population participants. Wave 2; Participants with epilepsy (n = 61) and muscular dystrophy (n = 51)
135

APPENDIX B- Neuro-QoL Technical Report Version 1.0
Item Statistics Item response theory: An overview. IRT is based on the notion that a person’s response to a test item is a function of that person’s location on a latent trait. 10 The relationship between performance on an item and a latent trait is described by a mathematical function, which is known as an item characteristic curve. In IRT, the probability of responding to an item in a particular way (e.g., responding “1” for “Never” on a Neuro-QOL item) is a function of the person’s level of the latent trait. For most of IRT models, there were five parameters calculated per item: an item slope parameter and four threshold parameters. There number of threshold parameters is equal to the number of response options minus one. The item slope parameter indicates how well an item can discriminate between difference levels of a construct. For that reason, it is sometimes known as a discrimination parameter. 11 The threshold parameter is related to a point on a continuum at which a person is more likely than not to endorse an item in a particular way. A threshold parameter is sometimes referred to as a difficulty parameter because in some analyses they are related to how difficult it is for the items to be endorsed in a particularly way. The predicted probability of responding to an item in a particular way is determined by a person’s level on a latent trait, as well as the slope and threshold parameters. During our data-analytic phase, we used a process of iterative analysis and discussion with content domain experts, item-by-item level decisions were made as to whether an individual item should be: (1) calibrated and included in the bank, (2) not calibrated but retained for possible future calibration (e.g., items consistent with the domain being measured but having local dependence, responses concentrated in few of the available response options), or (3) excluded from further consideration (e.g. outside of concept; problematic item wording). All models were fit assuming unidimensionality, without local dependence between other items in the bank. Item response theory models used in Neuro-QOL. Neuro-QOL psychometricians calibrated each item bank using IRT. Calibration refers to fitting the items into an IRT model such that its item slope and threshold parameters are estimated. The calibrated item parameters can then be used to underlie computer adaptive tests and inform the creation of short forms. The final Neuro-QOL item banks were calibrated using IRT modeling depending on the sample size. For adults and pediatric generic domains, Samejima’s (1997) graded response model was used. For pediatric targeted domains where sample size was less than 200, a 1-PL IRT model was used, in which a common slope parameter was estimated for all items. All IRT analyses were conducted using MULTILOG. Before fitting IRT models, we examined datasets by examining descriptive statistics such as frequencies and means, as well as statistics based on classical psychometric analyses such as corrected item-total correlations. We also evaluated data quality by assessing an item’s response distribution, including a search for out-of-range values. We test IRT model assumptions (monotonicity, unidimensionality/local independence) and model fit (using S-G2 & S-X2) and made modifications to our models as needed. Tables 3 and 4 present information about the calibration samples for adults and pediatrics, respectively. The tables in the Appendix present the calibrated Neuro-QOL item banks, as well as the list of items that were retained but not calibrated, and the items that were excluded altogether. Items were excluded based on psychometric analyses and the judgment of content experts. In addition to the calibrated item banks, there are additional sets of items grouped into item pools for bowel/bladder function, sexual function, end- of- life concerns, communication difficulty, and interaction with adults (pediatric). Items that met requirements of unidimensionality, but do not fit an IRT model, are treated as “scales” rather than calibrated item banks. The distinction is that whereas a scale can be summed to obtain a total summary score, a calibrated bank can be administered using an array of different short forms, including CAT, to produce a summary score on the same, common metric. Examples of uncalibrated scales include pediatric upper extremity function and pediatric lower extremity function. Assessment of unidimensionality. For each item pool, we strove to compile lists of items that measured a single construct consistent with the definition of content experts. We conducted formal tests of whether our item pools measured a single dimension. The challenge of dimensionality assessment is to develop approaches to assess
136

APPENDIX B- Neuro-QoL Technical Report Version 1.0
whether a scale has a strong enough general factor so that it is essentially unidimensional. Essential dimensionality (e.g., McDonald, 1981) is defined as the degree to which a test score is influenced by a common factor underlying an item set. No complex item set will ever perfectly meet strictly defined unidimensionality assumptions (see McDonald, 1981); therefore, we sought to confirm that the trait level estimates are predominantly influenced by a general factor. Unidimensionality was examined for each item bank using confirmatory factor analysis guided by fit statistics as well as conceptual input from domain experts. As part of our confirmatory factor analyses, we also assessed local dependence, which refers to covariation between two or more items not accounted for by the unidimensional IRT model. Local dependence was assessed by examining the residual correlations between items and then assessing the consequences for model fit when including vs. excluding potentially redundant items. Differential item functioning. An item displays differential item functioning (DIF) when the probabilities of responding in different categories differ by population for the same underlying level of the attribute. Items were evaluated for DIF by contrasting the IRT parameters across a variety of demographic groups. IRT-based hierarchical ordinal logistic regression (OLR) approach as implemented in LORDIF12 was used for evaluation of DIF. In this approach a series of logistic models predicting the probability of item response were run and compared. The independent variables in Model 1 are the trait estimate (e.g., raw scale score), group and the interaction between group and trait. Model 2 included main effects of trait and group, and Model 3 included only the trait estimate. Non-uniform DIF was detected if there was a statistically significant difference in the likelihood for Model 1 and Model 2, and uniform DIF is evident if there is a significant difference in the likelihoods for Models 2 and 3. Items flagged for DIF were further discussed before making a final decision with regard to inclusion vs. exclusion.
Neuro-QOL Field Testing and Clinical Validation Our second phase of field testing was conducted from January 2009 through June 2010. The purpose was to evaluate the reliability, validity and responsiveness of Neuro-QOL short forms and scales in clinical neurology populations. A total of 581 adult and 113 pediatric patients were recruited to reflect the five adult and two pediatric neurological conditions targeted by Neuro-QOL. Proxies for stroke (N = 84) and the two pediatric samples (N = 113) also completed forms. Administration of Neuro-QOL Short Forms and clinical validation measures (both cross-disease and disease-specific), physician ratings and chart review was conducted at baseline and at a 180-day follow up (to assess responsiveness). Test-retest reliability of the Neuro-QOL Short Forms was evaluated at 7 days. Table 5 lists the number of patients with each respective neurological condition (and proxies) who completed each assessment.
137
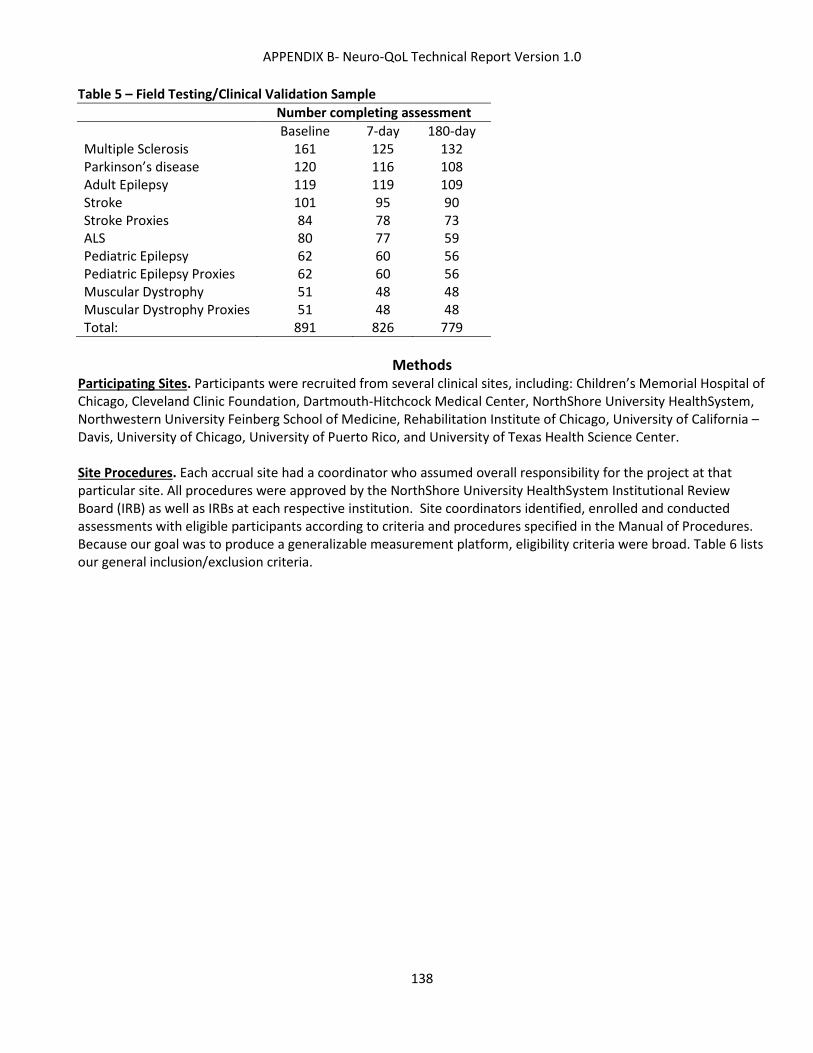
APPENDIX B- Neuro-QoL Technical Report Version 1.0
Table 5 – Field Testing/Clinical Validation Sample Number completing assessment
Baseline 7-day 180-day
Multiple Sclerosis 161 125 132 Parkinson’s disease 120 116 108 Adult Epilepsy 119 119 109 Stroke 101 95 90 Stroke Proxies 84 78 73 ALS 80 77 59 Pediatric Epilepsy 62 60 56 Pediatric Epilepsy Proxies 62 60 56 Muscular Dystrophy 51 48 48 Muscular Dystrophy Proxies 51 48 48 Total: 891 826 779
Methods
Participating Sites. Participants were recruited from several clinical sites, including: Children’s Memorial Hospital of Chicago, Cleveland Clinic Foundation, Dartmouth-Hitchcock Medical Center, NorthShore University HealthSystem, Northwestern University Feinberg School of Medicine, Rehabilitation Institute of Chicago, University of California – Davis, University of Chicago, University of Puerto Rico, and University of Texas Health Science Center. Site Procedures. Each accrual site had a coordinator who assumed overall responsibility for the project at that particular site. All procedures were approved by the NorthShore University HealthSystem Institutional Review Board (IRB) as well as IRBs at each respective institution. Site coordinators identified, enrolled and conducted assessments with eligible participants according to criteria and procedures specified in the Manual of Procedures. Because our goal was to produce a generalizable measurement platform, eligibility criteria were broad. Table 6 lists our general inclusion/exclusion criteria.
138

APPENDIX B- Neuro-QoL Technical Report Version 1.0
Table 6. Clinical ValidationSample Inclusion/Exclusion Criteria
INCLUSION CRITERIA EXCLUSION CRITERIA
Group Age Gender Language
Diagnosed Neurological Condition Proxy
Children
Epilepsy: 10-18 MD: 10-21* Proportional
breakdown of males and females according to incidence rates of respective conditions
English
Epilepsy, Muscular Dystrophy
Proxies (primary care givers) of children with epilepsy or muscular dystrophy
• Younger/older than age limits • Non-English speaking • Cognitive impairment that
would prevent informed consent and/or completion of test items with the assistance of an interviewer (as determined by recruiting staff).
• Does not have a proxy (for
adults with stroke or children with epilepsy or muscular dystrophy) Adults >18 English
Stroke, MS, ALS, Parkinson's Disease, Epilepsy
Proxies of patients with stroke
*Due to the nature and developmental impact of muscular dystrophy, participants may be ≤21 years of age to meet eligibility requirements. Additional, disease-specific exclusion criteria were: presence of non-epileptic seizures for epilepsy, and being non-community dwelling for stroke. Recruitment and Testing. Various recruitment methods were utilized including: 1) approaching patients in clinics and 2) mailing letters of invitation to physician-identified patients informing them that someone would contact them about the study at their next clinic appointment. Informed consent or assent (for pediatric participants) was obtained from each subject and covered all three assessments (baseline, 7 days, and 180 days). There was a 5-9 day window for the test-retest assessment and a 5-7 month window for the responsiveness assessment. After a patient was identified and approached, the site coordinator arranged a meeting to introduce and describe the study, confirm eligibility, explain participants’ rights, and obtain informed consent and HIPPA authorization if the eligible participant was interested. Site personnel then either administered the baseline evaluation at that time or else scheduled it for another time. Baseline evaluations, consisting of Neuro-QOL instruments, concurrent validity measures, and sociodemographic and clinical data forms, lasted approximately 90 minutes. Some measures, including the Neuro-QOL instruments, were administered by Computer Assisted Self Interview. Other measures were administered by study staff (e.g., performance-based cognitive measures). Medical professional ratings and chart review were also conducted at baseline and as part of the 180-day follow up. Participants were reimbursed according to local IRB-approved standards.
139

APPENDIX B- Neuro-QoL Technical Report Version 1.0
Measures General Forms Socio-demographic form. This form provides patient characteristics (e.g., age, gender, race, ethnicity and education). This information was collected at baseline via chart review and/or face-to-face interview. Clinical information form. This form records disease specific information (e.g., date of diagnosis, treatments) for each participant. It was gathered via chart review and through interviews with patients and/or parents at baseline and 180-day follow-up interviews. Neuro-QOL Short Forms All short forms provided raw scores which were converted to T-Scores; with a T = 50 indicating average function compared to the reference population and a standard deviation of 10. Neuro-QOL T-scores referenced to a general population sample are indicated by GPT (General Population T-Score) while those referenced to a clinical sample are indicated by CT (Clinical T-Score). General Function – Adults Only Barthel Index. The Barthel Index was developed by Mahoney and Barthel13 and is one of the best known and most widely used instruments to assess basic activities of daily living (ADL). The Barthel Index assesses the degree of independence a patient has in performing various self-care and mobility ADL tasks. The weighted ordinal scale assesses 10 items of ADL in the following subgroups: personal care (including eating), dressing, personal hygiene and bathing, continence of urine and stool, mobility (including transfer from a bed and toilet), walking, and steps. The index has high test-retest reliability (r=0.89), inter-rater reliability (r>0.95),(Granger, Albrecht, & Hamilton, 1979) and internal consistency (Cronbach’s alpha = 0.98).(Shinar et al., 1987) We administered this by standardized interview. Instrumental Activities of Daily Living Scale. The Lawton Instrumental Activities of Daily Living Scale,14is an interviewer administered measure which includes 8 items: telephoning, shopping, food preparation, housekeeping, laundry, transportation, medications, and handling finances. Each task is graduated in a 3- or 4-level scale. The scale measures performance in contrast to ability. General Function – Adults and Children Karnofsky Performance Status Scale (KPSS). 15 The KPSS is a rating of functional impairment and offers a simple if coarse breakdown of activity level across patients regardless of diagnosis. KPSS criteria are based on descriptive categories from 0-100. Ratings were made by providers. Cognitive Function – Adults and Children Oral Digit Symbol Modalities. 16 This is a test of speed of information processing, but is also thought to assess visual acuity and figural memory. A timed coding task using a key as reference, examinees pair specific numbers (0-9) with designated geometric figures that are matched up in the key; examinees attempt to complete as many matches as quickly as possible in 90 seconds. Written and oral forms are highly correlated (in normal adults >.78). Because some participants may have greater motor deficits compared to others, we administered the oral version. Symbol Search.17 A test of mental speed, this is a timed orthographic measure of visual attention, scanning, and motor speed. Participants must determine if a target nonsense figure is present in a string of figures and mark a corresponding “yes” or “no” box presented at the end of each item.
140

APPENDIX B- Neuro-QoL Technical Report Version 1.0
Digit Symbol Coding. 17 This is a timed paper/pencil symbol substitution task of mental, visual and motor speed. Using a key of paired numbers and symbols, participants must draw corresponding nonsense symbols below rows of numbers. Health Related Quality of Life – Adults (including proxies) and Children EQ-5D.18,19 This is a 15-item self-report measure of health status developed by the EuroQoL Group in order to provide a simple, generic measure of HRQL for clinical and economic appraisal. Applicable to a wide range of health conditions and treatments, it provides a simple descriptive profile and a single index value for health status. Domains include: mobility, self-care, usual activities, pain/discomfort and anxiety/depression. PROMIS Global Health Scale. 20 Global health refers to evaluations of health in general rather than specific elements of health. The PROMIS global health items include global ratings of the five primary PROMIS domains (physical function, fatigue, pain, emotional distress, social health) and general health perceptions that cut across domains. It can be scored into a Global Physical Health component and Global Mental Health component. Global items allow respondents to weigh together different aspects of health to arrive at a ‘bottom-line” indicator of their health status. Global health items have been found to be consistently predictive of important future events such as health care utilization and mortality. Global HRQL Question. 21A single item from the Functional Assessment of Chronic Illness Therapy (FACIT), “I am content with the quality of my life right now,” was used as a global measure of quality of life. Health Related Quality of Life – Children and Pediatric proxies Pediatric Quality of Life Inventory, Multidimensional Fatigue Scale (PedsQL™-MFS) 22,23 The PedsQL - MFS is a self-report measure consisting of both a general quality of life measure (PedsQLTM) and a fatigue specific measure (MFS). The PedsQLTM is designed to measure core health dimensions in children from 2 to 18 years old. The measure consists of 23 items in four scales: physical functioning, emotional functioning, social functioning, and school functioning. Children/Teens completed a self-report assessment. Proxies completed the parent/caregiver form. The MFS consists of 18 items across three domains: general fatigue (6 items), sleep/rest fatigue (6 items), and cognitive fatigue (6 items). Pain – Adults (including proxies) and Children Pain question. A single (0-10) item that asks patients to rate, from “none” (0) to “the worst pain you can think of (“10”), the severity of their worst pain during the past week. Responsiveness – Adults and Children Karnofsky Performance Status Scale (KPSS). 15Described above. Global rating of change. This measurement strategy assumes that a patient can judge whether over the course of a specified period, their self-reported health status has changed. Typically, such questions require patients to remember a prior health state and compare it to how they are currently feeling.24,25 In this study, participants were asked to rate how much their Physical, Emotional, Cognitive, Social/Family and Symptomatic Well-being and their overall quality of life had changed over the past 6 months according to the following scale: +3 = “Very much better” to -3 = “Very much worse”. Such global transition ratings have the advantage of being easy to interpret and they enhance the interpretability of HRQL scores when found to be correlated with the target instrument. For instance, if the correlation between a global rating of change and the change score on a target instrument is over 0.5, the validity of the target instrument is supported. Global transition ratings have been widely used in HRQL outcome assessments to augment the interpretation of HRQL scores. 26-28 Proxies completed a proxy version of this measure.
141

APPENDIX B- Neuro-QoL Technical Report Version 1.0
Statistical Analyses The following analyses were conducted for all clinical groups.
7. Means, standard deviations, and other distributional statistics were calculated for all scores at the baseline and follow-up assessments.
8. Internal consistency reliability - Internal consistency analyses were performed for each short form using Cronbach’s alpha coefficients.
9. Test-retest reliability - Intraclass correlation coefficients and corresponding 95% confidence intervals were calculated to assess the test-retest reliability of the Neuro-QOL measures using the baseline and 7-day assessments.
10. Concurrent validity was assessed at baseline by Spearman rho correlations between Neuro-QOL short forms and disease-specific and cross-disease measures.
11. Known groups validity was evaluated at baseline by comparing mean Neuro-QOL short form scores between patients grouped by clinical anchors such as disease severity. Analysis of variance (ANOVA) was used to test for differences between groups. Effect sizes (mean difference / pooled standard deviation) were calculated to aid in interpretation of group differences.
12. Responsiveness -To demonstrate the sensitivity of the Neuro-QOL measures for detection of change, we evaluated general linear models using each patient's change score. We conducted responsiveness analyses on the Neuro-QOL banks using several criteria for change. One criterion used across all adult conditions was the Karnofsky Performance Status, and another was the self-reported Global Rating of Change (GRC) described above. Here we report the results from the GRC-based change. Beginning with the 7-level GRC (range: +3= very much better; 0 = about the same; -3 = very much worse), we collapsed the three “better” categories into one, and the three “worse” categories into one, leaving three categories (“better;” “about the same;” “worse”). These three categories were compared using one-way analysis of variance followed by least significant difference testing of adjacent groups when the overall F statistic was significant. For each analysis, we required that at least 5 patients be represented in each of these three categories. If fewer than five patients were represented in a category, it was collapsed with the adjacent category and the two remaining groups were compared using a t-test. There were six GRC questions. Five of them queried patients specifically about change in Physical well-being, Cognitive Well-Being, Emotional well-being, Social/Family Well-being, and Disease-related Symptoms. The sixth GRC item asked about overall quality of life. The list below indicates which of the 13 adult item bank change scores were compared across GRC categories:
Physical well-being: Upper Extremity and Lower Extremity Function; Fatigue; Sleep Disturbance Cognitive well-being: Applied Cognition (General Concerns and Executive Function) Emotional well-being: Depression; Anxiety; Stigma; Positive Affect and Well-Being; Emotional and Behavioral Dyscontrol Social well-being: Social Function (Ability to Participate in Social Roles and Activities and Satisfaction with Social Roles and Activities); Stigma Symptoms: Fatigue; Sleep Disturbance; Emotional and Behavioral Dyscontrol; Depression; Anxiety Overall: ALL
This resulted in 32 planned comparisons for adult clinical validation sample (no adjustment made for multiple comparisons). Results for these responsiveness analyses are presented below. Only those that achieved statistical significance will be summarized.
142

APPENDIX B- Neuro-QoL Technical Report Version 1.0
Disease-specific Measures and Results
STROKE
Disease-Specific Measures Stroke Specific Quality of Life (SS-QOL) scale.(Williams, Weinberger, Harris, Clark, & Biller, 1999) The SSQOL is a 49 item self-report measure containing domains of energy, family roles, language, mobility, mood, personality, self-care, social roles, thinking, vision, upper extremity function and work-productivity. Items are scored on a 5-point Likert scale. Although relatively new, initial psychometric properties are good. The American Heart Association Stroke Outcome Classification (AHA.SOC). 29,30The AHA.SOC score provides a mechanism to comprehensively document stroke impairments and disabilities in a single summary stroke score. The system can be used by healthcare providers to reliably assess recovery, measure responses to treatment, and describe the long-term impact of stroke on survivors. Results Sample characteristics. 101 subjects were recruited from 5 centers. Participants were primarily male (55%), white (73%), and non-Hispanic (90%) with average age=59 years (SD=14). Fifty-seven percent were married, 73% had a high school or greater education. Thirteen percent were retired, 33% on disability and 19% were employed either full or part time. Average time post-stroke was 5.4 years (SD=5), with 22% reporting no or minimal deficits, 58% mild/moderate deficits and 20% severe deficits. The primary stroke type was an infarction (71%). As shown in Table 7, respondents reported worse cognitive and physical function and social well-being than the general population reference group, but more positive affect and well-being. When compared to a clinical reference group, they reported less depression, fatigue and sleep disturbance, better emotional and behavior control and average stigma. Reliability: Table 7 shows that the internal consistency and 1 week test-retest reliability of the short forms is high, with Cronbach’s alphas ranging from .78 to .95 and ICCs ranging from .73 to .94.
143

APPENDIX B- Neuro-QoL Technical Report Version 1.0
Table 7. Descriptive and reliability statistics for Neuro-QOL short form T-scores
*For these banks, a high score indicates better function; for all other banks a high score indicates worse function **Time 1 (baseline) vs. Time 2 (7 days) M GPT – Mean General Population T-Score; MCT- Mean Clinical T-Score Validity: Table 8 shows Spearman rho correlations between Neuro-QOL short form T-scores and stroke specific measures. Table 9 presents Spearman rho correlations between Neuro-QOL short form T-Scores and cross-disease measures. Table 8. Correlations for Neuro-QOL short form T-scores with stroke-specific measures
*p < .05; **p < .01; ***p < .001
Neuro-QOL Short Form Nitems Npersons M GPT MCT SD α T-R ICCs** Positive Affect & Well Being* 9 100 54.92 8.02 .94 .83 Applied Cognition – General Concerns* 8 100 43.70 8.58 .95 .82 Applied Cognition – Executive Function* 8 101 43.67 10.48 .93 .88 Lower Extremity (Mobility)* 8 89 42.73 7.98 .87 .94 Upper Extremity (Fine Motor, ADL)* 8 101 38.45 9.38 .82 .88 Ability to Participate in Social Roles and Activities*
8 100 46.08 7.09 .93 .87
Satisfaction with Social Roles and Activities*
8 100 45.30 5.49 .83 .73
Depression 8 100 47.23 7.48 .94 .81 Anxiety 8 100 50.82 6.61 .90 .76 Stigma 8 100 52.24 8.52 .91 .82 Fatigue 8 100 45.03 8.78 .93 .83 Sleep Disturbance 8 99 46.33 8.25 .78 .76 Emotional and Behavioral Dyscontrol 8 99 45.58 8.47 .89 .79
Neuro-QOL Short Form AHA SOC Number of Neurological Domains
Impaired
AHA SOC Severity of Impairment
AHA SOC Level of Function
SS-QOL Total Score
Positive Affect & Well Being -.17 -.28** -.33*** .61*** Applied Cognition – General Concerns -.19 -.31** -.17 .62***
Applied Cognition – Executive Function -.36*** -.34*** -.28** .51***
Lower Extremity (Mobility) -.23* -.48*** -.44*** .69*** Upper Extremity (Fine Motor, ADL) -.33*** -.60*** .54*** .65***
Ability to Participate in Social Roles and Activities -.34*** -.40*** -.44*** .72***
Satisfaction with Social Roles and Activities -.18 -.35*** -.39*** .66***
Depression .19 .30** .36*** -.66*** Anxiety .14 .13 .09 -.53*** Stigma .28** .40*** .35*** -.59*** Fatigue .06 .16 .27** -.59*** Sleep Disturbance .09 .17 .17 -.50*** Emotional and Behavioral Dyscontrol .11 .18 .10 -.54***
144

APPENDIX B- Neuro-QoL Technical Report Version 1.0
Table 9. Correlations for Neuro-QOL short form T-scores with cross-disease measures
*p < .05; **p < .01; ***p < .001
Neuro-QOL Short Form
Barthel Index
Lawton IADL Scale
Symbol Digit Modalities #
Correct
Symbol Search
Raw Score
Digit Symbol
Coding # Correct
PROMIS Global
Physical
PROMIS Global Mental
Pain Scale (0-10)
EQ-5D Index Score
Global HRQL (0-4)
Positive Affect & Well Being
.36*** .24* .28** .23* .14 .46*** .66*** -.26** .38*** .52***
Applied Cognition – General Concerns
.29** .29** .16 .14 .12 .18 .41*** -.11 .25* .26**
Applied Cognition – Executive Function
.25* .34*** .34*** .31** .28** .26* .46*** -.18 .35*** .28**
Lower Extremity Function -Mobility
.66*** .44*** .35*** .38*** .32** .62*** .33** -.36*** .62*** .42***
Upper Extremity -Fine Motor, ADL
.65*** .42*** .34*** .38*** .35*** .47*** .38*** -.16 .59*** .36***
Ability to Participate in Social Roles and Activities
.44*** .43*** .21* .22* .17 .56*** .58*** -.30** .54*** .48***
Satisfaction with Social Roles and Activities
.45*** .31*** .22* .26* .21* .56*** .49*** -.43*** .55*** .49***
Depression -.39*** -.21* -.20 -.24* -.04 -.48*** -.66*** .34*** -.46*** -.49*** Anxiety -.17 -.15 -.01 -.03 .10 -.39*** -.55*** .31** -.31** -.36*** Stigma -.35*** -.20* -.18 -.20 -.14 -.31** -.45*** .24* -.32*** -.52*** Fatigue -.43*** -.30** -.22* -.26* -.03 -.63*** -.49*** .36*** -.38*** -.38*** Sleep Disturbance -.22* -.12 -.21* -.22* -.09 -.39*** -.40 .27** -.24* -.34*** Emotional and Behavioral Dyscontrol
-.19 -.05 -.05 -.03 .05 -.25* -.48*** .22* -.29** -.41***
145

APPENDIX B- Neuro-QoL Technical Report Version 1.0
Known groups validity: AHA severity level was used to split the sample into 3 groups: no/minimal neurological deficit; mild/moderate neurological deficit; severe neurological deficit. These groups differed significantly on all Neuro-QOL short forms except Anxiety, Fatigue, Sleep Disturbance and Emotional and Behavioral Dyscontrol. Effect sizes ranged from -.68 to 2.55. Responsiveness: Of the 32 planned comparisons, 15 were statistically significant and one exhibited a trend toward significance, in the predicted direction. Physical Well-Being: Of the four planned comparisons [Lower Extremity Function-Mobility, Upper Extremity Function - Fine Motor, ADL, Fatigue, and Sleep Disturbance] three were statistically significant, all in the predicted direction. Specifically, significant differences were observed in Lower Extremity Function – Mobility between patients who reported worsening at six months with those who reported improving in this domain (F=6.11, p<.01). Similarly, significant differences were observed in Upper Extremity Function - Fine Motor, ADL (F=6.83, p<.01) and Sleep Disturbance (F=4.08, p<.05) between patients who reported worsening at six months and those who reported staying the same or improving in this domain. Social/Family Well-Being: Of the three planned comparisons [Ability to Participate in Social Roles and Activities, Satisfaction with Social Roles and Activities, Stigma] all three were statistically significant in the predicted direction. Specifically, significant differences were observed in Ability to Participate in Social Roles and Activities (F=3.76, p<.05) and Stigma (F=6.67, p<.01) among patients who reported staying the same or improving in these domains. Similarly, significant differences were observed in Satisfaction with Social Roles and Activities (F=5.86, p<.01) between patients who reported worsening at six months and those who reported staying the same or improving in this domain. Emotional Well-Being: Of the five planned comparisons [Depression, Anxiety, Emotional and Behavioral Dyscontrol, Stigma, Positive Affect and Well-being] four were statistically significant, all in the predicted direction. Specifically, statistically significant differences were observed between patients who reported worse Anxiety at six months with those who reported the same levels in this domain (F=3.42; p<.05). Similarly, significant differences were observed in Depression (F=13.53, p<.01), Stigma (F=6.88, p<.01) and Positive Affect and Well-being (F=6.35, p<.01) between patients who reported worsening at six months and those who reported staying the same or improving in these domains. Cognitive Well-Being: Of the two planned comparisons [Applied Cognition – General Concerns, Applied Cognition – Executive Function] neither short form exhibited statistically significant changes or trends toward significance over time. Symptomatic Well-Being: Of the five planned comparisons [Fatigue, Sleep Disturbance, Emotional and Behavioral Dyscontrol, Depression, Anxiety] one was statistically significant in the predicted direction. Specifically, differences were observed in Sleep Disturbance at six months between patients who reported worsening, staying the same and improving in this domain (F=3.49; p<.05). Overall Quality of Life: Of the thirteen planned comparisons [all Neuro-QOL short forms] one exhibited a trend toward significance, and four were statistically significant, all in the predicted direction. Specifically, a trend toward statistical significance was observed between patients who reported worse Sleep Disturbance at six months with those who reported staying the same or improving in these domains (F=5.45, p<.01). In addition, statistically significant differences were observed between patients who reported worse Depression (F=8.28, p<.01), Stigma (F=4.44, p<.01), Positive Affect and Well-being (F=2.98, p=.06) and Lower Extremity Function – Mobility (F=4.02, p=.02) at six months with those who reported staying the same or improving in these domains.
146

APPENDIX B- Neuro-QoL Technical Report Version 1.0
Conclusions The validity of the Neuro-QOL measures for adults with stroke is supported with satisfactory internal
consistency, test-retest reliability and significant correlations with many external validity measures. All Neuro-QOL short forms except Applied Cognition (Executive Function and General Concerns) were
responsive to self-reported change in conceptually-related aspects of well-being.
147

APPENDIX B- Neuro-QoL Technical Report Version 1.0
AMYOTROPHIC LATERAL SCLEROSIS (ALS) Disease-specific measures Amyotrophic Lateral Sclerosis Assessment Scale (ALSAQ31-33) The ALSAQ is comprised of 40 items across 5 subscales tapping the major domains affected by ALS. The subscales include physical mobility, activities of daily living, eating and drinking, communication and emotional functioning. All 40 items can also be summed together to obtain a total score for ALS QOL. Recently, the scale authors published data on the score differences that might be considered to meaningfully differentiate between subgroups or within groups of subjects over time.34 This makes the ALSAQ particularly valuable for evaluating the convergent validity and responsiveness of the Neuro-QOL item banks. Amyotrophic Lateral Sclerosis Functional Rating Scale-Revised (ALSFRS-R 35). The original scale, the ALSFRS, has 10 items that assess activities of daily living, such as speech, swallowing, handwriting, and dressing and hygiene that are specifically affected by the disease. In 1999, three additional items were added to better assess respiratory function. Both the original and revised versions have been used successfully as clinical trial outcome measures.36 Because of the importance of respiratory problems in the ALS population, we administered the 12-item ALSFRS-R. Results Sample characteristics: Participants (N=80) were primarily male (65%), white (94%), and non-Hispanic (98%) with average age=59 years (SD=12.3). Seventy-six percent were married, 46% had a college or advanced degree. Thirty-one percent were retired, 33% on disability, 17% were employed full- and 6% were employed part time. Average time since diagnosis was 2.0 years (SD=3.6). The mean ALSFRS-R score = 32.0 (SD=8.6) with range = 8-48. Mean T-Scores and standard deviations on the short forms are shown in Table 10. ALS patients reported significantly worse physical and social function compared to a general population reference group but similar cognitive function and more positive affect. When compared to a clinical neurological reference group, they showed greater stigma, less sleep disturbance, fatigue, depression, and emotional and behavioral dyscontrol and similar anxiety. Reliability: Internal consistency and 1 week test-retest reliability of the short forms is shown in Table 10. Cronbach’s alphas range from .80 to .96 and ICCs from .49 to .93.
148
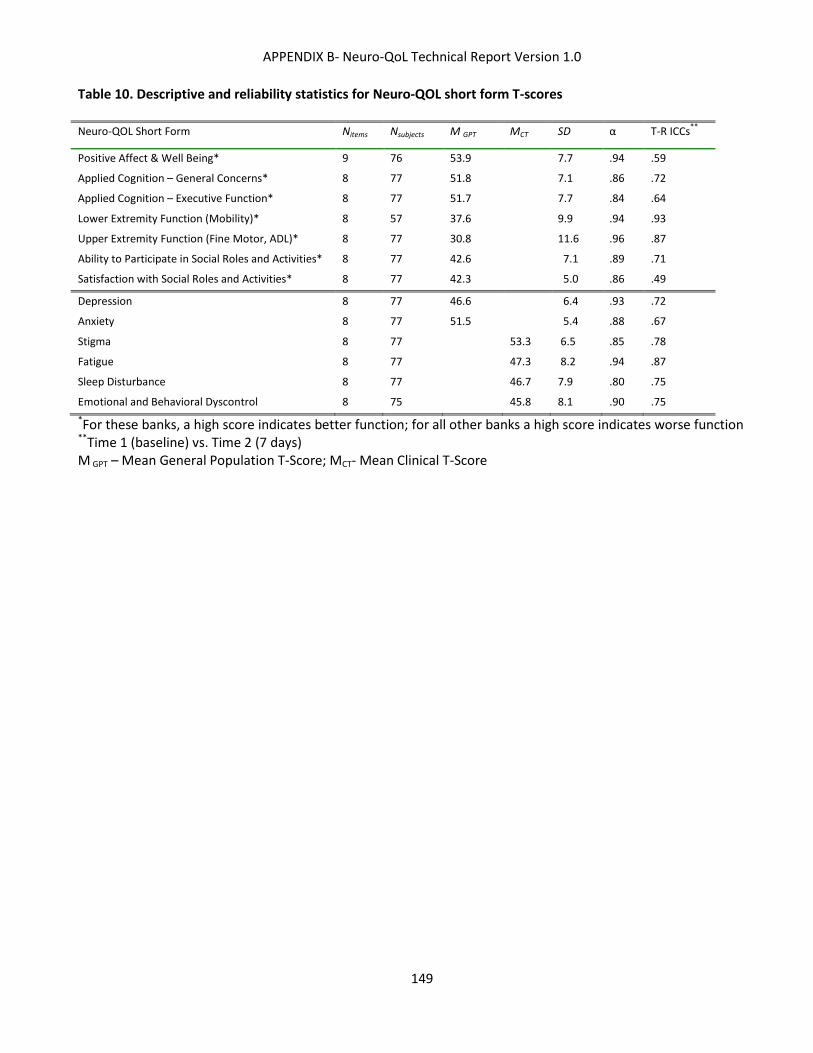
APPENDIX B- Neuro-QoL Technical Report Version 1.0
Table 10. Descriptive and reliability statistics for Neuro-QOL short form T-scores Neuro-QOL Short Form Nitems Nsubjects M GPT MCT SD α T-R ICCs**
Positive Affect & Well Being* 9 76 53.9 7.7 .94 .59
Applied Cognition – General Concerns* 8 77 51.8 7.1 .86 .72
Applied Cognition – Executive Function* 8 77 51.7 7.7 .84 .64
Lower Extremity Function (Mobility)* 8 57 37.6 9.9 .94 .93
Upper Extremity Function (Fine Motor, ADL)* 8 77 30.8 11.6 .96 .87
Ability to Participate in Social Roles and Activities* 8 77 42.6 7.1 .89 .71
Satisfaction with Social Roles and Activities* 8 77 42.3 5.0 .86 .49
Depression 8 77 46.6 6.4 .93 .72
Anxiety 8 77 51.5 5.4 .88 .67
Stigma 8 77 53.3 6.5 .85 .78
Fatigue 8 77 47.3 8.2 .94 .87
Sleep Disturbance 8 77 46.7 7.9 .80 .75
Emotional and Behavioral Dyscontrol 8 75 45.8 8.1 .90 .75 *For these banks, a high score indicates better function; for all other banks a high score indicates worse function **Time 1 (baseline) vs. Time 2 (7 days) M GPT – Mean General Population T-Score; MCT- Mean Clinical T-Score
149

APPENDIX B- Neuro-QoL Technical Report Version 1.0
Validity: Table 11 shows Spearman rho correlations between Neuro-QOL short form T-scores and ALS specific measures. Table 8 presents Spearman rho correlations between Neuro-QOL short form T-Scores and cross-disease measures. Table 11. Correlations for Neuro-QOL short form T-scores with ALS-specific measures
*p < .05; **p < .01; ***p < .001
ALSAQ ALSFRS-R
Symbol Digit Modalities
ADL
Communica-
tion
Emotional
functioning
Eating & drinking
Physical Mobility
Total
Bulbar
Fine
Motor
Gross Motor
Respiratory
Depression -.01 .03 .04 .76*** .04 .23 .21 .09 .13 .18 .15 Anxiety .08 .14 -.04 .53*** .04 .24 .09 .04 -.02 .02 .21 Stigma .03 .20 .42*** .51*** .37** .11 -.17 -.34 -.20 0.0 .06 Positive Affect & Well-being .11 0.0 .04 -.66*** .05 -.18 -.21 -.11 -.22 -.12 .04 Applied Cognition- General Concerns .51*** -.10 -.20 -.36** -.24 .01 -.02 .10 -.06 -.14 -.03 Applied Cognition – Executive Functioning
.51***
-.17
-.18
-.17
-.28
.05
.08
.17
.10
-.09
.05
Lower Extremity Function - Mobility .05 -.67*** -.05 -.34 0.0 -.65*** .33 -.04 .34 .66*** .07 Upper Extremity Function - Fine motor, ADL .15 -.88*** -.21 -.14 -.25 -.43*** .66*** .24 .79*** .54*** .13 Ability to participate in social roles & activities .10 -.55*** -.19 -.44*** -.09 -.41*** .30* .07 .28 .31* .13 Satisfaction with social roles & activities .16 -.43*** -.18 -.50*** -.07 -.52*** .24 .07 .21 .30* .13 Fatigue 0.0 .06 .13 .49*** .16 .06 .10 -.03 .11 .15 .01 Sleep Disturbance -.24 .12 .14 .35* .24 0.0 .03 -.11 .04 .21 .04 Emotional & Behavioral Dyscontrol .01 .23 -.06 .34* -.11 .37** -.03 .03 -.12 .10 0.13 Sleep Disturbance -.24 .12 .14 .35* .24 0.0 .03 -.11 .04 .21 .04 Emotional & Behavioral Dyscontrol .01 .23 -.06 .34* -.11 .37** -.03 .03 -.12 .10 0.13
150

APPENDIX B- Neuro-QoL Technical Report Version 1.0
Table 12. Correlations for Neuro-QOL short form T-scores with cross-disease measures Neuro-QOL Short Form Barthel
Index Lawton
IADL Scale KPSS EQ-5D
Index Score
PROMIS Mental
Health T-Score
PROMIS Physical Function T-
Score
Global HRQL (0-4)
Pain Scale (0-10)
Depression .08 -.06 .004 -.18 -.67*** -.31** -.53*** .27*
Anxiety -.07 -.14 -.15 -.29 -.49*** -.35** -.33** .29*
Stigma -.15 -.22 -.08 -.28 -.39*** -.25* -.08 .16
Positive Affect & Well Being -.14 .07 -.05 .12 .68*** .32** .55*** -.22
Applied Cognition – General Concerns
.03 -.13 .09 .17 .29 .11 .13 -.38***
Applied Cognition – Executive Function
.07 .08 .17 .17 .21 .07 .07 -.15
Lower Extremity Function - Mobility
.64*** .54*** .55*** .59*** .27 .66*** .16 .10
Upper Extremity Function - Fine Motor, ADL
.76*** .58*** .7*** .69*** .14 .37 .02 .03
Ability to Participate in Social Roles and Activities
.38*** .42*** .47*** .51*** .48*** .63*** .47*** -.15
Satisfaction with Social Roles and Activities
.40*** .41*** .41*** .48*** .47*** .63*** .36** -.23*
Fatigue .14 -.04 -.05 -.02 -.46*** -.32** -.34** .20
Sleep Disturbance .04 .05 -.1 -.12 -.4*** -.22 -.26* .44***
Emotional and Behavioral Dyscontrol
-.12 -.13 -.16 -.28 -.37** -.24* -.23* .26*
*p < .05; **p < .01; ***p < .001
151

APPENDIX B- Neuro-QoL Technical Report Version 1.0
Known groups validity: In the baseline assessment, the extent to which ALS patients agreed with the statement "I am content with my quality of life right now" was significantly associated with the following Neuro-QOL short forms: Depression, Anxiety, Positive psychological functioning, Social role - participation, Social role - satisfaction, and Fatigue. The corresponding effect sizes ranged from .22 to 2.86. Responsiveness: Of the 32 planned comparisons, 4 were statistically significant and 1 exhibited a trend toward significance, all in the predicted direction.
Physical Well-being: Of the four planned comparisons, one was significant. Specifically, patients who reported a worsening of their physical well-being showed significantly worse Upper Extremity Function scores than those who reported no change (t=2.17; p<.05).
Cognitive Well-being: Of the two planned comparisons, one was significant. Patients with worsening cognitive well-being reported significantly worsening executive function compared to those who did not have a change in cognitive well-being (t=3.22; p<.01). Emotional Well-being: Of the five planned comparisons, one was significant. Patients who reported decreasing emotional well-being showed increased scores on the Depression Short Form (F=3.30; p<.05). Social/Family Well-being: Of the three planned comparisons, none were significant. Symptomatic Well-being: Of the five planned comparisons, none were significant. Overall Quality of Life: Of the thirteen planned comparisons, one was significant and one approached significance. Specifically, patients who reported a decrease in overall quality of life also showed significant worsening of upper extremity function (t=3.17; p<.05) and a trend toward increasing fatigue (t=-1.68; p<.10 Conclusions:
• The study sample represented a wide range of functioning, similar to an ALS clinic population • Internal consistency was high for 11, and adequate for 2, of the 13 Neuro-QOL scales • The Intraclass Correlation Coefficients (ICC) ranged from .49 (satisfaction with social roles) to .94
(mobility), suggesting that further evaluation of test-retest reliability is warranted in some cases. • Convergent and discriminant validity appear to be excellent, with correlations of the expected strength and
in the expected direction • Several Neuro-QOL short forms (Upper Extremity Function, Applied Cognitive –Executive Function, and
Depression) demonstrated responsiveness to self-reported change. The remaining short forms did not.
152
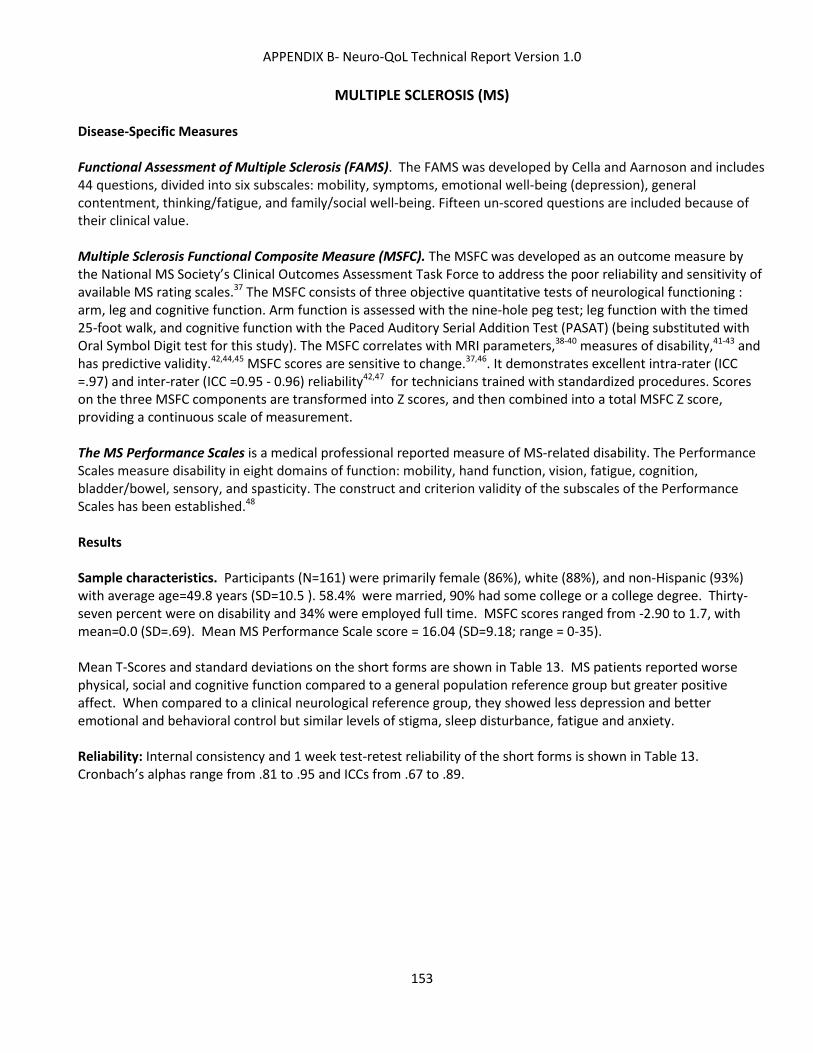
APPENDIX B- Neuro-QoL Technical Report Version 1.0
MULTIPLE SCLEROSIS (MS) Disease-Specific Measures Functional Assessment of Multiple Sclerosis (FAMS). The FAMS was developed by Cella and Aarnoson and includes 44 questions, divided into six subscales: mobility, symptoms, emotional well-being (depression), general contentment, thinking/fatigue, and family/social well-being. Fifteen un-scored questions are included because of their clinical value. Multiple Sclerosis Functional Composite Measure (MSFC). The MSFC was developed as an outcome measure by the National MS Society’s Clinical Outcomes Assessment Task Force to address the poor reliability and sensitivity of available MS rating scales.37 The MSFC consists of three objective quantitative tests of neurological functioning : arm, leg and cognitive function. Arm function is assessed with the nine-hole peg test; leg function with the timed 25-foot walk, and cognitive function with the Paced Auditory Serial Addition Test (PASAT) (being substituted with Oral Symbol Digit test for this study). The MSFC correlates with MRI parameters,38-40 measures of disability,41-43 and has predictive validity.42,44,45 MSFC scores are sensitive to change.37,46. It demonstrates excellent intra-rater (ICC =.97) and inter-rater (ICC =0.95 - 0.96) reliability42,47 for technicians trained with standardized procedures. Scores on the three MSFC components are transformed into Z scores, and then combined into a total MSFC Z score, providing a continuous scale of measurement. The MS Performance Scales is a medical professional reported measure of MS-related disability. The Performance Scales measure disability in eight domains of function: mobility, hand function, vision, fatigue, cognition, bladder/bowel, sensory, and spasticity. The construct and criterion validity of the subscales of the Performance Scales has been established.48 Results Sample characteristics. Participants (N=161) were primarily female (86%), white (88%), and non-Hispanic (93%) with average age=49.8 years (SD=10.5 ). 58.4% were married, 90% had some college or a college degree. Thirty-seven percent were on disability and 34% were employed full time. MSFC scores ranged from -2.90 to 1.7, with mean=0.0 (SD=.69). Mean MS Performance Scale score = 16.04 (SD=9.18; range = 0-35). Mean T-Scores and standard deviations on the short forms are shown in Table 13. MS patients reported worse physical, social and cognitive function compared to a general population reference group but greater positive affect. When compared to a clinical neurological reference group, they showed less depression and better emotional and behavioral control but similar levels of stigma, sleep disturbance, fatigue and anxiety. Reliability: Internal consistency and 1 week test-retest reliability of the short forms is shown in Table 13. Cronbach’s alphas range from .81 to .95 and ICCs from .67 to .89.
153

APPENDIX B- Neuro-QoL Technical Report Version 1.0
Table 13. Descriptive and reliability statistics for Neuro-QOL short form T-scores
*For these banks, a high score indicates better function; for all other banks a high score indicates worse function **Time 1 (baseline) vs. Time 2 (7 days) M GPT – Mean General Population T-Score; MCT- Mean Clinical T-Score
Neuro-QOL Short Form Nitems Npersons M GPT MCT SD α T-R ICCs** Positive Affect & Well Being* 9 161 53.61 7.72 .95 .76 Applied Cognition – General Concerns* 8 161 42.56 8.70 .95 .83 Applied Cognition – Executive Function* 8 161 46.02 9.37 .90 .86 Lower Extremity (Mobility)* 8 149 43.55 9.44 .93 .89 Upper Extremity (Fine Motor, ADL)* 8 161 44.03 9.21 .86 .81 Ability to Participate in Social Roles and Activities* 8 161 46.02 7.43 .95 .73 Satisfaction with Social Roles and Activities* 8 161 44.97 6.07 .89 .76 Depression 8 161 46.69 6.93 .93 .68 Anxiety 8 161 51.32 6.88 .93 .67 Stigma 8 161 49.35 7.23 .86 .69 Fatigue 8 161 48.81 8.52 .95 .80 Sleep Disturbance 8 161 48.50 8.60 .81 .77 Emotional and Behavioral Dyscontrol 8 161 46.78 8.63 .91 .74
154
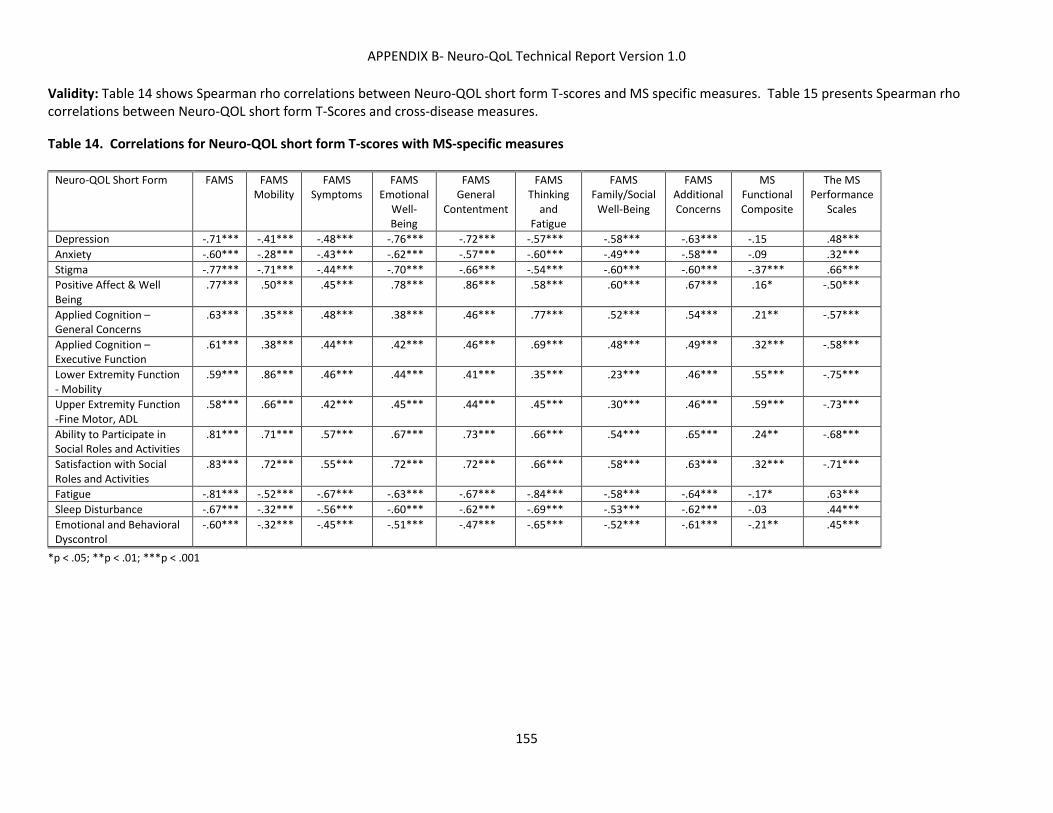
APPENDIX B- Neuro-QoL Technical Report Version 1.0
Validity: Table 14 shows Spearman rho correlations between Neuro-QOL short form T-scores and MS specific measures. Table 15 presents Spearman rho correlations between Neuro-QOL short form T-Scores and cross-disease measures. Table 14. Correlations for Neuro-QOL short form T-scores with MS-specific measures
*p < .05; **p < .01; ***p < .001
Neuro-QOL Short Form FAMS FAMS Mobility
FAMS Symptoms
FAMS Emotional
Well-Being
FAMS General
Contentment
FAMS Thinking
and Fatigue
FAMS Family/Social
Well-Being
FAMS Additional Concerns
MS Functional Composite
The MS Performance
Scales
Depression -.71*** -.41*** -.48*** -.76*** -.72*** -.57*** -.58*** -.63*** -.15 .48*** Anxiety -.60*** -.28*** -.43*** -.62*** -.57*** -.60*** -.49*** -.58*** -.09 .32*** Stigma -.77*** -.71*** -.44*** -.70*** -.66*** -.54*** -.60*** -.60*** -.37*** .66*** Positive Affect & Well Being
.77*** .50*** .45*** .78*** .86*** .58*** .60*** .67*** .16* -.50***
Applied Cognition – General Concerns
.63*** .35*** .48*** .38*** .46*** .77*** .52*** .54*** .21** -.57***
Applied Cognition – Executive Function
.61*** .38*** .44*** .42*** .46*** .69*** .48*** .49*** .32*** -.58***
Lower Extremity Function - Mobility
.59*** .86*** .46*** .44*** .41*** .35*** .23*** .46*** .55*** -.75***
Upper Extremity Function -Fine Motor, ADL
.58*** .66*** .42*** .45*** .44*** .45*** .30*** .46*** .59*** -.73***
Ability to Participate in Social Roles and Activities
.81*** .71*** .57*** .67*** .73*** .66*** .54*** .65*** .24** -.68***
Satisfaction with Social Roles and Activities
.83*** .72*** .55*** .72*** .72*** .66*** .58*** .63*** .32*** -.71***
Fatigue -.81*** -.52*** -.67*** -.63*** -.67*** -.84*** -.58*** -.64*** -.17* .63*** Sleep Disturbance -.67*** -.32*** -.56*** -.60*** -.62*** -.69*** -.53*** -.62*** -.03 .44*** Emotional and Behavioral Dyscontrol
-.60*** -.32*** -.45*** -.51*** -.47*** -.65*** -.52*** -.61*** -.21** .45***
155

APPENDIX B- Neuro-QoL Technical Report Version 1.0
Table 15. Correlations for Neuro-QOL short form T-scores with cross-disease measures
*p = .05; **p = .01; ***p = .001
Neuro-QOL Short Form
Barthel Index
Karnofsky Performance
Scale
Lawton IADL Scale
Symbol Digit
Modalities # Correct
Symbol Search
Raw Score
Digit Symbol
Coding # Correct
PROMIS Physical Function T- Score
PROMIS Mental Health T-Score
Pain Scale (0-10)
EQ-5D Index Score
Global HRQL (0-4)
Depression -.23** -.28*** -.27*** -.05 -.10 -.20* -.54*** -.75*** .42*** -.46*** -.66*** Anxiety -.07 -.15 -.20* -.05 -.04 -.10 -.46*** -.69*** .35*** -.40*** -.52*** Stigma -.45*** -.59*** -.43*** -.17* -.22** -.29*** -.63*** -.60*** .42*** -.56*** -.54*** Positive Affect & Well Being
.22** .28*** .27*** .01 .05 .12 .61*** .81*** -.40*** .48*** .81***
Applied Cognition – General Concerns
.19* .23** .29*** .23** .14 .24** .48*** .58*** -.38*** .49*** .42***
Applied Cognition – Executive Function
.19* .26*** .30*** .34*** .22** .32*** .50*** .56*** -.34*** .44*** .44***
Lower Extremity Function - Mobility
.68*** .80*** .42*** .25** .38*** .50*** .65*** .31*** -.49*** .65*** .35***
Upper Extremity Function - Fine Motor, ADL
.59*** .62*** .51*** .33*** .40*** .53*** .65*** .42*** -.43*** .60*** .36***
Ability to Participate in Social Roles and Activities
.41*** .45*** .39*** .09 .14 .24** .77*** .69*** -.49*** .59*** .71***
Satisfaction with Social Roles and Activities
.47*** .51*** .41*** .13 .17* .28*** .73*** .68*** -.50*** .62*** .68***
Fatigue -.23** -.28*** -.30*** -.05 -.05 -.12 -.72*** -.69*** .46*** -.52*** -.62*** Sleep Disturbance -.14 -.19* -.16* -.01 -.04 -.08 -.59*** -.69*** .44*** -.44*** -.57*** Emotional and Behavioral Dyscontrol
-.16* -.27*** -.27*** -.11 -.06 -.11 -.47*** -.62*** .35*** -.41*** -.44***
156

APPENDIX B- Neuro-QoL Technical Report Version 1.0
Known groups validity: Patients grouped according to MSFC quartile scored significantly differently on all Neuro-QOL SFs, except Anxiety, Depression, and Emotional & Behavioral Dyscontrol, with effect sizes ranging from .47 to 2.15. Responsiveness: Of the 32 planned comparisons, 18 were statistically significant and 3 exhibited a trend toward significance, in the predicted direction.
Physical Well-being: Of the four planned comparisons, one was significant and one exhibited a trend toward significance, both in the predicted direction. Specifically, patients who reported a worsening of their physical well-being showed worsening of scores on Physical Function – Lower Extremity (extended assessment; F=4.36; p<.05) and a trend toward worse fatigue (F=2.36; p<.10).
Cognitive Well-being: Of the two planned comparisons, both were significant and in the predicted direction. Patients who reported worsening cognitive well-being showed worsening of their cognitive function, both in terms of general concerns (F=7.09; p<.01) and executive function (F=4.69; p<.01). Emotional Well-being: Of the five planned comparisons, four were significant and one showed a trend toward significance in the predicted direction. Patients who reported worsening emotional well-being also reported increased depression (F=14.82; p<.0001), anxiety (F=7.28; p<.01) and emotional and behavioral dyscontrol (F=3.19; p<.05) and decreased positive affect and well-being. Patients who reported increased emotional well-being showed a trend toward scoring lower on the Stigma Short Form (F=2.61; p<.10). Social/Family Well-being: Of the three planned comparisons, one was significant. Specifically, patients who reported improved social/family well-being at 6 months also reported decreasing stigma (F=3.21, p<.05). Symptomatic Well-being: Of the five planned comparisons, three were significant. Patients who reported worsened symptomatic well-being showed worsening on the Depression Short Form (F=5.02; p<.01). Patients who reported improved symptomatic well-being showed decreased fatigue (F=6.45; p<.01) and improved emotional and behavioral control (F=3.14; p<.05). Overall Quality of Life: Of the thirteen planned comparisons, seven were significant and one showed a trend toward significance. Patients who reported decreased overall quality of life also showed worsening depression (F=8.99; p<.001), anxiety (F=5.57; p<.05), ability to participate in social roles and activities (F=3.91; p<.05) and a trend toward decreased upper extremity function (F=2.51; p<.10). Conclusions
• The study sample was generally representative of MS clinic populations • The 13 Neuro-QOL scales demonstrated high internal consistency • The Intraclass Correlation Coefficients (ICC) were acceptable, ranging from .67 (anxiety) to .89 (lower
extremity) • Convergent validity with generic and legacy measures was good; correlations were of the expected
strength and direction and short forms discriminated between patients grouped according to disease severity.
• There is some initial evidence for Neuro-QOL short form responsiveness to self-reported change in MS patients, particularly for the short forms assessing emotional and cognitive well-being, where 4 of 5 and 2 of 2 planned comparisons were significant.
157

APPENDIX B- Neuro-QoL Technical Report Version 1.0
PARKINSON’S DISEASE Disease-specific measures Montreal Cognitive Assessment (MoCA). 49 Designed as a rapid screening instrument for mild cognitive dysfunction, it assesses different cognitive domains: attention and concentration, executive functions, memory, language, visuoconstructional skills, conceptual thinking, calculations, and orientation. Scores range from 0-31, with scores below 26 considered abnormal. Parkinson’s disease Questionnaire-39 (PDQ-39). 50,51 The thirty nine items of this self-report measure assess eight dimensions: mobility, activities of daily living, emotional well-being, bodily discomfort, stigma, social support cognition and communication. Scale and summary scores are available, ranging from 0-100, with higher scores indicating greater problems. Unified Parkinson’s Disease Rating Scale (UPDRS).52 The UPDRS is the most widely used measure of disability and impairment associated with PD. It is a composite scale consisting of 4 parts: Mentation, Behavior and Mood (UPDRS mental score); ADLs (UPDRS ADL score), Motor Function (motor score); and Complications of therapy. The first 3 subscales are quantitative five point scales (0-4). The complications of therapy is a yes/no scale. For this study, UPDRS Motor Function scoring was modified as follows: only the most affected side or body part was rated. All ratings were made by physicians or other medical personnel. Hoehn and Yahr staging.53 The Hoehn and Yahr staging consists of 5 disease severity categories ranging from 0.0 (no signs of disease) to 5.0 (wheelchair bound or bedridden unless aided). The staging was obtained through chart review or through direct contact with the patient’s physician or other medical personnel. Patient Health Questionnaire-9 (PHQ-9). 54 This is a 9-item subset of the PHQ, and assesses self-reported depression. The nine items of the PHQ-9 come directly from the nine DSM-IV signs and symptoms of major depression. Results Sample characteristics: Participants were primarily male (62%), white (95%), and non-Hispanic (97%) with average age=65. Seventy-four percent were married, 55% had a college or advanced degree. Fifty-eight percent were retired and 20% were employed either full or part time. Most (76%) were in mild stages of the disease: Hoehn and Yahr 1 (N=19; 16%), 2 (N=72; 60%), 3 (N=23; 19%), 4 (N=6; 5%). Average time since PD diagnosis was 7.1 years. 80% were taking L-Dopa either alone or in combination with other anti-PD medications and 9% reported undergoing prior PD surgery. A majority of patients (55%) were primarily affected on their right side; most experienced no (43%) or little (33%) activity limitation due to motor fluctuations. Mean T-Scores and standard deviations on the Neuro-QOL short forms are shown in Table 16. PD patients reported worse cognitive, physical and social function compared to a general population reference group but more positive affect and well-being. When compared to a clinical neurological population, they showed less sleep disturbance, fatigue and depression and a greater sense of emotional and behavioral control. Reliability: Internal consistency and 1 week test-retest reliability of the short forms is shown in Table 16. Cronbach’s alphas range from .82 to .94 and ICCs from .80 to .89.
158

APPENDIX B- Neuro-QoL Technical Report Version 1.0
Table 16. Descriptive and reliability statistics for Neuro-QOL short form T-scores
*For these banks, a high score indicates better function; for all other banks a high score indicates worse function **Time 1 (baseline) vs. Time 2 (7 days); M GPT – Mean General Population T-Score; MCT- Mean Clinical T-Score
Neuro-QOL Short Form Nitems Npersons MGPT MCT SD α T-R ICCs** Positive Affect & Well Being* 9 120 54.40 7.53 .94 .86 Applied Cognition – General Concerns* 8 120 44.35 7.62 .90 .84 Applied Cognition – Executive Function* 8 120 46.25 8.38 .90 .87 Lower Extremity Function (Mobility)* 8 118 45.80 7.54 .84 .88 Upper Extremity Function (Fine Motor, ADL)* 8 120 42.28 8.34 .82 .84 Ability to Participate in Social Roles and Activities* 8 120 47.85 6.83 .94 .83 Satisfaction with Social Roles and Activities* 8 119 46.21 5.70 .89 .80 Depression 8 119 45.85 6.86 .93 .81 Anxiety 8 120 50.82 6.80 .91 .87 Stigma 8 120 48.39 6.62 .85 .87 Fatigue 8 119 46.04 7.75 .93 .88 Sleep Disturbance 8 120 47.70 7.98 .81 .89 Emotional and Behavioral Dyscontrol 8 120 43.49 8.36 .91 .84
159

APPENDIX B- Neuro-QoL Technical Report Version 1.0
Validity: Spearman rho correlations between the Neuro-QOL short forms and the PD-specific measures are shown in Table 17 and between the Neuro-QOL short forms and the cross-disease instruments in Table 18 Table 17. Correlations for Neuro-QOL short form T-scores with PD-specific measures
PDQ-39 UPDRS****
Neuro-QOL Short Form Mobility ADL EWB Stigma Social support
CI Comm BD Total Part 1 Part 2 Part 3 MoCA Total
PHQ-9 Total
Positive Affect & Well Being -.48*** -.36*** -.56*** -.17 -.45*** -.41*** -.44*** -.18 -.29*** -.30*** -.27** -.07 .17 -.50*** Applied Cognition – General Concerns -.34*** -.35*** -.23* -.17 -.42*** -.49*** -.42*** -.25** -.18 -.29*** -.23** -.24** .20* -.32*** Applied Cognition – Executive Function -.44*** -.37*** -.34*** -.07 -.35*** -.51*** -.42*** -.23* -.31*** -.26** -.32*** -.14 .37*** -.24** Lower Extremity Function - Mobility -.72*** -.61*** -.36*** -.23* -.32*** -.38*** -.41*** -.38*** -.58*** -.22* -.59*** -.14 .04 -.33*** Upper Extremity Function-Fine Motor, ADL
-.46*** -.76*** -.37*** -.35*** -.40*** -.42*** -.41*** -.24** -.34*** -.14 -.44*** -.11 .09 -.27** Ability to Participate in Social Roles and Activities
-.69*** -.46*** -.43*** -.24** -.44*** -.43*** -.55*** -.36*** -.37*** -.37*** -.41*** -.13 .21* -.50*** Satisfaction with Social Roles and Activities
-.62*** -.48*** -.51*** -.29*** -.52*** -.38*** -.50*** -.31*** -.39*** -.30*** -.46*** -.23* .25** -.55*** Depression
.38*** .36*** .68*** .19* .36*** .33*** .35*** .18 .21* .32*** .21* .02 -.13 .47*** Anxiety
.39*** .40*** .70*** .38*** .28** .41*** .30*** .24** .22* .35*** .20* .03 -.06 .42*** Stigma
.49*** .46*** .51*** .52*** .44*** .34*** .45*** .40*** .19* .18 .28** .18 -.20* .46*** Fatigue
.67*** .47*** .56*** .36*** .39*** .53*** .54*** .54*** .35*** .28** .39*** .20* -.17 .63*** Sleep Disturbance
.47*** .47*** .47*** .39*** .35*** .54*** .46*** .46*** .24** .31*** .32*** .21* -.14 .54*** Emotional & Behav’l Dyscontrol .35*** .45*** .49*** .27** .46*** .40*** .33*** .20* .12 .22* .18* .05 -.17 .33***
*p = .05; **p = .01; ***p = .001; **** Non-standard scoring was used for UPDRS Part 3; EWB=Emotional Well-being; CI=Cognitive Impairment; Comm=Communication
160
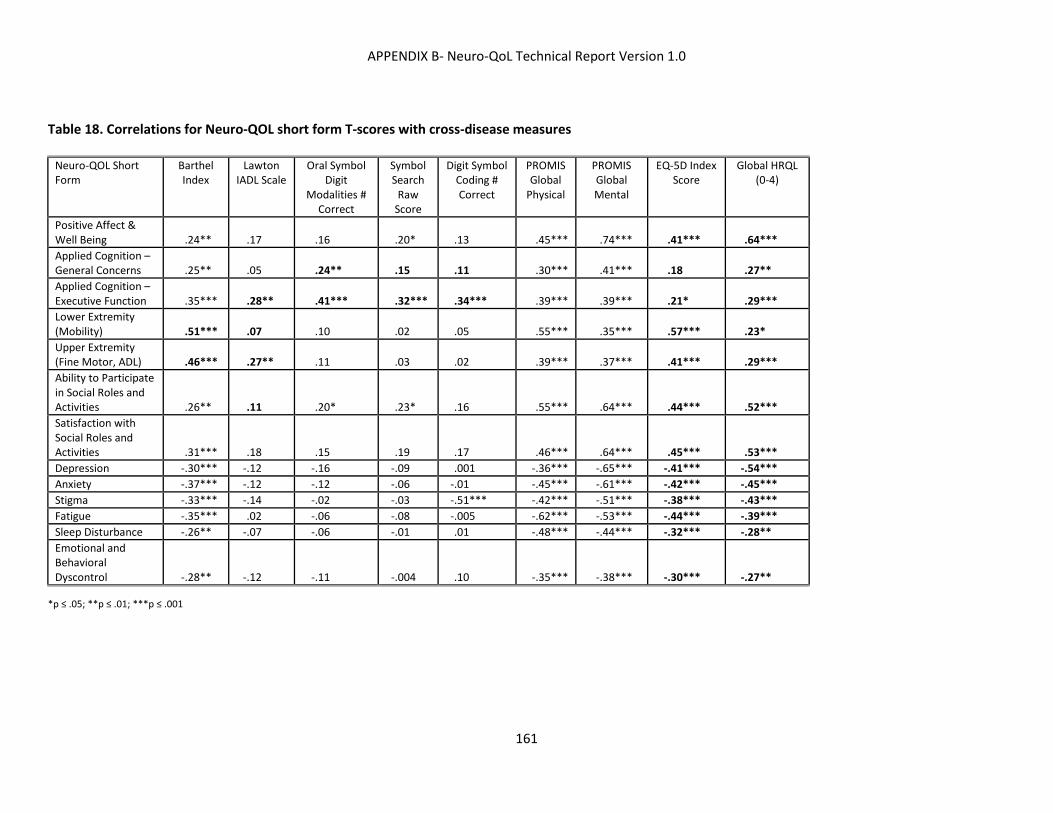
APPENDIX B- Neuro-QoL Technical Report Version 1.0
Table 18. Correlations for Neuro-QOL short form T-scores with cross-disease measures
*p ≤ .05; **p ≤ .01; ***p ≤ .001
Neuro-QOL Short Form
Barthel Index
Lawton IADL Scale
Oral Symbol Digit
Modalities # Correct
Symbol Search
Raw Score
Digit Symbol Coding # Correct
PROMIS Global
Physical
PROMIS Global Mental
EQ-5D Index Score
Global HRQL (0-4)
Positive Affect & Well Being .24** .17 .16 .20* .13 .45*** .74*** .41*** .64*** Applied Cognition – General Concerns .25** .05 .24** .15 .11 .30*** .41*** .18 .27** Applied Cognition – Executive Function .35*** .28** .41*** .32*** .34*** .39*** .39*** .21* .29*** Lower Extremity (Mobility) .51*** .07 .10 .02 .05 .55*** .35*** .57*** .23* Upper Extremity (Fine Motor, ADL) .46*** .27** .11 .03 .02 .39*** .37*** .41*** .29*** Ability to Participate in Social Roles and Activities .26** .11 .20* .23* .16 .55*** .64*** .44*** .52*** Satisfaction with Social Roles and Activities .31*** .18 .15 .19 .17 .46*** .64*** .45*** .53*** Depression -.30*** -.12 -.16 -.09 .001 -.36*** -.65*** -.41*** -.54*** Anxiety -.37*** -.12 -.12 -.06 -.01 -.45*** -.61*** -.42*** -.45*** Stigma -.33*** -.14 -.02 -.03 -.51*** -.42*** -.51*** -.38*** -.43*** Fatigue -.35*** .02 -.06 -.08 -.005 -.62*** -.53*** -.44*** -.39*** Sleep Disturbance -.26** -.07 -.06 -.01 .01 -.48*** -.44*** -.32*** -.28** Emotional and Behavioral Dyscontrol -.28** -.12 -.11 -.004 .10 -.35*** -.38*** -.30*** -.27**
161

APPENDIX B- Neuro-QoL Technical Report Version 1.0
Known groups validity: Patients in H & Y Stage 1 or 2 scored significantly differently on all Neuro-QOL SFs, except Applied Cognition-General Concerns and Emotional & Behavioral Dyscontrol, than did patients in Stages 3 or 4, with effect sizes ranging from .5 to 1.11. Responsiveness: Of the 32 planned comparisons, 7 were statistically significant and 1 exhibited a trend toward significance, in the predicted direction.
Physical Well-being: Of the four planned comparisons, two were significant in the predicted direction. Specifically, patients who reported a worsening of their physical well-being showed worsening of scores on Fatigue (F=8.13; p<.01) Lower Extremity Function (extended assessment; F=4.69; p< .05).
Cognitive Well-being: Of the two planned comparisons, none were significant. Emotional Well-being: Of the five planned comparisons, one showed a trend toward significance. Patients who reported changes in emotional well-being also exhibited a trend toward having changes in positive affect and well-being. Social/Family Well-being: Of the three planned comparisons, none were significant. Symptomatic Well-being: Of the five planned comparisons, one was significant. Specifically, patients who reported worsening symptomatic well-being also demonstrated worsening scores on Fatigue (extended assessment; F=3.32; p<.05). Overall Quality of Life: Of the thirteen planned comparisons, four were significant. Patients who reported a worsening of overall quality of life showed decreasing positive affect and well-being (F=6.73; p<.01), ability to participate in social activities (F=4.04; p<.05), and upper extremity function (F=5.33; p<.01) and increasing fatigue (extended assessment, F=3.63; p<.05). Conclusions:
• The Neuro-QOL measures demonstrated high internal consistency and test-retest reliability. • Convergent validity was supported by correlations with generic and PD-specific measures in the expected
directions. Correlations were generally modest in strength, warranting additional validation in PD samples. Neuro-QOL measures showed good discrimination between patients at different levels of disease severity.
• There was only limited evidence for responsiveness to self-reported changes in different domains of well-being.
162

APPENDIX B- Neuro-QoL Technical Report Version 1.0
ADULT EPILEPSY Disease-Specific Measures Quality of Life in Epilepsy-31(QOLIE-31). 55,56 The QOLIE-31 is an HRQL survey for adults (>18) with epilepsy. Derived from the QOLIE-89, this scale contains domains that include seizure worry, emotional wellbeing, energy/ fatigue, cognition, medication effects, social effects, health status and overall quality of life. Good psychometric evidence has been reported in previous studies. Liverpool Seizure Severity Scale (LSSS). The LSSS is a 12 item scale that assesses experiences during and immediately after a seizure such as loss of consciousness and post-ictal confusion. Each item is scored on a Likert scale, with higher scores indicating greater seizure severity. Reported test retest reliabilities range from 0.74 – 0.80. 57,58 A modified scoring system requires patients to rate only their most severe seizure and demonstrates adequate reliability, construct validity and responsiveness to change.59 Liverpool Adverse Events Profile (LAEP). 60The LAEP is a 19 item self-report scale that assesses the frequency of antiepileptic drug side effects. Using a 4-point Likert scale (1= never a Problem – 4=always a problem), scores are summed to create a total score (ranging from 19-76, higher scores indicating more symptoms). Results Sample characteristics. Participants were primarily male (51%), white (85%), and non-Hispanic (75%) with average age=47.3 (Range = 18-93). Forty-seven percent were married, 67% had some college or beyond. Fourteen percent were retired, 22% on disability and 37% were employed either full or part time. Average time since epilepsy diagnosis was 18.5 years (SD=13.9). Generalized seizures were most frequently experienced (57%) followed by focal seizures (25%). Mean number of seizures in the past 3 months = 10.7 (SD=37.6). 95% were taking medication for their seizure disorder, with 64% of those on polytherapy. Twelve percent had undergone surgery for their epilepsy. Mean T-Scores and standard deviations on the short forms are shown in Table 19. Epilepsy patients reported significantly worse cognitive and social function compared to a general population reference group but similar levels of physical function and greater positive affect and well-being. When compared to a clinical neurological population, they showed similar levels of stigma, greater anxiety, but less depression, sleep disturbance, fatigue, and sense of emotional and behavioral dyscontrol. Reliability: Internal consistency and 1 week test-retest reliability of the short forms is shown in Table 19. Cronbach’s alphas range from .86 to .96 and ICCs from .57 to .89.
163

APPENDIX B- Neuro-QoL Technical Report Version 1.0
Table 19. Descriptive and reliability statistics for Neuro-QOL short form T-scores Neuro-QOL Short Form Nitems Npersons M GPT MCT SD α T-R ICCs**
Positive Affect & Well Being* 9 118 53.8 8.2 0.95 0.81
Applied Cognition – General Concerns* 8 119 41.9 8.7 0.94 0.82
Applied Cognition – Executive Function* 8 119 43.6 10.3 0.94 0.87 Lower Extremity Function -Mobility* 8 114 50.4 9.0 0.92 0.89
Upper Extremity Function -Fine Motor, ADL* 8 119 49.0 7.7 0.88 0.87
Ability to Participate in Social Roles and Activities* 8 119 45.3 7.2 0.94 0.57
Satisfaction with Social Roles and Activities* 8 119 45.9 6.5 0.89 0.72
Depression 8 118 47.9 8.3 0.96 0.82
Anxiety 8 118 52.3 8.1 0.94 0.81
Stigma 8 119 49.7 9.1 0.91 0.83
Fatigue 8 119 45.6 9.4 0.95 0.81
Sleep Disturbance 8 119 48.2 9.8 0.86 0.77
Emotional and Behavioral Dyscontrol 8 119 46.3 10.1 0.93 0.84 *For these banks, a high score indicates better function; for all other banks a high score indicates worse function **Time 1 (baseline) vs. Time 2 (7 days)
M GPT – Mean General Population T-Score; MCT- Mean Clinical T-Score
164

APPENDIX B- Neuro-QoL Technical Report Version 1.0
Validity: Spearman correlations between Neuro-QOL short forms and epilepsy-specific and cross-disease measures are shown in Tables 20 and 21. Table 20. Correlations for Neuro-QOL short form T-scores with epilepsy-specific measures
Neuro-QOL Short Form
QOLIE-31 Liverpool Seizure Severity Scale
Liverpool Adverse Events Profile Total Cognitive Energy/
Fatigue Emotional Well-Being
Medication Effects
Overall Quality of Life
Social Function
Seizure Worry
Positive Affect & Well Being .737 ** .522 ** .543 ** .671 ** .423 ** .617 ** .643 ** .520 ** -.361 ** -.563 **
Applied Cognition – General Concerns .677 ** .784 ** .534 ** .428 ** .428 ** .422 ** .394 ** .401 ** -0.188 -.699 **
Applied Cognition – Executive Function .572 ** .668 ** .395 ** .415 ** .260 ** .411 ** .351 ** .247 ** 0.005 -.511 **
Lower Extremity Function - Mobility .330 ** .338 ** .280 ** 0.183 .213 * 0.168 .249 ** .212 * -0.198 -.393 **
Upper Extremity Function - Fine Motor, ADL
.334 ** .281 ** .271 ** .205 * 0.123 .210 * .299 ** .232 * -0.207 -.355 **
Ability to Participate in Social Roles and Activities
.646 ** .486 ** .466 ** .536 ** .419 ** .458 ** .599 ** .427 ** -.307 * -.523 **
Satisfaction with Social Roles and Activities
.544 ** .386 ** .472 ** .464 ** .316 ** .383 ** .487 ** .409 ** -0.22 -.340 **
Depression -.642 ** -.430 ** -.520 ** -.699 ** -.310 ** -.573 ** -.524 ** -.438 ** .386 ** .451 ** Anxiety -.617 ** -.421 ** -.526 ** -.690 ** -.352 ** -.453 ** -.476 ** -.550 ** .442 ** .482 ** Stigma -.582 ** -.365 ** -.419 ** -.504 ** -.373 ** -.420 ** -.574 ** -.501 ** .407 ** .484 ** Fatigue -.584 ** -.405 ** -.665 ** -.441 ** -.381 ** -.299 ** -.500 ** -.510 ** .487 ** .610 ** Sleep Disturbance -.528 ** -.413 ** -.460 ** -.421 ** -.367 ** -.329 ** -.428 ** -.471 ** .380 ** .634 ** Emotional and Behavioral Dyscontrol
-.579 ** -.479 ** -.453 ** -.539 ** -.342 ** -.386 ** -.483 ** -.393 ** .332 * .553 **
*p < .05; **p < .01
165

APPENDIX B- Neuro-QoL Technical Report Version 1.0
Table 21. Spearman's Rho Correlations for Neuro-QOL short form T-scores with cross-disease measures
Neuro-QOL Short Form Barthel Index
Lawton IADL Scale
Symbol Digit Modalities # Correct
Symbol Search Raw Score
Digit Symbol Coding # Correct
PROMIS Global Physical
PROMIS Global Mental
Pain Scale 0-10
EQ-5D Index Score
Global HRQL
Positive Affect & Well Being .185 * .216 * -0.088 -0.03 0.005 .480 ** .732 ** -.395 ** .486 ** .597 ** Applied Cognition – General Concerns .264 ** .231 * -0.092 -0.077 0.046 .523 ** .542 ** -.325 ** .425 ** .278 ** Applied Cognition – Executive Function .308 ** .361 ** 0.111 0.085 .238 * .444 ** .453 ** -.286 ** .426 ** .201 * Lower Extremity Function (Mobility) .527 ** .382 ** 0.15 0.126 0.169 .450 ** .283 ** -.330 ** .490 ** .215 * Upper Extremity Function (Fine Motor, ADL ) .597 ** .442 ** 0.157 0.094 .318 ** .494 ** .278 ** -.387 ** .515 ** 0.172 Ability to Participate in Social Roles and Activities .357 ** .323 ** 0.03 -0.001 0.107 .493 ** .617 ** -.359 ** .495 ** .462 ** Satisfaction with Social Roles and Activities .270 ** 0.149 0.02 0.049 0.116 .457 ** .530 ** -.313 ** .427 ** .568 ** Depression -0.02 -0.111 0.088 -0.041 -0.062 -.417 ** -.722 ** .290 ** -.407 ** -.641 ** Anxiety -0.055 -0.075 0.063 -0.057 -0.086 -.348 ** -.561 ** .245 ** -.335 ** -.503 ** Stigma -0.136 -.188 * 0.119 0.013 -0.059 -.371 ** -.527 ** .192 * -.343 ** -.349 ** Fatigue -0.16 -0.141 0.087 -0.004 -0.075 -.525 ** -.455 ** .261 ** -.357 ** -.283 ** Sleep Disturbance -0.12 -0.105 0.128 0.113 0.082 -.423 ** -.429 ** 0.172 -.337 ** -.247 ** Emotional and Behavioral Dyscontrol -0.175 -0.155 0.169 0.082 -0.01 -.298 ** -.498 ** 0.093 -.301 ** -.393 **
* =p< .05; ** = p< 0.01
166

APPENDIX B- Neuro-QoL Technical Report Version 1.0
Known groups validity: Statistically significant known group differences were observed between Leeds Seizure Severity Scale quartile groups and the following Neuro-QOL short forms: Anxiety (F=5.15, p<.01), Depression (F=5.71, p<.01), Emotional and Behavioral Dyscontrol (F=4.32, p<.01), Fatigue (F=9.08, p<.01), Positive Affect and Well-being (F=6.3, p<.01), Sleep Disturbance (F=3.36, p<.01), Stigma (F=4.65, p<.01) and Upper Extremity - Fine Motor, ADL (F=4.07, p<.01). Responsiveness: Of the 32 planned comparisons, nine were statistically significant and five exhibited a trend toward significance, in the predicted direction. Physical Well-Being: Of the four planned comparisons [Lower Extremity Function-Mobility, Upper Extremity Function - Fine Motor, ADL, Fatigue, and Sleep Disturbance] two were statistically significant and one exhibited a trend toward significance, all in the predicted direction. Specifically, a trend toward significance was observed between patients who reported worse Physical Function – Lower Extremity at six months with those who reported better functioning (F=2.74; p=.069). Statistically significant differences were observed between patients who reported worsening at six months with those who reported staying the same or improving in both Fatigue (F=4.94; p<.01) and Sleep Disturbance (F=3.21, p<.05). Social/Family Well-Being. Of the three planned comparisons [Ability to Participate in Social Roles and Activities, Satisfaction with Social Roles and Activities, Stigma] one exhibited a trend toward significance, in the predicted direction. Specifically, a trend toward significance was observed between patients who reported worse Ability to Participate in Social Roles and Activities at six months with those who reported improvements in this domain (F=2.64; p=.076). Emotional Well-Being. Of the five planned comparisons [Depression, Anxiety, Emotional and Behavioral Dyscontrol, Stigma, Positive Affect and Well-being] three were statistically significant and one exhibited a trend toward significance, all in the predicted direction. Specifically, a trend toward significance was observed between patients who reported worse Anxiety at six months with those who reported improvements in this domain (F=2.62; p=.077). Statistically significant differences were observed between patients who reported worse Depression at six months with those who reported improvements in this domain (F=4.94; p<.01); between patients who reported the same level of Emotional and Behavioral Dyscontrol with those who reported improvements in this domain (F=3.19, p<.05); and between patients who reported improved Positive Affect and Well-being with those who reported staying the same or worsening in this domain (F= 7.40, p<.01). Cognitive Well-Being. Of the two planned comparisons [Applied Cognition – General Concerns, Applied Cognition – Executive Function] neither short form exhibited statistically significant changes or trends toward significance over time. Symptomatic Well-Being. Of the five planned comparisons [Fatigue, Sleep Disturbance, Emotional and Behavioral Dyscontrol, Depression, Anxiety] one was statistically significant in the predicted direction. Specifically, differences were observed between patients who reported worse Depression at six months with those who reported staying the same or improving in this domain (F=3.94; p<.05). Overall Quality of Life. Of the thirteen planned comparisons [all Neuro-QOL short forms] two were statistically significant and three exhibited a trend toward significance, all in the predicted direction. Specifically, a trend toward significance was observed between patients who reported staying the same and those who reported improving in their scores of Emotional and Behavioral Dyscontrol (F=3.07, p=.051), Anxiety (F=2.97, p=.056), Fatigue (F=2.92, p=.058), and Ability to Participate in Social Roles and Activities (F=2.86, p=.061). Statistically significant differences were observed between patients who reported worse Depression over time with those who reported staying the same or improving in this domain (F=3.71; p<.05). Significant differences were also
167

APPENDIX B- Neuro-QoL Technical Report Version 1.0
observed between patients who reported improvements in Positive Affect and Well-being at six months compared to those who reported staying the same or worsening in this domain (F=6.39, p<.01). Conclusions:
• The 13 Neuro-QOL scales demonstrated high internal consistency, ranging from .86 (Sleep disturbance) to
.96 (Depression) • The Intraclass Correlation Coefficients (ICC) were generally acceptable, ranging from .57 (Ability to
Participate in Social Roles and Activities ) to .89 (Lower Extremity Function – Mobility) • Convergent and discriminant validity were good, with correlations of the expected strength and in the
expected direction. Neuro-QOL measures discriminated between patients at different levels of disease severity.
• There is initial evidence of responsiveness. Self-reported changes in physical, emotional and symptomatic well-being and overall quality of life were reflected in significant changes in conceptually-related Neuro-QOL short forms.
168

APPENDIX B- Neuro-QoL Technical Report Version 1.0
PEDIATRIC EPILEPSY Sample characteristics. Participants (N=61) were primarily male (62.3%), white (75.9%), and non-Hispanic (75.4%) with average age=13.4 (SD=2.6; range = 10 to 18). At baseline, 17.8% reported having seizures daily, 13.3% weekly, 35.6% monthly and 33.3% yearly, and all patients were taking anti-epilepsy drugs at the time of testing. Mean T-Scores and standard deviations on the short forms are shown in Table 22. Pediatric epilepsy patients reported better function/less symptoms on all domains compared to the reference group. Reliability: Internal consistency and 1 week test-retest reliability of the short forms is shown in Table 22. Cronbach’s alphas range from .76 to .87 and ICCs from .44 to .94. Table 22. Descriptive and reliability statistics for Neuro-QOL short form T-scores
Neuro-QOL Short Form Nitems Npersons MGPT MCT SD T-R**ICCs Social Relations – Interactions with Peers*
8 59 52.70 9.77 .86 .58
Applied Cognition – General Concerns* 8 61 52.29 7.20 .86 .69 Depression 8 59 45.16 7.13 .85 .69 Anxiety 8 58 49.02 7.58 .76 .67 Stigma 8 61 45.39 5.73 .79 .44 Fatigue 8 61 48.42 7.75 .80 .52 Pain 10 59 46.88 6.87 .87 .61 Lower Extremity Function –Mobility* 20 56 95.65*** 9.06 .77 .78 Upper Extremity Function -Fine Motor, ADL*
20 59 96.72*** 8.34 .86 .94
* For these banks, a high score indicates better function; for all other banks a high score indicates worse function **Time 1 (baseline) vs. Time 2 (7 days) *** These two scales were not calibrated using IRT due to skewed distributions. Possible scores range from 0 (unable to do) -100 (without difficulty). M GPT – Mean General Population T-Score; MCT- Mean Clinical T-Score
169

APPENDIX B- Neuro-QoL Technical Report Version 1.0
Validity: Spearman rho correlations between the Neuro-QOL short forms and the pediatric disease measures are shown in Table 23 and between the Neuro-QOL short forms and the cross-disease instruments in Table 24. Table 23. Correlations for Neuro-QOL short form T-scores with disease-specific measures
*p < .05; **p < .01; ***p < .001 MFS = Multidimensional Fatigue Scale
Neuro-QOL Short Form
PedsQL Core
PedsQL Emotional
Functioning
PedsQL Physical
Functioning
PedsQL Psychosocial
Health
PedsQL School
Functioning
PedsQL Social
Functioning
MFS MFS Cognitive Fatigue
MFS General Fatigue
MFS Sleep/Rest
Fatigue Depression -.70*** -.66*** -.36** -.68*** -.51*** -.49*** -.63*** -.59*** -.64*** -.47*** Anxiety -.60*** -.51*** -.19 -.55*** -.46*** -.37** -.47*** -.44*** -.49*** -.39** Stigma -.50*** -.41** -.14 -.57*** -.42** -.61*** -.34** -.40** -.36** -.14 Cognition .53*** .41** .11 .53*** .52*** .35** .57*** .66*** .53*** .30* Lower Extremity Function - Mobility
-.46*** -.44*** -.21 -.45*** -.28* -.53*** -.40** -.38** -.45*** -.21
Upper Extremity Function - Fine Motor, ADL
-.41** -.25 -.18 -.38** -.30* -.46*** -.35** -.39** -.31* -.17
Fatigue -.27* -.30* -.06 -.32* -.29* -.14 -.43*** -.46*** -.42*** -.26* Pain -.48*** -.48*** -.25 -.46*** -.33* -.28* -.48*** -.43*** -.36** -.45*** Social Relations – Interactions with Peers
.49*** .38** .18 .43*** .22 .56*** .39** .26* .50*** .27*
170

APPENDIX B- Neuro-QoL Technical Report Version 1.0
Table 24. Correlations for Neuro-QOL short form T-scores with cross-disease measures
*p < .05; **p < .01; ***p < .001
Neuro-QOL Short Form Karnofsky Performance
Scale
Symbol Digit Modalities #
Correct
Symbol Search Raw
Score
Digit Symbol Coding # Correct
PROMIS Physical Function T-Score
PROMIS Mental Health
T-Score
Pain Scale (0-10)
EQ-5D Index Score
Global HRQL (0-
4)
Depression -.20 .08 -.10 .20 -.57*** -.71*** .23 -.32* -.43*** Anxiety -.16 .10 .01 .10 -.57*** -.60*** .19 -.33* -.40** Stigma -.25 .01 -.15 .14 -.28* -.34** .01 -.37** -.24 Cognition .19 .16 .27* .05 .42*** .52*** -.24 .46*** .29* Lower Extremity Function - Mobility
-.27* .08 -.16 .17 -.36** -.32* .37** -.42** -.24
Upper Extremity Function - Fine Motor, ADL
-.30* -.17 -.45*** -.11 -.38** -.30* .38** -.55*** -.14
Fatigue -.09 .04 -.17 .12 -.36** -.38** .28* -.49*** -.37** Pain -.25 -.13 -.08 .00 -.44*** -.35** .57*** -.36** -.40** Social Relations – Interactions with Peers
.28* .13 .12 .09 .45*** .34** -.30* .27* .30*
171

APPENDIX B- Neuro-QoL Technical Report Version 1.0
Known groups validity: Patients with different seizure frequency (daily, weekly, monthly and yearly) scored significantly differently on Anxiety and Applied Cognition-General Concerns, with F=3.36, p=0.=25 and F=3.05, p=0.0358, respectively. Responsiveness: Similar to adult patients, we conducted responsiveness analyses on the Neuro-QOL banks using the Karnofsky Performance Status and the self-reported Global Rating of Change (GRC). Here we report the results from the GRC-based change. Beginning with the 7-level GRC (range: +3= very much better; 0 = about the same; -3 = very much worse), we collapsed the three “better” categories into one, and the three “worse” categories into one, leaving three categories (“better;” “about the same;” “worse”). These three categories were compared using one way analysis of variance followed by least significant difference testing of adjacent groups when the overall F statistic was significant. For each analysis, we required that at least 5 patients be represented in each of these three categories. If fewer than five patients were represented in a category, it was collapsed with the adjacent category and the two remaining groups were compared using a t-test. There were six GRC questions. Five of them queried patients specifically about change in Physical well-being, Cognitive well-being, Emotional well-being, Social/Family well-being, and Symptomatic Well-being (Disease-related Symptoms). The sixth GRC item asked about overall quality of life. The following indicates which of the 9 pediatric item bank change scores were compared across GRC categories: Physical well-being Physical Function (Upper extremity and Lower extremity); Fatigue; Pain Cognitive well-being: Applied Cognition - General Concerns Emotional well-being: Depression; Anxiety; Stigma; Social well-being: Social Relation- Interaction with peers; Stigma Symptoms: Fatigue; Depression; Anxiety; Pain Overall: ALL This resulted in 23 planned comparisons for each wave two clinical validation sample (no adjustment made for multiple comparisons). Results for these responsiveness analyses are presented below. Only those that achieved statistical significance will be summarized. Of the 23 planned comparisons, two were statistically significant.
Emotional Well-being: Of the three planned comparisons, stigma was statistically significant (F=3.24, p<0.05). Post hoc comparisons showed that patients who reported a change (either better or worse) in Emotional Well-being at 6-month follow-up also reported higher stigma than did patients who reported no change in Emotional Well-being, effect size=0.53 and 0.78, respectively. Social Well-being: Of the two planned comparisons, Stigma was found to be statistically significant ( t=2.02; p<.05). Yet, the direction was unexpected. Patients who reported better Social Well-being at 6-months had more stigma than those who reported that their Social Well-Being was unchanged, with an effect size of 0.57.
172

APPENDIX B- Neuro-QoL Technical Report Version 1.0
Conclusions:
• The current sample was generally high functioning. • The 9 Neuro-QOL measures demonstrated high internal consistency. The Intraclass Correlation Coefficients
(ICC) were acceptable, ranging from .44 (Stigma) to .94 (Upper Extremity Function- Fine motor, ADL) • Convergent validity associations with generic and legacy measures were of the expected strength and
direction • Responsiveness was not as good as we expected. It is hypothesized that this was due to the high
functioning samples recruited in the testing with only a few patients reporting that they were getting worse at the 6-month follow-up.
173

APPENDIX B- Neuro-QoL Technical Report Version 1.0
MUSCULAR DYSTROPHIES Sample characteristics. Patients (N=51) were primarily male (84.3%), white (58.8%), and non-Hispanic (62.7%) with average age=16.3 (SD=3.4; range=10.1 to 21.9). Seventy-seven percent were full time students, 2% were in school part time, and 4% were employed part-time. Of them, 5.9% (n=3) reported falling daily, 9.8% (n=5) weekly, 9.8% (n=5) monthly, 19.6% (n=10) rarely fall, yet 54.9% (n=28) were unable to ambulate without a wheelchair. One patient reported previous spine fracture, 11 (22%) limb fractures, and 17 (33.3%) received lower extremity or orthopedic surgeries before. Mean T-Scores and standard deviations on the short forms are shown in Table 25. MD patients generally reported better functioning/ less symptom severity than the reference group norm with one exception. The exception was the Social Relations – Interactions with Peers Short Form, on which MD patients scored about 2.5 T-scores worse than the norm. Reliability: Internal consistency and 1 week test-retest reliability of the short forms is shown in Table 25. Cronbach’s alphas range from .81 to .98 and ICCs from .61 to .97.
174

APPENDIX B- Neuro-QoL Technical Report Version 1.0
Table 25. Pediatric MD - Descriptive and reliability statistics for Neuro-QOL short form T-scores Neuro-QOL Measures Nitems Npersons MGPT MCT SD α T-R** ICCs Social Relations – Interactions with Peers* 8 50 47.42 10.15 .90 .87
Applied cognition: general concerns* 8 49 54.38 6.70 .81 .81
Depression 8 51 46.27 8.77 .92 .61
Anxiety 8 51 50.25 7.45 .85 .70
Stigma 8 51 49.29 7 .26 .92 .60
Fatigue 8 51 46.56 8.46 .81 .65
Pain 10 51 49.58 8.76 .92 .73
Lower Extremity (Mobility)* NOTE 20 22 54.02*** 23.05 .90 .65
Upper Extremity (Fine Motor, ADL) * 20 51 53.63*** 36.13 .98 .97
* For these banks, a high score indicates better function; for all other banks a high score indicates worse function ** Time 1 (baseline) vs. Time 2 (7-days) *** These two scales were not calibrated using Item Response Theory models due to skewed distributions. Possible scores range from 0 -100 M GPT – Mean General Population T-Score; MCT- Mean Clinical T-Score NOTE 28 patients (54.9%) reported using wheelchair only and had missing data on the Lower Extremity Function scale. When assigned “unable to do” for these patients on the Lower Extremity Function items, mean = 23.73.
175

APPENDIX B- Neuro-QoL Technical Report Version 1.0
Validity: Spearman rho correlations between the Neuro-QOL short forms and the pediatric disease measures are shown in Table 26 and between the Neuro-QOL short forms and the cross-disease instruments in Table 27. Table 26. Correlations for Neuro-QOL short form T-scores with disease-specific measures
*p < .05; **p < .01; ***p < .001
Neuro-QOL Short Form PedsQL Core
PedsQL Emotional
Functioning
PedsQL Physical
Functioning
PedsQL Psychosocial
Health
PedsQL School
Functioning
PedsQL Social
Functioning
Multidimensional Fatigue Scale
(MFS)
MFS Cognitive Fatigue
MFS General Fatigue
MFS Sleep/Rest
Fatigue Depression -.74*** -.74*** -.01 -.75*** -.59*** -.57*** -.58*** -.55*** -.59*** -.33* Anxiety -.70*** -.72*** -.13 -.72*** -.58*** -.46*** -.57*** -.48*** -.58*** -.40** Stigma -.73*** -.53*** .09 -.74*** -.52*** -.73*** -.48*** -.37** -.51*** -.35* Cognition .60*** .46*** .11 .62*** .63*** .38** .63*** .64*** .56*** .39** Lower Extremity Function - Mobility
-.20 -.12 .28 -.20 -.22 -.28 -.08 -.15 -.06 .12
Upper Extremity Function - Fine Motor, ADL
-.04 -.19 -.31* -.04 -.08 .08 .03 -.08 .01 .21
Fatigue -.69*** -.51*** -.02 -.70*** -.63*** -.51*** -.65*** -.59*** -.62*** -.47*** Pain -.73*** -.58*** .09 -.74*** -.57*** -.62*** -.74*** -.53*** -.65*** -.69*** Social Relations – Interactions with Peers
.41** .40** -.01 .42** .41** .32* .36* .38** .37** .13
176

APPENDIX B- Neuro-QoL Technical Report Version 1.0
Table 27. Correlations for Neuro-QOL short form T-scores with cross-disease measures
*p < .05; **p < .01; ***p < .001
Neuro-QOL Short Form Karnofsky Performance
Scale
Symbol Digit
Modalities # Correct
Symbol Search
Raw Score
Digit Symbol
Coding # Correct
PROMIS Physical Function T- Score
PROMIS Mental Health T-Score
Pain Scale (0-10)
EQ-5D Index Score
Global HRQL (0-4)
Depression -.05 -.40** -.32* -.35* -.34* -.70*** .27 -.20 -.40** Anxiety .04 -.19 -.22 -.30 -.35* -.48*** .41** -.20 -.28 Stigma -.05 -.33* -.41** -.32* -.42** -.60*** .38** -.23 -.25 Cognition -.16 .29* .21 .27 .37* .41** -.25 -.05 .26 Lower Extremity Function - Mobility -.62** .01 -.22 -.18 -.28 -.32 -.05 -.37 -.10 Upper Extremity Function - Fine Motor, ADL
-.82*** -.26 -.40** -.45** -.35* -.29 -.20 -.72*** -.11
Fatigue .32* -.27 -.33* -.26 -.40** -.39** .37** .19 -.18 Pain .23 -.34* -.22 -.31* -.51*** -.43** .71*** -.26 -.15 Social Relations – Interactions with Peers
-.13 .47*** .27 .37* .05 .49*** -.26 .15 .43**
177

APPENDIX B- Neuro-QoL Technical Report Version 1.0
Convergent Validity: The global quality of life item “I am content with the quality of my life right now” (20.4% -Not at all or A little bit; 44.9% - Somewhat or Quite a bit; 34.7% - Very much) was used to evaluate the convergent validity of the pediatric Neuro-QOL measures. Depression, Anxiety, Applied Cognition-General Concerns and Social Relation-Interaction with Peers were statistically significant, F=7.32 (p=0.02), 3.51 (p=0.038), 3.59 (p=0.036) and 6.10 (p=0.005), respectively. Post-hoc comparisons showed that all significant comparisons were in the predicted direction, with effect size range from 0.75 to 1.58. Responsiveness: Same 23 planned comparisons as described in pediatric epilepsy were conducted. Results for these responsiveness analyses are presented below. Only those that achieved statistical significance will be summarized. Of the 23 planned comparisons, two were statistically significant.
Emotional Well-being: Of the three planned comparisons, Depression and Stigma were statistically significant, t= -2.29 (p=0.027) and t=-2.38 (p=0.022), respectively. Specifically, patients who reported “better” Emotional Well-being reported less depression and less stigma than those who reported it as remaining “the same”. As less than 5 patients reported worsened Emotional Well-being at 6-month follow-up, these patients were grouped with “the same”. Conclusions:
• The 9 Neuro-QOL measures demonstrated high internal consistency (alpha range from 0.81-0.98). • The Intraclass Correlation Coefficients (ICC) were acceptable, ranging from .60 (Stigma) to .97 (Upper
Extremity Function- Fine motor, ADL) • Convergent validity with generic and legacy measures were of the expected strength and direction • Depression and Sigma were sensitive to change in Emotional Well-being change over time.
178
APPENDIX B- Neuro-QoL Technical Report Version 1.0
General Conclusions/Discussion
This report summarizes the procedures and initial findings from the Neuro-QOL clinical validation field testing. Overall, the Neuro-QOL short forms demonstrated excellent internal consistency across all diseases. Test-retest reliability was acceptable, but varied between disease groups. It was uniformly high for stroke, PD and MS, but a few short forms had lower than expected ICCS when used with ALS, adult and pediatric epilepsy, and muscular dystrophy patients. Validity of the Neuro-QOL short forms and scales was supported by 1). correlations with generic and disease-specific measures that were of the expected strength and direction; 2). Ability of the short forms to discriminate between patients grouped by disease severity level or other clinical factor.
For Further Information Additional IRT statistics and analyses have been delivered to the NINDS as electronic attachments. Neuro-QOL instruments are freely available at www.neuroqol.org. Publications, other future reports, and supplemental data will also be posted on this website.
179

APPENDIX B- Neuro-QoL Technical Report Version 1.0
Table 28: IRT parameters for the calibrated items in the Upper Extremity bank. For each item, the rating scale was 5 = Without Any Difficulty; 4 = With a Little Difficulty; 3 = With Some Difficulty; 2 = With Much Difficulty; 1 = Unable to Do. Neuro-QOL Item Name
PROMIS Item Name
Item Content
Item
slop
e
Thre
shol
d 1
Thre
shol
d 2
Thre
shol
d 3
Thre
shol
d 4
NQUEX03 How much DIFFICULTY do you currently have using a spoon to eat a meal? 2.66 -3.71 -3.12 -2.39 -1.94 NQUEX04 How much DIFFICULTY do you currently have putting on a pullover shirt? 3.95 -3.05 -2.50 -2.01 -1.39 NQUEX05 How much DIFFICULTY do you currently have taking off a pullover shirt? 3.63 -3.06 -2.48 -1.94 -1.29 NQUEX06 How much DIFFICULTY do you currently have removing wrappings from small
objects? 3.25 -3.06 -2.19 -1.64 -1.04 NQUEX15 How much DIFFICULTY do you currently have opening medications or vitamin
containers (e.g., childproof containers, small bottles)? 2.51 -2.99 -2.27 -1.75 -0.99 NQUEX19 PFA22 Are you able to open previously opened jars? 2.87 -3.22 -2.73 -2.16 -1.47 NQUEX20 PFA50 Are you able to brush your teeth? 3.13 -3.66 -3.22 -2.68 -2.03 NQUEX23 PFB22 Are you able to hold a plate full of food? 3.62 -2.68 -2.30 -1.92 -1.38 NQUEX28 PFA35 Are you able to open and close a zipper? 4.24 -2.86 -2.29 -2.03 -1.47 NQUEX29 PFA40 Are you able to turn a key in a lock? 4.68 -2.95 -2.55 -2.11 -1.63 NQUEX30 PFA43 Are you able to write with a pen or pencil? 2.11 -3.97 -2.61 -2.00 -1.43 NQUEX31 PFA47 Are you able to pull on trousers? 3.50 -3.03 -2.57 -2.01 -1.33 NQUEX32 PFA54 Are you able to button your shirt? 4.19 -2.51 -2.07 -1.68 -1.17 NQUEX33 PFA55 Are you able to wash and dry your body? 3.51 -2.98 -2.56 -1.98 -1.44 NQUEX36 PFB21 Are you able to pick up coins from a table top? 3.08 -3.32 -2.57 -2.01 -1.33 NQUEX37 PFB26 Are you able to shampoo your hair? 3.54 -2.78 -2.50 -2.15 -1.64 NQUEX38 PFB41 Are you able to trim your fingernails? 3.66 -2.25 -2.02 -1.75 -1.27 NQUEX39 PFA46 Are you able to cut your toe nails? 2.60 -1.98 -1.68 -1.23 -0.61 NQUEX41 PFA09 Are you able to bend down and pick up clothing from the floor? 2.26 -2.94 -2.32 -1.74 -1.07 NQUEX44 Are you able to make a phone call using a touch tone key-pad? 2.45 -3.94 -3.47 -2.76 -2.08 Table 29: Uncalibrated items from the Upper Extremity bank.
180

APPENDIX B- Neuro-QoL Technical Report Version 1.0
Neuro-QOL Item Name
PROMIS Item Name Item Content Rating Scale
NQUEX01 How much DIFFICULTY do you currently have using a fork to eat a meal?
5 = No Difficulty 4 = A Little Difficulty 3 = Some Difficulty 2 = A Lot of Difficulty 1 = Can't Do
NQUEX02 How much DIFFICULTY do you currently have applying spreads to bread using a knife?
5 = No Difficulty 4 = A Little Difficulty 3 = Some Difficulty 2 = A Lot of Difficulty 1 = Can't Do
NQUEX07 How much DIFFICULTY do you currently have chopping or slicing vegetables (e.g., onions or peppers)?
5 = No Difficulty 4 = A Little Difficulty 3 = Some Difficulty 2 = A Lot of Difficulty 1 = Can't Do
NQUEX08 How much DIFFICULTY do you currently have reaching behind your back to put a belt through a loop?
5 = No Difficulty 4 = A Little Difficulty 3 = Some Difficulty 2 = A Lot of Difficulty 1 = Can't Do
NQUEX09 How much DIFFICULTY do you currently have shaving your neck and face safely and thoroughly with an electric razor?
5 = No Difficulty 4 = A Little Difficulty 3 = Some Difficulty 2 = A Lot of Difficulty 1 = Can't Do
NQUEX10 How much DIFFICULTY do you currently have shaving your legs and underarms safely and thoroughly with an electric razor?
5 = No Difficulty 4 = A Little Difficulty 3 = Some Difficulty 2 = A Lot of Difficulty 1 = Can't Do
NQUEX11 How much DIFFICULTY do you currently have playing cards or Bingo or other light recreational activities?
5 = No Difficulty 4 = A Little Difficulty 3 = Some Difficulty 2 = A Lot of Difficulty 1 = Can't Do
NQUEX12 How much DIFFICULTY do you currently have picking up a gallon carton of milk with one hand and setting it on the table?
5 = No Difficulty 4 = A Little Difficulty 3 = Some Difficulty 2 = A Lot of Difficulty 1 = Can't Do
NQUEX13
How much DIFFICULTY do you currently have pounding a nail with a hammer to hang a picture?
5 = No Difficulty 4 = A Little Difficulty 3 = Some Difficulty 2 = A Lot of Difficulty 1 = Can't Do
181

APPENDIX B- Neuro-QoL Technical Report Version 1.0
Neuro-QOL Item Name
PROMIS Item Name Item Content Rating Scale
NQUEX14 How much DIFFICULTY do you currently have holding a screw and screwing it in tight with a manual screwdriver?
5 = No Difficulty 4 = A Little Difficulty 3 = Some Difficulty 2 = A Lot of Difficulty 1 = Can't Do
NQUEX16 How much DIFFICULTY do you currently have cleaning yourself after a bowel movement?
5 = No Difficulty 4 = A Little Difficulty 3 = Some Difficulty 2 = A Lot of Difficulty 1 = Can't Do
NQUEX17 How much DIFFICULTY do you currently have pulling up and fastening your pants after a bowel movement?
5 = No Difficulty 4 = A Little Difficulty 3 = Some Difficulty 2 = A Lot of Difficulty 1 = Can't Do
NQUEX18 How much DIFFICULTY do you currently have putting a Band-Aid or gauze pad on yourself?
5 = No Difficulty 4 = A Little Difficulty 3 = Some Difficulty 2 = A Lot of Difficulty 1 = Can't Do
NQUEX21 PFB16 Are you able to press with your index finger (for example ringing a doorbell)?
5 = Without Any Difficulty 4 = With a Little Difficulty 3 = With Some Difficulty 2 = With Much Difficulty 1 = Unable to Do
NQUEX22 PFB19 Are you able to squeeze a new tube of toothpaste?
5 = Without Any Difficulty 4 = With a Little Difficulty 3 = With Some Difficulty 2 = With Much Difficulty 1 = Unable to Do
NQUEX24 PFB33 Are you able to remove something from your back pocket?
5 = Without Any Difficulty 4 = With a Little Difficulty 3 = With Some Difficulty 2 = With Much Difficulty 1 = Unable to Do
NQUEX25
Are you able to wash your face with a washcloth?
5 = Without Any Difficulty 4 = With a Little Difficulty 3 = With Some Difficulty 2 = With Much Difficulty 1 = Unable to Do
NQUEX26 PFC49 Are you able to water a house plant? 5 = Without Any Difficulty 4 = With a Little Difficulty
182

APPENDIX B- Neuro-QoL Technical Report Version 1.0
Neuro-QOL Item Name
PROMIS Item Name Item Content Rating Scale
3 = With Some Difficulty 2 = With Much Difficulty 1 = Unable to Do
NQUEX27 PFA28 Are you able to open a can with a hand can opener?
5 = Without Any Difficulty 4 = With a Little Difficulty 3 = With Some Difficulty 2 = With Much Difficulty 1 = Unable to Do
NQUEX34 PFB15 Are you able to change the bulb in a table lamp?
5 = Without Any Difficulty 4 = With a Little Difficulty 3 = With Some Difficulty 2 = With Much Difficulty 1 = Unable to Do
NQUEX35 PFB20 Are you able to cut a piece of paper with scissors?
5 = Without Any Difficulty 4 = With a Little Difficulty 3 = With Some Difficulty 2 = With Much Difficulty 1 = Unable to Do
NQUEX40 PFA52 Are you able to tie your shoelaces?
5 = Without Any Difficulty 4 = With a Little Difficulty 3 = With Some Difficulty 2 = With Much Difficulty 1 = Unable to Do
NQUEX42 PFB34 Are you able to change a light bulb overhead?
5 = Without Any Difficulty 4 = With a Little Difficulty 3 = With Some Difficulty 2 = With Much Difficulty 1 = Unable to Do
NQUEX43 PFC42 Are you able to open a tight or new jar?
5 = Without Any Difficulty 4 = With a Little Difficulty 3 = With Some Difficulty 2 = With Much Difficulty 1 = Unable to Do
183

APPENDIX B- Neuro-QoL Technical Report Version 1.0
Table 30: IRT parameters for the Lower Extremity item bank. Neuro-QOL Item Name
PROMIS Item Name
Item Content Rating scale Item
slop
e
Thre
shol
d 1
Thre
shol
d 2
Thre
shol
d 3
Thre
shol
d 4
NQMOB01
How much DIFFICULTY do you currently have standing up from an armless straight chair (e.g., dining room chair)?
5 = No Difficulty 4 = A Little Difficulty 3 = Some Difficulty 2 = A Lot of Difficulty 1 = Can't Do 3.83 -2.50 -1.90 -1.24 -0.47
NQMOB03
How much DIFFICULTY do you currently have sitting down on and standing up from a chair with arms?
5 = No Difficulty 4 = A Little Difficulty 3 = Some Difficulty 2 = A Lot of Difficulty 1 = Can't Do 3.25 -3.22 -2.48 -1.70 -0.91
NQMOB04
How much DIFFICULTY do you currently have moving from sitting at the side of the bed to lying down on your back?
5 = No Difficulty 4 = A Little Difficulty 3 = Some Difficulty 2 = A Lot of Difficulty 1 = Can't Do 2.56 -3.23 -2.41 -1.79 -1.11
NQMOB06
How much DIFFICULTY do you currently have standing up from a low, soft couch?
5 = No Difficulty 4 = A Little Difficulty 3 = Some Difficulty 2 = A Lot of Difficulty 1 = Can't Do 3.64 -2.38 -1.42 -0.90 -0.03
NQMOB08
How much DIFFICULTY do you currently have going up and down a flight of stairs inside, using a handrail?
5 = No Difficulty 4 = A Little Difficulty 3 = Some Difficulty 2 = A Lot of Difficulty 1 = Can't Do 3.33 -2.46 -1.77 -1.21 -0.54
NQMOB09
How much DIFFICULTY do you currently have walking on uneven surfaces (e.g., grass, dirt road or sidewalk)?
5 = No Difficulty 4 = A Little Difficulty 3 = Some Difficulty 2 = A Lot of Difficulty 1 = Can't Do 3.85 -2.58 -1.72 -1.04 -0.35
NQMOB11
How much DIFFICULTY do you currently have walking around one floor of your home?
5 = No Difficulty 4 = A Little Difficulty 3 = Some Difficulty 2 = A Lot of Difficulty 1 = Can't Do 3.77 -2.95 -2.47 -1.92 -1.24
NQMOB16
How much DIFFICULTY do you currently have taking a 20-minute brisk walk, without stopping to rest?
5 = No Difficulty 4 = A Little Difficulty 3 = Some Difficulty 2 = A Lot of Difficulty 1 = Can't Do 2.68 -1.48 -1.09 -0.70 -0.10
184

APPENDIX B- Neuro-QoL Technical Report Version 1.0
Neuro-QOL Item Name
PROMIS Item Name
Item Content Rating scale Item
slop
e
Thre
shol
d 1
Thre
shol
d 2
Thre
shol
d 3
Thre
shol
d 4
NQMOB17
How much DIFFICULTY do you currently have walking on a slippery surface, outdoors?
5 = No Difficulty 4 = A Little Difficulty 3 = Some Difficulty 2 = A Lot of Difficulty 1 = Can't Do 2.85 -1.85 -1.08 -0.51 0.38
NQMOB21
How much DIFFICULTY do you currently have climbing stairs step over step without a handrail? (alternating feet)?
5 = No Difficulty 4 = A Little Difficulty 3 = Some Difficulty 2 = A Lot of Difficulty 1 = Can't Do 3.75 -1.58 -1.07 -0.64 -0.07
NQMOB23
How much DIFFICULTY do you currently have walking in a dark room without falling?
5 = No Difficulty 4 = A Little Difficulty 3 = Some Difficulty 2 = A Lot of Difficulty 1 = Can't Do 2.34 -2.52 -1.73 -1.20 -0.51
NQMOB25 PFA12 Are you able to push open a heavy door?
5 = Without any Difficulty 4 = With a Little Difficulty 3 = With Some Difficulty 2 = With Much Difficulty 1 = Unable to Do 2.78 -2.67 -1.86 -1.21 -0.37
NQMOB28 PFA23 Are you able to go for a walk of at least 15 minutes?
5 = Without any Difficulty 4 = With a Little Difficulty 3 = With Some Difficulty 2 = With Much Difficulty 1 = Unable to Do 2.93 -1.83 -1.54 -1.18 -0.66
NQMOB30 PFA30 Are you able to step up and down curbs?
5 = Without any Difficulty 4 = With a Little Difficulty 3 = With Some Difficulty 2 = With Much Difficulty 1 = Unable to Do 3.89 -2.44 -1.93 -1.42 -0.80
NQMOB31 PFA31 Are you able to get up off the floor from lying on your back without help?
5 = Without any Difficulty 4 = With a Little Difficulty 3 = With Some Difficulty 2 = With Much Difficulty 1 = Unable to Do 3.26 -1.71 -1.25 -0.80 -0.18
NQMOB32 PFA45 Are you able to get out of bed into a chair?
5 = Without any Difficulty 4 = With a Little Difficulty 3 = With Some Difficulty 2 = With Much Difficulty 1 = Unable to Do 3.45 -2.89 -2.33 -1.76 -1.19
185

APPENDIX B- Neuro-QoL Technical Report Version 1.0
Neuro-QOL Item Name
PROMIS Item Name
Item Content Rating scale Item
slop
e
Thre
shol
d 1
Thre
shol
d 2
Thre
shol
d 3
Thre
shol
d 4
NQMOB33 PFA53 Are you able to run errands and shop?
5 = Without any Difficulty 4 = With a Little Difficulty 3 = With Some Difficulty 2 = With Much Difficulty 1 = Unable to Do 3.02 -2.26 -1.88 -1.36 -0.79
NQMOB26 PFA56 Are you able to get in and out of a car?
5 = Without any Difficulty 4 = With a Little Difficulty 3 = With Some Difficulty 2 = With Much Difficulty 1 = Unable to Do 3.30 -3.05 -2.29 -1.47 -0.67
NQMOB37 PFC45 Are you able to get on and off the toilet?
5 = Without any Difficulty 4 = With a Little Difficulty 3 = With Some Difficulty 2 = With Much Difficulty 1 = Unable to Do 3.63 -3.04 -2.46 -1.81 -1.23
186

APPENDIX B- Neuro-QoL Technical Report Version 1.0
Table 31: Uncalibrated items from the Lower Extremity bank. Neuro-QOL Item Name
PROMIS Item Name Item Content Rating Scale
NQMOB02 How much DIFFICULTY do you currently have sitting down on an armless straight chair (e.g., dining room chair)?
5 = No Difficulty 4 = A Little Difficulty 3 = Some Difficulty 2 = A Lot of Difficulty 1 = Can't Do
NQMOB05 How much DIFFICULTY do you currently have moving from lying on your back to sitting on the side of the bed?
5 = No Difficulty 4 = A Little Difficulty 3 = Some Difficulty 2 = A Lot of Difficulty 1 = Can't Do
NQMOB07 How much DIFFICULTY do you currently have sitting down on a low, soft couch?
5 = No Difficulty 4 = A Little Difficulty 3 = Some Difficulty 2 = A Lot of Difficulty 1 = Can't Do
NQMOB10 How much DIFFICULTY do you currently have opening a window above shoulder height, while standing?
5 = No Difficulty 4 = A Little Difficulty 3 = Some Difficulty 2 = A Lot of Difficulty 1 = Can't Do
NQMOB12 How much DIFFICULTY do you currently have getting into and out of a truck, bus, shuttle van, or sport utility vehicle?
5 = No Difficulty 4 = A Little Difficulty 3 = Some Difficulty 2 = A Lot of Difficulty 1 = Can't Do
NQMOB13 How much DIFFICULTY do you currently have running 45 minutes?
5 = No Difficulty 4 = A Little Difficulty 3 = Some Difficulty 2 = A Lot of Difficulty 1 = Can't Do
NQMOB14 How much DIFFICULTY do you currently have running up and down an incline?
5 = No Difficulty 4 = A Little Difficulty 3 = Some Difficulty 2 = A Lot of Difficulty 1 = Can't Do
NQMOB15 How much DIFFICULTY do you currently have walking 45 minutes on an even surface?
5 = No Difficulty 4 = A Little Difficulty 3 = Some Difficulty 2 = A Lot of Difficulty 1 = Can't Do
NQMOB18
How much DIFFICULTY do you currently have getting into and out of a kneeling position?
5 = No Difficulty 4 = A Little Difficulty
187

APPENDIX B- Neuro-QoL Technical Report Version 1.0
Neuro-QOL Item Name
PROMIS Item Name Item Content Rating Scale
3 = Some Difficulty 2 = A Lot of Difficulty 1 = Can't Do
NQMOB19 How much DIFFICULTY do you currently have using an escalator?
5 = No Difficulty 4 = A Little Difficulty 3 = Some Difficulty 2 = A Lot of Difficulty 1 = Can't Do
NQMOB20 How much DIFFICULTY do you currently have crossing the road at a 4-lane traffic light with curbs?
5 = No Difficulty 4 = A Little Difficulty 3 = Some Difficulty 2 = A Lot of Difficulty 1 = Can't Do
NQMOB22 How much DIFFICULTY do you currently have going up and down three flights of stairs inside, using a handrail?
5 = No Difficulty 4 = A Little Difficulty 3 = Some Difficulty 2 = A Lot of Difficulty 1 = Can't Do
NQMOB24 How much DIFFICULTY do you currently have walking in a busy place (e.g., crowded store) without losing your balance?
5 = No Difficulty 4 = A Little Difficulty 3 = Some Difficulty 2 = A Lot of Difficulty 1 = Can't Do
NQMOB27 PFA39 Are you able to run at a fast pace for two miles?
5 = Without any Difficulty 4 = With a Little Difficulty 3 = With Some Difficulty 2 = With Much Difficulty 1 = Unable to Do
NQMOB29 Are you able to run or jog for 10 minutes?
5 = Without any Difficulty 4 = With a Little Difficulty 3 = With Some Difficulty 2 = With Much Difficulty 1 = Unable to Do
NQMOB34 PFB9 Are you able to jump up and down?
5 = Without any Difficulty 4 = With a Little Difficulty 3 = With Some Difficulty 2 = With Much Difficulty 1 = Unable to Do
NQMOB35
Are you able to run for 5 minutes?
5 = Without any Difficulty 4 = With a Little Difficulty 3 = With Some Difficulty 2 = With Much Difficulty
188

APPENDIX B- Neuro-QoL Technical Report Version 1.0
Neuro-QOL Item Name
PROMIS Item Name Item Content Rating Scale
1 = Unable to Do
NQMOB36 How difficult is it for you to go for a walk of at least 15 minutes?
5 = Without any Difficulty 4 = With a Little Difficulty 3 = With Some Difficulty 2 = With Much Difficulty 1 = Unable to Do
NQASD02 How much DIFFICULTY do you currently have walking on uneven surfaces (e.g., grass, dirt road or sidewalk) with your walking aid?
5 = No Difficulty 4 = A Little Difficulty 3 = Some Difficulty 2 = A Lot of Difficulty 1 = Can't Do
NQASD03 How much DIFFICULTY do you currently have sitting down or standing up from a low, soft couch with your walking aid?
5 = No Difficulty 4 = A Little Difficulty 3 = Some Difficulty 2 = A Lot of Difficulty 1 = Can't Do
NQASD04 How much DIFFICULTY do you currently have sitting down on an armless straight chair, using a wheelchair?
5 = No Difficulty 4 = A Little Difficulty 3 = Some Difficulty 2 = A Lot of Difficulty 1 = Can't Do
NQASD05 How much DIFFICULTY do you currently have propelling / driving a wheelchair for at least 15 minutes?
5 = No Difficulty 4 = A Little Difficulty 3 = Some Difficulty 2 = A Lot of Difficulty 1 = Can't Do
NQASD06 How much DIFFICULTY do you currently have going up and down three flights of stairs inside, using a handrail with your walking aid?
5 = No Difficulty 4 = A Little Difficulty 3 = Some Difficulty 2 = A Lot of Difficulty 1 = Can't Do
NQASD08 How much DIFFICULTY do you currently have getting into and out of a truck, bus, shuttle van, or sport utility vehicle with your walking aid?
5 = No Difficulty 4 = A Little Difficulty 3 = Some Difficulty 2 = A Lot of Difficulty 1 = Can't Do
NQASD07 How much DIFFICULTY do you currently have going up and down a flight of stairs inside, using a handrail with your walking aid?
5 = No Difficulty 4 = A Little Difficulty 3 = Some Difficulty 2 = A Lot of Difficulty 1 = Can't Do
NQASD09 How much DIFFICULTY do you currently have getting into and out of a truck, bus, shuttle van, or sport utility vehicle from a wheelchair?
5 = No Difficulty 4 = A Little Difficulty 3 = Some Difficulty 2 = A Lot of Difficulty 1 = Can't Do
189
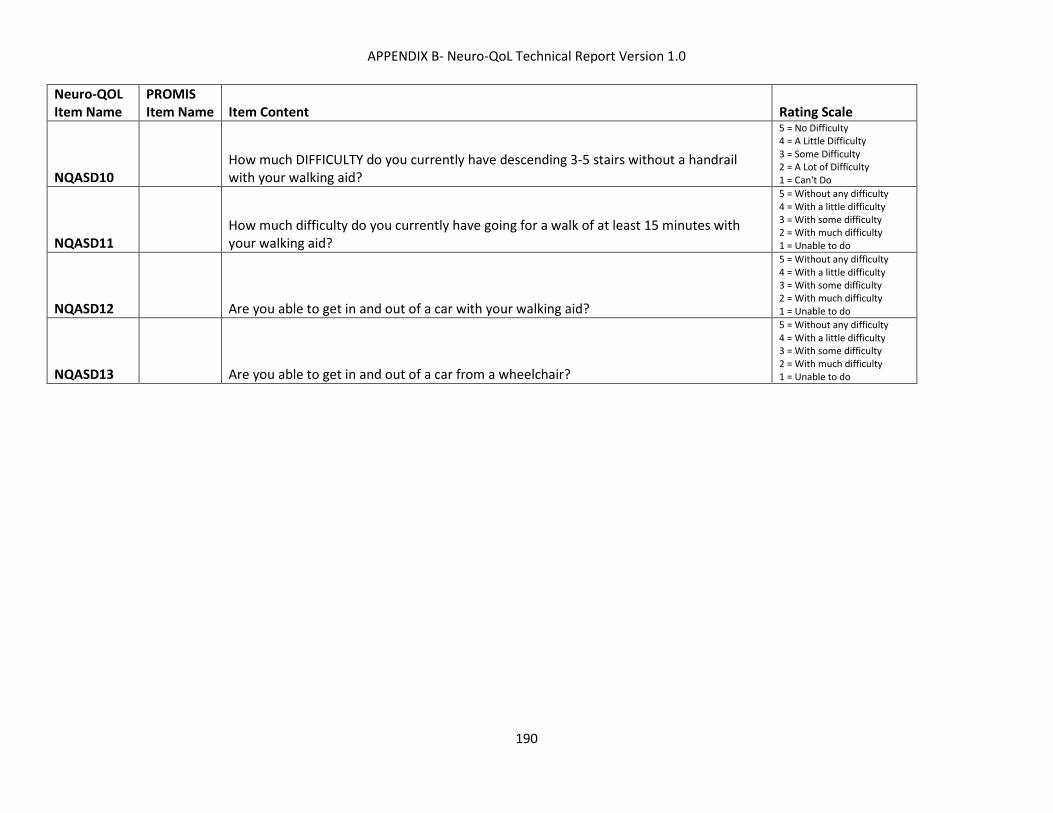
APPENDIX B- Neuro-QoL Technical Report Version 1.0
Neuro-QOL Item Name
PROMIS Item Name Item Content Rating Scale
NQASD10 How much DIFFICULTY do you currently have descending 3-5 stairs without a handrail with your walking aid?
5 = No Difficulty 4 = A Little Difficulty 3 = Some Difficulty 2 = A Lot of Difficulty 1 = Can't Do
NQASD11 How much difficulty do you currently have going for a walk of at least 15 minutes with your walking aid?
5 = Without any difficulty 4 = With a little difficulty 3 = With some difficulty 2 = With much difficulty 1 = Unable to do
NQASD12 Are you able to get in and out of a car with your walking aid?
5 = Without any difficulty 4 = With a little difficulty 3 = With some difficulty 2 = With much difficulty 1 = Unable to do
NQASD13 Are you able to get in and out of a car from a wheelchair?
5 = Without any difficulty 4 = With a little difficulty 3 = With some difficulty 2 = With much difficulty 1 = Unable to do
190

APPENDIX B- Neuro-QoL Technical Report Version 1.0
Table 32: IRT parameters for the Fatigue item bank For each item, item context was In the past 7 days, and the rating scale was 1 = Never; 2 = Rarely; 3 = Sometimes; 4 = Often; 5 = Always
Neuro-QOL Item Name Item Stem Ite
m sl
ope
Thre
shol
d 1
Thre
shol
d 2
Thre
shol
d 3
Thre
shol
d 4
NQFTG01 I needed help doing my usual activities because of my fatigue. 2.72 -0.68 0.00 0.94 1.86 NQFTG02 I had to limit my social activity because I was tired. 3.61 -0.75 -0.13 0.75 1.91 NQFTG03 I needed to sleep during the day. 1.89 -1.20 -0.41 0.84 1.88 NQFTG04 I had trouble starting things because I was too tired. 3.84 -0.92 -0.25 0.82 1.88
NQFTG05 I had trouble finishing things because I was too tired. 3.74 -1.05 -0.30 0.80 1.92
NQFTG06 I was too tired to do my household chores. 4.24 -0.96 -0.25 0.66 1.67
NQFTG07 I was too tired to leave the house. 3.94 -0.60 0.05 0.94 1.91 NQFTG08 I was too tired to take a short walk. 2.97 -0.68 -0.09 0.69 1.57 NQFTG09 I was too tired to eat. 2.71 -0.20 0.69 1.81 2.72 NQFTG10 I was frustrated by being too tired to do the things I wanted to do. 4.15 -0.72 -0.24 0.43 1.17 NQFTG11 I felt that I had no energy. 4.58 -1.18 -0.42 0.33 1.30 NQFTG12 I was so tired that I needed to rest during the day. 3.52 -1.11 -0.38 0.62 1.42 NQFTG13 I felt exhausted. 4.68 -0.93 -0.25 0.60 1.42
NQFTG14 I felt tired. 3.99 -1.64 -0.74 0.31 1.34 NQFTG15 I felt fatigued. 4.53 -1.30 -0.47 0.41 1.37
NQFTG16 I felt weak all over. 3.13 -0.66 0.04 0.89 1.69
NQFTG17 I needed help doing my usual activities because of weakness. 3.30 -0.27 0.36 1.20 2.09 NQFTG18 I had to limit my social activity because I was physically weak. 3.29 -0.28 0.36 1.04 1.85 NQFTG20 I had to force myself to get up and do things because I was physically too weak. 3.15 -0.36 0.26 1.04 2.01 The Fatigue Item Bank had only one uncalibrated item: (NQFTG19) I had enough physical strength to do the things I wanted to do.
191

APPENDIX B- Neuro-QoL Technical Report Version 1.0
Table 33: IRT parameters for the Sleep Disturbance item bank For each item, the item context was In the past 7 days, and the rating scale was 1 = Never; 2 = Rarely; 3 = Sometimes; 4 = Often; 5 = Always
Neuro-QOL Item Name Item Stem Ite
m sl
ope
Thre
shol
d 1
Thre
shol
d 2
Thre
shol
d 3
Thre
shol
d 4
NQSLP02 I had to force myself to get up in the morning. 1.59 -0.59 0.32 1.33 2.29 NQSLP03 I had trouble stopping my thoughts at bedtime. 2.30 -0.59 0.14 1.03 2.00
NQSLP04 I was sleepy during the daytime. 1.60 -1.82 -0.77 0.69 1.95 NQSLP05 I had trouble sleeping because of bad dreams. 1.67 0.53 1.57 2.53 3.52 NQSLP07 I had trouble falling asleep. 2.24 -0.62 0.28 1.26 2.15 NQSLP12 Pain woke me up. 1.34 0.05 0.84 2.00 3.45
NQSLP13 I avoided or cancelled activities with my friends because I was tired from having a bad night's sleep. 2.47 0.50 1.12 2.09 2.97
NQSLP18 I felt physically tense during the middle of the night or early morning hours. 1.80 0.57 1.13 2.31 3.76
192

APPENDIX B- Neuro-QoL Technical Report Version 1.0
Table 34: Uncalibrated items for the Sleep Disturbance item bank For each item, the item context was In the past 7 days, and the rating scale was 1 = Never; 2 = Rarely; 3 = Sometimes; 4 = Often; 5 = Always Neuro-QOL Item Name Item Stem NQSLP19 During the night I was awakened by stiffness and had trouble getting back to sleep. NQSLP20 I had restless feelings in my legs in the evening or night. NQSLP08 I had an urge to move my legs when I was sitting still or lying down. NQSLP09 My legs jerked or twitched repeatedly during sleep.
NQSLP10 I experienced numbness or tingling in my arms or legs which woke me from sleep at night.
NQSLP14 I had hallucinations at night (seeing or hearing things that do not exist). NQSLP16 I screamed during sleep. NQSLP17 I kicked, punched, or swung my arms during sleep.
Table 35: Items excluded from the Sleep Disturbance item bank For each item, the item context was In the past 7 days, and the rating scale was 1 = Never; 2 = Rarely; 3 = Sometimes; 4 = Often; 5 = Always Neuro-QOL Item Name
PROMIS Item Name Item Stem
NQSLP01 Sleep50 I woke up too early and could not fall back asleep. NQSLP06 Sleep87 I had trouble staying asleep. NQSLP11 I experienced tremor upon waking. NQSLP15 Taking medicine helped me sleep.
193

APPENDIX B- Neuro-QoL Technical Report Version 1.0
Table 36: IRT parameters for the Depression item bank For each item, the item context is In the past 7 days, and the response scale is 1 = Never; 2 = Rarely; 3 = Sometimes; 4 = Often; 5 = Always. Neuro-QOL Item Name
PROMIS Item Name
Item Stem Item
slop
e
Thre
shol
d 1
Thre
shol
d 2
Thre
shol
d 3
Thre
shol
d 4
NQDEP02 EDDEP04 I felt worthless. 4.77 -0.10 0.29 1.03 1.62 NQDEP03 EDDEP05 I felt that I had nothing to look forward to. 4.43 -0.21 0.37 0.87 1.54 NQDEP04 EDDEP06 I felt helpless. 4.32 -0.22 0.37 0.98 1.53 NQDEP05 EDDEP07 I withdrew from other people. 3.47 -0.20 0.28 1.03 1.71 NQDEP06 EDDEP08 I felt that everything I did was an effort. 2.66 -0.54 0.08 0.92 1.50 NQDEP07 EDDEP09 I felt that nothing could cheer me up. 4.67 -0.11 0.45 1.12 1.76 NQDEP08 EDDEP10 I was critical of myself for my mistakes. 2.67 -0.67 -0.06 0.88 1.59 NQDEP10 EDDEP17 I felt sad. 3.71 -0.72 -0.02 0.79 1.54 NQDEP11 EDDEP19 I felt that I wanted to give up on everything. 4.52 0.05 0.44 1.03 1.66 NQDEP12 EDDEP28 I felt lonely. 3.68 -0.32 0.19 0.92 1.65 NQDEP13 EDDEP29 I felt depressed. 5.79 -0.31 0.22 0.94 1.42 NQDEP14 EDDEP31 I felt discouraged about the future. 3.99 -0.52 0.05 0.68 1.33 NQDEP18 EDDEP35 I found that things in my life were overwhelming. 3.44 -0.28 0.25 1.03 1.68 NQDEP19 EDDEP36 I felt unhappy. 4.70 -0.69 0.01 0.84 1.74 NQDEP20 EDDEP38 I felt unloved. 3.23 -0.08 0.43 1.16 1.70 NQDEP21 EDDEP39 I felt I had no reason for living. 4.38 0.38 0.78 1.33 1.92 NQDEP23 EDDEP41 I felt hopeless. 5.24 0.02 0.49 1.15 1.72 NQDEP24 EDDEP45 I felt that nothing was interesting. 4.12 -0.08 0.49 1.22 1.91 NQDEP25 EDDEP46 I felt pessimistic. 2.76 -0.46 0.26 1.06 1.79 NQDEP26 EDDEP47 I had trouble keeping my mind on what I was doing. 2.42 -0.50 0.23 1.29 2.14 NQDEP27 EDDEP48 I felt that my life was empty. 4.99 -0.03 0.37 1.06 1.65 NQDEP28 EDDEP54 I felt emotionally exhausted. 3.59 -0.28 0.17 0.94 1.54 NQDEP29 EDDEP55 I felt like I needed help for my depression. 3.25 0.25 0.67 1.17 1.63 NQDEP30 EDDEP56 I had trouble enjoying things that I used to enjoy. 3.89 -0.10 0.39 1.08 1.58
194
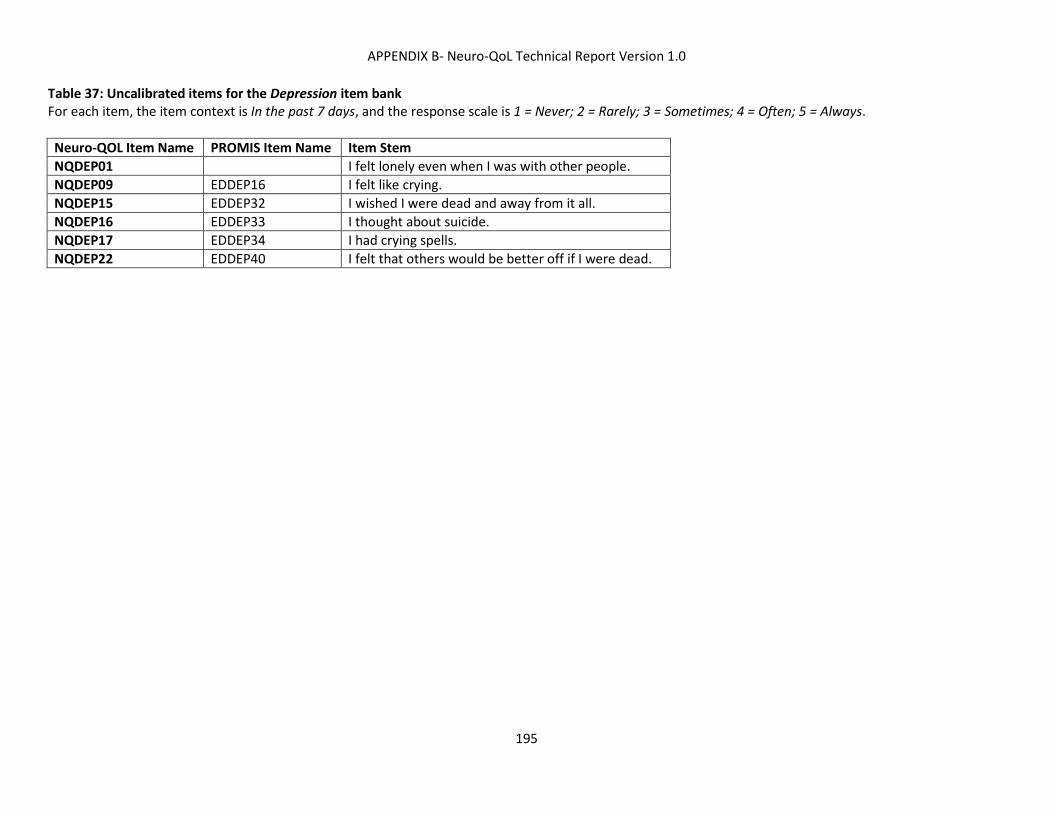
APPENDIX B- Neuro-QoL Technical Report Version 1.0
Table 37: Uncalibrated items for the Depression item bank For each item, the item context is In the past 7 days, and the response scale is 1 = Never; 2 = Rarely; 3 = Sometimes; 4 = Often; 5 = Always. Neuro-QOL Item Name PROMIS Item Name Item Stem NQDEP01 I felt lonely even when I was with other people. NQDEP09 EDDEP16 I felt like crying. NQDEP15 EDDEP32 I wished I were dead and away from it all. NQDEP16 EDDEP33 I thought about suicide. NQDEP17 EDDEP34 I had crying spells. NQDEP22 EDDEP40 I felt that others would be better off if I were dead.
195

APPENDIX B- Neuro-QoL Technical Report Version 1.0
Table 38: IRT parameters for the Anxiety item bank. For each item, the item context is In the past 7 days, and the response scale is 1 = Never; 2 = Rarely; 3 = Sometimes; 4 = Often; 5 = Always. Neuro-QOL Item Name
PROMIS Item Name
Item Stem
Item
slop
e
Thre
shol
d 1
Thre
shol
d 2
Thre
shol
d 3
Thre
shol
d 4
NQANX02 I felt fearful about my future. 2.34 -0.73 0.14 0.88 1.69 NQANX03 EDANX05 I felt anxious. 3.06 -0.74 0.03 0.94 1.72 NQANX04 EDANX06 I worried about my physical health. 1.40 -1.05 -0.03 1.10 2.17 NQANX05 EDANX07 I felt like I needed help for my anxiety. 2.94 0.13 0.68 1.43 1.97 NQANX07 I felt nervous when my normal routine was disturbed. 3.01 -0.30 0.39 1.16 1.91 NQANX09 EDANX18 I had sudden feelings of panic. 3.45 0.20 0.95 1.57 2.29 NQANX11 EDANX20 I was easily startled. 2.08 -0.25 0.61 1.48 2.26 NQANX12 EDANX26 I felt fidgety. 2.96 -0.27 0.43 1.29 1.96 NQANX13 EDANX27 I felt something awful would happen. 3.24 -0.01 0.61 1.40 2.03 NQANX14 EDANX30 I felt worried. 3.01 -0.82 0.01 0.90 1.57 NQANX17 EDANX32 I suddenly felt scared for no reason. 2.46 0.75 1.31 2.03 2.56 NQANX18 I worried about dying. 1.64 0.48 1.23 2.33 2.89 NQANX20 EDANX41 My worries overwhelmed me. 3.99 0.10 0.66 1.30 1.91 NQANX21 EDANX42 I felt shy. 1.64 -0.18 0.73 1.52 2.25 NQANX22 EDANX46 I felt nervous. 4.29 -0.39 0.37 1.10 1.77 NQANX23 EDANX48 Many situations made me worry. 4.36 -0.35 0.45 1.07 1.63 NQANX24 EDANX49 I had difficulty sleeping. 1.52 -0.77 0.06 0.98 1.81 NQANX25 EDANX51 I had trouble relaxing. 2.95 -0.48 0.29 1.05 1.81 NQANX26 EDANX53 I felt uneasy. 5.52 -0.32 0.42 1.09 1.71 NQANX27 EDANX54 I felt tense. 4.07 -0.44 0.23 1.06 1.70 NQANX28 EDANX55 I had difficulty calming down. 3.30 -0.03 0.66 1.41 2.00
196

APPENDIX B- Neuro-QoL Technical Report Version 1.0
Table 39: Uncalibrated items for the Anxiety item bank. For each item, the item context is In the past 7 days, and the response scale is 1 = Never; 2 = Rarely; 3 = Sometimes; 4 = Often; 5 = Always. Neuro-QOL Item Name PROMIS Item Name Item Stem NQANX01
I was afraid of what the future holds for me.
NQANX06 EDANX13 I had a racing or pounding heart. NQANX08 EDANX17 I had trouble falling asleep. NQANX10 EDANX19 My sleep was restless. NQANX15
I felt nervous when I was left alone.
NQANX16 EDANX33 I felt terrified. NQANX19
I was preoccupied with my worries.
197

APPENDIX B- Neuro-QoL Technical Report Version 1.0
Table 40: IRT parameters for the Stigma item bank. For each item, the item context is Lately, and the response scale is 1 = Never; 2 = Rarely; 3 = Sometimes; 4 = Often; 5 = Always. Neuro-QOL Item Name
Item Stem
Item
slop
e
Thre
shol
d 1
Thre
shol
d 2
Thre
shol
d 3
Thre
shol
d 4
NQSTG01 Because of my illness, some people seemed uncomfortable with me. 3.44 0.10 0.75 1.43 2.40 NQSTG02 Because of my illness, some people avoided me. 4.06 0.35 0.89 1.56 2.20 NQSTG03 Because of my illness, I felt emotionally distant from other people. 3.53 -0.05 0.38 0.99 1.67 NQSTG04 Because of my illness, I felt left out of things. 4.00 -0.06 0.35 0.94 1.61 NQSTG05 Because of my illness, people were unkind to me. 3.31 0.65 1.26 2.10 3.09 NQSTG06 Because of my illness, people made fun of me. 2.85 0.89 1.48 2.29 2.96 NQSTG07 Because of my illness, I felt embarrassed in social situations. 3.99 0.17 0.62 1.27 1.90 NQSTG08 Because of my illness, people avoided looking at me. 3.92 0.67 1.23 1.81 2.70 NQSTG09 Because of my illness, strangers tended to stare at me. 2.65 0.74 1.35 2.04 2.54 NQSTG10 Because of my illness, I worried about other people's attitudes towards me. 3.28 0.35 0.77 1.30 1.97 NQSTG11 Because of my illness, I was treated unfairly by others. 3.76 0.54 1.12 1.82 2.32 NQSTG12 I was unhappy about how my illness affected my appearance. 2.67 0.17 0.62 1.19 1.63 NQSTG13 Because of my illness, it was hard for me to stay neat and clean. 2.43 0.51 0.99 1.74 2.42 NQSTG14 Because of my illness, people tended to ignore my good points. 4.19 0.52 1.02 1.66 2.13 NQSTG15 Because of my illness, I worried that I was a burden to others. 3.28 -0.16 0.22 0.93 1.47 NQSTG16 I felt embarrassed about my illness. 3.46 0.18 0.59 1.18 1.69 NQSTG17 I felt embarrassed because of my physical limitations. 3.39 -0.07 0.35 1.02 1.61 NQSTG18 I felt embarrassed about my speech. 1.94 0.61 0.98 1.69 2.43 NQSTG19 Because of my illness, I felt different from others. 3.35 -0.11 0.42 0.96 1.45 NQSTG20 I tended to blame myself for my problems. 1.66 -0.34 0.31 1.24 2.16 NQSTG21 Some people acted as though it was my fault I have this illness. 2.88 0.50 0.95 1.54 2.19 NQSTG22 I avoided making new friends to avoid telling others about my illness. 3.09 0.54 0.98 1.43 1.93 NQSTG25 People with my illness lost their jobs when their employers found out about it. 1.49 0.01 0.62 1.81 2.89 NQSTG26 I lost friends by telling them that I have this illness. 2.52 0.88 1.39 1.96 2.69
198

APPENDIX B- Neuro-QoL Technical Report Version 1.0
Table 41: The Stigma item bank – Excluded items For each item, the item context is Lately, and the response scale is 1 = Never; 2 = Rarely; 3 = Sometimes; 4 = Often; 5 = Always. Neuro-QOL Item Name
Item Stem
NQSTG23 I was careful who I told that I have this illness NQSTG24 I worried that people who know I have this illness will tell others
199

APPENDIX B- Neuro-QoL Technical Report Version 1.0
Table 42: IRT parameters for the Positive Affect and Well-Being item bank. For each item, the item context is Lately, and the response scale is 1 = Never; 2 = Rarely; 3 = Sometimes; 4 = Often; 5 = Always. Neuro-QOL Item Name
Item Stem
Item
slop
e
Thre
shol
d 1
Thre
shol
d 2
Thre
shol
d 3
Thre
shol
d 4
NQPPF02 I was able to enjoy life. 2.86 -1.64 -0.84 0.14 1.24 NQPPF03 I felt a sense of purpose in my life. 3.70 -1.37 -0.68 0.20 1.04 NQPPF04 I could laugh and see the humor in situations. 2.73 -1.86 -1.26 -0.16 0.79 NQPPF05 I was able to be at ease and feel relaxed. 3.04 -1.64 -0.85 0.03 1.28 NQPPF06 I looked forward with enjoyment to upcoming events. 3.43 -1.55 -0.91 0.10 1.04 NQPPF07 Many areas of my life were interesting to me. 4.01 -1.47 -0.67 0.18 1.07 NQPPF08 I felt emotionally stable. 2.66 -1.63 -1.05 -0.18 0.78 NQPPF10 I felt lovable. 3.05 -1.67 -0.82 0.10 0.99 NQPPF11 I felt confident. 3.44 -1.55 -0.82 0.01 0.96 NQPPF12 I felt hopeful. 4.96 -1.65 -0.83 0.12 0.88 NQPPF13 I had a good life. 5.21 -1.50 -0.88 0.01 0.70 NQPPF14 I had a sense of well-being. 6.61 -1.41 -0.71 0.07 0.82 NQPPF15 My life was satisfying. 5.83 -1.38 -0.70 0.17 0.89 NQPPF16 I had a sense of balance in my life. 4.92 -1.39 -0.60 0.20 0.96 NQPPF17 My life had meaning. 5.60 -1.39 -0.85 0.00 0.69 NQPPF18 My life was peaceful. 3.19 -1.64 -0.80 0.07 1.17 NQPPF19 My life was worth living. 4.16 -1.89 -1.06 -0.29 0.31 NQPPF20 My life had purpose. 5.10 -1.52 -0.90 -0.12 0.53 NQPPF21 I was living life to the fullest. 3.65 -1.13 -0.44 0.36 1.13 NQPPF22 I felt cheerful. 4.59 -1.65 -0.88 0.09 1.12 NQPPF23 In most ways my life was close to my ideal. 3.63 -0.84 -0.27 0.48 1.47 NQPPF24 I had good control of my thoughts. 2.83 -1.87 -1.04 -0.11 0.76 NQPPF26 Even when things were going badly, I still had hope. 3.19 -1.89 -1.08 -0.10 0.74
200

APPENDIX B- Neuro-QoL Technical Report Version 1.0
Table 43: The Positive Affect and Well-Being item bank – Uncalibrated items Neuro-QOL Item Name Item Stem NQPPF01 I felt happy about the future. NQPPF09 I was able to relax. NQPPF25 I had good control of my emotions. NQPPF27 I felt loved and wanted.
201

APPENDIX B- Neuro-QoL Technical Report Version 1.0
Table 44: IRT parameters for the Emotional and Behavioral Dyscontrol item bank. For each item, the item context is In the past 7 days, and the response scale is 1 = Never; 2 = Rarely; 3 = Sometimes; 4 = Often; 5 = Always. Neuro-QOL Item Name
PROMIS Item Name
Item Stem
Item
slop
e
Thre
shol
d 1
Thre
shol
d 2
Thre
shol
d 3
Thre
shol
d 4
NQPER01 EDANG09 I felt angry. 1.87 -1.08 0.29 1.66 3.09 NQPER02 EDANG42 I had trouble controlling my temper. 2.67 -0.14 0.90 1.94 2.80 NQPER05 It was hard to control my behavior. 2.85 0.00 0.95 2.11 2.94 NQPER06 I said or did things without thinking. 2.55 -0.59 0.44 1.75 2.79 NQPER07 I got impatient with other people. 3.12 -1.20 -0.05 1.07 2.18 NQPER08 I felt impulsive. 1.98 -0.71 0.48 1.90 3.13 NQPER09 People told me that I talked in a loud or excessive manner. 1.62 0.43 1.34 2.38 3.39 NQPER10 I said or did things that other people probably thought were inappropriate. 2.23 -0.01 1.00 2.25 3.32 NQPER11 I was irritable around other people. 2.99 -0.55 0.43 1.56 2.36 NQPER12 I was bothered by little things. 3.18 -0.96 0.02 1.17 2.12 NQPER13 I suddenly became emotional for no reason. 2.29 -0.26 0.57 1.50 2.75 NQPER14 I felt restless. 1.76 -0.95 -0.02 1.50 3.12 NQPER15 It was hard to adjust to unexpected changes. 2.16 -0.52 0.41 1.57 2.53 NQPER16 I had a hard time accepting criticism from other people. 2.32 -0.66 0.37 1.30 1.99 NQPER17 I became easily upset. 3.61 -0.50 0.36 1.28 2.01 NQPER18 EDANG31 I was stubborn with others. 2.42 -0.77 0.27 1.42 2.37 NQPER19 I was in conflict with others. 2.70 -0.54 0.65 1.79 2.66 NQPER20 I threatened violence toward people or property. 2.05 1.57 2.52 3.04 3.52
202

APPENDIX B- Neuro-QoL Technical Report Version 1.0
Table 45: Uncalibrated items for the Emotional and Behavioral Dyscontrol item bank. For each item, the item context is In the past 7 days, and the response scale is 1 = Never; 2 = Rarely; 3 = Sometimes; 4 = Often; 5 = Always. Neuro-QOL Item Name Item Content NQPER03 It was hard to keep up enthusiasm to get things done. NQPER04 My problems seemed unimportant to me.
203

APPENDIX B- Neuro-QoL Technical Report Version 1.0
Table 46: IRT parameters for the Applied Cognition – General Concerns item bank. For each item, the item context is In the past 7 days, and the response scale is 5= Never; 4= Rarely (once); 3= Sometimes (2-3 times); 2= Often (once a day); 1= Very Often (several times a day) Neuro-QOL Item Name
Item Stem
Item
slop
e
Thre
shol
d 1
Thre
shol
d 2
Thre
shol
d 3
Thre
shol
d 4
NQCOG46 I made simple mistakes more easily. 2.65 -2.70 -2.04 -1.13 -0.26 NQCOG53 Words I wanted to use seemed to be on the “tip of my tongue”. 2.31 -2.20 -1.60 -0.73 0.16 NQCOG64 I had to read something several times to understand it. 2.88 -2.28 -1.82 -1.09 -0.30 NQCOG65 I had trouble keeping track of what I was doing if I was interrupted. 3.56 -2.30 -1.75 -1.05 -0.37 NQCOG66 I had difficulty doing more than one thing at a time. 3.42 -2.20 -1.71 -1.06 -0.42 NQCOG67 I had trouble remembering whether I did things I was supposed to do, like taking a medicine or
buying something I needed. 2.81 -2.35 -1.90 -1.17 -0.33
NQCOG68 I had trouble remembering new information, like phone numbers or simple instructions. 2.91 -2.44 -1.85 -1.21 -0.50 NQCOG69 I walked into a room and forgot what I meant to get or do there. 2.32 -2.50 -1.76 -0.89 0.16 NQCOG70 I had trouble remembering the name of a familiar person. 1.80 -3.10 -2.45 -1.42 -0.45 NQCOG72 I had trouble thinking clearly. 4.13 -2.27 -1.81 -1.10 -0.52 NQCOG73 I reacted slowly to things that were said or done. 4.11 -2.50 -1.98 -1.27 -0.64 NQCOG74 I had trouble forming thoughts. 4.28 -2.43 -1.94 -1.27 -0.68 NQCOG75 My thinking was slow. 4.37 -2.40 -1.82 -1.13 -0.54 NQCOG77 I had to work really hard to pay attention or I would make a mistake. 4.53 -2.16 -1.74 -1.17 -0.58 NQCOG80 I had trouble concentrating. 3.76 -2.12 -1.60 -0.96 -0.30 NQCOG83 I had trouble getting started on very simple tasks. 3.03 -2.41 -1.85 -1.21 -0.64 NQCOG84 I had trouble making decisions. 3.29 -2.43 -1.89 -1.25 -0.61 NQCOG86 I had trouble planning out steps of a task. 3.84 -2.49 -1.98 -1.43 -0.79
204

APPENDIX B- Neuro-QoL Technical Report Version 1.0
Table 47: Uncalibrated items for the Applied Cognition – General Concerns item bank. For each item, the item context is In the past 7 days, and the response scale is 5= Never; 4= Rarely (once); 3= Sometimes (2-3 times); 2= Often (once a day); 1= Very Often (several times a day)
Neuro-QOL Item Name Item Content NQCOG43 I got confused, for example, I did not know where I was. NQCOG44 I had difficulty paying attention for a long period of time. NQCOG45 I felt like my mind went blank. NQCOG47 After I made a mistake, I got stuck and couldn’t figure out a new way to go. NQCOG48 “I had trouble recognizing my mistakes right away NQCOG49 I had trouble saying what I mean in conversations with others. NQCOG50 I was told that I start talking before the other person finishes. NQCOG51 I was told that I repeat myself. NQCOG52 I was a worse listener than usual NQCOG54 I had trouble finding the right word(s) to express myself. NQCOG55 I used the wrong word when I referred to an object. NQCOG56 I communicated by gestures, for example, moving my head, pointing or sign language. NQCOG57 My speech was understood only by a few people who know me well. NQCOG58 I had to repeat myself so others could understand me. NQCOG59 I slurred or stuttered while speaking. NQCOG60 I had to talk very slowly to make myself understood. NQCOG62 I had trouble recalling the name of an object. NQCOG63 I had trouble recognizing familiar words on a page. NQCOG71 I forgot to do things like turn off the stove or turn on my alarm clock. NQCOG76 My thinking was confused. NQCOG78 I had trouble adding or subtracting numbers in my head. NQCOG79 I made mistakes when writing down phone numbers. NQCOG81 I had trouble spelling words correctly when writing. NQCOG82 I had trouble keeping track of the day or date. NQCOG85 When I had something to do that takes a long time, I had trouble deciding where to start. NQCOG87 I needed medical instructions repeated because I could not keep them straight. NQCOG88 When I was reading I needed to use a ruler or my finger to keep track of which line I was on.
One item – (NQCOG61) My speech was difficult for others to understand – was excluded from the bank altogether.
205

APPENDIX B- Neuro-QoL Technical Report Version 1.0
Table 48: IRT parameters for the Applied Cognition –Executive Function item bank. For each item, the item context is How much DIFFICULTY do you currently have…, and the response scale is 5= None; 4= A little; 3= Somewhat; 2= A lot; 1= Cannot Do Neuro-QOL Item Name
Item Stem
Item
slop
e
Thre
shol
d 1
Thre
shol
d 2
Thre
shol
d 3
Thre
shol
d 4
NQCOG15 keeping track of time (eg., using a clock)? 2.47 -3.71 -2.86 -2.21 -1.59 NQCOG16 checking the accuracy of financial documents, (e,g., bills, checkbook, or bank statements)? 3.30 -2.63 -2.18 -1.79 -1.06 NQCOG17 counting the correct amount of money when making purchases? 2.59 -3.22 -2.72 -2.28 -1.67 NQCOG22 reading and following complex instructions (e.g., directions for a new medication)? 2.43 -3.75 -2.51 -1.87 -1.04 NQCOG24 planning for and keeping appointments that are not part of your weekly routine, (e.g., a
therapy or doctor appointment, or a social gathering with friends and family)? 3.51 -3.25 -2.32 -1.75 -1.03 NQCOG25 managing your time to do most of your daily activities? 2.78 -3.27 -2.25 -1.63 -0.71 NQCOG26 planning an activity several days in advance (e.g., a meal, trip, or visit to friends)? 3.37 -3.17 -2.43 -1.84 -1.15 NQCOG27 taking care of complicated tasks like managing a checking account or getting appliances fixed? 3.68 -2.59 -2.08 -1.64 -0.96 NQCOG28 keeping important personal papers such as bills, insurance documents and tax forms
organized? 3.18 -2.55 -1.93 -1.45 -0.70 NQCOG31 getting things organized? 3.04 -2.91 -1.98 -1.45 -0.56 NQCOG38 remembering where things were placed or put away (e.g., keys)? 2.11 -3.71 -2.09 -1.36 -0.15 NQCOG39 remembering a list of 4 or 5 errands without writing it down? 2.15 -2.70 -1.82 -1.13 0.05 NQCOG40 learning new tasks or instructions? 2.43 -4.22 -2.39 -1.47 -0.37
206

APPENDIX B- Neuro-QoL Technical Report Version 1.0
Table 49: Uncalibrated items for the Applied Cognition –Executive Function item bank. For each item, the item context is How much DIFFICULTY do you currently have…, and the response scale is 5= None; 4= A little; 3= Somewhat; 2= A lot; 1= Cannot Do Neuro-QOL Item Name Item Content NQCOG05 making yourself understood to familiar people over the phone? NQCOG06 making yourself understood to other people during ordinary conversations? NQCOG07 describing something that has happened to you so that others can understand you? NQCOG09 putting words together to form grammatically correct sentences? NQCOG12 reading simple material (e.g., a menu or the TV or radio guide)? NQCOG13 reading the newspaper or magazine? NQCOG14 understanding information on food labels? NQCOG18 doing calculations in your head while shopping (e.g., 30% off, etc.)? NQCOG19 using information on the bill to figure out where to call if you have a problem?
NQCOG20 carrying on a conversation with a familiar person in a noisy environment (e.g., at a party or meeting)?
NQCOG21 following a series of dialing instructions (e.g., a recorded message "Press 1 for...")? NQCOG23 looking up a phone number or address in the phone book? NQCOG29 handling an unfamiliar problem (e.g., getting the refrigerator fixed)?
NQCOG30 planning for and completing regularly scheduled weekly tasks, such as taking out the trash or doing laundry?
NQCOG32 planning what to do in the day? NQCOG33 explaining how to do something involving several steps to another person? NQCOG34 using a local street map to locate a new store or doctor's office?
NQCOG35 dialing familiar numbers such as a family member or doctor (without losing your place or misdialing)?
NQCOG36 reading a long book (over 100 pages) over a number of days? NQCOG37 remembering to take medications at the appropriate time? NQCOG41 using a map to tell where to go? NQCOG42 understanding pictures that explain how to assemble something?
207

APPENDIX B- Neuro-QoL Technical Report Version 1.0
Table 50: Excluded items for the Applied Cognition –Executive Function item bank. For each item, the item context is How much DIFFICULTY do you currently have…, and the response scale is 5= None; 4= A little; 3= Somewhat; 2= A lot; 1= Cannot Do Neuro-QOL Item Name Item Content NQCOG01 writing notes to yourself, such as appointments or 'to do' lists? NQCOG02 composing a brief note or e-mail to someone? NQCOG03 understanding familiar people during ordinary conversations? NQCOG04 understanding family and friends on the phone?
NQCOG08 carrying on a conversation with a small group of familiar people (e.g., family or a few friends)?
NQCOG10 organizing what you want to say? NQCOG11 speaking clearly enough to use the telephone?
208

APPENDIX B- Neuro-QoL Technical Report Version 1.0
Table 51: IRT parameters for the Ability to Participate in Social Roles and Activities item bank. For each item, the item context is In the past 7 days; for non-reversed items the rating scale is 1 = Never; 2 = Rarely; 3 = Sometimes; 4 = Often 5 = Always. For reversed items the rating scale is 5 = Never; 4 = Rarely; 3 = Sometimes; 2 = Often; 1 = Always Neuro-QOL Item Name
Item Stem Rating Scale
Item
slop
e
Thre
shol
d 1
Thre
shol
d 2
Thre
shol
d 3
Thre
shol
d 4
NQPRF01 I can keep up with my family responsibilities. 3.87 -2.28 -1.66 -0.98 -0.37 NQPRF02 I have trouble meeting the needs of my family. Reversed 2.97 -2.06 -1.58 -0.84 -0.14 NQPRF03 I am able to do all of my regular family activities. 4.53 -1.88 -1.44 -0.80 -0.28 NQPRF04 I have to limit my regular family activities. Reversed 3.52 -1.93 -1.25 -0.65 -0.18 NQPRF05 I am able to do all of the family activities that people expect me to do. 4.61 -1.83 -1.25 -0.78 -0.23 NQPRF06 I am able to do all of the family activities that I want to do. 4.44 -1.71 -1.15 -0.65 -0.16 NQPRF07 I am able to maintain my friendships as much as I would like. 4.18 -1.75 -1.24 -0.75 -0.16 NQPRF08 I am able to socialize with my friends. 3.73 -1.79 -1.16 -0.52 -0.08 NQPRF09 I am able to do all of my regular activities with friends. 5.27 -1.54 -1.01 -0.51 -0.06 NQPRF11 I can do everything for my friends that I want to do. 5.90 -1.47 -0.96 -0.49 -0.01 NQPRF12 I am able to do all of the activities with friends that people expect me to do. 6.38 -1.60 -1.00 -0.49 -0.05 NQPRF13 I feel limited in my ability to visit friends. Reversed 3.67 -1.45 -1.00 -0.49 0.00 NQPRF14 I am able to do all of the activities with friends that I want to do. 5.45 -1.47 -0.95 -0.51 -0.07 NQPRF15 I feel limited in the amount of time I have to visit friends. Reversed 2.57 -1.69 -1.06 -0.37 0.17 NQPRF16 I have to limit the things I do for fun at home (like reading, listening to music, etc.). Reversed 2.32 -2.11 -1.49 -0.66 0.00 NQPRF17 I can keep up with my social commitments. 5.48 -1.67 -1.08 -0.62 -0.12 NQPRF18 I am able to do all of my regular leisure activities. 4.68 -1.81 -1.14 -0.59 -0.05 NQPRF19 I have to limit my hobbies or leisure activities. Reversed 3.25 -1.68 -1.08 -0.49 0.11 NQPRF20 I am able to do my hobbies or leisure activities. 4.75 -1.75 -1.19 -0.56 0.02 NQPRF21 I am able to do all of the community activities that I want to do. 4.86 -1.47 -0.91 -0.42 0.00 NQPRF22 I am able to do all of the leisure activities that people expect me to do. 5.77 -1.56 -1.03 -0.48 0.03 NQPRF23 I have to do my hobbies or leisure activities for shorter periods of time than usual for me. Reversed 3.13 -1.56 -0.95 -0.39 0.22 NQPRF24 I have to limit social activities outside my home. Reversed 4.49 -1.40 -0.91 -0.41 0.09 NQPRF25 I have trouble keeping in touch with others. Reversed 3.19 -1.80 -1.24 -0.55 0.05 NQPRF26 I am able to participate in leisure activities. 5.00 -1.76 -1.28 -0.51 0.03 NQPRF27 I can do all the leisure activities that I want to do. 5.34 -1.55 -0.98 -0.45 0.02
209

APPENDIX B- Neuro-QoL Technical Report Version 1.0
Neuro-QOL Item Name
Item Stem Rating Scale
Item
slop
e
Thre
shol
d 1
Thre
shol
d 2
Thre
shol
d 3
Thre
shol
d 4
NQPRF28 I am able to do all of the community activities that people expect me to do. 5.08 -1.44 -0.90 -0.38 0.14 NQPRF29 I am able to go out for entertainment as much as I want. 3.68 -1.39 -0.83 -0.35 0.19 NQPRF30 I have to limit the things I do for fun outside my home. Reversed 4.18 -1.39 -0.83 -0.26 0.23 NQPRF31 I am doing fewer social activities with groups of people than usual for me. Reversed 3.45 -1.43 -0.95 -0.41 0.12 NQPRF32 I am able to perform my daily routines. 5.92 -1.78 -1.35 -0.78 -0.33 NQPRF33 I am able to run errands without difficulty. 5.09 -1.54 -1.21 -0.68 -0.25 NQPRF34 I can keep up with my work responsibilities (include work at home). 5.63 -1.58 -1.17 -0.60 -0.19 NQPRF35 I am able to do all of my usual work (include work at home). 6.33 -1.56 -1.12 -0.64 -0.17 NQPRF37 I am accomplishing as much as usual at work for me (include work at home). 5.05 -1.53 -1.06 -0.56 -0.05 NQPRF38 My ability to do my work is as good as it can be (include work at home). 4.24 -1.63 -1.20 -0.64 -0.09 NQPRF39 I can do everything for work that I want to do (include work at home). 5.73 -1.46 -1.00 -0.52 -0.01 NQPRF40 I have trouble doing my regular chores or tasks. Reversed 5.22 -1.50 -1.03 -0.48 0.03 NQPRF41 I am able to do all of the work that people expect me to do (include work at home). 6.16 -1.54 -1.09 -0.53 -0.04 NQPRF42 I am limited in doing my work (include work at home). Reversed 4.74 -1.43 -1.03 -0.53 0.00 NQPRF43 I have to do my work for shorter periods of time than usual for me (include work at
home). Reversed 3.84 -1.40 -0.92 -0.41 0.14
NQPRF46 I am able to do all of my usual work. 5.81 -1.48 -1.06 -0.59 -0.15 NQPRF47 I am limited in doing my work. Reversed 4.69 -1.33 -0.99 -0.46 0.02 NQPRF48 I am able to do all of the work that people expect me to do. 5.56 -1.50 -1.08 -0.49 -0.07 NQPRF49 I have to do my work for shorter periods of time than usual for me. Reversed 3.72 -1.43 -0.91 -0.40 0.06
210

APPENDIX B- Neuro-QoL Technical Report Version 1.0
Table 52: Excluded items from the Ability to Participate in Social Roles and Activities item bank. For each item, the item context is In the past 7 days; for non-reversed items the rating scale is 1 = Never; 2 = Rarely; 3 = Sometimes; 4 = Often 5 = Always. For reversed items the rating scale is 5 = Never; 4 = Rarely; 3 = Sometimes; 2 = Often; 1 = Always Neuro-QOL Item Name Item Stem
Rating Scale
NQPRF10 I have to limit my regular activities with friends. Reversed
NQPRF36 I have trouble taking care of my regular personal and household responsibilities. Reversed
NQPRF44 I am able to work at a volunteer job outside my home. NQPRF45 I am limited in working at a volunteer job outside my home. Reversed
211

APPENDIX B- Neuro-QoL Technical Report Version 1.0
Table 53: Items in the Communication Difficulty pool. Neuro-QOL Item Name Item Context Item Stem Rating Scale
NQCOG01
How much DIFFICULTY do you currently have writing notes to yourself, such as appointments or 'to do' lists?
5 = None 4 = A Little 3 = Somewhat 2 = A lot 1=Cannot Do
NQCOG02
How much DIFFICULTY do you currently have composing a brief note or e-mail to someone?
5 = None 4 = A Little 3 = Somewhat 2 = A lot 1=Cannot Do
NQCOG03
How much DIFFICULTY do you currently have understanding familiar people during ordinary conversations?
5 = None 4 = A Little 3 = Somewhat 2 = A lot 1=Cannot Do
NQCOG04
How much DIFFICULTY do you currently have understanding family and friends on the phone?
5 = None 4 = A Little 3 = Somewhat 2 = A lot 1=Cannot Do
NQCOG08
How much DIFFICULTY do you currently have carrying on a conversation with a small group of familiar people (e.g., family or a few friends)?
5 = None 4 = A Little 3 = Somewhat 2 = A lot 1=Cannot Do
NQCOG10
How much DIFFICULTY do you currently have organizing what you want to say?
5 = None 4 = A Little 3 = Somewhat 2 = A lot 1=Cannot Do
NQCOG11
How much DIFFICULTY do you currently have speaking clearly enough to use the telephone?
5 = None 4 = A Little 3 = Somewhat 2 = A lot 1=Cannot Do
NQCOG61 In the past 7 days My speech was difficult for others to understand
5 = Never 4 = Rarely (once) 3 = Sometimes (two or three times) 2=Often (about once a day) 1 = Very often (several times a day)
Table 54: IRT parameters for the Satisfaction with Social Roles and Activities item bank.
212

APPENDIX B- Neuro-QoL Technical Report Version 1.0
For each item, the item context is In the past 7 days; for non-reversed items the rating scale is 1 = Not at all; 2 = A little bit; 3 = Somewhat; 4 = Quite a bit; 5 = Very much. For reversed items the rating scale is 5 = Not at all; 4 = A little bit; 3 = Somewhat; 2 = Quite a bit; 1 = Very much Neuro-QOL Item Name
PROMIS Item Name
Item Stem Rating Scale
Item
slop
e
Thre
shol
d 1
Thre
shol
d 2
Thre
shol
d 3
Thre
shol
d 4
NQSAT01 I feel that my family is disappointed in my ability to socialize with them. Reversed 3.44 -1.69 -1.35 -0.79 -0.34 NQSAT02 I am disappointed in my ability to meet the needs of my family. Reversed 4.03 -1.47 -1.05 -0.67 -0.26 NQSAT03 I am bothered by my limitations in regular family activities. Reversed 4.92 -1.39 -0.95 -0.64 -0.32 NQSAT04 SRPSAT08 I feel good about my ability to do things for my family. 3.59 -1.33 -1.00 -0.54 0.01 NQSAT05 SRPSAT50 I am satisfied with my ability to meet the needs of those who depend on
me. 5.15 -1.23 -0.89 -0.54 -0.03 NQSAT06 SRPSAT06 I am satisfied with my ability to do things for my family. 5.16 -1.28 -0.97 -0.50 -0.04 NQSAT08 I am satisfied with my current level of activity with family members. 4.95 -1.21 -0.94 -0.40 0.06 NQSAT10 I feel that my friends are disappointed in my ability to socialize with them. Reversed 3.47 -1.71 -1.33 -0.85 -0.45 NQSAT11 I am disappointed in my ability to meet the needs of my friends. Reversed 4.72 -1.49 -1.12 -0.70 -0.37 NQSAT12 I am disappointed in my ability to do things for my friends. Reversed 4.60 -1.46 -1.09 -0.68 -0.30 NQSAT13 I am disappointed in my ability to socialize with friends. Reversed 4.25 -1.51 -1.11 -0.74 -0.36 NQSAT14 I am bothered by limitations in my regular activities with friends. Reversed 4.78 -1.47 -1.05 -0.69 -0.30 NQSAT15 I am disappointed in my ability to keep in touch with others. Reversed 3.61 -1.65 -1.18 -0.73 -0.25 NQSAT18 SRPSAT20 I am satisfied with my ability to do things for my friends. 4.86 -1.20 -0.79 -0.31 0.12 NQSAT19 SRPSAT36 I am happy with how much I do for my friends. 4.18 -1.15 -0.77 -0.27 0.22 NQSAT20 SRPSAT25 I am satisfied with my current level of activities with my friends. 4.87 -1.09 -0.71 -0.28 0.16 NQSAT21 SRPSAT37 I am satisfied with the amount of time I spend visiting friends. 3.63 -1.08 -0.69 -0.21 0.28 NQSAT22 I feel that others are disappointed in my ability to do community activities. Reversed 2.78 -1.80 -1.42 -0.94 -0.48 NQSAT23 I am disappointed in my ability to socialize with my family. Reversed 4.10 -1.44 -1.10 -0.72 -0.34 NQSAT24 I am disappointed in my ability to do leisure activities. Reversed 5.10 -1.35 -0.99 -0.67 -0.28 NQSAT25 I am bothered by limitations in doing my hobbies or leisure activities. Reversed 4.18 -1.36 -1.00 -0.64 -0.22 NQSAT27 SRPSAT48 I am satisfied with my ability to do things for fun at home (like reading,
listening to music, etc.). 3.02 -1.55 -1.14 -0.59 -0.09 NQSAT29 SRPSAT23 I am satisfied with my ability to do leisure activities. 4.74 -1.27 -0.83 -0.39 0.06 NQSAT30 SRPSAT52 I am satisfied with my ability to do all of the leisure activities that are really
important to me. 5.14 -1.21 -0.86 -0.41 0.04
213

APPENDIX B- Neuro-QoL Technical Report Version 1.0
Neuro-QOL Item Name
PROMIS Item Name
Item Stem Rating Scale
Item
slop
e
Thre
shol
d 1
Thre
shol
d 2
Thre
shol
d 3
Thre
shol
d 4
NQSAT31 SRPSAT19 I am satisfied with my ability to do all of the community activities that are really important to me. 3.84 -1.17 -0.77 -0.28 0.10
NQSAT32 SRPSAT05 I am satisfied with the amount of time I spend doing leisure activities. 4.56 -1.32 -0.89 -0.32 0.09 NQSAT33 SRPSAT33 I am satisfied with my ability to do things for fun outside my home. 5.23 -1.06 -0.73 -0.30 0.11 NQSAT34 SRPSAT10 I am satisfied with my current level of social activity. 4.44 -1.12 -0.77 -0.31 0.13 NQSAT35 I feel that I am disappointing other people at work. Reversed 2.67 -1.88 -1.60 -1.19 -0.89 NQSAT36 I am disappointed in my ability to perform my daily routines. Reversed 5.19 -1.33 -1.05 -0.79 -0.41 NQSAT37 I am disappointed in my ability to work (include work at home). Reversed 5.22 -1.33 -1.01 -0.76 -0.42 NQSAT38 I am bothered by limitations in performing my daily routines. Reversed 5.47 -1.32 -0.98 -0.62 -0.28 NQSAT39 I am disappointed in my ability to take care of personal and household
responsibilities. Reversed
5.77 -1.36 -1.04 -0.67 -0.32 NQSAT40 I am bothered by limitations in performing my work (include work at
home). Reversed 5.01 -1.37 -1.05 -0.71 -0.36 NQSAT41 SRPSAT51 I am satisfied with my ability to run errands. 3.38 -1.29 -0.98 -0.55 -0.07 NQSAT42 SRPSAT49 I am satisfied with my ability to perform my daily routines. 5.52 -1.29 -0.96 -0.52 -0.16 NQSAT43 SRPSAT24 I am satisfied with my ability to work (include work at home). 5.86 -1.17 -0.90 -0.42 -0.09 NQSAT44 SRPSAT09 I am satisfied with my ability to do the work that is really important to me
(include work at home). 6.12 -1.23 -0.87 -0.46 -0.08 NQSAT45 I am satisfied with my ability to take care of personal and household
responsibilities. 6.74 -1.28 -0.93 -0.51 -0.13 NQSAT46 I am satisfied with my ability to do household chores or tasks. 6.27 -1.20 -0.88 -0.45 -0.09 NQSAT47 SRPSAT07 I am satisfied with how much of my work I can do (include work at home). 6.43 -1.16 -0.86 -0.45 0.01 NQSAT48 SRPSAT21 I am satisfied with the amount of time I spend doing work (include work at
home). 5.66 -1.16 -0.85 -0.38 0.08 NQSAT49 SRPSAT38 I am satisfied with the amount of time I spend performing my daily
routines. 5.80 -1.20 -0.90 -0.42 0.02 NQSAT50 I am satisfied with my ability to work. 5.27 -1.06 -0.85 -0.47 -0.08 NQSAT51 I am bothered by limitations in performing my work. Reversed 3.62 -1.32 -0.90 -0.55 -0.21
214

APPENDIX B- Neuro-QoL Technical Report Version 1.0
Table 55: Excluded items for the Satisfaction with Social Roles and Activities item bank. For each item, the item context is In the past 7 days. All excluded items were reversed-scored; the rating scale is 5 = Not at all; 4 = A little bit; 3 = Somewhat; 2 = Quite a bit; 1 = Very much Neuro-QOL Item Name Item Stem NQSAT07 I am bothered if I have to depend on my family for help. NQSAT09 I am bothered if I have to depend on others for help. NQSAT16 I am bothered if I have to depend on my friends for help. NQSAT17 I wish I could visit my friends more often. NQSAT28 I wish I could do more social activities outside my home. NQSAT26 I wish I could do more social activities with groups of people.
215

APPENDIX B- Neuro-QoL Technical Report Version 1.0
Table 56: IRT parameters for the Stigma pediatric item bank. For each item, the item context is In Lately… . The rating scale is 1 = Never; 2 = Rarely; 3 = Sometimes; 4 = Often; 5 = Always.
Neuro-QOL Item Name Item Stem Ite
m sl
ope
Thre
shol
d 1
Thre
shol
d 2
Thre
shol
d 3
Thre
shol
d 4
NQSTGped01 Because of my illness, others my age bullied me. 3.06 0.18 0.81 1.41 2.27 NQSTGped02 Because of my illness, others my age seemed uncomfortable with me. 3.06 0.03 0.45 1.15 2.02 NQSTGped03 Because of my illness, others my age avoided me. 3.06 0.28 0.62 1.19 1.94 NQSTGped04 Because of my illness, I felt left out of things. 3.06 -0.32 0.06 0.84 1.56 NQSTGped05 Because of my illness, others my age were mean to me. 3.06 0.22 0.56 1.47 2.04 NQSTGped06 Because of my illness, others my age made fun of me. 3.06 0.24 0.63 1.23 1.77 NQSTGped07 Because of my illness, I felt embarrassed when I was in front of others my age. 3.06 -0.07 0.46 1.21 1.82 NQSTGped08 Because of my illness, others my age tended to stare at me. 3.06 0.06 0.52 1.23 1.60 NQSTGped09 Because of my illness, I worried about what others my age thought about me. 3.06 -0.21 0.32 0.89 1.38 NQSTGped10 Because of my illness, I was treated unfairly by others my age. 3.06 0.19 0.53 1.24 1.71 NQSTGped11 I was unhappy about how my illness affected my appearance. 3.06 0.01 0.54 1.07 1.42 NQSTGped13 Because of my illness, others my age tended to ignore my good points. 3.06 0.18 0.49 1.20 1.79 NQSTGped14 Because of my illness, I worried that I made life harder for my parents or guardians. 3.06 -0.37 0.04 0.77 1.57 NQSTGped15 I felt embarrassed about my illness. 3.06 -0.10 0.29 1.00 1.41 NQSTGped16 I felt embarrassed about the way I talk. 3.06 0.22 0.50 1.40 1.81 NQSTGped17 Because of my illness, I felt different from others my age. 3.06 -0.45 0.09 0.70 1.17 NQSTGped19 I avoided making new friends to avoid talking about my illness. 3.06 0.29 0.63 1.13 1.70 NQSTGped20 I lost friends by telling them that I have this illness. 3.06 0.74 1.03 1.72 2.30
216

APPENDIX B- Neuro-QoL Technical Report Version 1.0
Table 57: Uncalibrated items for the Stigma pediatric item bank. For each item, the item context is In Lately… . The rating scale is 1 = Never; 2 = Rarely; 3 = Sometimes; 4 = Often; 5 = Always. Neuro-QOL Item Name Item Stem NQSTGped12 Because of my illness, it was hard for me to stay neat and clean. NQSTGped18 I tended to blame myself for my problems.
217

APPENDIX B- Neuro-QoL Technical Report Version 1.0
Table 58: IRT parameters for the pediatric Depression item bank. For each item, the item context is In the past 7 days… . For all items except one, the rating scale is 1 = Never; 2 = Rarely; 3 = Sometimes; 4 = Often; 5 = Always. *** For item NQEMNped32, the rating scale is 1 = not at all; 2 = a little bit; 3 = somewhat; 4 = quite a bit; 5 = very much
Neuro-QOL Item Name PROMIS Item Name Item Stem Item
slop
e
Thre
shol
d 1
Thre
shol
d 2
Thre
shol
d 3
Thre
shol
d 4
NQEMNped01 I felt too sad to do things with friends. 2.62 -0.03 0.66 1.92 2.60 NQEMNped04 228R1 I felt sad. 2.91 -0.50 0.30 1.48 2.48 NQEMNped07 3477R1 I thought that my life was bad. 3.19 -0.22 0.46 1.53 2.21 NQEMNped08 I was bored. 1.83 -1.53 -0.82 0.81 1.97 NQEMNped09 711R1 I felt lonely. 3.27 -0.49 0.15 1.24 1.98 NQEMNped11 I felt frustrated. 2.60 -1.00 -0.22 1.10 2.06 NQEMNped31 I was less interested in doing things I usually enjoy. 3.93 -0.03 0.70 1.63 2.23 NQEMNped32 *** My mood swings from good feelings to bad feelings. 3.66 -0.20 0.70 1.39 2.09 NQEMNped33 I had trouble sleeping. 2.38 -0.23 0.62 1.47 2.07 NQEMNped34 It was hard for me to care about anything. 4.46 0.15 0.79 1.52 2.26 NQEMNped36 3952aR2 It was hard for me to have fun. 4.78 -0.04 0.58 1.39 2.05 NQEMNped37 I felt that no one loved me. 3.55 0.20 0.81 1.67 2.19 NQEMNped38 I cried more often than usual. 3.33 0.41 1.12 1.81 2.37 NQEMNped39 461R1 I felt alone. 4.51 0.06 0.68 1.52 2.22 NQEMNped40 5035R1 I felt like I couldn't do anything right. 3.91 -0.24 0.42 1.38 1.87 NQEMNped41 5041R1 I felt everything in my life went wrong. 4.97 -0.01 0.57 1.35 1.85 NQEMNped42 I felt too sad to do my schoolwork. 4.76 0.24 0.82 1.54 2.14
One item was not calibrated - NQEMNped35 (PROMIS item ID 2697R1), I wanted to be by myself.
218

APPENDIX B- Neuro-QoL Technical Report Version 1.0
Table 59: IRT parameters for the pediatric Anxiety item bank. For each item, the item context is In the past 7 days… .
Neuro-QOL Item Name
PROMIS Item Name Item Stem Rating Scale Ite
m sl
ope
Thre
shol
d 1
Thre
shol
d 2
Thre
shol
d 3
Thre
shol
d 4
NQEMNped22 I felt afraid to go out alone.
1 = Never 2 = Almost Never 3 = Sometimes 4 = Often 5 = Almost Always 3.10 0.23 0.83 1.71 2.21
NQEMNped23 Being worried made it hard for me to be with my friends.
1 = Never 2 = Almost Never 3 = Sometimes 4 = Often 5 = Almost Always 5.32 0.24 0.75 1.54 2.31
NQEMNped24 It was hard to do schoolwork because I was nervous or worried.
1 = Never 2 = Almost Never 3 = Sometimes 4 = Often 5 = Almost Always 4.47 0.06 0.63 1.53 2.14
NQEMNped26 I felt afraid.
1 = Never 2 = Almost Never 3 = Sometimes 4 = Often 5 = Almost Always 4.27 0.01 0.79 1.81 2.23
NQEMNped28 3459bR1 I worried when I was at home.
1 = Never 2 = Almost Never 3 = Sometimes 4 = Often 5 = Almost Always 4.24 0.21 0.91 1.87 2.47
NQEMNped29 5044R1 I felt worried.
1 = Never 2 = Almost Never 3 = Sometimes 4 = Often 5 = Almost Always 3.64 -0.27 0.47 1.63 2.23
NQEMNped43 I worry that my health might get worse.
1 = not at all 2 = a little bit 3 = somewhat 4 = quite a bit 5 = very much 3.96 0.41 1.06 1.63 2.15
NQEMNped46
I worry about doing well in school.
1 = not at all 2 = a little bit 3 = somewhat
1.92
-0.62
0.47
1.27
2.13
219

APPENDIX B- Neuro-QoL Technical Report Version 1.0
Neuro-QOL Item Name
PROMIS Item Name Item Stem Rating Scale Ite
m sl
ope
Thre
shol
d 1
Thre
shol
d 2
Thre
shol
d 3
Thre
shol
d 4
4 = quite a bit 5 = very much
NQEMNped02 I become anxious when I go back to the hospital or clinic.
1 = not at all 2 = a little bit 3 = somewhat 4 = quite a bit 5 = very much 1.69 0.33 1.30 1.99 2.79
NQEMNped03 I worry about how my health will affect my future.
1 = not at all 2 = a little bit 3 = somewhat 4 = quite a bit 5 = very much 2.00 0.12 1.04 1.67 2.49
NQEMNped06 Because of my health, I worry about having a boyfriend or girlfriend.
1 = not at all 2 = a little bit 3 = somewhat 4 = quite a bit 5 = very much 2.44 0.43 0.95 1.47 2.15
NQEMNped10 I worry about getting a good job because of my medical condition.
1 = not at all 2 = a little bit 3 = somewhat 4 = quite a bit 5 = very much 2.90 0.57 1.05 1.55 1.97
NQEMNped20 I get nervous more easily than other people.
1 = not at all 2 = a little bit 3 = somewhat 4 = quite a bit 5 = very much 2.86 -0.20 0.78 1.45 2.36
NQEMNped21 I worried when I was away from my family.
1 = Never 2 = Almost Never 3 = Sometimes 4 = Often 5 = Almost Always 2.83 -0.13 0.65 1.44 2.19
NQEMNped25 I got scared easily.
1 = Never 2 = Almost Never 3 = Sometimes 4 = Often 5 = Almost Always 3.74 0.11 0.88 1.74 2.26
NQEMNped27 I was worried that I might die.
1 = Never 2 = Almost Never 3 = Sometimes 4 = Often 5 = Almost Always 3.58 0.53 1.13 1.87 2.40
220

APPENDIX B- Neuro-QoL Technical Report Version 1.0
Neuro-QOL Item Name
PROMIS Item Name Item Stem Rating Scale Ite
m sl
ope
Thre
shol
d 1
Thre
shol
d 2
Thre
shol
d 3
Thre
shol
d 4
NQEMNped30 713R1 I felt nervous.
1 = Never 2 = Almost Never 3 = Sometimes 4 = Often 5 = Almost Always 3.83 -0.37 0.39 1.52 2.30
NQEMNped44 Because of my health, I worry about being able to go to college.
1 = not at all 2 = a little bit 3 = somewhat 4 = quite a bit 5 = very much 3.26 0.53 1.06 1.60 1.99
NQEMNped45 Because of my health, I worry about getting a job to support myself.
1 = not at all 2 = a little bit 3 = somewhat 4 = quite a bit 5 = very much 3.54 0.39 0.99 1.42 1.88
One item (NQEMNped05) was excluded from the pediatric Anxiety Item bank: I felt like eating; rating scale 1 = Never; 2 = Almost Never; 3 = Sometimes; 4 = Often; 5 = Almost Always
221

APPENDIX B- Neuro-QoL Technical Report Version 1.0
Table 60: IRT parameters for the pediatric Anger item bank. For each item, the item context is In the past 7 days… . The rating scale is 1 = Never; 2 = Almost Never; 3 = Sometimes; 4 = Often; 5 = Almost Always
Neuro-QOL Item Name Item Stem Item
slop
e
Thre
shol
d 1
Thre
shol
d 2
Thre
shol
d 3
Thre
shol
d 4
NQEMNped12 Being angry made it hard for me to be with my friends. 3.31 0.04 0.60 1.56 2.41 NQEMNped13 It was hard to do schoolwork because I was angry. 3.22 -0.02 0.54 1.50 2.20 NQEMNped14 I felt angry. 3.79 -0.64 0.17 1.38 2.16 NQEMNped15 I was so mad that I felt like throwing something. 5.91 -0.16 0.45 1.36 1.99 NQEMNped16 I was so mad that I felt like hitting something. 6.57 -0.04 0.60 1.43 1.96 NQEMNped17 I was so mad that I felt like yelling at someone. 4.94 -0.54 0.18 1.18 1.93 NQEMNped18 I was so mad that I felt like breaking things. 5.45 0.06 0.71 1.52 2.17 NQEMNped19 I was so mad that I acted grouchy towards other people. 3.21 -0.68 0.01 1.21 2.05
222

APPENDIX B- Neuro-QoL Technical Report Version 1.0
Table 61: IRT parameters for the pediatric Social Relations – Interactions with Peers item bank. For all items except one, the item context is In the past 7 days… . For all items except one, the rating scale is 1 = Never; 2 = Almost Never; 3 = Sometimes; 4 = Often; 5 = Almost Always *** For item NQSCLped26 (I think I have fewer friends than other people my age), there is no item context; no time frame was used. For this item, the rating sale is 1 = not at all; 2 = a little bit; 3 = somewhat; 4 = quite a bit; 5 = very much
Neuro-QOL Item Name
PROMIS Item Name Item Stem Ite
m sl
ope
Thre
shol
d 1
Thre
shol
d 2
Thre
shol
d 3
Thre
shol
d 4
*** NQSCLped26 I think I have fewer friends than other people my age. 2.01 -1.82 -1.28 -0.52 0.03 NQSCLped09 5018R1 I felt accepted by other kids my age. 2.75 -2.09 -1.51 -0.62 0.15 NQSCLped10 I was able to talk openly with my friends. 3.25 -2.03 -1.57 -0.56 0.21 NQSCLped11 I felt close to my friends. 3.93 -2.11 -1.66 -0.52 0.24 NQSCLped12 5058R1 I was able to count on my friends. 3.26 -2.15 -1.55 -0.47 0.35 NQSCLped18 5150R1 I shared with other kids (food, games, pens, etc.). 1.82 -2.91 -2.01 -0.48 0.71 NQSCLped19 I was able to stand up for myself. 2.29 -2.83 -1.96 -0.71 0.15 NQSCLped20 I felt comfortable with others my age. 4.08 -2.22 -1.59 -0.69 -0.07 NQSCLped28 I was happy with the friends I had. 3.11 -2.50 -1.87 -0.89 0.02 NQSCLped29 My friends ignored me. 2.14 -2.79 -2.15 -1.02 -0.05 NQSCLped30 I felt comfortable talking with my friends. 4.49 -2.05 -1.71 -0.82 -0.04 NQSCLped31 I wanted to spend time with my friends. 2.21 -2.99 -2.41 -0.94 0.18 NQSCLped32 5052R1 I spent time with my friends. 2.79 -3.01 -1.79 -0.67 0.47 NQSCLped33 I did things with other kids my age. 2.88 -2.73 -1.73 -0.57 0.51 NQSCLped36 5055R1 My friends and I helped each other out. 2.77 -2.52 -1.89 -0.39 0.69 NQSCLped38 I had fun with my friends. 3.18 -2.47 -1.92 -0.78 0.19
Table 62: Uncalibrated items for the pediatric Social Relations – Interactions with Peers item bank. For all items except one, the item context is In the past 7 days… .
223
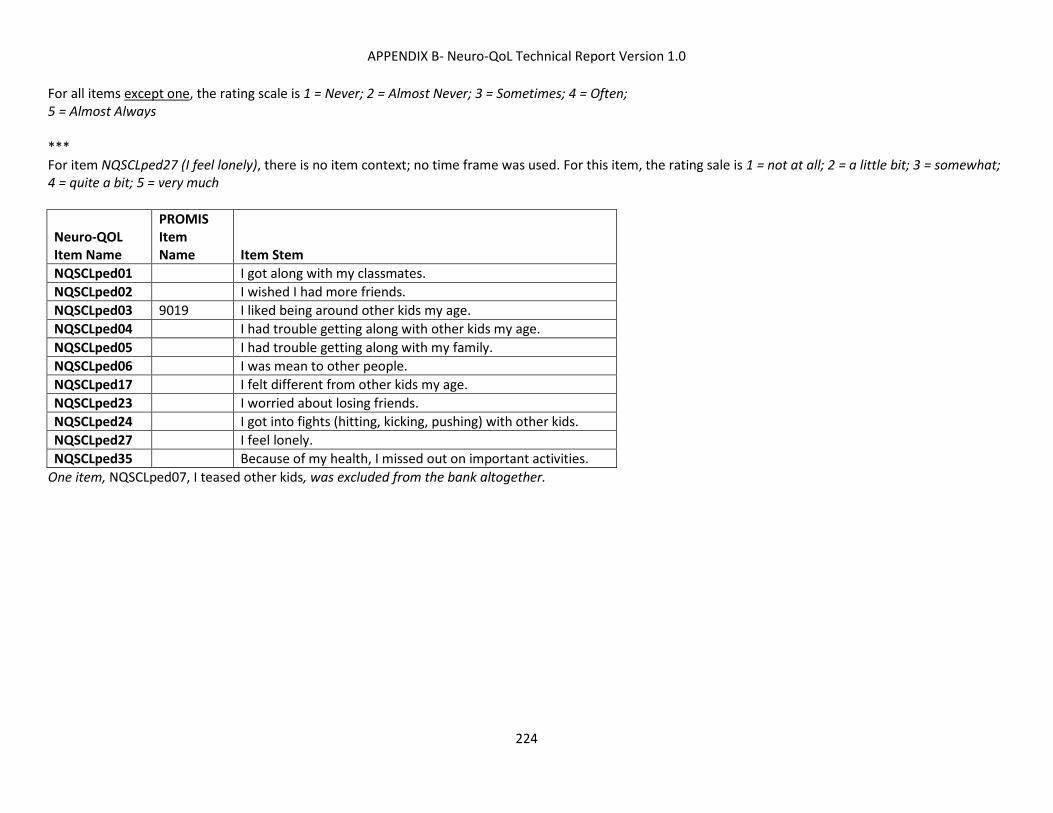
APPENDIX B- Neuro-QoL Technical Report Version 1.0
For all items except one, the rating scale is 1 = Never; 2 = Almost Never; 3 = Sometimes; 4 = Often; 5 = Almost Always *** For item NQSCLped27 (I feel lonely), there is no item context; no time frame was used. For this item, the rating sale is 1 = not at all; 2 = a little bit; 3 = somewhat; 4 = quite a bit; 5 = very much
Neuro-QOL Item Name
PROMIS Item Name Item Stem
NQSCLped01 I got along with my classmates. NQSCLped02 I wished I had more friends. NQSCLped03 9019 I liked being around other kids my age. NQSCLped04 I had trouble getting along with other kids my age. NQSCLped05 I had trouble getting along with my family. NQSCLped06 I was mean to other people. NQSCLped17 I felt different from other kids my age. NQSCLped23 I worried about losing friends. NQSCLped24 I got into fights (hitting, kicking, pushing) with other kids. NQSCLped27 I feel lonely. NQSCLped35 Because of my health, I missed out on important activities.
One item, NQSCLped07, I teased other kids, was excluded from the bank altogether.
224

APPENDIX B- Neuro-QoL Technical Report Version 1.0
Table 63: Items for the pediatric Social Relations – Interactions with Adults item pool. For each item, the item context is In the past 7 days…; the rating scale is 1 = Never; 2 = Almost Never; 3 = Sometimes; 4 = Often; 5 = Almost Always
Neuro-QOL Item Name Item Stem NQSCLped08 I got along with my parents or guardians. NQSCLped13 I felt loved by my parents or guardians. NQSCLped14 I was happy at home. NQSCLped15 My parents or guardians spent enough time with me. NQSCLped16 I got along well with my teachers. NQSCLped21 My teachers accepted me. NQSCLped22 My teachers respected me. NQSCLped25 My parents or guardians seem to know what's important to me. NQSCLped34 I felt comfortable talking with my parents or guardians. NQSCLped37 I argued with my parents or other adults.
225

APPENDIX B- Neuro-QoL Technical Report Version 1.0
Table 64: IRT parameters for the pediatric Applied Cognition – General Concerns item bank. For each item, the rating scale is 5 = not at all; 4 = a little bit; 3 = somewhat; 2 = quite a bit; 1 = very much
Neuro-QOL Item Name Item Stem Ite
m sl
ope
Thre
shol
d 1
Thre
shol
d 2
Thre
shol
d 3
Thre
shol
d 4
NQCOGped02 I have a hard time keeping track of my homework. 2.36 -1.61 -0.81 -0.10 0.59 NQCOGped03 I forget schoolwork that I need to do. 2.36 -1.70 -0.97 -0.40 0.68 NQCOGped04 I forget to bring books or worksheets home that I need for homework. 2.36 -1.47 -1.01 -0.52 0.36 NQCOGped05 I sometimes forget what I was going to say. 2.36 -1.64 -0.89 -0.06 1.07 NQCOGped07 I have to read something several times to understand it. 2.36 -1.40 -0.85 -0.38 0.69 NQCOGped08 I react slower than most people my age when I play games. 2.36 -1.60 -0.88 -0.43 -0.01 NQCOGped10 It is hard for me to find the right words to say what I mean. 2.36 -1.38 -0.82 -0.26 0.63 NQCOGped14 It takes me longer than other people to get my schoolwork done. 2.36 -1.22 -0.60 -0.12 0.67 NQCOGped15 I forget things easily. 2.36 -1.54 -0.82 -0.22 0.74
NQCOGped16 I have to use written lists more often than other people my age so I will not forget things. 2.36 -1.54 -1.01 -0.48 -0.01
NQCOGped17 I have trouble remembering to do things (e.g., school projects). 2.36 -1.66 -1.01 -0.35 0.52 NQCOGped18 It is hard for me to concentrate in school. 2.36 -1.67 -0.80 -0.21 0.73 NQCOGped19 I have trouble paying attention to the teacher. 2.36 -1.72 -1.05 -0.28 0.41 NQCOGped20 I have to work really hard to pay attention or I will make a mistake. 2.36 -1.58 -0.96 -0.32 0.40
226

APPENDIX B- Neuro-QoL Technical Report Version 1.0
Table 65: Uncalibrated items for the pediatric Applied Cognition – General Concerns item bank. For each item, the rating scale is 5 = not at all; 4 = a little bit; 3 = somewhat; 2 = quite a bit; 1 = very much Neuro-QOL Item Name Item Stem NQCOGped01 I often finish tests or exams after my other classmates. NQCOGped06 When I speak, people have trouble understanding me. NQCOGped09 I react slower than most people my age when I play sports. NQCOGped11 It takes time for me to find the right words to say what I mean. NQCOGped12 I get tongue-tied when I talk to other people. NQCOGped13 I need to work harder than other people to get my schoolwork done.
227

APPENDIX B- Neuro-QoL Technical Report Version 1.0
Table 66: IRT parameters for the pediatric Fatigue item bank. For each item, the item context is In the past 7 days… ; for non-reversed items the rating scale is 1 = none of the time; 2 = a little bit of time; 3 = some of the time; 4 = most of the time; 5 = all of the time. For reversed items the rating scale is 5 = none of the time; 4 = a little bit of time; 3 = some of the time; 2 = most of the time; 1 = all of the time
Neuro-QOL Item Name Item Stem Rating Scale Ite
m sl
ope
Thre
shol
d 1
Thre
shol
d 2
Thre
shol
d 3
Thre
shol
d 4
NQFTGped01 I felt tired.
2.11 -1.45 -0.23 1.20 2.23 NQFTGped04 I had trouble starting things because I was too tired.
2.11 -0.44 0.61 1.69 2.82
NQFTGped05 I had trouble finishing things because I was too tired.
2.11 -0.50 0.65 1.59 2.42 NQFTGped06 I needed to sleep during the day.
2.11 -0.09 0.49 1.31 2.13
NQFTGped08 Being tired made it hard to play or go out with my friends as much as I would like.
2.11 0.13 0.83 1.42 2.29
NQFTGped11 I was too tired to eat.
2.11 0.99 1.63 2.58 NQFTGped12 Being tired makes me sad.
2.11 0.41 0.94 1.76 2.27
NQFTGped13 Being tired makes me mad.
2.11 0.28 0.89 1.55 2.33 NQFTGped02 I had energy (or strength). Reversed 2.11 -1.32 -0.01 1.04 2.01 NQFTGped03 I could do my usual things at home. Reversed 2.11 -0.16 0.64 1.43 2.36 NQFTGped07 I got upset by being too tired to do things I wanted to do.
2.11 -0.03 0.77 1.53 2.22
NQFTGped09 I needed help doing my usual things at home.
2.11 -0.08 0.66 1.31 1.92 NQFTGped10 I felt weak.
2.11 -0.09 0.78 1.50 2.64
228

APPENDIX B- Neuro-QoL Technical Report Version 1.0
Table 67: IRT parameters for the pediatric Pain item bank. For each item, the item context is In the past 7 days. For all items except one, the rating scale is 1 = Never; 2 = Rarely; 3 = Sometimes; 4 = Often; 5 = Always. *** For item NQPAIped07 (When you had pain, how long did it last?), the rating scale is 1 = few seconds; 2 = few minutes; 3 = few hours; 4 = few days (less than a week); 5 = more than a week
Neuro-QOL Item Name
PROMIS Item Name Item Stem Ite
m sl
ope
Thre
shol
d 1
Thre
shol
d 2
Thre
shol
d 3
Thre
shol
d 4
NQPAIped01 I had a lot of pain. 3.96 -0.02 0.56 1.31 1.87 NQPAIped02 My pain was so bad that I needed to take medicine for it. 3.96 0.33 0.78 1.27 1.46 NQPAIped03 2032R1 I missed school when I had pain. 3.96 0.47 0.80 1.46 2.31 NQPAIped04 I had so much pain that I had to stop what I was doing. 3.96 0.42 0.84 1.44 1.90 NQPAIped05 9009 I hurt all over my body. 3.96 0.54 1.00 1.46 2.11 NQPAIped06 I had pain. 3.96 -0.18 0.53 1.29 1.90 *** NQPAIped07 When you had pain, how long did it last? 3.96 -0.23 0.55 1.15 1.73 NQPAIped08 3793R1 I had trouble sleeping when I had pain. 3.96 0.20 0.62 1.12 1.66 NQPAIped09 I had trouble watching TV when I had pain. 3.96 0.65 1.03 1.46 1.88
NQPAIped10 It was hard for me to play or hang out with my friends when I had pain. 3.96 0.18 0.79 1.27 1.53
229

APPENDIX B- Neuro-QoL Technical Report Version 1.0
Table 68: Items for the pediatric Lower Extremity Function (Mobility) scale. For each item, the item context is In the past 7 days… .
Neuro-QOL Item Name
PROMIS Item Name Item Stem Rating Scale
NQMOBped02 2647R2 I could get down on my knees without holding on to something.
4 = With no trouble 3 = With a little trouble 2 = With some trouble 1 = With a lot of trouble/Not able to do
NQMOBped03 236R1 I could keep up when I played with other kids.
4 = With no trouble 3 = With a little trouble 2 = With some trouble 1 = With a lot of trouble/Not able to do
NQMOBped04 I could walk for 15 minutes.
4 = With no trouble 3 = With a little trouble 2 = With some trouble 1 = With a lot of trouble/Not able to do
NQMOBped05 I could walk between rooms.
4 = With no trouble 3 = With a little trouble 2 = With some trouble 1 = With a lot of trouble/Not able to do
NQMOBped08 I could get on and off the toilet without using my arms.
4 = With no trouble 3 = With a little trouble 2 = With some trouble 1 = With a lot of trouble/Not able to do
NQMOBped09 I could get on and off a low chair.
4 = With no trouble 3 = With a little trouble 2 = With some trouble 1 = With a lot of trouble/Not able to do
NQMOBped13 I could get up from the floor by myself.
4 = With no trouble 3 = With a little trouble 2 = With some trouble 1 = With a lot of trouble/Not able to do
NQMOBped14 I could sit on a bench without support for 15 minutes.
4 = With no trouble 3 = With a little trouble 2 = With some trouble 1 = With a lot of trouble/Not able to do
NQMOBped17 I could stand on my tiptoes to reach for something.
4 = With no trouble 3 = With a little trouble 2 = With some trouble 1 = With a lot of trouble/Not able to do
NQMOBped18 I could stand on my tiptoes to put something (e.g., 5 lb bag of sugar) on a shelf.
4 = With no trouble 3 = With a little trouble 2 = With some trouble 1 = With a lot of trouble/Not able to do
NQMOBped20 I fall down easily. 5 = not at all 4 = a little bit
230

APPENDIX B- Neuro-QoL Technical Report Version 1.0
Neuro-QOL Item Name
PROMIS Item Name Item Stem Rating Scale
3 = somewhat 2 = quite a bit 1 = very much
NQMOBped21 I could walk on slightly uneven surfaces (such as cracked pavement).
4 = With no trouble 3 = With a little trouble 2 = With some trouble 1 = With a lot of trouble/Not able to do
NQMOBped24 I could walk on rough, uneven surfaces (such as lawns, gravel driveway).
4 = With no trouble 3 = With a little trouble 2 = With some trouble 1 = With a lot of trouble/Not able to do
NQMOBped25 I could walk up and down ramps or hills.
4 = With no trouble 3 = With a little trouble 2 = With some trouble 1 = With a lot of trouble/Not able to do
NQMOBped26 I could walk up and down curbs.
4 = With no trouble 3 = With a little trouble 2 = With some trouble 1 = With a lot of trouble/Not able to do
NQMOBped29 I could get in and out of a bus.
4 = With no trouble 3 = With a little trouble 2 = With some trouble 1 = With a lot of trouble/Not able to do
NQMOBped30 2118R1 I could get in and out of a car.
4 = With no trouble 3 = With a little trouble 2 = With some trouble 1 = With a lot of trouble/Not able to do
NQMOBped31 2202R2 I could walk across the room.
3 = With no trouble 2 = With a little trouble 1 = With some trouble/ With a lot of trouble/Not able to do
NQMOBped32 I could walk while wearing a backpack full of books.
4 = With no trouble 3 = With a little trouble 2 = With some trouble 1 = With a lot of trouble/Not able to do
NQMOBped33 676R1 I could bend over to pick something up.
4 = With no trouble 3 = With a little trouble 2 = With some trouble 1 = With a lot of trouble/Not able to do
NQMOBped35 I could do exercise that others my age can do.
4 = With no trouble; 3 = With a little trouble; 2 = With some trouble 1 = With a lot of trouble/Not able to do
Table 69: Items excluded from the pediatric Lower Extremity Function (Mobility) scale. For each item, the item context is In the past 7 days… .
231

APPENDIX B- Neuro-QoL Technical Report Version 1.0
Neuro-QOL Item Name Item Stem Rating Scale
NQMOBped01 I could keep my balance while walking for 30 minutes.
4 = With no trouble 3 = With a little trouble 2 = With some trouble 1 = With a lot of trouble/Not able to do
NQMOBped06 I could run as fast as others my own age.
4 = not at all 3 = a little bit 2 = somewhat 1 = quite a bit/very much
NQMOBped07 I could get on and off the toilet.
4 = With no trouble 3 = With a little trouble 2 = With some trouble 1 = With a lot of trouble/Not able to do
NQMOBped10 I could get in and out of an adult-sized chair.
4 = With no trouble 3 = With a little trouble 2 = With some trouble 1 = With a lot of trouble/Not able to do
NQMOBped11 I could get on and off a chair without using my arms.
4 = With no trouble 3 = With a little trouble 2 = With some trouble 1 = With a lot of trouble/Not able to do
NQMOBped12 I could walk for 30 minutes.
4 = With no trouble 3 = With a little trouble 2 = With some trouble 1 = With a lot of trouble/Not able to do
NQMOBped15 I could sit on a bench without back support for 30 minutes.
4 = With no trouble 3 = With a little trouble 2 = With some trouble 1 = With a lot of trouble/Not able to do
NQMOBped16 I could keep my balance while walking for 15 minutes.
4 = With no trouble 3 = With a little trouble 2 = With some trouble 1 = With a lot of trouble/Not able to do
NQMOBped19 I could turn my head all the way to the side to look at someone or something.
4 = With no trouble 3 = With a little trouble 2 = With some trouble 1 = With a lot of trouble/Not able to do
NQMOBped22
I lose my balance easily.
4 = not at all 3 = a little bit 2 = somewhat 1 = quite a bit/very much
NQMOBped23 I have trouble keeping up with other kids my age when walking.
4 = not at all 3 = a little bit 2 = somewhat
232

APPENDIX B- Neuro-QoL Technical Report Version 1.0
Neuro-QOL Item Name Item Stem Rating Scale
1 = quite a bit/very much
NQMOBped27 I could run for 15 minutes.
4 = With no trouble 3 = With a little trouble 2 = With some trouble 1 = With a lot of trouble/Not able to do
NQMOBped28 I could run for 30 minutes.
4 = With no trouble 3 = With a little trouble 2 = With some trouble 1 = With a lot of trouble/Not able to do
NQMOBped34 I could do sports that others my age can do.
4 = With no trouble 3 = With a little trouble 2 = With some trouble 1 = With a lot of trouble/Not able to do
NQMOBped36 I could carry bags (such as shopping bags) while going up a full flight of stairs.
4 = With no trouble 3 = With a little trouble 2 = With some trouble 1 = With a lot of trouble/Not able to do
NQMOBped37 I could carry bags (such as shopping bags) while going down a full flight of stairs.
4 = With no trouble 3 = With a little trouble 2 = With some trouble 1 = With a lot of trouble/Not able to do
NQMOBped38 I could ride a bicycle.
4 = With no trouble 3 = With a little trouble 2 = With some trouble 1 = With a lot of trouble/Not able to do
NQMOBped39 I could walk up 2-3 stairs.
4 = With no trouble 3 = With a little trouble 2 = With some trouble 1 = With a lot of trouble/Not able to do
233

APPENDIX B- Neuro-QoL Technical Report Version 1.0
Table 70: Items for the Upper Extremity Function (Fine motor, Activities of Daily Living) pediatric scale. For each item, the item context is In the past 7 days… .
Neuro-QOL Item Name Item Stem Rating Scale
NQUEXped03 I was able to use my fingers to point to something.
4 = With no trouble 3 = With a little trouble 2 = With some trouble 1 = With a lot of trouble/Not able to do
NQUEXped04 I was able to take off my socks.
4 = With no trouble 3 = With a little trouble 2 = With some trouble 1 = With a lot of trouble/Not able to do
NQUEXped05 I was able to put on and fasten my pants by myself.
4 = With no trouble 3 = With a little trouble 2 = With some trouble 1 = With a lot of trouble/Not able to do
NQUEXped06 I was able to button and unbutton my shirt.
4 = With no trouble 3 = With a little trouble 2 = With some trouble 1 = With a lot of trouble/Not able to do
NQUEXped11 I was able to use a spoon to bring food up to my mouth.
4 = With no trouble 3 = With a little trouble 2 = With some trouble 1 = With a lot of trouble/Not able to do
NQUEXped13 I was able to wipe myself thoroughly after using the toilet.
4 = With no trouble 3 = With a little trouble 2 = With some trouble 1 = With a lot of trouble/Not able to do
NQUEXped14 I was able to pull my pants back up after using the toilet.
4 = With no trouble 3 = With a little trouble 2 = With some trouble 1 = With a lot of trouble/Not able to do
NQUEXped15 I was able to hold a plate full of food.
4 = With no trouble 3 = With a little trouble 2 = With some trouble 1 = With a lot of trouble/Not able to do
NQUEXped19 I was able to cut a piece of paper in half with scissors.
4 = With no trouble 3 = With a little trouble 2 = With some trouble 1 = With a lot of trouble/Not able to do
NQUEXped24 I was able to take a shower by myself.
4 = With no trouble 3 = With a little trouble 2 = With some trouble 1 = With a lot of trouble/Not able to do
Table 71: Items excluded from the Upper Extremity Function (Fine motor, Activities of Daily Living) pediatric scale.
234
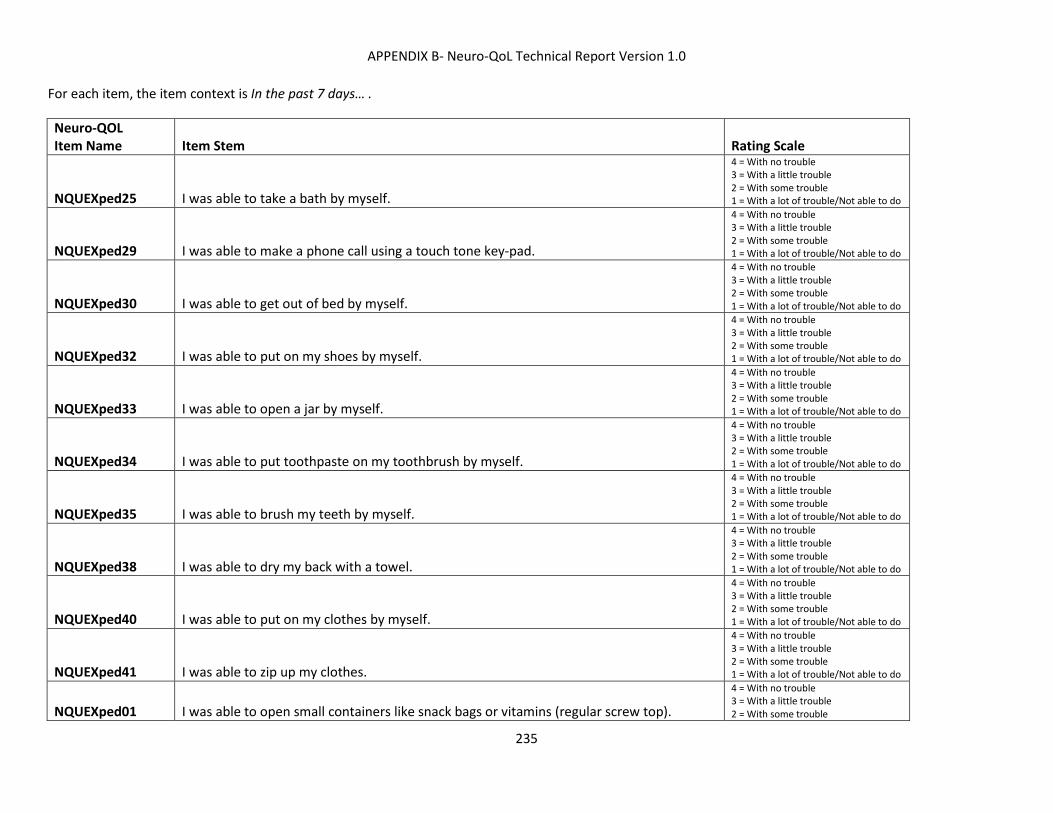
APPENDIX B- Neuro-QoL Technical Report Version 1.0
For each item, the item context is In the past 7 days… .
Neuro-QOL Item Name Item Stem Rating Scale
NQUEXped25 I was able to take a bath by myself.
4 = With no trouble 3 = With a little trouble 2 = With some trouble 1 = With a lot of trouble/Not able to do
NQUEXped29 I was able to make a phone call using a touch tone key-pad.
4 = With no trouble 3 = With a little trouble 2 = With some trouble 1 = With a lot of trouble/Not able to do
NQUEXped30 I was able to get out of bed by myself.
4 = With no trouble 3 = With a little trouble 2 = With some trouble 1 = With a lot of trouble/Not able to do
NQUEXped32 I was able to put on my shoes by myself.
4 = With no trouble 3 = With a little trouble 2 = With some trouble 1 = With a lot of trouble/Not able to do
NQUEXped33 I was able to open a jar by myself.
4 = With no trouble 3 = With a little trouble 2 = With some trouble 1 = With a lot of trouble/Not able to do
NQUEXped34 I was able to put toothpaste on my toothbrush by myself.
4 = With no trouble 3 = With a little trouble 2 = With some trouble 1 = With a lot of trouble/Not able to do
NQUEXped35 I was able to brush my teeth by myself.
4 = With no trouble 3 = With a little trouble 2 = With some trouble 1 = With a lot of trouble/Not able to do
NQUEXped38 I was able to dry my back with a towel.
4 = With no trouble 3 = With a little trouble 2 = With some trouble 1 = With a lot of trouble/Not able to do
NQUEXped40 I was able to put on my clothes by myself.
4 = With no trouble 3 = With a little trouble 2 = With some trouble 1 = With a lot of trouble/Not able to do
NQUEXped41 I was able to zip up my clothes.
4 = With no trouble 3 = With a little trouble 2 = With some trouble 1 = With a lot of trouble/Not able to do
NQUEXped01 I was able to open small containers like snack bags or vitamins (regular screw top).
4 = With no trouble 3 = With a little trouble 2 = With some trouble
235

APPENDIX B- Neuro-QoL Technical Report Version 1.0
Neuro-QOL Item Name Item Stem Rating Scale
1 = With a lot of trouble/Not able to do
NQUEXped02 I was able to wash and dry my hands without help.
4 = With no trouble 3 = With a little trouble 2 = With some trouble 1 = With a lot of trouble/Not able to do
NQUEXped07 I was able to unzip my pants.
4 = With no trouble 3 = With a little trouble 2 = With some trouble 1 = With a lot of trouble/Not able to do
NQUEXped08 I was able to hold a full cup of water in my hand.
4 = With no trouble 3 = With a little trouble 2 = With some trouble 1 = With a lot of trouble/Not able to do
NQUEXped09 I was able to wash my hair without help.
4 = With no trouble 3 = With a little trouble 2 = With some trouble 1 = With a lot of trouble/Not able to do
NQUEXped10 I was able to lift a cup of water to my mouth without spilling.
4 = With no trouble 3 = With a little trouble 2 = With some trouble 1 = With a lot of trouble/Not able to do
NQUEXped12 I was able to use a knife to spread butter or jelly on bread.
4 = With no trouble 3 = With a little trouble 2 = With some trouble 1 = With a lot of trouble/Not able to do
NQUEXped16 I was able to carry a tray of food in a cafeteria or restaurant.
4 = With no trouble 3 = With a little trouble 2 = With some trouble 1 = With a lot of trouble/Not able to do
NQUEXped17 I was able to pick up a gallon of milk with one hand and set it on the table.
4 = With no trouble 3 = With a little trouble 2 = With some trouble 1 = With a lot of trouble/Not able to do
NQUEXped18 I was able to get in and out of a tub without help.
4 = Never 3 = Almost Never 2 = Sometimes 1 = Often/Almost Always
NQUEXped20 I was able to style my hair by myself.
4 = With no trouble 3 = With a little trouble 2 = With some trouble 1 = With a lot of trouble/Not able to do
NQUEXped21 I was able to cover my nose when sneezing.
4 = With no trouble 3 = With a little trouble 2 = With some trouble 1 = With a lot of trouble/Not able to do
236

APPENDIX B- Neuro-QoL Technical Report Version 1.0
Neuro-QOL Item Name Item Stem Rating Scale
NQUEXped22 I was able to use a computer mouse.
4 = With no trouble 3 = With a little trouble 2 = With some trouble 1 = With a lot of trouble/Not able to do
NQUEXped23 I was able to open a can of soda.
4 = With no trouble 3 = With a little trouble 2 = With some trouble 1 = With a lot of trouble/Not able to do
NQUEXped26 I was able to change positions in my bed.
4 = With no trouble 3 = With a little trouble 2 = With some trouble 1 = With a lot of trouble/Not able to do
NQUEXped27 I was able to write a short note by using a pencil or pen.
4 = Never 3 = Almost Never 2 = Sometimes 1 = Often/Almost Always
NQUEXped28 I was able to communicate with friends using e-mail or text messaging.
4 = Never 3 = Almost Never 2 = Sometimes 1 = Often/Almost Always
NQUEXped31 I was able to get into bed by myself.
4 = With no trouble 3 = With a little trouble 2 = With some trouble 1 = With a lot of trouble/Not able to do
NQUEXped36 I was able to pull open heavy doors.
4 = With no trouble 3 = With a little trouble 2 = With some trouble 1 = With a lot of trouble/Not able to do
NQUEXped37 I was able to open the rings in school binders.
4 = With no trouble 3 = With a little trouble 2 = With some trouble 1 = With a lot of trouble/Not able to do
237

APPENDIX B- Neuro-QoL Technical Report Version 1.0
Additional Instrument Statistics
Table 72: Neuro-QOL Item Bank Standard Error and Alpha Reliability by T-scores Neuro-QOL Item Bank N T-Scores
10 20 30 40 50 60 70 80 90 Anxiety 513 SE 9.7 8.8 5.9 2.4 1.4 1.3 1.5 3.4 6.9
Reliability 0.06 0.23 0.65 0.94 0.98 0.98 0.98 0.88 0.53 Depression 513 SE 10.0 9.70 7.1 2.2 1.0 1.0 1.3 5.3 9.4
Reliability 0.00 0.05 0.49 0.95 0.99 0.99 0.98 0.72 0.12 Fatigue 511 SE 9.9 8.90 3.6 1.4 1.3 1.3 1.6 4.2 8.5
Reliability 0.02 0.22 0.87 0.98 0.98 0.98 0.98 0.83 0.28 Upper Extremity Function (Fine motor, ADL) 1095 SE 2.8 1.4 1.2 1.7 4.7 8.9 9.9 10.0 10.0
Reliability 0.92 0.98 0.99 0.97 0.78 0.21 0.02 0.00 0.00 Lower Extremity Function (Mobility) 1046 SE 4.8 1.8 1.4 1.3 1.9 5.1 9.2 10.0 10.0
Reliability 0.77 0.97 0.98 0.98 0.96 0.74 0.15 0.01 0.00 Applied Cognition (Executive Function) 1109 SE 3.2 2.00 1.7 1.9 3.3 6.6 9.3 9.9 10.0
Reliability 0.90 0.96 0.97 0.96 0.89 0.56 0.13 0.02 0.00 Applied Cognition (General Concerns) 1109 SE 6.4 2.30 1.3 1.3 1.9 5.3 9.0 9.9 10.0
Reliability 0.59 0.95 0.98 0.98 0.96 0.72 0.20 0.02 0.00 Emotional and Behavioral Dyscontrol 511 SE 9.8 8.5 4.7 2.2 1.8 1.8 1.8 2.2 4.0
Reliability 0.05 0.28 0.78 0.95 0.97 0.97 0.97 0.95 0.84 Positive Affect and Well-being 513 SE 9.5 5.60 1.6 1.0 1.0 1.1 3.4 8.7 9.9
Reliability 0.10 0.69 0.98 0.99 0.99 0.99 0.88 0.24 0.01 Sleep Disturbance 1087 SE 9.5 8.4 6.4 4.3 3.5 3.2 3.3 3.9 5.3
Reliability 0.09 0.30 0.60 0.81 0.88 0.90 0.89 0.85 0.72 Ability to Participate in Social Roles and Activities 549 SE 9.2 4.5 1.0 0.6 0.6 3.0 8.7 9.9 10.0
Reliability 0.15 0.80 0.99 0.99 0.99 0.91 0.24 0.02 0.00 Satisfaction with Social Roles and Activities 549 SE 9.7 6.4 1.5 0.6 0.7 3.4 9.4 10.0 10.0
Reliability 0.06 0.59 0.98 0.99 0.99 0.88 0.12 0.00 0.00 Stigma 511 SE 9.9 9.7 8.3 4.1 1.5 1.2 1.3 2.3 5.6
Reliability 0.01 0.06 0.31 0.84 0.98 0.99 0.98 0.95 0.69 Higher scores indicate more of that domain. A T-Score distribution has a mean of 50 and standard deviation of 10. SE is on the T-score metric and computed based on the Fisher information conditional on T-score. Reliability is approximated based on the conditional SE.
238

APPENDIX B- Neuro-QoL Technical Report Version 1.0
Table 73: Neuro-QOL Item Bank Calibration Sample T-Score Means and Standard Deviations, and Distributions by Percentile Neuro-QOL Item Bank # Items N Mean SD P5 P10 P25 P50 P75 P90 P95 Anxiety 21 513 48.93 9.48 30.98 36.01 42.22 48.93 56.11 60.94 63.16 Depression 24 513 47.68 9.09 32.88 32.88 41.58 47.47 54.66 60.00 62.06 Fatigue 19 511 49.76 9.93 32.88 36.45 42.82 50.01 56.95 61.55 65.64 Upper Extremity Function (Fine motor, ADL)
20 1095 45.12 10.85 27.28 31.05 37.42 45.10 57.00 57.00 57.00
Lower Extremity Function (Mobility) 19 1046 47.03 9.91 30.54 33.96 39.77 46.83 54.30 62.39 62.39 Applied Cognition (Executive Function) 13 1109 47.76 9.75 31.06 35.01 41.21 47.76 54.59 60.46 60.46 Applied Cognition (General Concerns) 18 1109 46.85 9.45 31.44 34.91 40.36 46.62 53.02 62.49 62.49 Emotional and Behavioral Dyscontrol 18 511 49.88 9.67 34.09 38.17 43.49 49.57 56.23 62.28 64.81 Positive Affect and Well-being 23 513 51.28 9.82 36.03 38.78 45.69 51.80 57.67 63.17 68.32 Sleep Disturbance 8 1087 49.98 9.21 35.71 38.04 43.61 49.81 56.27 61.69 65.18 Ability to Participate in Social Roles and Activities
45 549 50.43 9.56 36.10 38.62 42.79 49.04 58.58 64.91 64.91
Satisfaction with Social Roles and Activities
45 549 50.42 9.52 36.06 38.31 42.81 49.23 58.74 63.94 63.94
Stigma 24 511 49.70 9.47 35.62 35.62 41.68 50.49 56.48 61.37 64.39 T-score means, standard deviations and T-scores by percentile are computed for the calibration sample to describe this sample.
239

APPENDIX B- Neuro-QoL Technical Report Version 1.0
Table 74. Pediatrics Neuro-QOL Item Bank Standard Error and Reliability by T-scores
Neuro-QOL Item Bank N T-Scores 10 20 30 40 50 60 70 80 90
Applied Cognition – General Concerns
171 SE 8.9 5.4 2.5 2.0 2.1 2.5 5.2 8.9 9.9 Reliability 0.20 0.71 0.94 0.96 0.96 0.94 0.73 0.22 0.03
Anxiety 513 SE 10.0 9.7 8.1 3.8 1.4 1.3 1.3 2.6 7.1 Reliability 0.01 0.06 0.35 0.86 0.98 0.98 0.98 0.93 0.50
Depression 513 SE 9.8 8.9 6.3 3.0 1.3 1.4 1.3 3.0 7.9 Reliability 0.04 0.21 0.61 0.91 0.98 0.98 0.98 0.91 0.38
Fatigue 171 SE 9.8 8.5 5.5 3.4 2.5 2.3 2.4 3.1 6.0 Reliability 0.05 0.28 0.70 0.88 0.94 0.95 0.94 0.90 0.64
Pain 171 SE 10.0 10.0 9.8 5.7 1.8 1.5 1.7 5.5 9.8 Reliability 0.00 0.00 0.04 0.67 0.97 0.98 0.97 0.70 0.05
Stigma 168 SE 10.0 9.9 8.4 3.4 1.5 1.4 1.7 4.2 8.9 Reliability 0.00 0.02 0.30 0.89 0.98 0.98 0.97 0.83 0.20
Social relations – Interaction with Peers
513 SE 5.4 2.4 1.5 1.7 1.6 2.8 6.8 9.5 9.9 Reliability 0.71 0.94 0.98 0.97 0.97 0.92 0.54 0.11 0.01
Anger 513 SE 10.0 10.0 8.9 3.4 1.5 1.8 1.5 4.7 9.4 Reliability 0.00 0.01 0.22 0.88 0.98 0.97 0.98 0.78 0.11
Note: Higher scores indicate more of that domain. A T-Score distribution has a mean of 50 and standard deviation of 10. SE is on the T-score metric and computed based on the Fisher information conditional on T-score. Reliability is approximated based on the conditional SE.
240
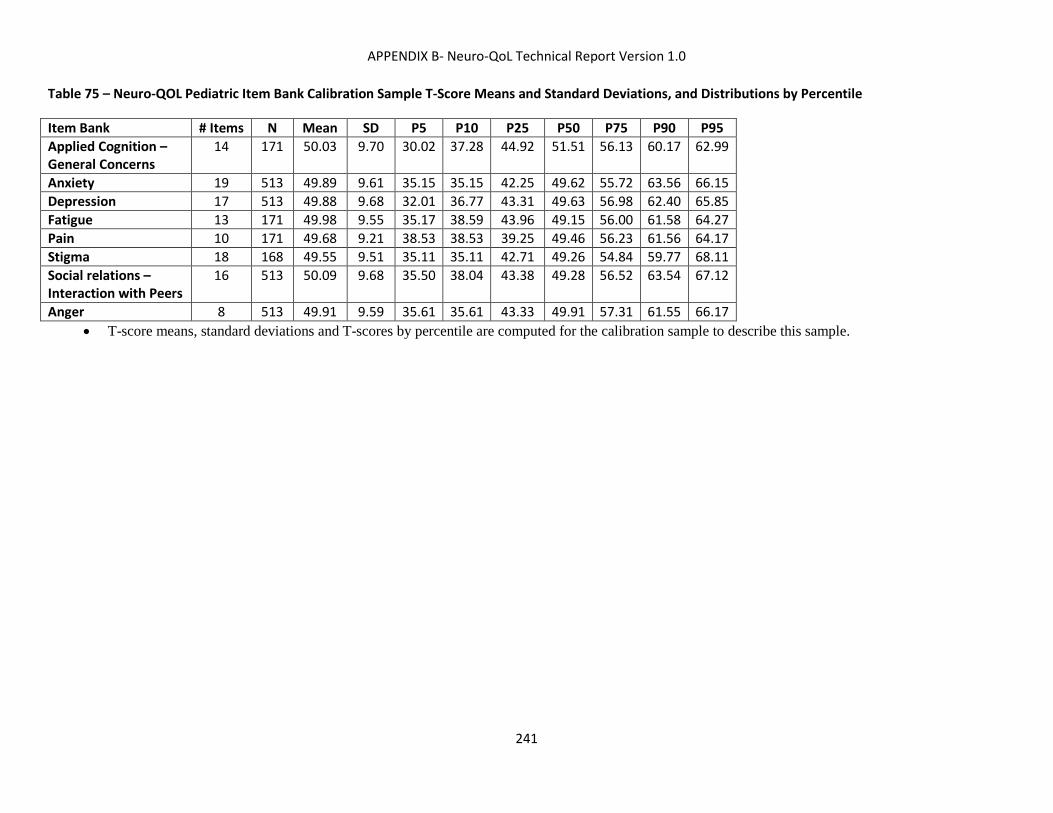
APPENDIX B- Neuro-QoL Technical Report Version 1.0
Table 75 – Neuro-QOL Pediatric Item Bank Calibration Sample T-Score Means and Standard Deviations, and Distributions by Percentile
Item Bank # Items N Mean SD P5 P10 P25 P50 P75 P90 P95 Applied Cognition – General Concerns
14 171 50.03 9.70 30.02 37.28 44.92 51.51 56.13 60.17 62.99
Anxiety 19 513 49.89 9.61 35.15 35.15 42.25 49.62 55.72 63.56 66.15 Depression 17 513 49.88 9.68 32.01 36.77 43.31 49.63 56.98 62.40 65.85 Fatigue 13 171 49.98 9.55 35.17 38.59 43.96 49.15 56.00 61.58 64.27 Pain 10 171 49.68 9.21 38.53 38.53 39.25 49.46 56.23 61.56 64.17 Stigma 18 168 49.55 9.51 35.11 35.11 42.71 49.26 54.84 59.77 68.11 Social relations – Interaction with Peers
16 513 50.09 9.68 35.50 38.04 43.38 49.28 56.52 63.54 67.12
Anger 8 513 49.91 9.59 35.61 35.61 43.33 49.91 57.31 61.55 66.17 • T-score means, standard deviations and T-scores by percentile are computed for the calibration sample to describe this sample.
241

APPENDIX B- Neuro-QoL Technical Report Version 1.0
Figure 1. Precision of the item banks across the measurement continuum compared to sample distribution. Area in blue represents the range with a reliability ≥ 95% while the area in yellow represents the range with of reliability between 0.9 and 0.95. Figure 1a. Depression
Figure 1b. Anxiety
Figure 1c. Anger
Figure 1d. Interaction with Peer
Figure 1e. Cognition
Figure 1f. Fatigue
Figure 1g. Pain
Figure 1h. Stigma
NOTE: Precision information is not available for “Upper Extremity (ADL)” and “Lower Extremity (Mobility)” scales as these scales cannot be calibrated using IRT analyses.
242

APPENDIX B- Neuro-QoL Technical Report Version 1.0
Figure 2. Distributions of Upper and Lower Extremity Function Scales (in raw score unit). Possible scores range from 1 to 5 and higher scores represent better function. a. Upper Extremity Function
b. Lower Extremity Function
0
100
200
300
400
500
600
1 1.5 2 2.5 3 3.5 4 4.5 5
Freq
uenc
y (n
)
Means
0
100
200
300
400
500
600
1 1.5 2 2.5 3 3.5 4 4.5 5
Freq
uenc
y (n
)
Means
Mean=4.8 (SD=0.6)
Kurtosis=7.8
Skewness= -2.9
Mean=4.8 (SD=0.5)
Kurtosis=7.1
Skewness= -2.7
243

APPENDIX B- Neuro-QoL Technical Report Version 1.0
References
1. Ader DN. Developing the Patient-Reported Outcomes Measurement Information System
(PROMIS). Med. Care. 05 2007;45(5 Suppl 1):S1-S2. 2. Cella D, Riley W, Stone A, et al. The Patient Reported Outcomes Measurement Information
System (PROMIS) developed and tested its first wave of adult self-reported health outcome item banks: 2005-2008. J. Clin. Epidemiol. 2010;63(11):1179-1194.
3. DeWalt DA, Rothrock N, Yount S, Stone AA, PROMIS Cooperative Group. Evaluation of Item Candidates: The PROMIS Qualitative Item Review. Med. Care. 05 2007;45(5 Suppl 1):S12-S21.
4. Jansky LJ, Huang JC. A Multi-Method Approach to Assess Usability and Acceptability: A Case Study of the Patient-Reported Outcomes Measurement System (PROMIS) Workshop. Social Science Computer Review. 2009;27(2):267-270.
5. Klem M, Saghafi E, Abromitis R, Stover A, Dew M, Pilkonis P. Building PROMIS item banks: librarians as co-investigators. Qual. Life Res. 2009;18(7):881-888.
6. U. S. Department of Health and Human Services Food and Drug Administration, Center for Drug Evaluation and Research, Center for Biologics Evaluation and Research, Center for Devices and Radiological Health. Guidance for industry patient-reported outcome measures: use in medical product development to support labeling claims. 2009; http://purl.access.gpo.gov/GPO/LPS113413.
7. Haley SM, Coster WJ, Andres PL, et al. Activity outcome measurement for postacute care. Med. Care. 01 2004;42(1 Suppl):I49-I61.
8. Gershon RC, Lai J-S, Bode R, et al. Quality of Life Item Banks for Adults with Neurological Disorders: Item Development and Calibrations Based upon Clinical and General Population Testing. Manuscript in preparation.
9. Lai JS, Nowinski C, Victorson D, et al. Quality of Life Outcomes in Children with Neurological Conditions- Pediatric Neuro-QOL. Manuscript in preparation.
10. Hambleton RK, Swaminathan H, Rogers HJ. Fundamentals of Item Response Theory. Newbury Park, CA: SAGE Publications, Inc.; 1991.
11. Embretson SE, Reise SP. Item Response Theory for Psychologists. Mahwah, N.J.: Lawrence Erlbaum Associates; 2000.
12. Choi S. Development of freeware for an iterative hybrid ordinal logistic regression/IRT DIF. Manuscript in preparation.
13. Mahoney FI, Barthel DW. Functional evalutaion: The Barthel Index. Md. State Med. J. 1965;14:522-528.
14. Lawton MP, Brody EM. Assessment of older people: Self-maintaining and instrumental activities of daily living. The Gerontologist. 1969;9(3):179-186.
15. Karnofsky DA, Burchenal JH. The Clinical Evaluation of Chemotherapeutic Agents in Cancer. In: Macleod CM, ed. Evaluation of Chemotherapeutic Agents. New York: Columbia University Press; 1949:191-205.
16. Lewandowski LJ. The Symbol Digit Modalities Test: a screening instrument for brain-damaged children. Percept. Mot. Skills. 1984;59(2):615-618.
17. Wechsler D. Wechsler Adult Intelligence Scale - Revised (WAIS-R) Manual. New York, NY: The Psychological Corporation; 1981.
18. Johnson JA, Coons SJ, Ergo A, Szava-Kovats G. Valuation of EuroQOL (EQ-5D) health states in an adult US sample. Pharmacoeconomics. 1998;13(4):421-433.
244

APPENDIX B- Neuro-QoL Technical Report Version 1.0
19. Rabin R, de Charro F. EQ-5D: a measure of health status from the EuroQol Group. Ann. Med. Jul 2001;33(5):337-343.
20. Hays RD, Bjorner J, Revicki DA, Spritzer K, Cella D. Development of physical and mental health summary scores from the Patient Reported Outcomes Measurement Information System (PROMIS) global items. Qual. Life Res. 2009;18(7):873-880.
21. Cella D. Manual of the Functional Assessment of Chronic Illness Therapy (FACIT Scales). Version 4 Elmhurst, IL: FACIT.org; 1997.
22. Varni JW, Burwinkle TM, Katz ER, Meeske K, Dickinson P. The PedsQL in pediatric cancer: Reliability and validity of the Pediatric Quality of Life Inventory Generic Core Scales, Multidimensional Fatigue Scale, and Cancer Module. Cancer. 04/01/ 2002;94(7):2090-2106.
23. Varni JW, Seid M, Rode CA. The PedsQL: Measurement model for the pediatric quality of life inventory. Med. Care. 1999;37(2):126-139.
24. Guyatt GH, Osoba D, Wu AW, Wyrwich KW, Norman GR. Methods to explain the clinical significance of health status measures. Mayo Clin. Proc. 04 2002;77(4):371-383.
25. Guyatt GH, Norman GR, Juniper EF, Griffith LE. A critical look at transition ratings. J. Clin. Epidemiol. 09 2002;55(9):900-908.
26. Jaeschke R, Singer J, Guyatt GH. Measurement of health status. Ascertaining the minimal clinically important difference. Control. Clin. Trials. 12 1989;10(4):407-415.
27. Guyatt GH, Berman LB, Townsend M, Pugsley SO, Chambers LW. A measure of quality of life for clinical trials in chronic lung disease. Thorax. 10 1987;42(10):773-778.
28. Osoba D, Brada M, Yung WKA, Prados M. Health-related quality of life in patients treated with temozolomide versus procarbazine for recurrent glioblastoma multiforme. J. Clin. Oncol. 2002;18:1481-1491.
29. Kelly-Hayes PM, Robertson JT, Broderick JP, et al. The American Heart Association Stroke Outcome Classification. Stroke. 1998;29(6):1274.
30. Duncan PW, Wallace D, Lai SM, Johnson D, Embretson S, Laster LJ. The stroke impact scale version 2.0. Evaluation of reliability, validity, and sensitivity to change. Stroke. 10 1999;30(10):2131-2140.
31. Jenkinson C, Fitzpatrick R, Brennan C, Bromberg M, Swash M. Development and validation of a short measure of health status for individuals with amyotrophic lateral sclerosis/motor neurone disease: The ALSAQ-40. J. Neurol. 11 1999;246 Suppl 3:III16-III21.
32. Jenkinson C, Levvy G, Fitzpatrick R, Garratt A. The amyotrophic lateral sclerosis assessment questionnaire (ALSAQ-40): Tests of data quality, score reliability and response rate in a survey of patients. J. Neurol. Sci. 11/01/ 2000;180(1-2):94-100.
33. Jenkinson C, Fitzpatrick R, Brennan C, Swash M. Evidence for the validity and reliability of the ALS assessment questionnaire: The ALSAQ-40. Amyotroph. Lateral Scler. Other Motor Neuron Disord. 12 1999;1(1):33-40.
34. Norquist JM, Fitzpatrick R, Jenkinson C. Health-related quality of life in amyotrophic lateral sclerosis: determining a meaningful deterioration. Qual. Life Res. 10 2004;13(8):1409-1414.
35. Cedarbaum JM, Stambler N, Malta E, et al. The ALSFRS-R: A revised ALS functional rating scale that incorporates assessments of respiratory function. BDNF ALS Study Group (Phase III). Journal of Neurological Sciences. 10/31/ 1999;169(1-2):13-21.
36. Miller R, Bradley W, Cudkowicz M, et al. Phase II/III randomized trial of TCH346 in patients with ALS. Neurology. 08/21/ 2007;69(8):776-784.
37. Cutter GR, Baier ML, Rudick RA, et al. Development of a multiple sclerosis functional composite as a clinical trial outcome measure. Brain. 05 1999;122(Pt 5):871-872.
38. Kalkers N, Bergers L, de Groot V. Concurrent validity of the MS Functional Composite using MRI as a biological disease maker. Neurology. 2001;56:215-219.
245

APPENDIX B- Neuro-QoL Technical Report Version 1.0
39. Kalkers NF, Bergers E, Castelijns JA, et al. Optimizing the association between disability and biological markers in MS. Neurology. 10/09/ 2001;57(7):1253-1258.
40. Fischer JS, Rudick RA, Cutter GR, Reingold SC. The Multiple Sclerosis Functional Composite Measure (MSFC): An integrated approach to MS clinical outcome assessment. National MS Socieyt Clinical Outcomes Assessment Task Force. Mult. Scler. 08 1999;5(4):244-250.
41. Benesova Y, Niedermayerova I. New approach to evaluation of clinical state in patients with multiple sclerosis. Bratisl. Lek. Listy. 2001;102(8):370-371.
42. Cohen JA, Cutter GR, Fischer JS, et al. Use of the multiple sclerosis functional composite as an outcome measure in a phase 3 clinical trial. Arch. Neurol. 06 2001;58(6):961-967.
43. Hoogervorst EL, Kalkers NF, Uitdehaag BM, Polman CH. A study validating changes in the multiple sclerosis functional composite. Arch. Neurol. 01 2002;59(1):113-116.
44. Rudick RA, Cutter G, Baier M, et al. Use of the Multiple Sclerosis Functional Composite to predict disability in relapsing MS. Neurology. 05/22/ 2001;56(10):1324-1330.
45. Rudick RA, Cutter G, Reingold S. The multiple sclerosis functional composite: A new clinical outcome measure for multiple sderosis trials. Mult. Scler. 10 2002;8(5):359-365.
46. Fischer JS, LaRocca NG, Miller DM, Ritvo PG, Andrews H, Paty D. Recent developments in the assessment of quality of life in multiple sclerosis (MS). Mult. Scler. 08 1999;5(4):251-259.
47. Cohen JA, Fischer JS, Bolibrush DM, et al. Intrarater and inerrater reliability of the MS functinoal composite outcome measure. Neurology. 02/22/ 2000;54(4):802-806.
48. Marrie RA, Goldman M. Validity of performance scales for disability assessment in multiple sclerosis. Mult. Scler. 11 2007;13(9):1176-1182.
49. Nasreddine ZS, Phillips NA, Bédirian V, et al. Brief Methodological Reports:The Montreal Cognitive Assessment, MoCA: A Brief Screening Tool For Mild Cognitive Impairment. J. Am. Geriatr. Soc. 2005;53(4):695-699.
50. de Boer AG, Wijker W, Speelman JD, De Haes JC. Quality of life in patients with Parkinson's disease: Development of a questionnaire. J. Neurol. Neurosurg. Psychiatry. 07 1996;61(1):70-74.
51. Peto V, Jenkinson C, Fitzpatrick R. PDQ-39: A review of the development, validation and application of a Parkinson's disease quality of life questionnaire and its associated measures. J. Neurol. 05 1998;245 Suppl 1:S10-S14.
52. Goetz CG, Fahn S, Martinez-Martin P, et al. Movement Disorder Society-sponsored revision of the Unified Parkinson's Disease Rating Scale (MDS-UPDRS): Process, format, and clinimetric testing plan. Mov. Disord. 01 2007;22(1):41-47.
53. Goetz CG, Poewe W, Rascol O, et al. Movement Disorder Society Task Force report on the Hoehn and Yahr staging scale: status and recommendations. Mov. Disord. 09 2004;19(9):1020-1028.
54. Kroenke K, Spitzer RL, Williams JBW. The PHQ-9 Validity of a Brief Depression Severity Measure. J. Gen. Intern. Med. 2001;16(9):606-613.
55. Devinsky O, Vickrey BG, Cramer J, et al. Development of the quality of life in epilepsy inventory. Epilepsia. 11 1995;36(11):1089-1104.
56. Cramer JA, Arrigo C, Van Hammee G, Bromfield EB. Comparison between the QOLIE-31 and derived QOLIE-10 in a clinical trial of levetiracetam. Epilepsy Res. 08 2000;41(1):29-38.
57. Smith DF, Baker GA, Dewey M, Jacoby A, Chadwick DW. Seizure frequency, patient-perceived seizure severity and the psychosocial consequences of intractable epilepsy. Epilepsy Res. 1991;9(3):231-241.
58. Rapp S, Shumaker S, Smith T, Gibson P, Berzon R, Hoffman R. Adaptation and evaluation of the Liverpool Seizure Severity Scale and Liverpool Quality of Life battery for American epilepsy patients. Qual. Life Res. 08 1998;7(6):467-477.
246

APPENDIX B- Neuro-QoL Technical Report Version 1.0
59. Scott-Lennox J, Bryant-Comstock L, Lennox R, Baker GA. Reliability, validity and responsiveness of a revised scoring system for the Liverpool Seizure Severity Scale. Epilepsy Res. 04 2001;44(1):53-63.
60. Panelli RJ, Kilpatrick C, Moore SM, Matkovic Z, D'Souza WJ, O'Brien TJ. The Liverpool Adverse Events Profile: Relation to AED Use and Mood. Epilepsia. 2007;48(3):456-463.
247