![Energy dissipation, flow resistance and gas-liquid ...staff.civil.uq.edu.au/h.chanson/reprints/efm_09d.pdf · Skimming flows are highly aerated [16,30,34]. Through the air–water](https://static.fdocuments.us/doc/165x107/5f5d690d25bc59587928adf8/energy-dissipation-iow-resistance-and-gas-liquid-staffciviluqeduauhchansonreprintsefm09dpdf.jpg)
Neuro-Fuzzy Approach for Estimating Energy Dissipation in Skimming Flow over Stepped ...€¦ ·...
10
Arab J Sci Eng (2014) 39:6099–6108 DOI 10.1007/s13369-014-1240-2 RESEARCH ARTICLE - CIVIL ENGINEERING Neuro-Fuzzy Approach for Estimating Energy Dissipation in Skimming Flow over Stepped Spillways Farzin Salmasi · Mehmet Özger Received: 4 February 2012 / Accepted: 31 July 2013 / Published online: 10 July 2014 © The Author(s) 2014. This article is published with open access at Springerlink.com Abstract In a stepped spillway, the spillway face is pro- vided with a series of steps from near the crest to the toe. The energy dissipation caused by the steps reduces the size of the energy dissipator, generally provided at the toe of the spillway. The hydraulics of stepped spillways is investigated by carrying out laboratory experiments, building models to explain the data, and testing the robustness of the models developed here using a neuro-fuzzy approach. The experi- ments consist of twenty different stepped spillways tested in a horizontal laboratory flume, a wide range of discharge val- ues, three weir slopes of 15 ◦ , 25 ◦ , and 45 ◦ and different step numbers from 3 to 50 on the ogee surface. The main objective of this paper was to investigate the applicability and accuracy of the neuro-fuzzy approach in estimating the proper values of energy dissipation of skimming flow regime over stepped spillways because of the imprecise, insufficient, ambiguous and uncertain data available. A neuro-fuzzy approach was developed to relate the input and output (energy dissipation) variables. Multiple regression equations based on dimen- sional analysis theory were developed for computing energy dissipation over stepped spillways. The determination coef- ficients for the suggested neuro-fuzzy model in training and testing process are 0.974 and 0.966, respectively. It was found that the neuro-fuzzy approach formulation of the problem of solving for the energy dissipation over stepped spillways is more successful than that by regression equations. F. Salmasi (B ) Department of Water Engineering, Faculty of Agriculture, University of Tabriz, Tabriz, Iran e-mail: [email protected] M. Özger Hydraulics Laboratory, ˙ Istanbul Technical University, 34469 Istanbul, Turkey e-mail: [email protected] Keywords Energy dissipation · Stepped spillway · Neuro-fuzzy · Skimming regime List of symbols b Spillway width E 1 Energy downstream of spillway before hydraulic jump E 0 Total energy upstream of spillway E The difference between energy upstream and downstream of the spillway (E = E 0 − E 1 ) F r Supercritical Froude number = V 1 / √ gy 1 g Acceleration due to gravity 123
Transcript of Neuro-Fuzzy Approach for Estimating Energy Dissipation in Skimming Flow over Stepped ...€¦ ·...

Arab J Sci Eng (2014) 39:6099–6108DOI 10.1007/s13369-014-1240-2
RESEARCH ARTICLE - CIVIL ENGINEERING
Neuro-Fuzzy Approach for Estimating Energy Dissipationin Skimming Flow over Stepped Spillways
Farzin Salmasi · Mehmet Özger
Received: 4 February 2012 / Accepted: 31 July 2013 / Published online: 10 July 2014© The Author(s) 2014. This article is published with open access at Springerlink.com
Abstract In a stepped spillway, the spillway face is pro-vided with a series of steps from near the crest to the toe.The energy dissipation caused by the steps reduces the sizeof the energy dissipator, generally provided at the toe of thespillway. The hydraulics of stepped spillways is investigatedby carrying out laboratory experiments, building models toexplain the data, and testing the robustness of the modelsdeveloped here using a neuro-fuzzy approach. The experi-ments consist of twenty different stepped spillways tested ina horizontal laboratory flume, a wide range of discharge val-ues, three weir slopes of 15◦, 25◦, and 45◦ and different stepnumbers from 3 to 50 on the ogee surface. The main objectiveof this paper was to investigate the applicability and accuracyof the neuro-fuzzy approach in estimating the proper valuesof energy dissipation of skimming flow regime over steppedspillways because of the imprecise, insufficient, ambiguousand uncertain data available. A neuro-fuzzy approach wasdeveloped to relate the input and output (energy dissipation)variables. Multiple regression equations based on dimen-sional analysis theory were developed for computing energydissipation over stepped spillways. The determination coef-ficients for the suggested neuro-fuzzy model in training andtesting process are 0.974 and 0.966, respectively. It was foundthat the neuro-fuzzy approach formulation of the problem ofsolving for the energy dissipation over stepped spillways ismore successful than that by regression equations.
F. Salmasi (B)Department of Water Engineering, Faculty of Agriculture,University of Tabriz, Tabriz, Irane-mail: [email protected]
M. ÖzgerHydraulics Laboratory, Istanbul Technical University,34469 Istanbul, Turkeye-mail: [email protected]
Keywords Energy dissipation · Stepped spillway ·Neuro-fuzzy · Skimming regime
List of symbols
b Spillway widthE1 Energy downstream of spillway before hydraulic
jumpE0 Total energy upstream of spillway�E The difference between energy upstream and
downstream of the spillway (�E = E0 − E1)
Fr Supercritical Froude number = V1/√
gy1
g Acceleration due to gravity
123

6100 Arab J Sci Eng (2014) 39:6099–6108
h Step heightHw Total spillway height from flume bedl Step lengthq Discharge per unit widthQ DischargeS Weir/spillway slope (V : H)
Va Approach velocity = (q/y)
V1 Velocity at the toe of the spillwayy0 Depth of flow about 0.60 m upstream
of the spillway above the spillway cresty1 Depth before hydraulic jump at the spillway toey2 Depth after hydraulic jump
1 Introduction
Stepped spillways have been built in the past, but there issome interest in them because of significant cost savings.Stepped spillways have many applications in dam structures,river engineering, and soil conservation works. Their stillingbasins can be constructed at lower costs as energy dissipa-tion in these spillways is high. Stepped spillways have beenused for centuries. Recently, new construction materials such
as roller compacted concrete (RCC) and design techniqueshave increased the interest in stepped spillways [1]. The stepsproduce considerable energy dissipation along the spillwayand reduce the size of the required downstream energy dissi-pation basin. The various flow regimes for stepped spillwaysare as follows: (i) nappe or jet flow regime: the water flowsas a succession of free-falling nappes at small discharges [2];(ii) skimming flow regime: Most prototype spillways operateat large discharges per unit width for which the water skimsas a coherent stream over the pseudo-bottom (i.e., not solidbottom) formed by step edges, which is characterized by sig-nificant form losses and momentum transfer from the mainstream to the recirculation zones (e.g., [3,4]); and (iii) tran-sition flow regime: For an intermediate range of flow rates, atransition flow regime is observed between the above regimes[5].
Figure 1 shows the schematic classification of nappe, tran-sition and skimming flow regimes.
The hydraulics of flow over stepped spillways is difficultdue to the complexity of flow regimes, physical characteris-tics, and various hydraulic effects such as turbulence. Theirimplementations in the form of stepped chutes/spillways
Fig. 1 Schematic classificationof three flow regimes: nappe,transition and skimming flowregimes
123
Arab J Sci Eng (2014) 39:6099–6108 6101
have become a popular method for handling flood releases.Arguably, a better insight into their hydraulics can enhancetheir popularity and this is the focus of this paper. Many stud-ies have been carried out to investigate different aspects ofoverflow in stepped spillways but the hydraulics of steppedspillways by neuro-fuzzy approach has not been fully inves-tigated due to the complexity of flow patterns and resistance.
The primary focus of this research is to investigate theaccuracy of a fuzzy rule system approach for estimating theenergy dissipation of the skimming flow regime over steppedspillway because of the imprecise, insufficient, ambiguousand uncertain data available. The application of the pro-posed approach was performed using the measured data forenergy dissipation available from the experimental analyses[6]; hence, its performance was tested using some parametersfor error estimation.
In recent years, artificial intelligence (AI) techniques suchas neuro-fuzzy, artificial neural network (ANN), and geneticprogramming (GP) models have attracted researchers inmany disciplines of science and engineering, since they arecapable of correlating large and complex data sets with-out any prior knowledge of the relationships among them.Notably, ANNs have been applied to other hydraulic prob-lems, e.g., Yuhong and Wenxin [7] to predict the frictionfactor of open channel flow, Kisi [8] to predict the meanmonthly stream flow, Rakhshandehroo et al. [9] for forecast-ing groundwater level in Shiraz plain and Eslamian et al. [10]to estimate Penman–Monteith reference evapotranspiration.The authors are not aware of the application of neuro-fuzzyto stepped spillways.
Ozger and Yildirim [11] investigated the accuracy of afuzzy rule system approach to determine the relationshipbetween pipe roughness, Reynolds number, and friction fac-tor. A neuro-fuzzy approach was developed to relate theinput (pipe roughness and Reynolds number) and output(friction coefficient) variables. The application of the pro-posed approach was performed for the data derived from theMoody’s diagram. The performance of the proposed modelwas compared with respect to conventional procedures usingsome statistical parameters for error estimation. The compar-
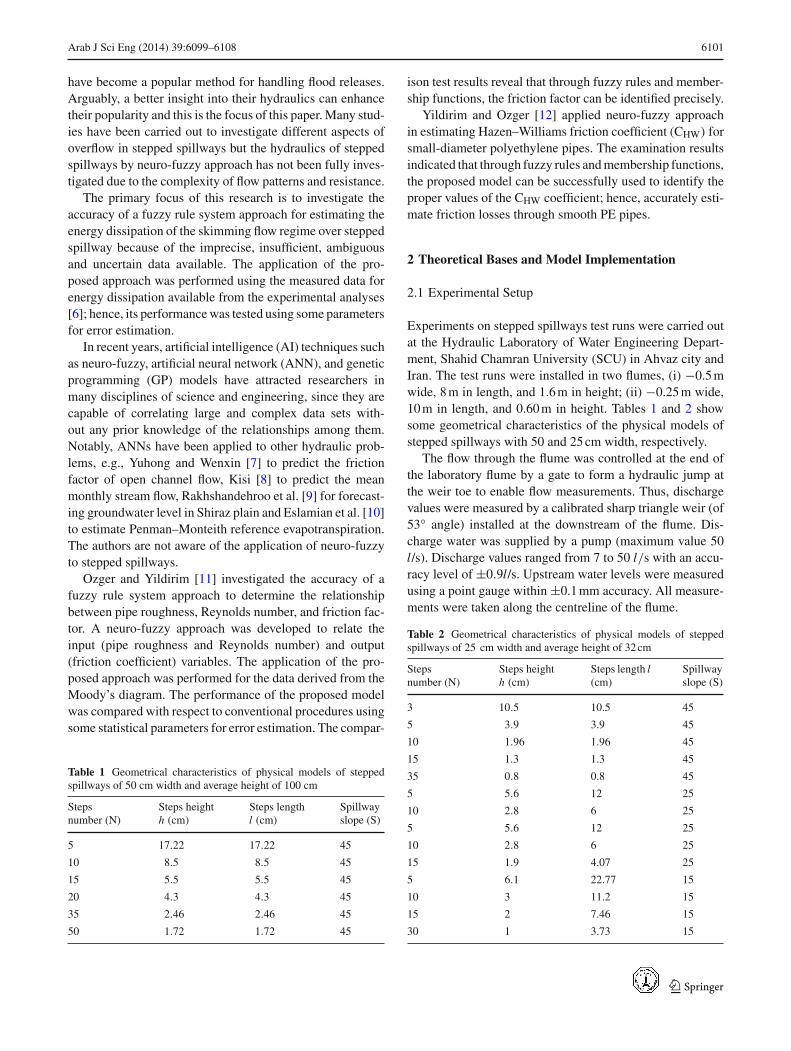
Table 1 Geometrical characteristics of physical models of steppedspillways of 50 cm width and average height of 100 cm
Stepsnumber (N)
Steps heighth (cm)
Steps lengthl (cm)
Spillwayslope (S)
5 17.22 17.22 45
10 8.5 8.5 45
15 5.5 5.5 45
20 4.3 4.3 45
35 2.46 2.46 45
50 1.72 1.72 45
ison test results reveal that through fuzzy rules and member-ship functions, the friction factor can be identified precisely.
Yildirim and Ozger [12] applied neuro-fuzzy approachin estimating Hazen–Williams friction coefficient (CHW) forsmall-diameter polyethylene pipes. The examination resultsindicated that through fuzzy rules and membership functions,the proposed model can be successfully used to identify theproper values of the CHW coefficient; hence, accurately esti-mate friction losses through smooth PE pipes.
2 Theoretical Bases and Model Implementation
2.1 Experimental Setup
Experiments on stepped spillways test runs were carried outat the Hydraulic Laboratory of Water Engineering Depart-ment, Shahid Chamran University (SCU) in Ahvaz city andIran. The test runs were installed in two flumes, (i) −0.5 mwide, 8 m in length, and 1.6 m in height; (ii) −0.25 m wide,10 m in length, and 0.60 m in height. Tables 1 and 2 showsome geometrical characteristics of the physical models ofstepped spillways with 50 and 25 cm width, respectively.
The flow through the flume was controlled at the end ofthe laboratory flume by a gate to form a hydraulic jump atthe weir toe to enable flow measurements. Thus, dischargevalues were measured by a calibrated sharp triangle weir (of53◦ angle) installed at the downstream of the flume. Dis-charge water was supplied by a pump (maximum value 50l/s). Discharge values ranged from 7 to 50 l/s with an accu-racy level of ±0.9l/s. Upstream water levels were measuredusing a point gauge within ±0.1 mm accuracy. All measure-ments were taken along the centreline of the flume.
Table 2 Geometrical characteristics of physical models of steppedspillways of 25 cm width and average height of 32 cm
Stepsnumber (N)
Steps heighth (cm)
Steps length l(cm)
Spillwayslope (S)
3 10.5 10.5 45
5 3.9 3.9 45
10 1.96 1.96 45
15 1.3 1.3 45
35 0.8 0.8 45
5 5.6 12 25
10 2.8 6 25
5 5.6 12 25
10 2.8 6 25
15 1.9 4.07 25
5 6.1 22.77 15
10 3 11.2 15
15 2 7.46 15
30 1 3.73 15
123

6102 Arab J Sci Eng (2014) 39:6099–6108
In each test run, water depth was measured 0.60 mupstream of the chute, y0, and after the hydraulic jump, y2.The thin flow and air entrainment at the spillway toe made itdifficult to measure the flow depth (y1) accurately. Pegramet al. [13] calculated energy dissipation using the conjugatewater depths of the hydraulic jump (y2). In the present study,y2 was measured with an accuracy level of ±2 mm, wherethere were few bubbles and less undulation in the tail water.
2.2 Experimental Data
A total of 154 test runs were carried out in the skimmingflow regime with three different slopes (S = 15◦, 25◦ and45◦), seven different step numbers (Tables 1, 2), and vary-ing discharge rates and the measurements for each test runcomprised discharge values and two values of water depth(Table 4 in “Appendix”). It should be mentioned that thetotal number of experiments was 250 including the nappe,transition and skimming flow regimes, but in this study, onlyskimming data were used for simulation of energy dissipa-tion. Selection of step numbers was based on laboratory flumefacilities.
A decision was made to use 68 % of these data points (104data points) for training and 32 % of the total data points (50point data) for testing the predictions of the model.
The procedure for selecting training and prediction datawas based on plotting relative energy dissipation, drop num-ber, Froude number, slope, number of steps versus dischargeand selecting representative data points from high, mediumand low ranges. The measurement data points are given in“Appendix”
2.3 Dimensional Analysis
Upstream energy head (E0), downstream energy head (E1)
and relative energy dissipation (�E/E0) are calculated asfollows (Fig. 2):
E0 = Hw + y0 + V 20
2g= Hw + y0 + q2
2g(Hw + y0)2 (1)
E1 = y1 + V 21
2g= y1 + q2
2gy21
(2)
�E
E0= E0 − E1
E0= 1 − E1
E0(3)
where g is acceleration due to gravity, Hw is total spillwayheight measured with a point gauge after the installation ofthe spillway at the flume, y0 is the depth of the flow at aset distance upstream of the spillway and above the spillwaycrest, q is discharge per unit width, and V0 is the approachvelocity. The depth, y1, was calculated using the conjugatedepth (y2) expressed as:
y1 = y2
2
(√1 + 8Fr2
2 − 1
)(4)
where Fr2 is Froude number (Fr2 = V2/√
gy2),V2 and y2 arethe velocity and water depth at Sect. 2 (after hydraulic jumpand the re-establishment of subcritical flow), respectively.
Generally, energy dissipation depends on hydraulic andgeometric variables expressed as:
�E
E0= f (q, l, h, Hw, g, N ) (5)
where l is step length, h is step height, and N is number ofsteps. In all tests, discharge was regulated in a way to formhydraulic jump at spillway toe, so that supercritical flow at thedownstream of the spillway toe may occur (Froude number>1). Although both depth values of y1 and y2 were measured,only y2 values were used to calculate the energy dissipationby means of Eqs. (1)–(4).
The fundamental variables that are important in thehydraulics stepped spillways are geometrical parameterssuch as total spillway height (Hw), step length (l), step height(h), spillway slope (S), number of steps (N); and hydraulicparameters such as discharge per unit width of canal (q),energy upstream of weir (E0) and energy downstream ofweir (E1) defined in Eqs. (1) and (2) respectively. Using theBuckingham �-theorem, relative energy dissipation can beexpressed as:
�E
E0= f
(q2/gH3
w, h/ l, N , yc/h, Fr1
)(6)
Equation (6) can be rewritten as Eq. (7):
�E/E0 = f (DN, S, N , yc/h, Fr1) (7)
Fig. 2 Location of measuredy1 and y2 depths downstream ofweir
123

Arab J Sci Eng (2014) 39:6099–6108 6103
Fig. 3 The model structure ofthe proposed FIS
FIS: 5 inputs, 1 outputs, 32 rules
Fr1
yc/h
DN
N
S
f(u)
DE/E0
(sugeno)
32 rules
where DN = q2/gH3w, yc is critical depth (yc = (q2/g)1/3)
and S = h/ l is the spillway slope. The parameter DN istermed drop number, similar to drop number presented firstby Rand [14]. Froude number at Sect. 1 is defined by: Fr1 =V1/
√gy1. The average flow velocity at any section (V =
q/y) was calculated as the measured flow rate per unit width(q = Q/b) where Q is total discharge, b is the spillwaywidth, and y is depth of water at the appropriate section.
2.4 Implementation of Adaptive Neuro-Fuzzy InferenceSystem (ANFIS)
Adaptive neuro-fuzzy inference system (ANFIS), first intro-duced by Jang [15], is a universal approximator. The neuro-fuzzy model used in this study implements the Takagi–Sugeno (TS) fuzzy approach [16] to obtain the value of theoutput variable from input variables. Here, the fuzzy infer-ence system (FIS) has five inputs: drop number (DN), spill-way slope (S), number of steps (N ), critical depth to stepheight (yc/h) and Froude number (Fr1); and one output rel-ative energy dissipation (�E/E0).
In this study, ANFIS is selected to train the proposedmodel. ANFIS Editor GUI of MATLAB is used for imple-mentation. The data (154) is divided into two parts which arethe training (104) and testing (50) parts. The testing data isselected randomly, and it is independent from training data.An initial FIS model structure should be specified prior to FIStraining. The FIS model consists of grid partitioning tech-niques which apply grid partition on the data. To train theFIS, backpropagation gradient descent method is employed.The number of training epochs is 1,000, and the training errortolerance is set to 0.01. After the FIS is trained, the model isvalidated using the testing data that is independent from thedata used to train the FIS.
A schematic of the model structure is given in Fig. 3.The FIS model consists of 3 membership functions (MFs)for each input. Gaussian type MF is chosen for input andconstant type for output membership function. The MFs forthe trained FIS are given in Fig. 4.
2.5 Performance Criteria
The two error measures are used to compare the performanceof the various models: determination coefficient (r2) and rootmean square error (RMSE). The study also uses relative error(RE) that is defined as follows:
RE = |TTrue − TEstimated| /TTrue (8)
where TTrue is from experimental tests and TEstimated iscalculated.
3 Results
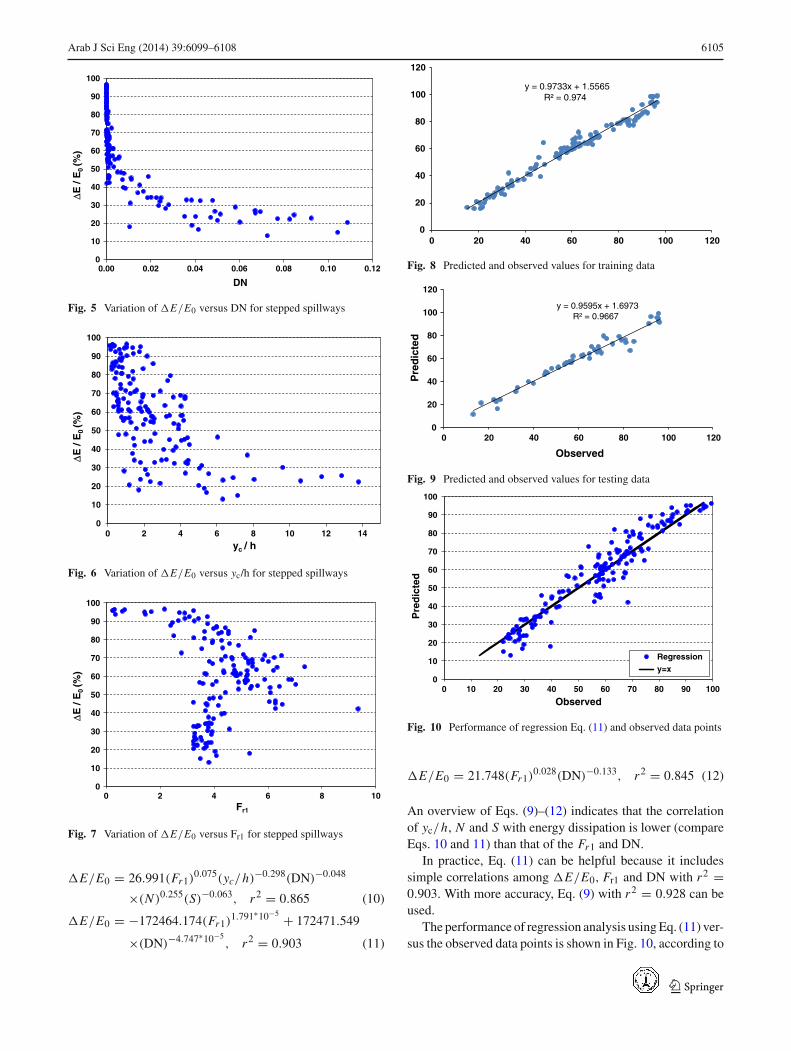
Figure 5 presents: �E/E0 versus DN and shows that byincreasing DN, the relative energy dissipation is reduced.Energy dissipation is reduced with a high gradient until GNreaches a value approximately equal to 0.01 but above thisvalue (DN > 0.01), energy dissipation becomes independentof DN, i.e., it becomes less efficient.
Figure 6 presents: �E/E0 versus yc/h and shows that byincreasing yc/h, the relative energy dissipation is reduced.But discrepancies among data points are high, and it seemsthat yc/h does not affect the variation of �E/E0 solely.
Figure 7 presents: �E/E0 versus Fr1 and discrepanciesamong data points are high, and it seems that Fr1 does notreflect the variation of �E/E0 solely.
123

6104 Arab J Sci Eng (2014) 39:6099–6108
0
0.1
0.2
0.3
0.4
0.5
0.6
0.7
0.8
0.9
1
0 1 2 3 4 5 6 7 8 9
Deg
ree
of m
embe
rshi
p
Fr
in1mf1in1mf2
0
0.1
0.2
0.3
0.4
0.5
0.6
0.7
0.8
0.9
1
0 2 4 6 8 10 12
Deg
ree
of m
embe
rshi
p
yc / h
in2mf1in2mf2
0
0.1
0.2
0.3
0.4
0.5
0.6
0.7
0.8
0.9
1
0 0.02 0.04 0.06 0.08 0.1
Deg
ree
of m
embe
rshi
p
DN
in3mf1in3mf2
0
0.1
0.2
0.3
0.4
0.5
0.6
0.7
0.8
0.9
1
3 9 15 21 27 33 39 45
Deg
ree
of m
embe
rshi
p
N
in4mf1in4mf2
0
0.1
0.2
0.3
0.4
0.5
0.6
0.7
0.8
0.9
1
15 20 25 30 35 40 45
Deg
ree
of m
embe
rshi
p
S
in5mf1in5mf2
Fig. 4 Membership functions for the trained FIS
Scatter plots of energy dissipation versus to N and S indi-cate that the correlation is lower than that of the Fr1, yc/hand DN, so their scatter plots are not presented in thisstudy.
The performance of the ANFIS model for calculatingenergy dissipation of flow over stepped spillways was inves-tigated by plotting a scatter diagram, as shown in Figs. 8 and 9for training and testing, respectively. The determination coef-ficients of the proposed neuro-fuzzy model in training andtesting process are 0.974 and 0.966, respectively. This sug-gests high accuracy of implementation of neuro-fuzzy modelfor estimating the energy dissipation of flows over steppedspillways.
3.1 Regression Analyses
Multiple regression analyses were performed with differentcombinations of the dimensionless parameters that appearin Eq. (7). Several linear and nonlinear multiple regressionswere conducted using the Statistical Package for Social Sci-ence (SPSS) software version 17.
The fitted equations for physical models are given byEqs. (9)–(12):
�E/E0 = −1.063F−2.119r1 + 350.365(yc/h)−0.02
+473.031(DN)−0.014 + 61.544N 0.052
−858.114S0.007, r2 = 0.928 (9)
123
Arab J Sci Eng (2014) 39:6099–6108 6105
0
10
20
30
40
50
60
70
80
90
100
0.00 0.02 0.04 0.06 0.08 0.10 0.12
Δ E /
E0
(%)
DN
Fig. 5 Variation of �E/E0 versus DN for stepped spillways
0
10
20
30
40
50
60
70
80
90
100
0 2 4 6 8 10 12 14
ΔE /
E0
(%)
yc / h
Fig. 6 Variation of �E/E0 versus yc/h for stepped spillways
0
10
20
30
40
50
60
70
80
90
100
0 2 4 6 8 10
ΔE /
E0
(%)
Fr1
Fig. 7 Variation of �E/E0 versus Fr1 for stepped spillways
�E/E0 = 26.991(Fr1)0.075(yc/h)−0.298(DN)−0.048
×(N )0.255(S)−0.063, r2 = 0.865 (10)
�E/E0 = −172464.174(Fr1)1.791∗10−5 + 172471.549
×(DN)−4.747∗10−5, r2 = 0.903 (11)
y = 0.9733x + 1.5565R² = 0.974
0
20
40
60
80
100
120
0 20 40 60 80 100 120
Fig. 8 Predicted and observed values for training data
y = 0.9595x + 1.6973R² = 0.9667
0
20
40
60
80
100
120
0 20 40 60 80 100 120
Pre
dic
ted
Observed
Fig. 9 Predicted and observed values for testing data
0
10
20
30
40
50
60
70
80
90
100
0 10 20 30 40 50 60 70 80 90 100
Pre
dic
ted
Observed
Regressiony=x
Fig. 10 Performance of regression Eq. (11) and observed data points
�E/E0 = 21.748(Fr1)0.028(DN)−0.133, r2 = 0.845 (12)
An overview of Eqs. (9)–(12) indicates that the correlationof yc/h, N and S with energy dissipation is lower (compareEqs. 10 and 11) than that of the Fr1 and DN.
In practice, Eq. (11) can be helpful because it includessimple correlations among �E/E0, Fr1 and DN with r2 =0.903. With more accuracy, Eq. (9) with r2 = 0.928 can beused.
The performance of regression analysis using Eq. (11) ver-sus the observed data points is shown in Fig. 10, according to
123
6106 Arab J Sci Eng (2014) 39:6099–6108
Table 3 Error measurements in regression equations and ANFIS fortesting data
Determinationcoefficient (r2)
RE (average) RE(minimum)
RE(maximum)
Equation
0.908 0.0962 0.0022 1.0158 9
0.892 0.1133 0.00097 1.1879 11
0.966 0.0545 0.00056 0.3349 ANFIS
which regression Eq. (11) is capable of predicting the valuesof energy dissipation.
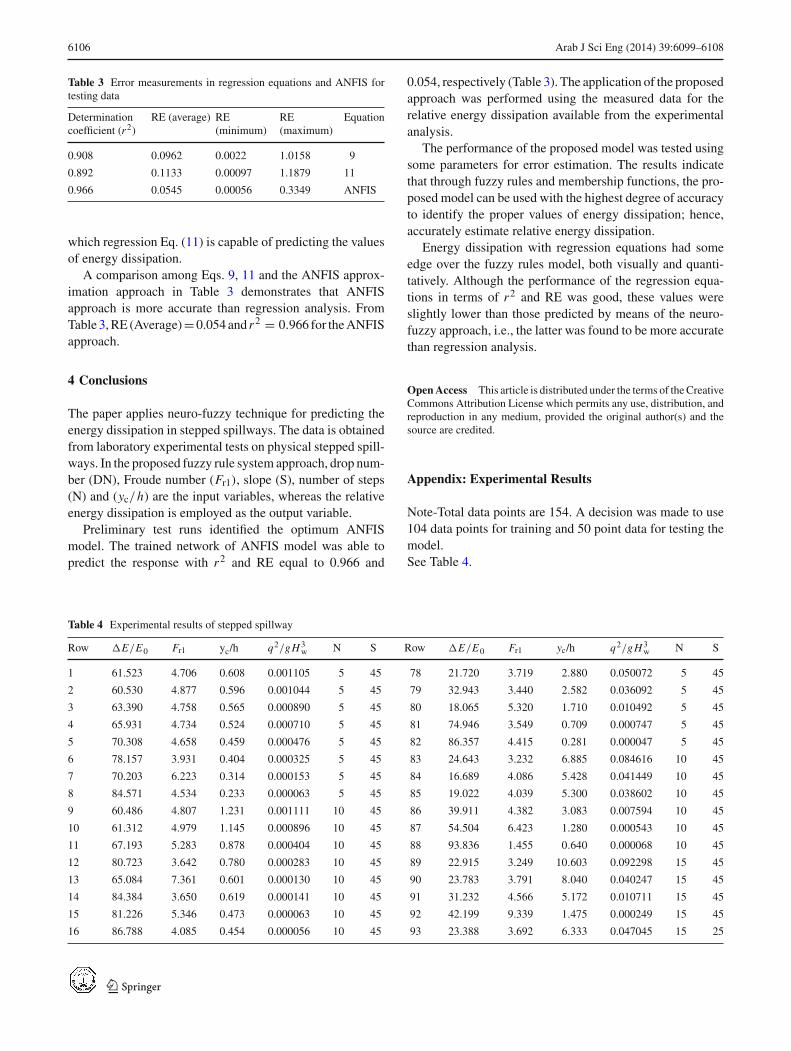
A comparison among Eqs. 9, 11 and the ANFIS approx-imation approach in Table 3 demonstrates that ANFISapproach is more accurate than regression analysis. FromTable 3, RE (Average)=0.054 and r2 = 0.966 for the ANFISapproach.
4 Conclusions
The paper applies neuro-fuzzy technique for predicting theenergy dissipation in stepped spillways. The data is obtainedfrom laboratory experimental tests on physical stepped spill-ways. In the proposed fuzzy rule system approach, drop num-ber (DN), Froude number (Fr1), slope (S), number of steps(N) and (yc/h) are the input variables, whereas the relativeenergy dissipation is employed as the output variable.
Preliminary test runs identified the optimum ANFISmodel. The trained network of ANFIS model was able topredict the response with r2 and RE equal to 0.966 and
0.054, respectively (Table 3). The application of the proposedapproach was performed using the measured data for therelative energy dissipation available from the experimentalanalysis.
The performance of the proposed model was tested usingsome parameters for error estimation. The results indicatethat through fuzzy rules and membership functions, the pro-posed model can be used with the highest degree of accuracyto identify the proper values of energy dissipation; hence,accurately estimate relative energy dissipation.
Energy dissipation with regression equations had someedge over the fuzzy rules model, both visually and quanti-tatively. Although the performance of the regression equa-tions in terms of r2 and RE was good, these values wereslightly lower than those predicted by means of the neuro-fuzzy approach, i.e., the latter was found to be more accuratethan regression analysis.
Open Access This article is distributed under the terms of the CreativeCommons Attribution License which permits any use, distribution, andreproduction in any medium, provided the original author(s) and thesource are credited.
Appendix: Experimental Results
Note-Total data points are 154. A decision was made to use104 data points for training and 50 point data for testing themodel.See Table 4.
Table 4 Experimental results of stepped spillway
Row �E/E0 Fr1 yc/h q2/gH3w N S Row �E/E0 Fr1 yc/h q2/gH3
w N S
1 61.523 4.706 0.608 0.001105 5 45 78 21.720 3.719 2.880 0.050072 5 45
2 60.530 4.877 0.596 0.001044 5 45 79 32.943 3.440 2.582 0.036092 5 45
3 63.390 4.758 0.565 0.000890 5 45 80 18.065 5.320 1.710 0.010492 5 45
4 65.931 4.734 0.524 0.000710 5 45 81 74.946 3.549 0.709 0.000747 5 45
5 70.308 4.658 0.459 0.000476 5 45 82 86.357 4.415 0.281 0.000047 5 45
6 78.157 3.931 0.404 0.000325 5 45 83 24.643 3.232 6.885 0.084616 10 45
7 70.203 6.223 0.314 0.000153 5 45 84 16.689 4.086 5.428 0.041449 10 45
8 84.571 4.534 0.233 0.000063 5 45 85 19.022 4.039 5.300 0.038602 10 45
9 60.486 4.807 1.231 0.001111 10 45 86 39.911 4.382 3.083 0.007594 10 45
10 61.312 4.979 1.145 0.000896 10 45 87 54.504 6.423 1.280 0.000543 10 45
11 67.193 5.283 0.878 0.000404 10 45 88 93.836 1.455 0.640 0.000068 10 45
12 80.723 3.642 0.780 0.000283 10 45 89 22.915 3.249 10.603 0.092298 15 45
13 65.084 7.361 0.601 0.000130 10 45 90 23.783 3.791 8.040 0.040247 15 45
14 84.384 3.650 0.619 0.000141 10 45 91 31.232 4.566 5.172 0.010711 15 45
15 81.226 5.346 0.473 0.000063 10 45 92 42.199 9.339 1.475 0.000249 15 45
16 86.788 4.085 0.454 0.000056 10 45 93 23.388 3.692 6.333 0.047045 15 25
123

Arab J Sci Eng (2014) 39:6099–6108 6107
Table 4 continued
Row �E/E0 Fr1 yc/h q2/gH3w N S Row �E/E0 Fr1 yc/h q2/gH3
w N S
17 87.066 4.101 0.442 0.000051 10 45 94 29.799 3.928 5.032 0.023607 15 25
18 84.818 5.505 0.364 0.000029 10 45 95 39.447 4.290 3.594 0.008597 15 25
19 53.397 5.346 1.956 0.001271 15 45 96 68.119 3.822 1.916 0.001304 15 25
20 60.260 4.820 1.875 0.001121 15 45 97 75.376 4.321 1.225 0.000340 15 25
21 62.144 4.810 1.779 0.000956 15 45 98 79.242 3.956 1.132 0.000269 15 25
22 70.890 4.417 1.477 0.000547 15 45 99 95.727 0.234 0.284 0.000004 15 25
23 70.062 5.166 1.242 0.000326 15 45 100 96.441 0.307 0.278 0.000004 15 25
24 64.960 6.336 1.124 0.000241 15 45 101 22.516 3.382 2.334 0.077210 5 25
25 71.521 5.883 0.991 0.000165 15 45 102 23.893 3.889 1.798 0.035287 5 25
26 83.994 4.279 0.800 0.000087 15 45 103 34.138 3.903 1.451 0.018549 5 25
27 88.529 3.764 0.654 0.000047 15 45 104 55.410 3.945 0.858 0.003837 5 25
28 92.395 3.750 0.427 0.000013 15 45 105 72.669 2.791 0.728 0.002338 5 25
29 56.414 5.158 2.548 0.001169 20 45 106 93.735 0.341 0.166 0.000028 5 25
30 54.585 5.391 2.513 0.001122 20 45 107 95.734 0.258 0.094 0.000005 5 25
31 57.646 5.155 2.467 0.001061 20 45 108 32.761 3.246 4.297 0.047945 10 25
32 57.767 5.249 2.399 0.000976 20 45 109 34.477 3.817 3.217 0.020120 10 25
33 54.751 5.615 2.365 0.000935 20 45 110 56.071 3.590 2.065 0.005324 10 25
34 59.966 5.199 2.286 0.000844 20 45 111 87.756 2.395 0.733 0.000237 10 25
35 60.962 5.239 2.198 0.000750 20 45 112 15.136 3.484 7.144 0.104340 15 15
36 62.960 5.225 2.079 0.000635 20 45 113 13.145 3.811 6.327 0.072493 15 15
37 69.447 4.674 1.941 0.000517 20 45 114 26.775 3.510 5.552 0.048963 15 15
38 65.435 5.427 1.828 0.000431 20 45 115 34.037 3.676 4.416 0.024638 15 15
39 71.836 5.084 1.589 0.000284 20 45 116 32.178 3.787 4.387 0.024160 15 15
40 77.825 4.573 1.402 0.000195 20 45 117 41.184 3.682 3.750 0.015085 15 15
41 90.285 2.673 1.055 0.000083 20 45 118 45.071 3.705 3.388 0.011127 15 15
42 91.466 3.424 0.714 0.000026 20 45 119 48.367 4.225 2.592 0.004981 15 15
43 95.710 3.243 0.372 0.000004 20 45 120 61.490 3.662 2.192 0.003016 15 15
44 42.443 6.275 4.484 0.001343 35 45 121 61.848 4.369 1.716 0.001447 15 15
45 46.099 6.045 4.383 0.001253 35 45 122 81.976 2.512 1.382 0.000756 15 15
46 45.403 6.271 4.222 0.001120 35 45 123 89.186 2.460 0.802 0.000147 15 15
47 44.749 6.526 4.043 0.000984 35 45 124 22.376 3.342 13.781 0.082713 30 15
48 51.015 6.087 3.887 0.000874 35 45 125 25.744 3.337 12.855 0.067132 30 15
49 53.859 6.078 3.639 0.000718 35 45 126 25.166 3.548 11.758 0.051369 30 15
50 58.269 5.884 3.398 0.000584 35 45 127 30.232 3.763 9.622 0.028150 30 15
51 63.573 5.571 3.144 0.000463 35 45 128 36.844 3.982 7.663 0.014220 30 15
52 68.903 5.805 2.499 0.000232 35 45 129 53.027 4.906 3.900 0.001874 30 15
53 83.291 4.175 1.943 0.000109 35 45 130 57.673 5.151 3.227 0.001062 30 15
54 91.516 2.925 1.406 0.000041 35 45 131 94.996 1.428 1.043 0.000036 30 15
55 94.435 2.919 0.908 0.000011 35 45 132 26.388 3.287 2.189 0.069367 5 15
56 46.559 6.271 6.038 0.001040 50 45 133 29.013 3.289 2.064 0.058102 5 15
57 68.387 5.267 4.245 0.000361 50 45 134 32.891 3.397 1.798 0.038402 5 15
58 67.240 5.425 4.245 0.000361 50 45 135 45.866 3.232 1.418 0.018834 5 15
59 55.561 7.034 4.174 0.000344 50 45 136 37.728 3.798 1.360 0.016632 5 15
60 58.334 6.770 4.098 0.000325 50 45 137 48.168 3.971 0.998 0.006582 5 15
61 63.225 6.202 4.027 0.000309 50 45 138 56.691 3.470 0.956 0.005780 5 15
62 58.139 6.883 4.027 0.000309 50 45 139 61.166 3.711 0.764 0.002950 5 15
63 69.063 5.410 4.000 0.000302 50 45 140 57.286 4.078 0.756 0.002861 5 15
123

6108 Arab J Sci Eng (2014) 39:6099–6108
Table 4 continued
Row �E/E0 Fr1 yc/h q2/gH3w N S Row �E/E0 Fr1 yc/h q2/gH3
w N S
64 68.069 6.013 3.596 0.000220 50 45 141 66.842 3.952 0.584 0.001315 5 15
65 79.533 4.282 3.437 0.000192 50 45 142 68.882 4.275 0.490 0.000779 5 15
66 76.888 4.910 3.301 0.000170 50 45 143 83.096 4.530 0.233 0.000084 5 15
67 71.326 6.503 2.884 0.000113 50 45 144 20.522 3.244 5.008 0.108685 10 15
68 85.997 3.985 2.493 0.000073 50 45 145 27.132 3.277 4.263 0.067043 10 15
69 90.110 3.264 2.162 0.000048 50 45 146 32.461 3.349 3.655 0.042257 10 15
70 95.096 1.669 1.796 0.000027 50 45 147 34.180 3.740 2.964 0.022532 10 15
71 92.397 3.082 1.742 0.000025 50 45 148 44.370 3.742 2.349 0.011221 10 15
72 94.628 2.715 1.376 0.000012 50 45 149 44.105 4.156 2.030 0.007243 10 15
73 96.580 2.165 1.047 0.000005 50 45 150 51.193 4.420 1.568 0.003338 10 15
74 20.735 3.628 1.179 0.060239 3 45 151 56.819 4.907 1.172 0.001392 10 15
75 28.297 3.900 0.899 0.026757 3 45 152 80.929 3.253 0.776 0.000404 10 15
76 47.728 3.832 0.599 0.007919 3 45 153 95.475 0.598 0.298 0.000023 10 15
77 62.845 4.358 0.331 0.001332 3 45 154 96.217 0.686 0.259 0.000015 10 15
References
1. Chanson, H.: The Hydraulics of Stepped Chutes and Spillways,pp. 10–11. Balkema, Lisse, The Netherlands (2001)
2. Toombes, L.; Chanson, H.: Flow patterns in nappe flow regimedown low gradient stepped chutes. J. Hydra. Res. 46(1), 4–14 (2008)
3. Chamani, M.R.; Rajaratnam, N.: Characteristics of skimming flowover stepped spillways. J. Hydraul. Eng. 125(4), 361–368 (1999)
4. Rajaratnam, N.: Skimming flow in stepped spillway. J. Hydraul.Eng. 116(5), 587–591 (1990)
5. Chanson, H.; Toombes, L.: Hydraulics of stepped chutes: the tran-sition flow. J. Hydraul. Res. 42(1), 43–54 (2004)
6. Salmasi, F.: Hydraulic investigation and physical modeling ofstepped spillways. Ph.D. Dissertation, Shahid Chamran University(SCU), Ahvaz, Iran (2004)
7. Yuhong, Z.; Wenxin, H.: Application of artificial neural networkto predict the friction factor of open channel flow. Commun. Non-linear Sci. Numer. Simul. 14, 2373–2378 (2009)
8. Kisi, O.: River flow modeling using artificial neural networks. J.Hydrol. Eng. 9(1), 60–63 (2004)
9. Rakhshandehroo, G.R.; Vaghefi, M.; Asadi Aghbolaghi, M.: Fore-casting groundwater level in Shiraz plain using artificial neuralnetworks. Arab. J. Sci. Eng. AJSE 37(7), 1871–1883 (2012)
10. Eslamian, S.S.; Gohari, S.A.; Zareian, M.J.; Firoozfar, A.: Estimat-ing Penman–Monteith reference evapotranspiration using artificialneural networks and genetic algorithm: a case study. Arab. J. Sci.Eng. AJSE 37(4), 935–944 (2012)
11. Ozger, M.; Yildirim, G.: Determining turbulent flow friction coef-ficient using adaptive neuro-fuzzy computing technique. Adv. Eng.Softw. 40, 281–287 (2009)
12. Yildirim, G.; Ozger, M.: Neuro-fuzzy approach in estimatingHazen–Williams friction coefficient for small-diameter poly-ethylene pipes. Adv. Eng. Softw. 40, 593–599 (2009)
13. Pegram, G.G.S.; Officer, A.K.; Mottram, S.R.: Hydraulic ofskimming flow on modelled stepped spillways. J. Hydraul.Eng. 125(5), 500–509 (1999)
14. Rand, W.: Flow geometry at straight drop spillway. Proc. Am. Soc.Civ. Eng. 81. Paper 791, 1–13 (1955)
15. Jang, S.R.: ANFIS: adaptive-network-based fuzzy inference sys-tem. IEEE Trans. Syst. Man Cybern. 23(3), 665–685 (1993)
16. Takagi, T.; Sugeno, M: Fuzzy identification of systems and itsapplication to modelling and control. IEEE Trans. Syst. ManCybern. 15(1), 116–132 (1985)
123