Neural Net Stock Trend Predictor - Department of … · Neural Net Stock Trend Predictor By Sonal...
46
Neural Net Stock Trend Predictor By Sonal Kabra Advisor: Dr. Chris Polle- Commi,ee Members: Dr. Robert Chun Mr. Paul Thienprasit
Transcript of Neural Net Stock Trend Predictor - Department of … · Neural Net Stock Trend Predictor By Sonal...

Neural Net Stock Trend Predictor
By Sonal Kabra
Advisor:Dr.ChrisPolle-
Commi,eeMembers:Dr.RobertChun
Mr.PaulThienprasit

SJSU Washington Square
• Purpose• Introduc7on• ReviewofExis7ngWork
• PriorExperiments
• OurApproach• NeuralNetworks• ModelsDeveloped
• Results• Conclusion
Agenda

SJSU Washington Square
• This project consisted of experiments and implementations of several neural nets to predict Stock Market movement and indicates whether the stock under study should be -- Bought, Neutral, or Sold to generate profit.
• All of our neural nets were designed to predict stock prices for the following week.
Purpose

SJSU Washington Square
• Since the beginning of the stock market in 1817 in the United States, accurate stock prediction has been a goal of investors.
• One difficulty in accurately predicting stocks is the high
number of variables on which they depend.
Introduction

SJSU Washington Square
• Our neural nets used financial data from Quandl. • Below is some example data showing attributes this data
has.
Introduction

SJSU Washington Square
• Mostinvestorsfollowtwoanaly7calmethods:
• FundamentalAnalysis• Studiescompanyfundamentalfactors• Helpstheinvestorstofindthestocksworthinves7ng
• TechnicalAnalysis
• Iden7fiesthefutureuptrendordowntrendpa,erns.
Introduction
SJSU Washington Square
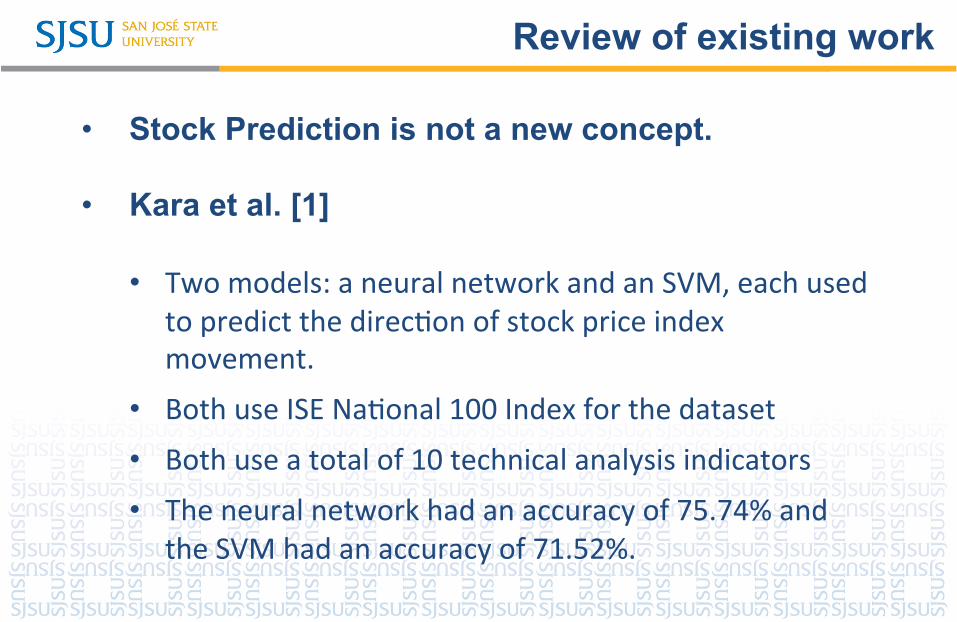
• Stock Prediction is not a new concept. • Kara et al. [1]
• Twomodels:aneuralnetworkandanSVM,eachusedtopredictthedirec7onofstockpriceindexmovement.
• BothuseISENa7onal100Indexforthedataset• Bothuseatotalof10technicalanalysisindicators• Theneuralnetworkhadanaccuracyof75.74%and
theSVMhadanaccuracyof71.52%.
Review of existing work

SJSU Washington Square Our Approach
• Instead of predicting Up/Down signals, it will predict stock trade signals namely “Buy, Sell or Neutral” for next week.
• Instead of combining all the technical indicator, neural net will train separately for each indicator.

SJSU Washington Square
• Whenever human invests in stocks, they try to study the past data to find the similar pattern.
• The earlier experiments used K-nearest neighbor and decision tree machine learning regression techniques.
• By using those techniques, earlier experiments predict the
closing price of the same day.
Prior Experiments

SJSU Washington Square
• Thealgorithmstatesthatthepredic7onvaluesaresimilarfortheobjectsthatareincloseproximityofeachother.
• Thus,wecanassumethatthepredic7onvalueswillbealmostequalforsuchobjects.
K-nearest neighbor: Prior Experiments

SJSU Washington Square
• KNN has a high error range for both stocks • The predictions are completely off from the right prices.
ActualPrices:FB:149.78CSCO:34.3
K-nearest neighbor: Prior Experiments

SJSU Washington Square
• Helpstomakepredic7onsbymappinggivenobserva7onstoconclusions.
• Dividetheinforma7onintosmallgatheringsbasedonmaximizinginforma7ongain.
ActualPrices:FB:149.78CSCO:34.3
Decision Tree: Prior Experiments

OurApproach

Technical Analysis for stock prediction
• Effec7veforshort-termtrading.
• Observesmoneyflow,momentum,andvola7lity.
• Supplementsinconfirma7onoftrendorpa,ern
• 2Types:– LeadingIndicators– LaggingIndicators

Moving Average Crossover
• Isalaggingindicator.• Formula:
• 5-Dayand10-DayMovingAverageCrossoverStrategy

Relative strength Index
• Itisaleadingindicator• Ittellswhetherthegivenstockisoverboughtoroversold.• Formula:
• Theprojectisusingthe14-DayperiodfortheRSI.• TheRSIvalueabove70indicatesanoversoldregion,while
below30indicatestheoverboughtregion.

On Balance Volume
• Itisusedtofindbuyingandsellingtrendofthestock.• Itcalculatestheposi7veandnega7veflowofthevolume
onitsprice.• Ifthecurrentclosingpriceismorethanthepreviousclose
price:
• Ifthecurrentclosingpricefallsbelowthepreviouscloseprice:
• ElseitwilljustassignthepreviousOBVtocurrentOBV.

Artificial Neural Network
• Arecomputa7onalmodelsthatreplicatethebehaviorandadaptthefeaturesofbiologicalneuralsystems.
• Hasthousandsofar7ficialneuronsjustlikethehumanbrainhasneuronnodes.

Artificial Neural Network
• InputlayercomprisesofnodesorallinputfeaturesintheTrainingset.
• Hiddenlayercomprisesofthenoderesponsibleforthe
processingandlearningofdatafromtheInputLayer.• Outputlayercomprisesofaclassnode.

Training Neural Network
• Backpropaga7onalgorithm.
• Theproblemissetupasminimiza7onofalossfunc7on.
• RPROPAlgorithm

Libraries Used
●Keras(NeuralNetworkLibrary)
●Sklearn(Machinelearninganddataanalysislibrary)
●Numpy(formathema7calcalcula7ons)
●Matplotlib(Ploengtheresults)
●QuandlAPI(Stockdata)
●Pandas(storingstockdatastructure)

SJSU Washington Square
• S&P500market
• Blanketsadiversesetofmul7na7onalcorpora7ons
• CollectthedatasetfromQuandl.
• PythonQuandlAPI
Dataset

SJSU Washington Square
• All the features in the data set are not in similar range.
• Thevaluesindatasetsarenormalizedintherangeof[-1,1].
• The formula is:
Data Preprocessing

SJSU Washington Square
• Thedataispar77onedintothetraining(70%ofthedataset),thevalida7on(20%)dataset,andtest(10%)
• The100con7guousdatapointsarerandomlyheldfromthegenerateddataset.
• Theneuralnetistrainedonaround800stockdatapointsandlatertestedon100.
Data Preprocessing

SJSU Washington Square
• 4-layerneuralnetwork.
• 30inputnodes:Threenodesforeachday7lltendays.
• Inputfeatures:5-DaySMA,10-DaySMAandClosingpriceofthatday.
• 2hiddenlayers:60and60.
• Theac7va7onusedistanh.
Moving Average Crossover Model

SJSU Washington Square
• 4-layerneuralnetwork.
• 20inputnodes:Twonodesforeachday7lltendays.
• Inputfeatures:14-DayRSI,andClosingpriceofthatday.
• 2hiddenlayers:40and40.
• Theac7va7onusedistanh.
RSI Model

SJSU Washington Square
• 4-layerneuralnetwork.
• 30inputnodes:Threenodesforeachday7lltendays.
• Inputfeatures:Onbalancevolumeoftheday,Volumeoftheday,andClosingpriceofthatday.
• 2hiddenlayers:60and60.
• Theac7va7onusedistanh.
OBV Model

SJSU Washington Square
• Allthemodelsaremergedintofinallayeroftheneuralnetworkasshowninthefollowingfigure.
• Thewholearchitectureistrainedtogether,insteadoftrainingeachmodeldifferently.
Merged NN Randomized Model

SJSU Washington Square
• Thearchitectureissameaspreviousmodel.
• Thetestdatasetgeneratedinthisexperimentisnotrandom.
• Thetrainingisstrictlyforcedtousetheearlydaysofstockdata,andtes7ngisdoneinrecentdaysofstockdata.
Merged NN in Sequence Model

SJSU Washington Square
• Asthisisamul7-classifica7onproblem("Buy,""Sell,"or"Neutral"),theaccuracymetricusedisaConfusionMatrix.
• Accuracydefinedisthenumberofcorrectlyclassifiedpointsincomparisontothetotalnumberclassifica7onsmade.
Results
TotalnumberofObserva7ons
True_Buy+True_Sell+True_NeutralAccuracy=

SJSU Washington Square
• Tocalculatetheprofitabilityforeachmodelfollowingformulaisusedtocalculatethenormalizedweeklyreturnofastock.:
• Theaveragerisk-freerateofweeklyreturnis0.035%
Results
(Total_Posi7ve+Total_Nega7ve)–(False_Posi7ve+False_Nega7ve)
totalobserva7onsReturnThreshold(=1%)*

Moving Average Crossover
C[Acc.47.00%(+/-4.16%)]2.72HD[Acc.37.60%(+/-3.47%)]
1.04

Moving Average Crossover

RSI Model
XOM[Acc.29.60%(+/-8.16%)]
0.71
CAT[Acc.37.40%(+/-6.41%)]
1.87

RSI Model

OBV Model
C[Acc.46.80%(+/-4.58%)]
1.16 HD[Acc.34.20%(+/-1.16%)]0.77

OBV Model

Merged NN Randomized Model
CAT[Acc.44.36%(+/-4.76%)]
8.5 HD[Acc.34.26%(+/-1.76%)]0.90

Merged NN Randomized Model
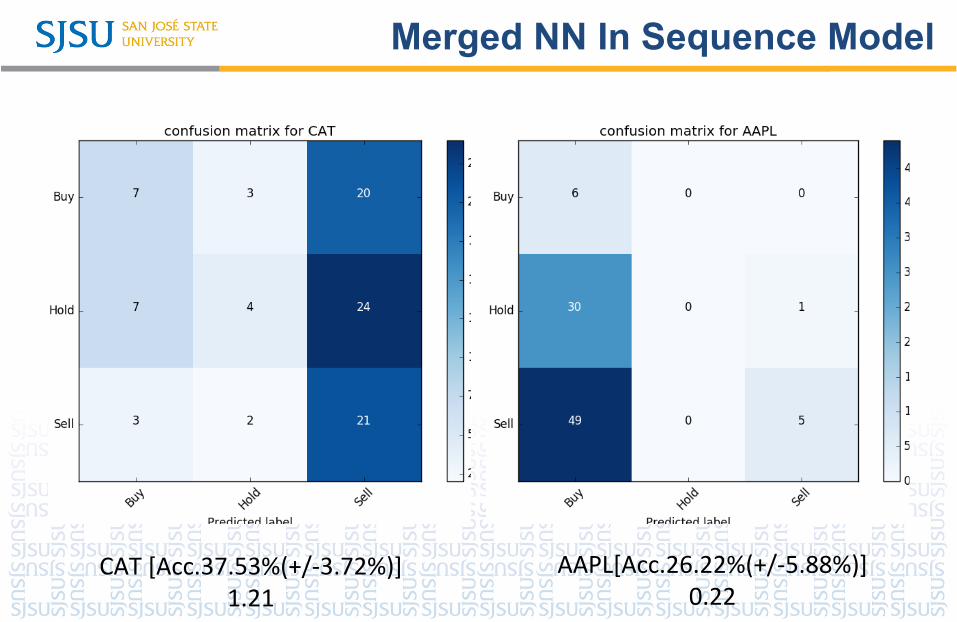
Merged NN In Sequence Model
CAT[Acc.37.53%(+/-3.72%)]
1.21 AAPL[Acc.26.22%(+/-5.88%)]0.22

Merged NN In Sequence Model

Results
Whysomemodelsmayperformedpoorly:
• ModelComplexity
• TrainingData
• MarketNoise

Conclusion
• FromtheConfusionmatricesforabovesimula7ons,MergedModelRandomizeds7llgivesbe,erresultsthantheMergedModelinSequence.
• Ifweconsideronlymovingaveragecrossovermodel,thenthatmodelgivesmorereturnsthanrestofthem.
• Therefore,forfuturedevelopmentonecansurelyuseMovingaveragecrossovermodel.

References
• YakupKara,MelekAcarBoyacioglu,andÖmerKaanBaykan.Predic7ngdirec7onofstockpriceindexmovementusingar7ficialneuralnetworksandsupportvectormachines:Thesampleoftheistanbulstockexchange.ExpertsystemswithApplica2ons,38(5):5311–5319,2011.
• ShunrongShen,HaomiaoJiang,andTongdaZhang.Stockmarketfore-cas7ngusingmachinelearningalgorithms,2012.
• E.F.Fama,K.R.French,"Commonriskfactorsinthereturnsonstocksandbonds",Journaloffinancialeconomics,vol.33,no.1,pp.356,1993.

References
• D.G.McMillan,"Stockreturndividendgrowthandconsump7ongrowthpredictabilityacrossmarketsand7me:Implica7onsforstockpricemovement",Interna2onalReviewofFinancialAnalysis,vol.35,pp.90101,2014.
• M.Billah,S.WaheedandA.Hanifa,"Stockmarketpredic7onusinganimprovedtrainingalgorithmofneuralnetwork,"20162ndInterna2onalConferenceonElectrical,Computer&Telecommunica2onEngineering(ICECTE),Rajshahi,2016,pp.1-4.
• M.D.Godfrey,C.W.Granger,andO.Morgenstern,"Therandom-walkhypothesisofstockmarketbehaviora,"Kyklos,vol.17,no.1,pp.1-30,1964.
• J.Murphy,"Technicalanalysisofthefinancialmarkets,pren7cehall,london,"1998

THANKYOU..!!!