Neural correlates of text-based emoticons: a preliminary ... · how text-based emoticons are...
10
Neural correlates of text-based emoticons: a preliminary fMRI study Ko Woon Kim 1,2 , Sang Won Lee 1 , Jeewook Choi 3 , Tae Min Kim 4 & Bumseok Jeong 1 1 Clinical Neuroscience and Development Laboratory, Graduate School of Medical Science and Engineering, Korean Advanced Institute of Science and Technology, Daejeon, Korea 2 Department of Neurology, Samsung Medical Center, Sungkyunkwan University School of Medicine, Seoul, Korea 3 Department of Psychiatry, Daejeon St. Mary’s Hospital, The Catholic University of Korea College of Medicine, Daejeon, Korea 4 Department of Psychiatry, Eulji University, Daejeon, Korea Keywords Emoticon, emotion, fMRI, fusiform face area, occipital face area Correspondence Bumseok Jeong, Korean Advanced Institute of Science and Technology (KAIST), Graduate School of Medical Science and Engineering, KI for Health Science and Technology, Clinical Neuroscience and Development Laboratory, 291 Daehak-ro, Yuseong-gu, Daejeon 34141, Korea. Tel: +82-42-350- 4245; Fax: +82-42-350-7168; E-mail: [email protected] Funding Information This work was supported by National Research Foundation under Grant [NRF-2006- 2005372]; BK21 plus, the KAIST Future Systems Healthcare Project, and KI for Health Science and Technology Project Grant [N11160068, N11160074]. Received: 1 December 2015; Revised: 24 April 2016; Accepted: 29 April 2016 Brain and Behavior, 2016; 6(8), e00500, doi: 10.1002/brb3.500 Abstract Introduction: Like nonverbal cues in oral interactions, text-based emoticons, which are textual portrayals of a writer’s facial expressions, are commonly used in electronic device–mediated communication. Little is known, however, about how text-based emoticons are processed in the human brain. With this study, we investigated whether the text-based emoticons are processed as face expres- sions using fMRI. Methods: During fMRI scan, subjects were asked to respond by pressing a button, indicating whether text-based emoticons represented posi- tive or negative emotions. Voxel-wise analyses were performed to compare the responses and contrasted with emotional versus scrambled emoticons and among emoticons with different emotions. To explore processing strategies for text-based emoticons, brain activity in the bilateral occipital and fusiform face areas were compared. Results: In the voxel-wise analysis, both emotional and scrambled emoticons were processed mainly in the bilateral fusiform gyri, infe- rior division of lateral occipital cortex, inferior frontal gyri, dorsolateral pre- frontal cortex (DLPFC), dorsal anterior cingulate cortex (dACC), and parietal cortex. In a percent signal change analysis, the right occipital and fusiform face areas showed significantly higher activation than left ones. In comparisons among emoticons, sad one showed significant BOLD signal decrease in the dACC, the left AIC, the bilateral thalamus, and the precuneus as compared with other conditions. Conclusion: The results of this study imply that people recog- nize text-based emoticons as pictures representing face expressions. Even though text-based emoticons contain emotional meaning, they are not associ- ated with the amygdala while previous studies using emotional stimuli docu- mented amygdala activation. Introduction In the age of SNS, people communicate, share, and coop- erate through social network services (SNS). The upsurge of text-based communication (e.g., e-mails, mobile text message, messages on the SNS) among people in modern society has drawn increasing attention to new forms of nonverbal communication. Text-based emoticons are one of the most common forms of nonverbal communication in modern society, especially for young people. Accord- ingly, they have become as important as classic nonverbal communication such as facial expressions, gestures, and voice tone. Similar to facial expressions, a text-based emoticon, as part of a message, functions as a nonverbal form of communication to deliver one’s emotion, atti- tude, and intention (Derks et al. 2008a, 2007, 2008b,c). Therefore, it is important to comprehend processing strategies of text emoticons in the human brain. However, research on understanding the neurological mechanisms related to text-based emoticons is strikingly lacking. To date there have only been a handful of neuroimaging studies concerning text-based emoticons. An fMRI study ª 2016 The Authors. Brain and Behavior published by Wiley Periodicals, Inc. This is an open access article under the terms of the Creative Commons Attribution License, which permits use, distribution and reproduction in any medium, provided the original work is properly cited. Brain and Behavior, doi: 10.1002/brb3.500 (1 of 10)
Transcript of Neural correlates of text-based emoticons: a preliminary ... · how text-based emoticons are...
Neural correlates of text-based emoticons: a preliminaryfMRI studyKo Woon Kim1,2, Sang Won Lee1, Jeewook Choi3, Tae Min Kim4 & Bumseok Jeong1
1Clinical Neuroscience and Development Laboratory, Graduate School of Medical Science and Engineering, Korean Advanced Institute of Science
and Technology, Daejeon, Korea2Department of Neurology, Samsung Medical Center, Sungkyunkwan University School of Medicine, Seoul, Korea3Department of Psychiatry, Daejeon St. Mary’s Hospital, The Catholic University of Korea College of Medicine, Daejeon, Korea4Department of Psychiatry, Eulji University, Daejeon, Korea
Keywords
Emoticon, emotion, fMRI, fusiform face area,
occipital face area
Correspondence
Bumseok Jeong, Korean Advanced Institute
of Science and Technology (KAIST), Graduate
School of Medical Science and Engineering,
KI for Health Science and Technology,
Clinical Neuroscience and Development
Laboratory, 291 Daehak-ro, Yuseong-gu,
Daejeon 34141, Korea. Tel: +82-42-350-
4245; Fax: +82-42-350-7168; E-mail:
Funding Information
This work was supported by National
Research Foundation under Grant [NRF-2006-
2005372]; BK21 plus, the KAIST Future
Systems Healthcare Project, and KI for Health
Science and Technology Project Grant
[N11160068, N11160074].
Received: 1 December 2015; Revised: 24
April 2016; Accepted: 29 April 2016
Brain and Behavior, 2016; 6(8), e00500,
doi: 10.1002/brb3.500
Abstract
Introduction: Like nonverbal cues in oral interactions, text-based emoticons,
which are textual portrayals of a writer’s facial expressions, are commonly used
in electronic device–mediated communication. Little is known, however, about
how text-based emoticons are processed in the human brain. With this study,
we investigated whether the text-based emoticons are processed as face expres-
sions using fMRI. Methods: During fMRI scan, subjects were asked to respond
by pressing a button, indicating whether text-based emoticons represented posi-
tive or negative emotions. Voxel-wise analyses were performed to compare the
responses and contrasted with emotional versus scrambled emoticons and
among emoticons with different emotions. To explore processing strategies for
text-based emoticons, brain activity in the bilateral occipital and fusiform face
areas were compared. Results: In the voxel-wise analysis, both emotional and
scrambled emoticons were processed mainly in the bilateral fusiform gyri, infe-
rior division of lateral occipital cortex, inferior frontal gyri, dorsolateral pre-
frontal cortex (DLPFC), dorsal anterior cingulate cortex (dACC), and parietal
cortex. In a percent signal change analysis, the right occipital and fusiform face
areas showed significantly higher activation than left ones. In comparisons
among emoticons, sad one showed significant BOLD signal decrease in the
dACC, the left AIC, the bilateral thalamus, and the precuneus as compared with
other conditions. Conclusion: The results of this study imply that people recog-
nize text-based emoticons as pictures representing face expressions. Even
though text-based emoticons contain emotional meaning, they are not associ-
ated with the amygdala while previous studies using emotional stimuli docu-
mented amygdala activation.
Introduction
In the age of SNS, people communicate, share, and coop-
erate through social network services (SNS). The upsurge
of text-based communication (e.g., e-mails, mobile text
message, messages on the SNS) among people in modern
society has drawn increasing attention to new forms of
nonverbal communication. Text-based emoticons are one
of the most common forms of nonverbal communication
in modern society, especially for young people. Accord-
ingly, they have become as important as classic nonverbal
communication such as facial expressions, gestures, and
voice tone. Similar to facial expressions, a text-based
emoticon, as part of a message, functions as a nonverbal
form of communication to deliver one’s emotion, atti-
tude, and intention (Derks et al. 2008a, 2007, 2008b,c).
Therefore, it is important to comprehend processing
strategies of text emoticons in the human brain. However,
research on understanding the neurological mechanisms
related to text-based emoticons is strikingly lacking.
To date there have only been a handful of neuroimaging
studies concerning text-based emoticons. An fMRI study
ª 2016 The Authors. Brain and Behavior published by Wiley Periodicals, Inc.
This is an open access article under the terms of the Creative Commons Attribution License, which permits use, distribution and reproduction in any medium,
provided the original work is properly cited.
Brain and Behavior, doi: 10.1002/brb3.500 (1 of 10)
reported on the activation of the face-specific area (right
FFA) by graphic emoticons and faces but not by text-based
emoticons (Yuasa et al. 2011a). In contrast, an EEG study
revealed that face-specific component (N170) was activated
by text-based emoticons as well as faces (Churches et al.
2014). Although the aforementioned study did not per-
form source reconstruction for N170, the FFA is generally
thought as the source of the face-selective N170 response
(Liu et al. 2002, 2010). Previous studies were not enough
to determine how emoticons are processed in the main
human cortical system for face processing. However, we
intended to clarify if text-based emoticons yield activation
in face-specific areas or not using fMRI.
The main human cortical system involved in face percep-
tion is composed of the fusiform face area (FFA), the occip-
ital face area (OFA), and the superior temporal sulcus
(STS) (Kanwisher et al. 1997; Gauthier et al. 2000; Haxby
et al. 2000). Previous research with fMRI suggests that the
OFA is involved in recognition of facial components (featu-
ral processing), whereas the FFA is involved in recognition
of facial silhouettes (configural processing) (Pitcher et al.
2011). Meanwhile, the STS is responsible for processing
changeable aspects of faces such as eye gaze and facial
expression (Puce et al. 1998; Haxby et al. 2000; Winston
et al. 2004; Nakajima et al. 2014). Previous researchers
demonstrated that these face-selective areas were larger and
more frequently found in the right hemisphere (RH) than
in the left hemisphere (LH) (Haxby et al. 1994; Puce et al.
1996; Gauthier et al. 2000; Rossion et al. 2003; Schiltz and
Rossion 2006; Large et al. 2008; Pitcher et al. 2009, 2011;
Nichols et al. 2010). Their findings of RH dominance in
face recognition have been generally accepted in this field
of study (Liu et al. 2010; Pitcher et al. 2011).
With regards to emotional processing, there are couple of
studies that have documented that the right inferior frontal
gyrus (IFG) is commonly activated by text-based emoticons,
graphic emoticons, and faces (Yuasa et al. 2011a,b,c). The
IFG is known to be activated by the emotional valence deci-
sion task (Nakamura et al. 1999). In the case of facial
expressions, the amygdala, the insula, and the ACC are
known as the main brain regions for emotion processing
(Phan et al. 2002). Furthermore, it was investigated that
there were selective differences between activations depend-
ing on the type of emotions. For instance, happy, fearful,
and sad faces specifically activated the amygdala, whereas
angry or disgusted faces activated insula (Fusar-Poli et al.
2009). But, there have been no studies to compare neural
networks between various emotional emoticons.
Although there was both fMRI study using face or gra-
phic emoticon and EEG study using text-based emoticon,
previous studies were not enough to make clear whether
text-based emoticon is processed by FFA. Also, no study
has investigated the difference in brain responses to
various emotions with text-based emotion. The aims of
this study were the following: (1) to determine whether
face-specific areas are activated by text-based emoticons
and (2) to compare between emotional emoticons and
scrambled emoticons. We examined the following hypoth-
esis by seeking the answer to this research question: We
hypothesize that if face-specific areas are evoked by text-
based emoticons, text-based emoticons trigger face-speci-
fic mechanisms. In contrast, unless face-specific areas are
activated, text-based emoticons may be processed through
separate system. Our study also evaluated the different
patterns of brain activity according to the type of emo-
tion being represented as well as the difference between
emotional emoticons and scrambled emoticons.
Methods
Subjects
Eighteen subjects (age = 30.5 � 6.6 years, M:F = 10:8)
were recruited through the message board at Eulji Univer-
sity Hospital in Daejeon, Korea. Subjects were interviewed
and screened to exclude any possible neurological and
psychiatric diseases. They were all right handed. This
study was approved by the Eulji University Hospital’s
Institutional Review Board. All subjects gave their written
informed consent before participating in the study.
Validation of text-based emoticon stimuli
We found the most representative text-based emoticons for
each emotion type and intensity through several steps
(Fig. 1). The mean valence of the selected emoticons was
not significantly different between the three emotional
emoticons and was significantly lower for the scrambled
emoticons than for the three emotional emoticons (F(3,
77) = 111.44, P < 0.001). In this study, each of the emo-
tional emoticons had both a vertical (oriental, erect) and
horizontal (western, lean) orientation. Although subjects
were familiar with both types, the linear-by-linear associa-
tion test with frequency analysis of emoticon directions
revealed that the percentage of the vertically and horizon-
tally oriented emoticons significantly differed for each con-
dition (v2 = 7.873, P = 0.049). Post hoc tests showed that
the happy condition had significantly more horizontal-
oriented emoticons than angry/fearful ones (v2 = 6.533,
P = 0.027). Accordingly, we used emoticon directions as a
covariate while analyzing event-related fMRI data.
Experimental paradigm
OptSeq2 RRID:SCR_014363 (http://surfer.nmr.mgh.harvard.
edu/optseq/), a tool for automatically scheduling events
Brain and Behavior, doi: 10.1002/brb3.500 (2 of 10) ª 2016 The Authors. Brain and Behavior published by Wiley Periodicals, Inc.
Emoticon Perception System K. W. Kim et al.
for rapid-presentation event-related fMRI experiments, was
used for our event-related paradigm (Fig. 2). With this
software, the onset times of the events were jittered to
remove the overlap from the estimate of the hemodynamic
response. During a run of 310 sec, 40 null events as well as
15 emoticons for each four conditions (happy, sad, angry/
fearful, and scrambled) were presented in pseudorandom
order. Each stimulus was presented for 1 sec with jittered
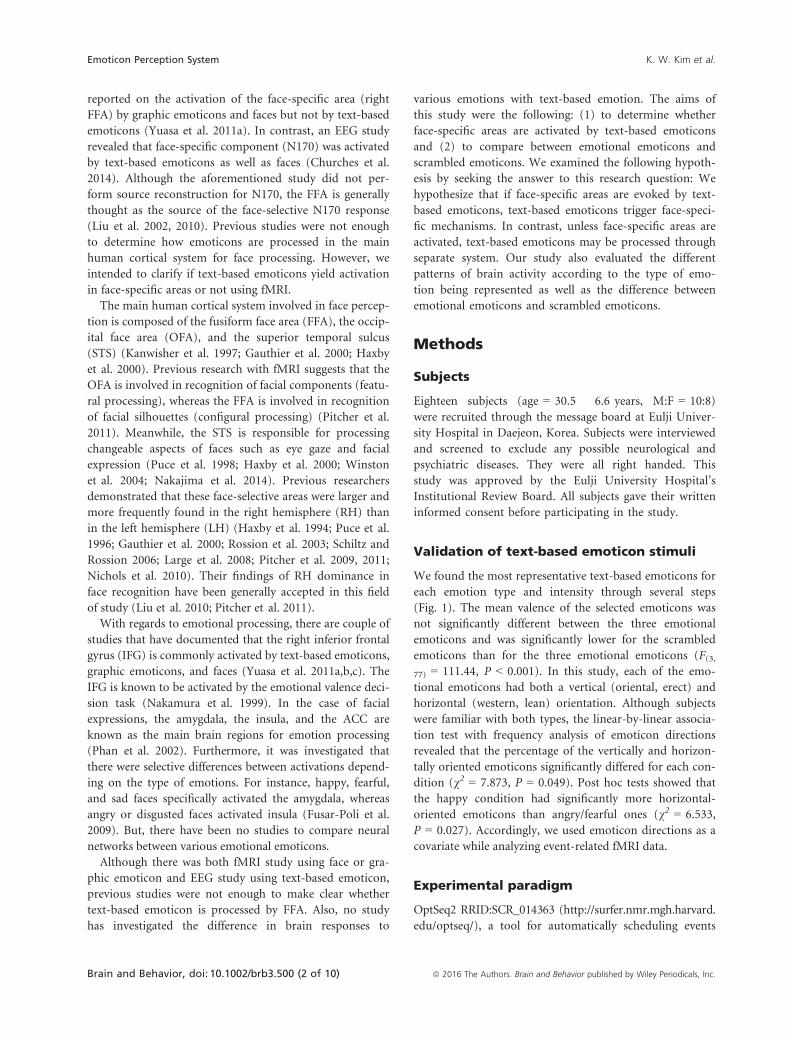
Figure 1. Standardization of text-based emoticon stimuli. A semi-automatic algorithm was used to find the most representative emoticons for
each emotion type. A total of 48 positive and 48 negative emoticons were collected on the world-wide web. Then we produced 96 scrambled
emoticons which lose their configural information by reordering or deleting the parts of each positive or negative emoticon. The emotional
valence of all 192 emoticons was measured on the Likert scale (0–5, 5 being the highest) for each condition by 20 healthy young volunteers
(age = 20.8 � 1.6 years, M:F = 13:7). Because only a limited number of emoticons satisfied our emotional valence criteria, both angry and
fearful ones were assembled together into a single angry/fearful condition which consisted of five angry and 10 fearful emoticons. To control the
emotional valence among emoticon conditions, the 15 highest scoring emoticons were selected for each emotional emoticon condition (happy,
sad, and angry/fearful) and the lowest scoring 15 emoticons were chosen for scrambled emoticon condition.
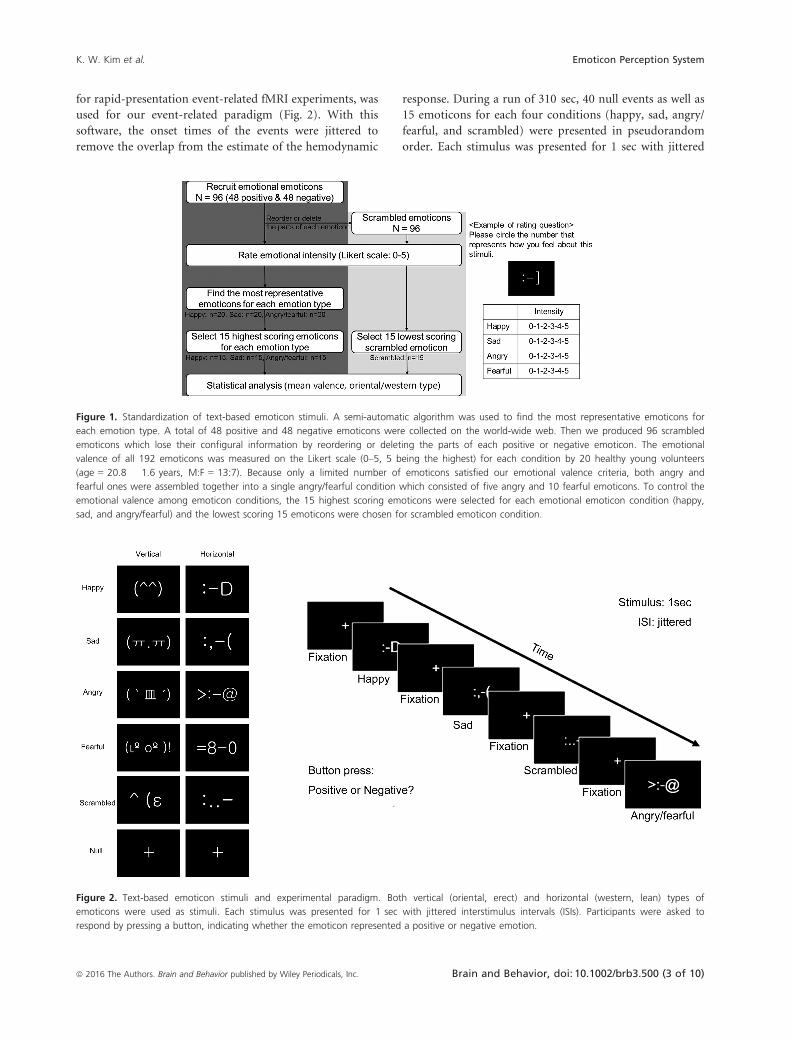
Figure 2. Text-based emoticon stimuli and experimental paradigm. Both vertical (oriental, erect) and horizontal (western, lean) types of
emoticons were used as stimuli. Each stimulus was presented for 1 sec with jittered interstimulus intervals (ISIs). Participants were asked to
respond by pressing a button, indicating whether the emoticon represented a positive or negative emotion.
ª 2016 The Authors. Brain and Behavior published by Wiley Periodicals, Inc. Brain and Behavior, doi: 10.1002/brb3.500 (3 of 10)
K. W. Kim et al. Emoticon Perception System
interstimulus intervals (ISIs) between 1 and 11 sec. During
the fMRI scan, subjects were asked to respond by pressing a
button indicating whether the emoticon represented a posi-
tive or negative emotion (Duncan et al. 2009). Scrambled
emoticons were arbitrarily determined to be either a posi-
tive or negative emotion by each subject. For this reason,
scrambled emoticons were subdivided into “scrambled pos-
itive” and “scrambled negative” conditions according to
each answer.
Statistical analyses for behavioral data
A Pearson’s chi-square test with frequency analysis was
carried out to analyze the error rate among the happy,
sad, and anger/fear emoticons. A one-way ANOVA was
performed to compare the mean response time among
the four conditions and response errors; the error condi-
tion was defined as no responses, wrong responses, and
delayed (>1.1 sec) responses.
MRI data acquisition
All 18 subjects underwent MRI procedures on the 3.0-T
whole-body MRI Echo speed system (ISOL, Korea). A high-
resolution structural MRI examination (TE = 5.7 msec,
TR = 10 msec, field of view (FOV) = 220 mm, matrix
size = 256 9 256, slice thickness = 1.5 mm, MPRAGE
sagittal slices) was performed for each subject to exclude
brain abnormalities. A total of 155 EPI scans of the blood
oxygen level–dependent (BOLD) responses (TE = 35 msec,
TR 2 sec, FOV = 192 9 220 mm, flip angle = 70°, slice
thickness = 5.5 mm, no gap, 64 9 64 matrix, 25 axial
slices) and also in-plane T1-weighted anatomical data
(TE = 16 msec, TR = 2800 msec, FOV = 192 9 220 mm,
matrix size = 192 9 256, flip angle = 60°, slice thick-
ness = 5.5 mm, no gap, 25 axial slices) were collected for
each participant. In addition to this emoticon experiment,
two additional fMRI datasets were acquired from all sub-
jects. Therefore, each of the subjects invested about 1 h to
complete the entire MRI process.
Processing and analysis of fMRI data
Acquisition and preprocessing
All images were processed and analyzed using the FMRI
Expert Analysis Tool (FEAT) of FSL RRID:SCR_002823
(FMRIB’s Software Library, version 5.0 http://fsl.fmrib.
ox.ac.uk/fsl/fslwiki/FSL) (Smith et al. 2004; Woolrich
et al. 2009; Jenkinson et al. 2012). The first four scans
were discarded. The remaining 151 images were spatially
realigned using rigid-body transformation. Next, a brain
mask from the first volume in the fMRI data was created
for getting rid of signals outside each subject’s brain. To
reduce noise without reducing valid activation, spatial
smoothing was performed using 5 mm FWHM, and a
50-sec high-pass filter was applied. Pre-whitening,
removal of serial correlations, was performed to make the
statistics valid and maximally efficient. fMRI images were
registered to the T1-weighted structural image with trans-
lation (6 degrees of freedom), to the high-resolution
structural image with linear transformation (FLIRT) and
standard space images using FSL nonlinear registration
tool (FNIRT).
Statistical analyses for preprocessed fMRI data
After preprocessing, single and group-level fMRI analyses
were performed with FEAT in the FSL (Smith et al. 2004;
Woolrich et al. 2009; Jenkinson et al. 2012). The general
linear model (GLM) was used for linear combination of
the modeled response to six visual stimulations, happy,
sad, angry/fearful, scrambled positive, scrambled negative,
and null (Fig. 2). The GLM was constructed of stimuli
only showing the correct response for each subject. Errors
were separated and gathered as another condition which
was added as an independent variable into the above-
mentioned statistical model.
Head motion parameters were also included as con-
found variables in GLM. Activation maps for the con-
trasts, happy, sad, angry/fearful, scrambled positive,
scrambled negative, and null, were constructed separately
for each subject. A triple t-test was performed to compare
the activation among three emotional and two scrambled
emoticon conditions. The type of orientation of the
emoticons was added to the model as a covariate because
both vertically and horizontally oriented emoticons were
used in the experimental design. The resulting Z statistic
image in each subject was entered to mixed-effect analysis
to show which clusters of voxels were activated at a signifi-
cance level of P < 0.05 (FWE corrected). Activations were
identified at a spatial extent of at least 10 voxels.
In order to compute percent signal change, regions of
interest (ROIs) (the FFA and OFA) were defined as fol-
lows. First, we defined the group ROIs on functional
grounds as a 5-mm sphere centered on the mid-fusiform
gyrus and inferior occipital gyrus, which showed signifi-
cantly higher activation to emotional emoticons com-
pared to fixation cross. The STS was excluded because it
was not localized by the contrast of emotional emoticons
versus fixation. Second, we defined the individual ROIs
using the group ROIs as a mask. Then the mean percent
signal change data were extracted in the predefined ROIs:
right OFA, left OFA, right FFA, and left FFA. Unpaired
t-tests were used to compare contralateral ROIs of each
hemisphere.
Brain and Behavior, doi: 10.1002/brb3.500 (4 of 10) ª 2016 The Authors. Brain and Behavior published by Wiley Periodicals, Inc.
Emoticon Perception System K. W. Kim et al.
Results
Behavioral tests
Behavioral data were acquired from only 14 of the pro-
posed 18 subjects because of technical failure during the
fMRI scan. Accuracy of task performance inside the scan-
ner for emoticons was considered. A Pearson’s chi-square
test showed that there was a trend-level difference in error
rates among three emotional emoticons (v2 = 5.718,
P = 0.057). Post hoc analysis demonstrated that the
trend-level difference was caused by the lower error rate
of sad, compared to happy, emoticons (v2 = 5.673,
P = 0.017). In the fMRI analysis, trials showing error
response were excluded from their corresponding condi-
tions. A one-way ANOVA showed significantly slower
response times to the scrambled emoticon, compared to
the emotional emoticon showing only error-free responses
(F (4, 803) = 127.3, P < 0.001). The mean response time
was not different among the three emotional conditions.
Brain activity response to text-basedemoticons
Emotional versus scrambled emoticons
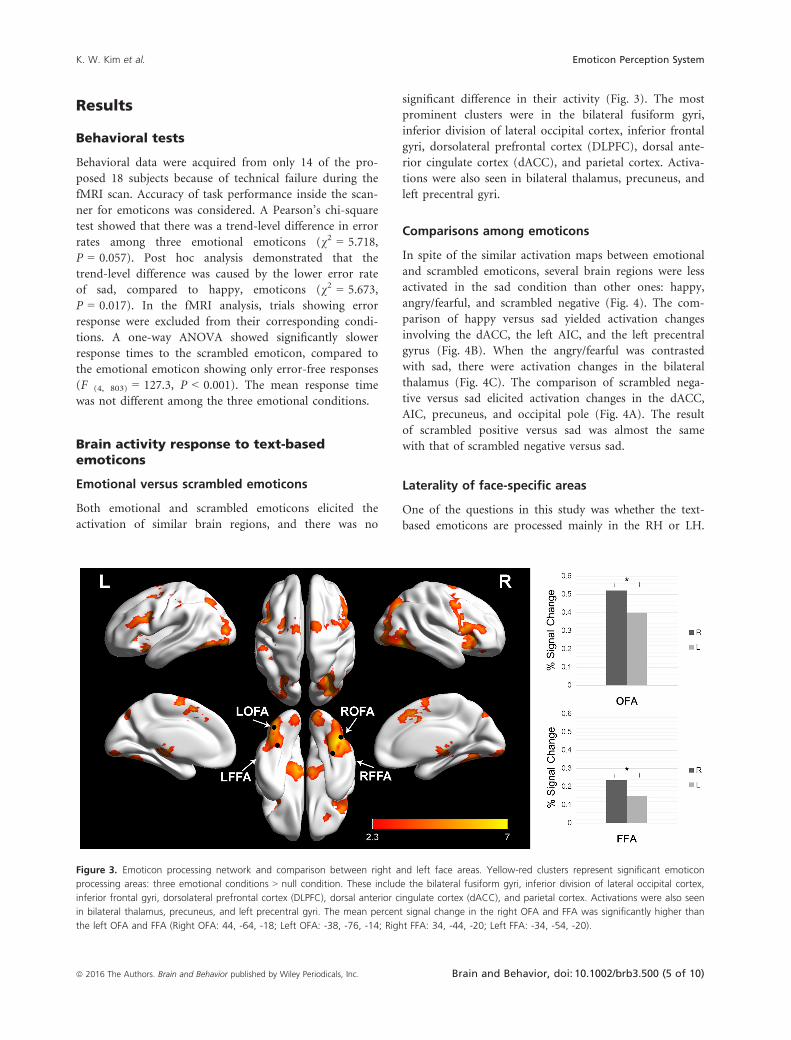
Both emotional and scrambled emoticons elicited the
activation of similar brain regions, and there was no
significant difference in their activity (Fig. 3). The most
prominent clusters were in the bilateral fusiform gyri,
inferior division of lateral occipital cortex, inferior frontal
gyri, dorsolateral prefrontal cortex (DLPFC), dorsal ante-
rior cingulate cortex (dACC), and parietal cortex. Activa-
tions were also seen in bilateral thalamus, precuneus, and
left precentral gyri.
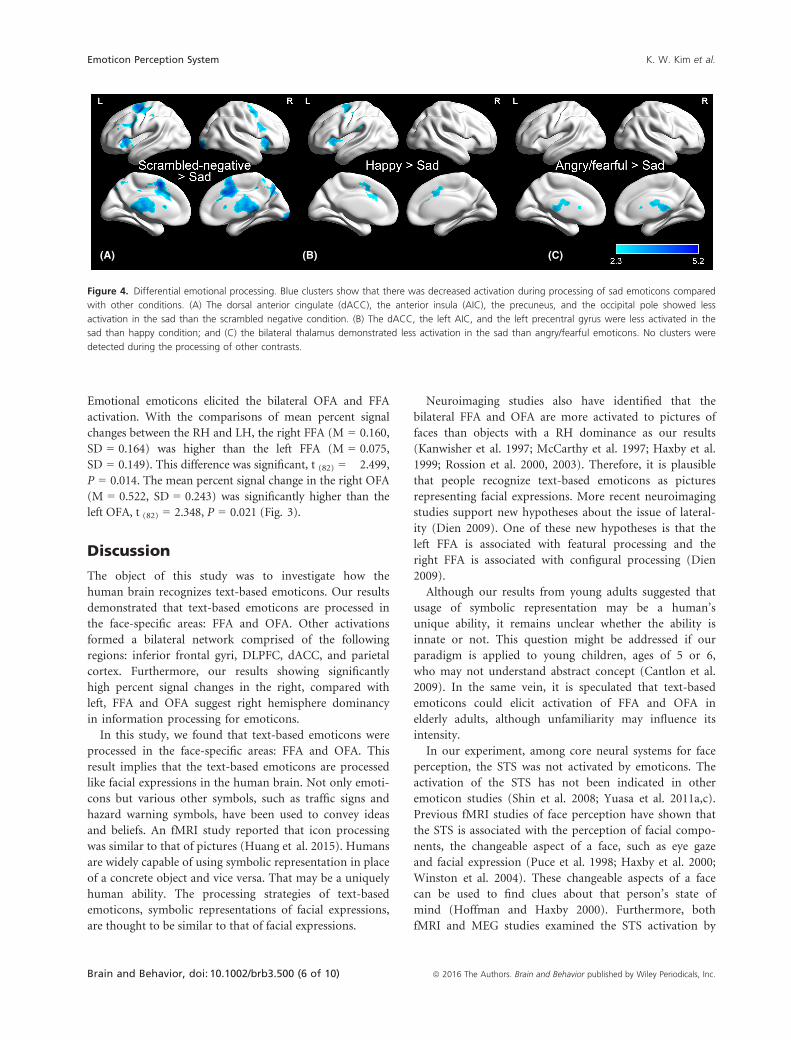
Comparisons among emoticons
In spite of the similar activation maps between emotional
and scrambled emoticons, several brain regions were less
activated in the sad condition than other ones: happy,
angry/fearful, and scrambled negative (Fig. 4). The com-
parison of happy versus sad yielded activation changes
involving the dACC, the left AIC, and the left precentral
gyrus (Fig. 4B). When the angry/fearful was contrasted
with sad, there were activation changes in the bilateral
thalamus (Fig. 4C). The comparison of scrambled nega-
tive versus sad elicited activation changes in the dACC,
AIC, precuneus, and occipital pole (Fig. 4A). The result
of scrambled positive versus sad was almost the same
with that of scrambled negative versus sad.
Laterality of face-specific areas
One of the questions in this study was whether the text-
based emoticons are processed mainly in the RH or LH.
Figure 3. Emoticon processing network and comparison between right and left face areas. Yellow-red clusters represent significant emoticon
processing areas: three emotional conditions > null condition. These include the bilateral fusiform gyri, inferior division of lateral occipital cortex,
inferior frontal gyri, dorsolateral prefrontal cortex (DLPFC), dorsal anterior cingulate cortex (dACC), and parietal cortex. Activations were also seen
in bilateral thalamus, precuneus, and left precentral gyri. The mean percent signal change in the right OFA and FFA was significantly higher than
the left OFA and FFA (Right OFA: 44, -64, -18; Left OFA: -38, -76, -14; Right FFA: 34, -44, -20; Left FFA: -34, -54, -20).
ª 2016 The Authors. Brain and Behavior published by Wiley Periodicals, Inc. Brain and Behavior, doi: 10.1002/brb3.500 (5 of 10)
K. W. Kim et al. Emoticon Perception System
Emotional emoticons elicited the bilateral OFA and FFA
activation. With the comparisons of mean percent signal
changes between the RH and LH, the right FFA (M = 0.160,
SD = 0.164) was higher than the left FFA (M = 0.075,
SD = 0.149). This difference was significant, t (82) = �2.499,
P = 0.014. The mean percent signal change in the right OFA
(M = 0.522, SD = 0.243) was significantly higher than the
left OFA, t (82) = 2.348, P = 0.021 (Fig. 3).
Discussion
The object of this study was to investigate how the
human brain recognizes text-based emoticons. Our results
demonstrated that text-based emoticons are processed in
the face-specific areas: FFA and OFA. Other activations
formed a bilateral network comprised of the following
regions: inferior frontal gyri, DLPFC, dACC, and parietal
cortex. Furthermore, our results showing significantly
high percent signal changes in the right, compared with
left, FFA and OFA suggest right hemisphere dominancy
in information processing for emoticons.
In this study, we found that text-based emoticons were
processed in the face-specific areas: FFA and OFA. This
result implies that the text-based emoticons are processed
like facial expressions in the human brain. Not only emoti-
cons but various other symbols, such as traffic signs and
hazard warning symbols, have been used to convey ideas
and beliefs. An fMRI study reported that icon processing
was similar to that of pictures (Huang et al. 2015). Humans
are widely capable of using symbolic representation in place
of a concrete object and vice versa. That may be a uniquely
human ability. The processing strategies of text-based
emoticons, symbolic representations of facial expressions,
are thought to be similar to that of facial expressions.
Neuroimaging studies also have identified that the
bilateral FFA and OFA are more activated to pictures of
faces than objects with a RH dominance as our results
(Kanwisher et al. 1997; McCarthy et al. 1997; Haxby et al.
1999; Rossion et al. 2000, 2003). Therefore, it is plausible
that people recognize text-based emoticons as pictures
representing facial expressions. More recent neuroimaging
studies support new hypotheses about the issue of lateral-
ity (Dien 2009). One of these new hypotheses is that the
left FFA is associated with featural processing and the
right FFA is associated with configural processing (Dien
2009).
Although our results from young adults suggested that
usage of symbolic representation may be a human’s
unique ability, it remains unclear whether the ability is
innate or not. This question might be addressed if our
paradigm is applied to young children, ages of 5 or 6,
who may not understand abstract concept (Cantlon et al.
2009). In the same vein, it is speculated that text-based
emoticons could elicit activation of FFA and OFA in
elderly adults, although unfamiliarity may influence its
intensity.
In our experiment, among core neural systems for face
perception, the STS was not activated by emoticons. The
activation of the STS has not been indicated in other
emoticon studies (Shin et al. 2008; Yuasa et al. 2011a,c).
Previous fMRI studies of face perception have shown that
the STS is associated with the perception of facial compo-
nents, the changeable aspect of a face, such as eye gaze
and facial expression (Puce et al. 1998; Haxby et al. 2000;
Winston et al. 2004). These changeable aspects of a face
can be used to find clues about that person’s state of
mind (Hoffman and Haxby 2000). Furthermore, both
fMRI and MEG studies examined the STS activation by
(A) (B) (C)
Figure 4. Differential emotional processing. Blue clusters show that there was decreased activation during processing of sad emoticons compared
with other conditions. (A) The dorsal anterior cingulate (dACC), the anterior insula (AIC), the precuneus, and the occipital pole showed less
activation in the sad than the scrambled negative condition. (B) The dACC, the left AIC, and the left precentral gyrus were less activated in the
sad than happy condition; and (C) the bilateral thalamus demonstrated less activation in the sad than angry/fearful emoticons. No clusters were
detected during the processing of other contrasts.
Brain and Behavior, doi: 10.1002/brb3.500 (6 of 10) ª 2016 The Authors. Brain and Behavior published by Wiley Periodicals, Inc.
Emoticon Perception System K. W. Kim et al.
turning heads compared to static faces (Lee et al. 2010).
In addition, neurons responsive to facial expression were
found in the STS of monkeys (Hasselmo et al. 1989).
From that, we can infer that emoticons are too static and
symbolic to activate the STS.
We ascertained that emotional and scrambled emoti-
cons produced similar activation maps, although scram-
bled emoticons disrupted their configural processing.
There are two important elements to explain these results.
First, our scrambled emoticons contain featural informa-
tion, whereas scrambled faces in previous studies (Jehna
et al. 2011) do not contain discernible facial features.
Scrambled emoticons were obtained by cutting out punc-
tuation marks and by relocating these in non-natural
positions. Second, subjects were asked to respond by
pressing a button indicating whether the emoticon repre-
sented a positive or negative emotion. Scrambled emoti-
cons were arbitrarily determined to be either a positive or
negative emotion because there was no button indicating
neutral. For this reason, face-specific areas might be acti-
vated while subjects tried to find emotional meaning. In
the case of face studies, it was revealed that mental ima-
gery of faces activated the FFA (O’Craven and Kanwisher
2000; Ishai et al. 2002).
Interestingly, there was no increased activation in the
amygdala. This finding does not agree with other studies
using emotional stimuli. It has been documented that the
amygdala plays an important role in processing emotional
stimuli from sources such as faces, scenes, words, and
body expressions (Hadjikhani and de Gelder 2003; Mad-
dock et al. 2003; Fusar-Poli et al. 2009; Sabatinelli et al.
2011; Wallentin et al. 2011; Lindenberg et al. 2012). The
amygdala with its connections to the affective division of
the anterior cingulate cortex (ACC) is a central area for
emotion perception (Devinsky et al. 1995; Whalen et al.
1998; Bush et al. 2000). In this study, the affective divi-
sion of the ACC, which is associated with assessing emo-
tional response (Phan et al. 2003), was not activated
either. In contrast, recognition of emoticons elicited acti-
vations in the cognitive division of the ACC. This cogni-
tive division of the ACC has a reciprocal interconnection
with the DLPFC, which is responsible for executive func-
tions (Bush et al. 2000). Our study implies that emotional
processing of text-based emoticons is less associated with
the limbic system (Appendix S1). Further studies are,
however, needed to explore the contribution of the emo-
tional route to processing emoticons, as our experimental
stimuli could not be salient enough to activate the limbic
system.
Although emotional and scrambled emoticons evoked
similar activation, sad emoticons elicited significantly
decreased or underactivation in the dorsal anterior cingu-
late (dACC), the anterior insula (AIC), the precuneus,
and the thalamus. This reduced activation during process-
ing of sad emoticons can be explained as follows. Our
behavior data show that sad had the lowest error rate,
compared to other stimuli. Although trials showing error
response were excluded from our fMRI analysis, sad
responses would have been easier to recognize than other
emotions. It is well known that the dorsal anterior cingu-
late (dACC) and the anterior insula (AIC) are involved in
attention allocation to demanding stimuli (Menon and
Uddin 2010; White et al. 2014). Consequently, it is rea-
sonable to infer that the sad condition was more easily
recognized, and so required less utilization of brain
resources than other stimuli. Similarly, but not identically,
sad faces have elicited limited activation in the amygdala
relative to other emotional faces (Phillips et al. 1998; Kes-
ler et al. 2001; Killgore and Yurgelun-Todd 2004; Fusar-
Poli et al. 2009). In the case of both faces and emoticons,
it is consistent that the sad condition evokes less brain
activation than other emotions. In addition, this observa-
tion is consistent with the previous study mentioned
above, where icons were associated more with the neocor-
tex, whereas real faces are more related to the limbic sys-
tem (Shin et al. 2008). On the other hand, activation of
the thalamus angry/fearful versus sad condition may be
related to differences in perceptual load, using selective
attention (Kastner et al. 2004; Saalmann and Kastner
2011).
As mentioned in the above section, sad emoticons had
the lower error rate than happy emoticons. It is unusual
that happy faces have more errors in rating than negative
faces. In our perspective, the reason why happy emoticons
have more errors than negative emoticons is that happy
condition had significantly more horizontal (western,
lean) emoticons than negative ones. Although subjects
could interpret both vertical (oriental, erect) and horizon-
tal (western, lean) type of emoticons, they might be more
familiar with vertical (oriental, erect) emoticons because
subjects were all Asian. Accordingly, we used emoticon
directions as a covariate while analyzing event-related
fMRI data.
There are some limitations to this study. Each of the
emotional emoticons had both a vertical (oriental, erect)
and a horizontal (western, lean) orientation. Subjects were
familiar with both types and we used emoticon types as a
covariate while analyzing event-related fMRI data to avoid
the disturbance factor. Nonetheless, this design may exert
a complex influence on experimental results. Another lim-
itation is that the fMRI paradigm did not have neutral
emoticons. It should have additionally included neutral
emoticons, as well as a neutral option for the behavioral
rating of the emoticons. A third limitation is the subject’s
personal experience with using emoticons was not evalu-
ated. The other limitation is that emoticons and faces
ª 2016 The Authors. Brain and Behavior published by Wiley Periodicals, Inc. Brain and Behavior, doi: 10.1002/brb3.500 (7 of 10)
K. W. Kim et al. Emoticon Perception System
were not directly compared in our study. To determine
whether emoticons are interpreted as facial expressions,
the best possible contrast would have been against real
faces. However, the contrasts in this study were emotional
emoticons versus scrambled emoticons. In addition, fixa-
tion cross-mark may be less appropriate as a baseline for
analysis at later stages of the visual streams which tap
high-level cognitive functions such as emoticon percep-
tion (Penny et al. 2007; Liu 2012). An emoticon versus
face one-to-one comparison could help to explain emo-
tional information processing in the human brain.
Conclusion
In spite of these limitations, our study revealed that the
face-specific mechanism is involved in text-based emoti-
con processing. Additionally, emoticons are processed
mainly in cortical rather than limbic regions. Sad emoti-
cons elicited significantly decreased activation or underac-
tivation. Recognizing the meaning of stimuli is a
fundamental cognitive process of the human brain. How-
ever, the question of how the human brain conceives
meaning is not fully understood. Human brains have the
unique ability to create contextual meanings during inter-
actions with information perceived in a given situation.
Further experiments could help advance research on this
extraordinary human ability.
Acknowledgments
This work was supported by National Research
Foundation under Grant [NRF-2006-2005372]; BK21
plus, the KAIST Future Systems Healthcare Project, and
KI for Health Science and Technology Project Grant
[N11160068, N11160074].
Conflict of Interest
The authors have no conflicts of interest or financial
interests, avoiding identifying any of the authors prior to
peer review.
References
Bush, G., P. Luu, and M. I. Posner. 2000. Cognitive and
emotional influences in anterior cingulate cortex. Trends
Cogn. Sci. 4:215–222.
Cantlon, J. F., M. E. Libertus, P. Pinel, S. Dehaene,
E. M. Brannon, and K. A. Pelphrey. 2009. The neural
development of an abstract concept of number. J. Cogn.
Neurosci. 21:2217–2229.
Churches, O., M. Nicholls, M. Thiessen, M. Kohler, and
H. Keage. 2014. Emoticons in mind: an event-related
potential study. Soc. Neurosci. 9:196–202.
Derks, D., A. E. R. Bos, and J. von Grumbkow. 2007. Emoticons
and social interaction on the Internet: the importance of
social context. Comput. Hum. Behav. 23:842–849.Derks, D., H. F. Agneta, and A. E. R. Bos. 2008a. The role of
emotion in computer-mediated communication: a review.
Comput. Hum. Behav. 24:766–785.Derks, D., A. E. R. Bos, and J. von Grumbkow. 2008b.
Emoticons and online message interpretation. Soc. Sci.
Comput. Rev. 26:379–388.
Derks, D., A. E. R. Bos, and J. Von Grumbkow. 2008c.
Emoticons in computer-mediated communication: social
motives and social context. Cyberpsychol. Behav. 11:99–101.Devinsky, O., M. J. Morrell, and B. A. Vogt. 1995.
Contributions of anterior cingulate cortex to behaviour.
Brain 118:279–306.
Dien, J. 2009. A tale of two recognition systems: implications
of the fusiform face area and the visual word form area for
lateralized object recognition models. Neuropsychologia
47:1–16.
Duncan, K. J., C. Pattamadilok, I. Knierim, and J. T. Devlin.
2009. Consistency and variability in functional localisers.
NeuroImage. 46:1018–1026.
Fusar-Poli, P., A. Placentino, F. Carletti, P. Landi, P. Allen,
S. Surguladze, et al. 2009. Functional atlas of emotional
faces processing: a voxel-based meta-analysis of 105
functional magnetic resonance imaging studies. J. Psychiatry
Neurosci. 34:418–432.
Gauthier, I., M. J. Tarr, J. Moylan, P. Skudlarski, J. C. Gore,
and A. W. Anderson. 2000. The fusiform “face area” is part
of a network that processes faces at the individual level. J.
Cogn. Neurosci. 12:495–504.
Hadjikhani, N., and B. de Gelder. 2003. Seeing fearful body
expressions activates the fusiform cortex and amygdala.
Curr. Biol. 13:2201–2205.Hasselmo, M. E., E. T. Rolls, and G. C. Baylis. 1989. The role
of expression and identity in the face-selective responses of
neurons in the temporal visual-cortex of the monkey.
Behav. Brain Res. 32:203–218.Haxby, J. V., B. Horwitz, L. G. Ungerleider, J. M. Maisog,
P. Pietrini, and C. L. Grady. 1994. The functional-
organization of human extrastriate cortex – a pet-rcbf study
of selective attention to faces and locations. J. Neurosci.
14:6336–6353.Haxby, J. V., L. G. Ungerleider, V. P. Clark, J. L. Schouten,
E. A. Hoffman, and A. Martin. 1999. The effect of face
inversion on activity in human neural systems for face and
object perception. Neuron 22:189–199.Haxby, J. V., E. A. Hoffman, and M. I. Gobbini. 2000. The
distributed human neural system for face perception. Trends
Cogn. Sci. 4:223–233.
Hoffman, E. A., and J. V. Haxby. 2000. Distinct
representations of eye gaze and identity in the distributed
human neural system for face perception. Nat. Neurosci.
3:80–84.
Brain and Behavior, doi: 10.1002/brb3.500 (8 of 10) ª 2016 The Authors. Brain and Behavior published by Wiley Periodicals, Inc.
Emoticon Perception System K. W. Kim et al.
Huang, S. C., R. G. Bias, and D. Schnyer. 2015. How are icons
processed by the brain? Neuroimaging measures of four
types of visual stimuli used in information systems. J. Assoc.
Inf. Sci. Technol. 66:702–720.
Ishai, A., J. V. Haxby, and L. G. Ungerleider. 2002. Visual
imagery of famous faces: effects of memory and attention
revealed by fMRI. NeuroImage 17:1729–1741.
Jehna, M., C. Neuper, A. Ischebeck, M. Loitfelder, S. Ropele,
C. Langkammer, et al. 2011. The functional correlates of
face perception and recognition of emotional facial
expressions as evidenced by fMRI. Brain Res. 1393:73–83.
Jenkinson, M., C. F. Beckmann, T. E. Behrens, M. W.
Woolrich, and S. M. Smith. 2012. Fsl. NeuroImage 62:782–
790.
Kanwisher, N., J. McDermott, and M. M. Chun. 1997. The
fusiform face area: a module in human extrastriate cortex
specialized for face perception. J. Neurosci. 17:4302–4311.
Kastner, S., D. H. O’Connor, M. M. Fukui, H. M. Fehd,
U. Herwig, and M. A. Pinsk. 2004. Functional imaging of
the human lateral geniculate nucleus and pulvinar. J.
Neurophysiol. 91:438–448.
Kesler, M. L., A. H. Andersen, C. D. Smith, M. J. Avison,
C. E. Davis, R. J. Kryscio, et al. 2001. Neural substrates of
facial emotion processing using fMRI. Cogn. Brain Res.
11:213–226.
Killgore, W. D. S., and D. A. Yurgelun-Todd. 2004. Activation
of the amygdala and interior cingulate during nonconscious
processing of sad versus happy faces. NeuroImage 21:1215–1223.
Large, M. E., C. Cavina-Pratesi, T. Vilis, and J. C. Culharn.
2008. The neural correlates of change detection in the face
perception network. Neuropsychologia 46:2169–2176.Lee, L. C., T. J. Andrews, S. J. Johnson, W. Woods, A. Gouws,
G. G. R. Green, et al. 2010. Neural responses to rigidly
moving faces displaying shifts in social attention investigated
with fMRI and MEG. Neuropsychologia 48:477–490.Lindenberg, R., M. Uhlig, D. Scherfeld, G. Schlaug, and
R. J. Seitz. 2012. Communication with emblematic gestures:
shared and distinct neural correlates of expression and
reception. Hum. Brain Mapp. 33:812–823.
Liu, T. T. 2012. The development of event-related fMRI
designs. NeuroImage 62:1157–1162.
Liu, J., A. Harris, and N. Kanwisher. 2002. Stages of processing
in face perception: an MEG study. Nat. Neurosci. 5:910–916.
Liu, J., A. Harris, and N. Kanwisher. 2010. Perception of face
parts and face configurations: an fMRI study. J. Cogn.
Neurosci. 22:203–211.Maddock, R. J., A. S. Garrett, and M. H. Buonocore. 2003.
Posterior cingulate cortex activation by emotional words:
fMRI evidence from a valence decision task. Hum. Brain
Mapp. 18:30–41.McCarthy, G., A. Puce, J. C. Gore, and T. Allison. 1997. Face-
specific processing in the human fusiform gyrus. J. Cogn.
Neurosci. 9:605–610.
Menon, V., and L. Q. Uddin. 2010. Saliency, switching,
attention and control: a network model of insula function.
Brain Struct. Funct. 214:655–667.Nakajima, K., T. Minami, H. C. Tanabe, N. Sadato, and
S. Nakauchi. 2014. Facial color processing in the face-
selective regions: an fMRI study. Hum. Brain Mapp.
35:4958–4964.
Nakamura, K., R. Kawashima, K. Ito, M. Sugiura, T. Kato,
A. Nakamura, et al. 1999. Activation of the right inferior
frontal cortex during assessment of facial emotion. J.
Neurophysiol. 82:1610–1614.
Nichols, D. F., L. R. Betts, and H. R. Wilson. 2010. Decoding
of faces and face components in face-sensitive human visual
cortex. Front. Psychol. 1:28.
O’Craven, K. M., and N. Kanwisher. 2000. Mental imagery of
faces and places activates corresponding stimulus-specific
brain regions. J. Cogn. Neurosci. 12:1013–1023.
Penny, W. D., K. J. Friston, J. T. Ashburner, S. J. Kiebel, and
T. E. Nichols. 2007. Statistical parametric mapping: the
analysis of functional brain images. Academic Press,
London.
Phan, K. L., T. Wager, S. F. Taylor, and I. Liberzon. 2002.
Functional neuroanatomy of emotion: a meta-analysis of
emotion activation studies in PET and fMRI. NeuroImage
16:331–348.
Phan, K. L., I. Liberzon, R. C. Welsh, J. C. Britton, and
S. F. Taylor. 2003. Habituation of rostral anterior cingulate
cortex to repeated emotionally salient pictures.
Neuropsychopharmacology 28:1344–1350.
Phillips, M. L., E. T. Bullmore, R. Howard, P. W. R.
Woodruff, I. C. Wright, S. C. R. Williams, et al. 1998.
Investigation of facial recognition memory and happy and
sad facial expression perception: an fMRI study. Psychiatry
Res. 83:127–138.Pitcher, D., L. Charles, J. T. Devlin, V. Walsh, and
B. Duchaine. 2009. Triple dissociation of faces, bodies, and
objects in extrastriate cortex. Curr. Biol. 19:319–324.
Pitcher, D., V. Walsh, and B. Duchaine. 2011. The role of the
occipital face area in the cortical face perception network.
Exp. Brain Res. 209:481–493.
Puce, A., T. Allison, M. Asgari, J. C. Gore, and G. McCarthy.
1996. Differential sensitivity of human visual cortex to faces,
letterstrings, and textures: a functional magnetic resonance
imaging study. J. Neurosci. 16:5205–5215.
Puce, A., T. Allison, S. Bentin, J. C. Gore, and G. McCarthy.
1998. Temporal cortex activation in humans viewing eye
and mouth movements. J. Neurosci. 18:2188–2199.Rossion, B., L. Dricot, A. Devolder, J. M. Bodart,
M. Crommelinck, B. de Gelder, et al. 2000. Hemispheric
asymmetries for whole-based and part-based face processing
in the human fusiform gyrus. J. Cogn. Neurosci. 12:793–802.Rossion, B., R. Caldara, M. Seghier, A. M. Schuller,
F. Lazeyras, and E. Mayer. 2003. A network of occipito-
temporal face-sensitive areas besides the right middle
ª 2016 The Authors. Brain and Behavior published by Wiley Periodicals, Inc. Brain and Behavior, doi: 10.1002/brb3.500 (9 of 10)
K. W. Kim et al. Emoticon Perception System
fusiform gyrus is necessary for normal face processing. Brain
126:2381–2395.
Saalmann, Y. B., and S. Kastner. 2011. Cognitive and perceptual
functions of the visual thalamus. Neuron 71:209–223.
Sabatinelli, D., E. E. Fortune, Q. Li, A. Siddiqui, C. Krafft,
W. T. Oliver, et al. 2011. Emotional perception: meta-
analyses of face and natural scene processing. NeuroImage
54:2524–2533.Schiltz, C., and B. Rossion. 2006. Faces are represented
holistically in the human occipito-temporal cortex.
NeuroImage 32:1385–1394.
Shin, Y. W., J. S. Kwon, K. W. Kwon, B. M. Gu, I. C. Song,
D. G. Na, et al. 2008. Objects and their icons in the brain:
the neural correlates of visual concept formation. Neurosci.
Lett. 436:300–304.
Smith, S. M., M. Jenkinson, M. W. Woolrich, C. F. Beckmann,
T. E. Behrens, H. Johansen-Berg, et al. 2004. Advances in
functional and structural MR image analysis and
implementation as FSL. NeuroImage 23(Suppl 1):
S208–S219.Wallentin, M., A. H. Nielsen, P. Vuust, A. Dohn,
A. Roepstorff, and T. E. Lund. 2011. Amygdala and heart
rate variability responses from listening to emotionally
intense parts of a story. NeuroImage 58:963–973.Whalen, P. J., G. Bush, R. J. McNally, S. Wilhelm,
S. C. McInerney, M. A. Jenike, et al. 1998. The emotional
counting Stroop paradigm: a functional magnetic resonance
imaging probe of the anterior cingulate affective division.
Biol. Psychiatry 44:1219–1228.
White, T. P., N. H. Engen, S. Sorensen, M. Overgaard, and
S. S. Shergill. 2014. Uncertainty and confidence from the
triple-network perspective: voxel-based meta-analyses. Brain
Cogn. 85:191–200.
Winston, J. S., R. N. A. Henson, M. R. Fine-Goulden, and R.
J. Dolan. 2004. fMRI-adaptation reveals dissociable neural
representations of identity and expression in face
perception. J. Neurophysiol. 92:1830–1839.Woolrich, M. W., S. Jbabdi, B. Patenaude, M. Chappell,
S. Makni, T. Behrens, et al. 2009. Bayesian analysis of
neuroimaging data in FSL. NeuroImage 45:S173–S186.
Yuasa, M., K. Saito, and N. Mukawa. 2011a. Brain activity
associated with graphic emoticons. The effect of abstract
faces in communication over a computer network. Electr.
Eng. Jpn. 177:36–45.
Yuasa, M., K. Saito, and N. Mukawa. 2011b. Brain activity when
reading sentences and emoticons: an fMRI study of verbal and
nonverbal communication. Electron. Commun. Jpn. 94:17–24.Yuasa, M., K. Saito, and N. Mukawa. 2011c. Brain activity
while reading sentences with kanji characters expressing
emotions: an fMRI study on kanji characters expressing
“laughter” and “tears”. Electron. Commun. Jpn. 94:1–8.
Supporting Information
Additional supporting information may be found online
in the supporting information tab for this article:
Appendix S1. Supplemental results.
Emoticon Perception System K. W. Kim et al.
Brain and Behavior, doi: 10.1002/brb3.500 (10 of 10) ª 2016 The Authors. Brain and Behavior published by Wiley Periodicals, Inc.