Networks and Misallocation: - Insurance, Migration, and the Rural ...
57
Networks and Mis-allocation: Insurance, Migration, and the Rural-Urban Wage Gap Kaivan Munshi University of Cambridge Mark R. Rosenzweig Yale University
Transcript of Networks and Misallocation: - Insurance, Migration, and the Rural ...
Networks and Mis-allocation:Insurance, Migration, and the Rural-Urban Wage Gap
Kaivan Munshi
University of Cambridge
Mark R. Rosenzweig
Yale University

Removing obstacles to resource mis-allocation can be very productive
Requires identifying the source of the mis-allocation - “bottleneck”
In India, observe large and persistent real wage gap between rural andurban areas and across villages in rural areas (not due to selection)
Larger rural-urban wage gap than most other countries of the world.
Also, among the lowest rural-urban and rural-rural male migrationrates in the world.
[High migration rates for women, but for marriage.]
What is the cause? A cause unique to India.
What is the remedy to the mis-allocation?
How do we know what it is, and whether it will work?
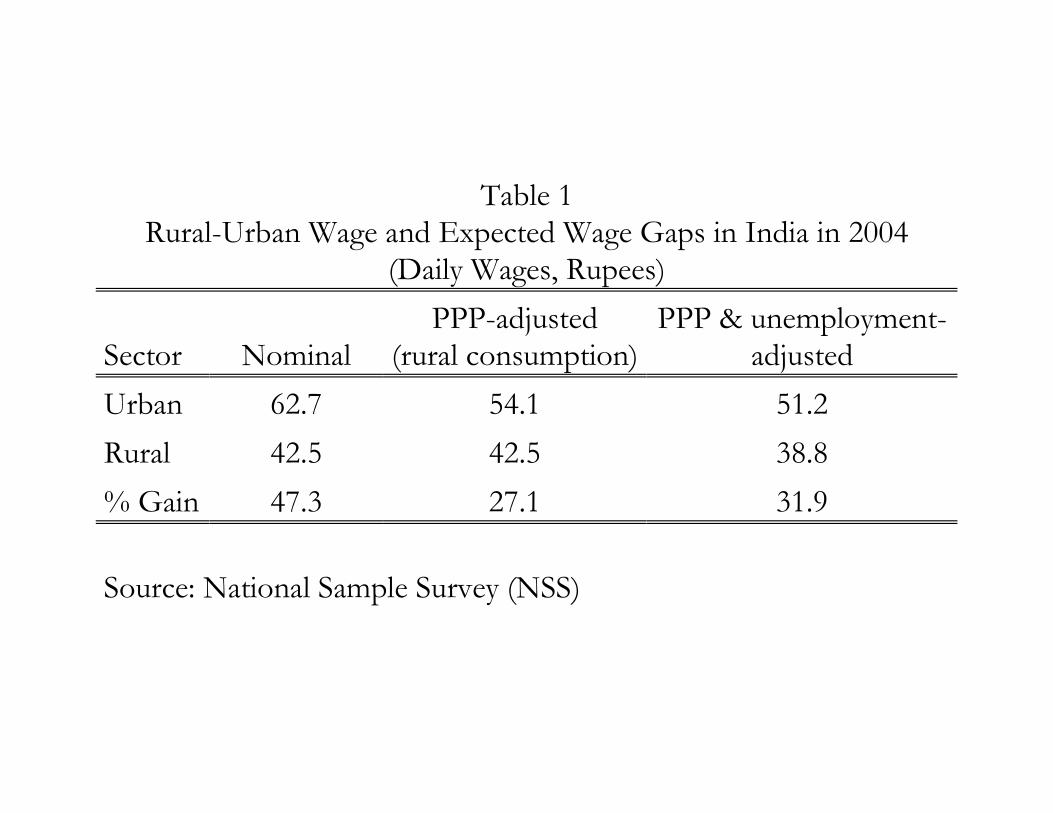
Table 1Rural-Urban Wage and Expected Wage Gaps in India in 2004
(Daily Wages, Rupees)
Sector NominalPPP-adjusted
(rural consumption)PPP & unemployment-
adjusted
Urban 62.7 54.1 51.2
Rural 42.5 42.5 38.8
% Gain 47.3 27.1 31.9
Source: National Sample Survey (NSS)

IntroductionThe Model
Empirical AnalysisConclusion
Figure 1: Rural-Urban Wage Gap, by Country
Source: 2006 Chinese mini-census, 2007 IFLS, 2004 NSS
Kaivan Munshi, Mark Rosenzweig Networks and Misallocation 5/ 55
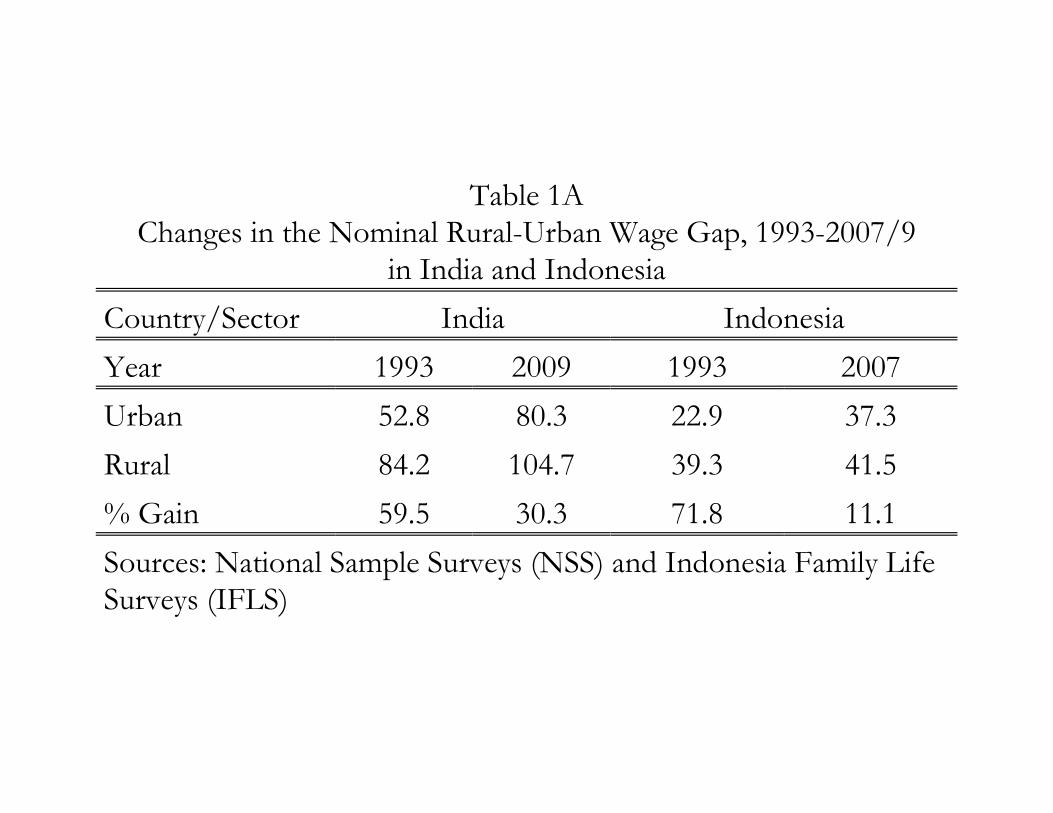
Table 1AChanges in the Nominal Rural-Urban Wage Gap, 1993-2007/9
in India and Indonesia
Country/Sector India Indonesia
Year 1993 2009 1993 2007
Urban 52.8 80.3 22.9 37.3
Rural 84.2 104.7 39.3 41.5
% Gain 59.5 30.3 71.8 11.1
Sources: National Sample Surveys (NSS) and Indonesia Family LifeSurveys (IFLS)

IntroductionThe Model
Empirical AnalysisConclusion
Figure 2: Real Rural and Urban Wages in India
Source: 1983-2009 NSS
Kaivan Munshi, Mark Rosenzweig Networks and Misallocation 6/ 55

IntroductionThe Model
Empirical AnalysisConclusion
Figure 3: Change in Rural-Urban Migration Rates in India,1961- 2001
Source: 1961-2001 Indian Population CensusKaivan Munshi, Mark Rosenzweig Networks and Misallocation 7/ 55
IntroductionThe Model
Empirical AnalysisConclusion
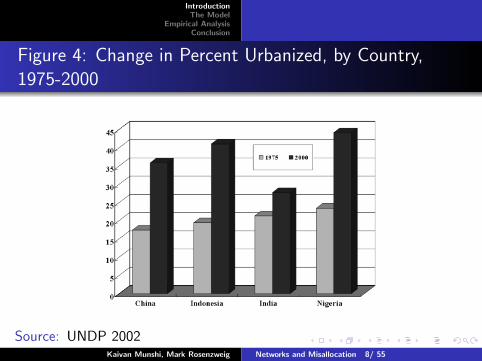
Figure 4: Change in Percent Urbanized, by Country,1975-2000
Source: UNDP 2002Kaivan Munshi, Mark Rosenzweig Networks and Misallocation 8/ 55
IntroductionThe Model
Empirical AnalysisConclusion
An Explanation for Low Mobility
Why have rural Indian workers not taken advantage of the eco-nomic opportunities associated with spatial wage differentials?
Combination of well-functioning rural insurance networks andthe absence of formal insurance (Banerjee and Newman 1998)
Kaivan Munshi, Mark Rosenzweig Networks and Misallocation 9/ 55

IntroductionThe Model
Empirical AnalysisConclusion
An Explanation for Low Mobility
In rural India, insurance networks are organized along caste lines
Commitment and information problems are greater for house-holds with male migrants
If the resulting loss in network insurance is sufficiently large,and alternative sources of insurance are unavailable, then largewage gaps could persist without generating a flow of workersto higher wage areas
Kaivan Munshi, Mark Rosenzweig Networks and Misallocation 10/ 55

IntroductionThe Model
Empirical AnalysisConclusion
Strategies to Increase Mobility
Move as a group (Munshi and Rosenzweig 2006, Munshi2011)
Only available to members of select castes
Temporary/seasonal migration (Morten 2012)
Cannot be used for permanent jobs
Kaivan Munshi, Mark Rosenzweig Networks and Misallocation 11/ 55

Distribution and Clustering of Castes (2006 REDS Census)
Mean number of castes per state: 66
Mean number of castes per village: 12
Mean number of hh’s per village: 326
Mean number of hh’s per caste in a village: 27
Also observe within-village spatial clustering of castes(Based on street-level location information)

IntroductionThe Model
Empirical AnalysisConclusion
Table 2: Participation in the Caste-Based InsuranceArrangement
Survey year: 1982 1999(1) (2)
Households participating (%) 25.44 19.62Percent of income sent 5.28 8.74Percent of income received 19.06 40.26Number of observations 4981 7405
Source: Rural Economic Development Survey (REDS) 1982 and 1999
Kaivan Munshi, Mark Rosenzweig Networks and Misallocation 13/ 55

IntroductionThe Model
Empirical AnalysisConclusion
Table 3: Percent of Loans by Purpose and Source
Data source: 1982 REDSPurpose: investment operating contingencies consumption all
expenses expenses(1) (2) (3) (4) (5)
Sources:Bank 64.11 80.80 27.58 25.12 64.61Caste 16.97 6.07 42.65 23.12 13.87Friends 2.11 11.29 2.31 4.33 7.84Employer 5.08 0.49 21.15 15.22 5.62Moneylender 11.64 1.27 5.05 31.85 7.85Other 0.02 0.07 1.27 0.37 0.22Total 100.00 100.00 100.00 100.00 100.00
Kaivan Munshi, Mark Rosenzweig Networks and Misallocation 14/ 55
mr534
Highlight

IntroductionThe Model
Empirical AnalysisConclusion
Table 4: Percent of Loans by Type and Source
Data source: 1982 REDS 2005 IHDSLoan type: without without without without
interest collateral collateral interestor interest
(1) (2) (3) (4)
Sources:Bank 0.57 23.43 0.38 0.00Caste 28.99 60.27 20.38 44.62Friends 9.35 91.72 3.89 21.5Employer 0.44 65.69 0.44 10.75Moneylender 0.00 98.71 0.00 0.27
Kaivan Munshi, Mark Rosenzweig Networks and Misallocation 16/ 55
mr534
Highlight

IntroductionThe Model
Empirical AnalysisConclusion
Figure 5: Change in Out-Marriage Percent in Rural India,1950- 1999
Source: 1999 REDSKaivan Munshi, Mark Rosenzweig Networks and Misallocation 17/ 55

5
10
15
20
25
30
35
40
45
1970
1972
1974
1976
1978
1980
1982
1984
1986
1988
1990
1992
1994
1996
1998
2000
2002
2004
Figure 5A. Real Daily Agricultural Wages in India, 1970-2004 (Source: Bhalla and Das, 2006)

IntroductionThe Model
Empirical AnalysisConclusion
Testing our Explanation
The simplest test of the hypothesis that the potential loss innetwork services restricts mobility in India would be to comparemigration-rates in populations with and without caste-basedinsurance
This exercise is infeasible, given the pervasiveness of caste net-works
What we do is to look within the caste and theoretically iden-tify which households benefit less (more) from caste-based in-surance
We then proceed to test whether those households are more(less) likely to have migrant members
Kaivan Munshi, Mark Rosenzweig Networks and Misallocation 18/ 55

IntroductionThe Model
Empirical AnalysisConclusion
The Model
The literature on mutual insurance is concerned with ex postrisk-sharing, taking the size of the network and the incomesharing rule as given
To derive the connection between networks and permanentmigration, it is necessary to derive ex ante participation andthe sharing rule (which determines which households choose tostay)
Kaivan Munshi, Mark Rosenzweig Networks and Misallocation 19/ 55

IntroductionThe Model
Empirical AnalysisConclusion
Income, Preferences, and Risk-SharingThe Participation DecisionEquilibrium ParticipationParticipation and Income-Sharing with Inequality
Income
The decision-making unit is the household, which consists ofmultiple earners
Each household derives income from its local activities
Income varies independently across households in the commu-nity and over time
In addition, one or more members of the household receive ajob opportunity in the city
The key decision is whether or not to send them to the city
Kaivan Munshi, Mark Rosenzweig Networks and Misallocation 20/ 55
IntroductionThe Model
Empirical AnalysisConclusion
Income, Preferences, and Risk-SharingThe Participation DecisionEquilibrium ParticipationParticipation and Income-Sharing with Inequality
Preferences
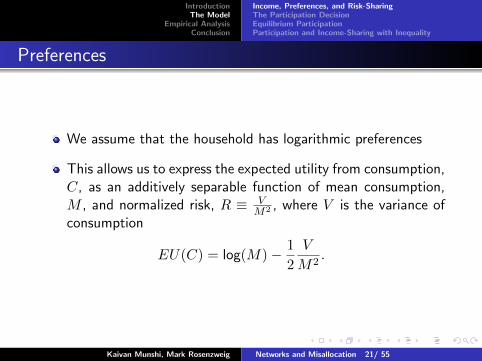
We assume that the household has logarithmic preferences
This allows us to express the expected utility from consumption,C, as an additively separable function of mean consumption,M , and normalized risk, R ≡ V
M2 , where V is the variance ofconsumption
EU(C) = log(M)− 1
2
V
M2.
Kaivan Munshi, Mark Rosenzweig Networks and Misallocation 21/ 55
IntroductionThe Model
Empirical AnalysisConclusion
Income, Preferences, and Risk-SharingThe Participation DecisionEquilibrium ParticipationParticipation and Income-Sharing with Inequality
Risk-Sharing
Rural incomes vary over time and so risk-averse householdsbenefit from a community-based insurance network to smooththeir consumption
Because our interest is in the ex ante decision to participatein the rural insurance network, we assume that complete risk-sharing can be maintained ex post
Consistent with high levels of risk-sharing documented in Indiaand other developing countries (Townsend 1994, Grimard 1997,Ligon 1998, Fafchamps and Lund 2003, Mazzocco and Saini2012, Angelucci, de Giorgi, and Rasul)
Kaivan Munshi, Mark Rosenzweig Networks and Misallocation 22/ 55
IntroductionThe Model
Empirical AnalysisConclusion
Income, Preferences, and Risk-SharingThe Participation DecisionEquilibrium ParticipationParticipation and Income-Sharing with Inequality
Risk-Sharing
Ex post commitment is supported by social sanctions
These sanctions are less effective when someone from the house-hold has migrated to the city
With full risk-sharing, each household is either in the networkor out of the network
We assume that households with migrants cannot commit toreciprocating at the level needed for full risk-sharing and so willbe excluded from the network
If the migrant’s income cannot be observed by the rural commu-nity, his household has an incentive to over-report this incomeex ante and under-report this income ex post
This information problem is another reason why households withmigrants will be excluded from the network
Kaivan Munshi, Mark Rosenzweig Networks and Misallocation 23/ 55

IntroductionThe Model
Empirical AnalysisConclusion
Income, Preferences, and Risk-SharingThe Participation DecisionEquilibrium ParticipationParticipation and Income-Sharing with Inequality
Risk-Sharing
Each household thus has two options:
1 It can remain in the village and participate in the insurance net-work, benefiting from the accompanying reduction in the vari-ance of its consumption
2 It can send one or more of its members to the city and add toits income but forego the services of the rural network
Kaivan Munshi, Mark Rosenzweig Networks and Misallocation 24/ 55
IntroductionThe Model
Empirical AnalysisConclusion
Income, Preferences, and Risk-SharingThe Participation DecisionEquilibrium ParticipationParticipation and Income-Sharing with Inequality
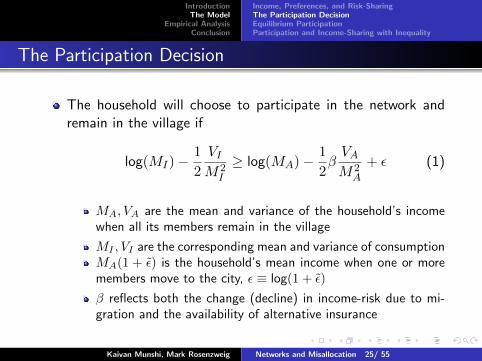
The Participation Decision
The household will choose to participate in the network andremain in the village if
log(MI)−1
2
VIM2I
≥ log(MA)− 1
2βVAM2A
+ ε (1)
MA, VA are the mean and variance of the household’s incomewhen all its members remain in the village
MI , VI are the corresponding mean and variance of consumptionMA(1 + ε̃) is the household’s mean income when one or moremembers move to the city, ε ≡ log(1 + ε̃)
β reflects both the change (decline) in income-risk due to mi-gration and the availability of alternative insurance
Kaivan Munshi, Mark Rosenzweig Networks and Misallocation 25/ 55

IntroductionThe Model
Empirical AnalysisConclusion
Income, Preferences, and Risk-SharingThe Participation DecisionEquilibrium ParticipationParticipation and Income-Sharing with Inequality
The Participation Decision
With full risk-sharing and log preferences, each household’s con-sumption is a fixed fraction of total income in each state ofnature
Mean rural income, MA, is the same for all households
ε, which is uncorrelated with MA, is private information
We will thus have an equal sharing rule
Kaivan Munshi, Mark Rosenzweig Networks and Misallocation 26/ 55

IntroductionThe Model
Empirical AnalysisConclusion
Income, Preferences, and Risk-SharingThe Participation DecisionEquilibrium ParticipationParticipation and Income-Sharing with Inequality
The Participation Decision
The equal sharing rule implies that
MI = E
(1
N
∑i
yis
)=
1
N(NMA) = MA
VI = V
(1
N
∑i
yis
)=
1
N2(NVA) =
VAN
Assume that migration increases the risk that the householdfaces, RI < βRA, even if β < 1
where RI ≡ VI
M2I, RA ≡ VA
M2A
Participation will thus depend on the gain from insurance, βRA−RI , versus the income-gain from migration, ε, since MI = MA
Kaivan Munshi, Mark Rosenzweig Networks and Misallocation 27/ 55
IntroductionThe Model
Empirical AnalysisConclusion
Income, Preferences, and Risk-SharingThe Participation DecisionEquilibrium ParticipationParticipation and Income-Sharing with Inequality
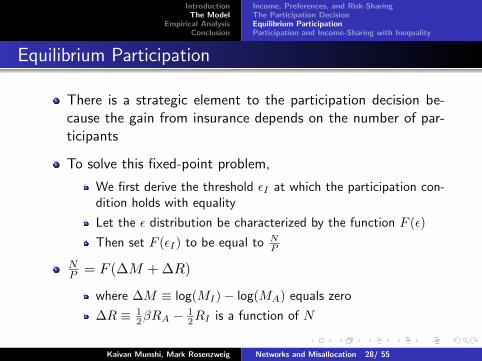
Equilibrium Participation
There is a strategic element to the participation decision be-cause the gain from insurance depends on the number of par-ticipants
To solve this fixed-point problem,
We first derive the threshold εI at which the participation con-dition holds with equality
Let the ε distribution be characterized by the function F (ε)
Then set F (εI) to be equal to NP
NP = F (∆M + ∆R)
where ∆M ≡ log(MI)− log(MA) equals zero
∆R ≡ 12βRA −
12RI is a function of N
Kaivan Munshi, Mark Rosenzweig Networks and Misallocation 28/ 55

IntroductionThe Model
Empirical AnalysisConclusion
Income, Preferences, and Risk-SharingThe Participation DecisionEquilibrium ParticipationParticipation and Income-Sharing with Inequality
Equilibrium Participation
We make the following assumptions about the distribution of ε
A1. The left support is equal to zero
A2. The right support is unbounded
A3. The density, f , is decreasing in ε
Given these distributional assumptions:
Lemma 1. Equilibrium participation is characterized by aunique fixed point, N∗ ∈ (0, P ).
Kaivan Munshi, Mark Rosenzweig Networks and Misallocation 29/ 55

IntroductionThe Model
Empirical AnalysisConclusion
Income, Preferences, and Risk-SharingThe Participation DecisionEquilibrium ParticipationParticipation and Income-Sharing with Inequality
Participation and Income-Sharing with Inequality
Divide the community into K income classes of equal size, Pk
With log preferences and full risk-sharing, Cks/CKs = λk
MIk =
λk∑k
λkNk
∑k
NkMAk VIk =
λk∑k
λkNk
2∑k
NkVAk
RI =
∑k
NkVAk(∑k
NkMAk
)2
Kaivan Munshi, Mark Rosenzweig Networks and Misallocation 30/ 55
IntroductionThe Model
Empirical AnalysisConclusion
Income, Preferences, and Risk-SharingThe Participation DecisionEquilibrium ParticipationParticipation and Income-Sharing with Inequality
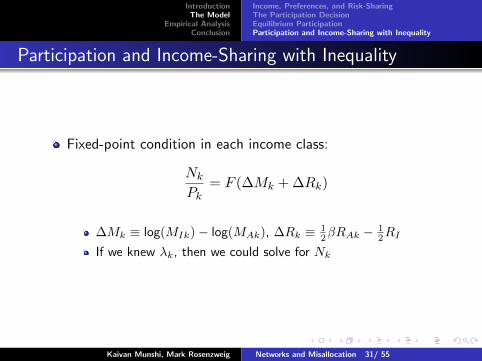
Participation and Income-Sharing with Inequality
Fixed-point condition in each income class:
Nk
Pk= F (∆Mk + ∆Rk)
∆Mk ≡ log(MIk)− log(MAk), ∆Rk ≡ 12βRAk −
12RI
If we knew λk, then we could solve for Nk
Kaivan Munshi, Mark Rosenzweig Networks and Misallocation 31/ 55

IntroductionThe Model
Empirical AnalysisConclusion
Income, Preferences, and Risk-SharingThe Participation DecisionEquilibrium ParticipationParticipation and Income-Sharing with Inequality
Participation and Income-Sharing with Inequality
To derive λk, maximize social surplus W , subject to the fixedpoint conditions
For β < 1,W =∑k
PkεIk∫0
{[log(MIk)− 1
2RI]−[log(MAk)− 1
2βRAk + ε]}f(ε)dε
W =∑k
NkεIk − PkεIk∫0
εf(ε)dε
Where εIk = ∆Mk + ∆Rk
Kaivan Munshi, Mark Rosenzweig Networks and Misallocation 32/ 55
IntroductionThe Model
Empirical AnalysisConclusion
Income, Preferences, and Risk-SharingThe Participation DecisionEquilibrium ParticipationParticipation and Income-Sharing with Inequality
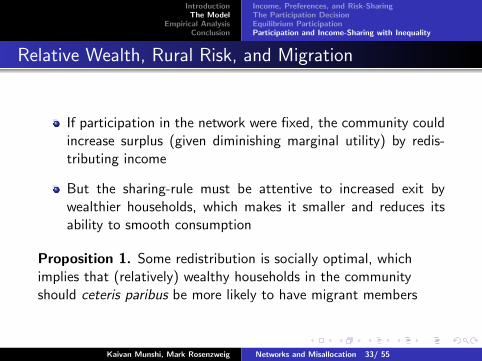
Relative Wealth, Rural Risk, and Migration
If participation in the network were fixed, the community couldincrease surplus (given diminishing marginal utility) by redis-tributing income
But the sharing-rule must be attentive to increased exit bywealthier households, which makes it smaller and reduces itsability to smooth consumption
Proposition 1. Some redistribution is socially optimal, whichimplies that (relatively) wealthy households in the communityshould ceteris paribus be more likely to have migrant members
Kaivan Munshi, Mark Rosenzweig Networks and Misallocation 33/ 55

IntroductionThe Model
Empirical AnalysisConclusion
Income, Preferences, and Risk-SharingThe Participation DecisionEquilibrium ParticipationParticipation and Income-Sharing with Inequality
Relative Wealth, Rural Risk, and Migration
A household that faces greater rural income-risk benefits morefrom the insurance network and is less likely to have migrantmembers
Must account for redistribution favoring safe households
Proposition 2. Households that face greater rural income-risk areceteris paribus less likely to have migrant members
Kaivan Munshi, Mark Rosenzweig Networks and Misallocation 34/ 55

IntroductionThe Model
Empirical AnalysisConclusion
Evidence on Redistribution within CastesReduced-Form EstimatesStructural EstimatesTesting the Mechanism
Testing the Theory
The theory generates three testable predictions:
1 Income is redistributed in favor of poor households within thecaste
2 Relatively wealthy households, who benefit less from the net-work, should be more likely to have migrant members
3 Households facing greater rural income-risk, who benefit morefrom the network, should be less likely to have migrant members
Additional tests validate the key assumption that permanentmale migration is associated with a loss in network services
Kaivan Munshi, Mark Rosenzweig Networks and Misallocation 35/ 55

IntroductionThe Model
Empirical AnalysisConclusion
Evidence on Redistribution within CastesReduced-Form EstimatesStructural EstimatesTesting the Mechanism
Testing the Theory
Urban caste networks can also explain low migration and largewage gaps
Alternative explanations are available for redistribution and in-creased exit by relatively wealthy households
No alternative can deliver all three predictions (especially thethird)
Kaivan Munshi, Mark Rosenzweig Networks and Misallocation 36/ 55

IntroductionThe Model
Empirical AnalysisConclusion
Evidence on Redistribution within CastesReduced-Form EstimatesStructural EstimatesTesting the Mechanism
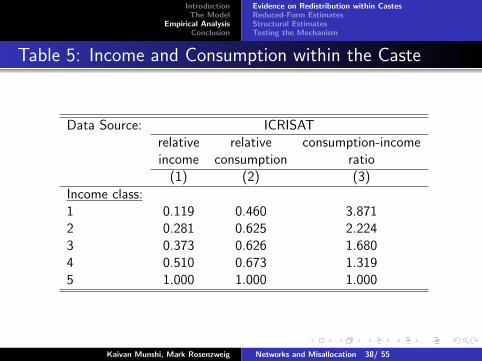
Evidence on Redistribution within Castes
2005-2011 Indian ICRISAT panel survey
household income over 7 years
consistent consumption data for 4 years
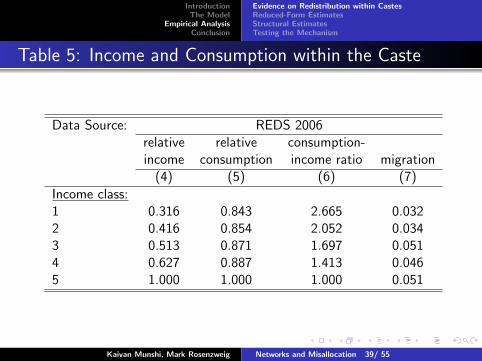
2006 REDS Census
119,000 households in 242 villages in 17 major states
permanent migration information is collected but income is onlyavailable in the year prior to the survey
impute average income and average consumption using ICRISATdata
Kaivan Munshi, Mark Rosenzweig Networks and Misallocation 37/ 55
IntroductionThe Model
Empirical AnalysisConclusion
Evidence on Redistribution within CastesReduced-Form EstimatesStructural EstimatesTesting the Mechanism
Table 5: Income and Consumption within the Caste
Data Source: ICRISATrelative relative consumption-incomeincome consumption ratio
(1) (2) (3)
Income class:1 0.119 0.460 3.8712 0.281 0.625 2.2243 0.373 0.626 1.6804 0.510 0.673 1.3195 1.000 1.000 1.000
Kaivan Munshi, Mark Rosenzweig Networks and Misallocation 38/ 55

Disadvantages of the REDS listing data:
A. Income is only for the prior year; want more permanentmeasure as in the ICRISAT data.
B. No consumption data.
Estimate relationships between average income net oftransfers and average total consumption (7 years) andhousehold and village characteristics (common) in ICRISATdata (2005-2011):
Landholdings, irrigation, number of adult earners, soilcolor and depth, mean and variance of village rainfall.(R =.3.).2

Use the estimated coefficients to impute average income andconsumption for REDS hh’s in the same states (ICRISAT = 2005-2011) using the same variables.
To test proposition 2 we also need a measure of incomevariability.
Impute from the association between the log income varianceand hh characteristics and hh characteristics*the variance ofrainfall in the ICRISAT data (R =.3).2
Standard errors are obtained from bootstrapping, with clusteringat two levels: caste and village
IntroductionThe Model
Empirical AnalysisConclusion
Evidence on Redistribution within CastesReduced-Form EstimatesStructural EstimatesTesting the Mechanism
Table 5: Income and Consumption within the Caste
Data Source: REDS 2006relative relative consumption-income consumption income ratio migration
(4) (5) (6) (7)
Income class:1 0.316 0.843 2.665 0.0322 0.416 0.854 2.052 0.0343 0.513 0.871 1.697 0.0514 0.627 0.887 1.413 0.0465 1.000 1.000 1.000 0.051
Kaivan Munshi, Mark Rosenzweig Networks and Misallocation 39/ 55

IntroductionThe Model
Empirical AnalysisConclusion
Evidence on Redistribution within CastesReduced-Form EstimatesStructural EstimatesTesting the Mechanism
Reduced-Form Estimates
Proposition 1 indicates that relatively wealthy households aremore likely to have migrant members
Mi = π0 + π1yi + π2yi + εi
π1 > 0, π2 < 0
cannot interpret π1 once we allow household income to have adirect effect on migration
Proposition 2 indicates that households facing greater ruralincome-risk should be less likely to have migrant members
Kaivan Munshi, Mark Rosenzweig Networks and Misallocation 40/ 55

IntroductionThe Model
Empirical AnalysisConclusion
Evidence on Redistribution within CastesReduced-Form EstimatesStructural EstimatesTesting the Mechanism
Table 6: Relative Wealth, Rural Income-Risk, andMigration
Dependent variable: migration(1) (2) (3) (4)
Household Income 0.0059 0.0051 0.0026 0.0020(0.0024) (0.0024) (0.0045) (0.0032)
Caste Income -0.016 -0.018 -0.022 -0.028(0.0043) (0.0055) (0.010) (0.0090)
Income Risk – -0.00038 -0.00037 -0.00056(0.00015) (0.00013) (0.00015)
Village Income 0.007 –(0.013) –
Village/ Caste Income 0.0076(0.012)
Village Fixed Effects No No No NoInfrastructure Variables No No No YesJoint sig. of infrastructure variables:χ2 – – – 16.59
– – – [0.00090]Number of observations 19,362 19,362 19,362 19,362
Source: 2006 REDS CensusKaivan Munshi, Mark Rosenzweig Networks and Misallocation 41/ 55
IntroductionThe Model
Empirical AnalysisConclusion
Evidence on Redistribution within CastesReduced-Form EstimatesStructural EstimatesTesting the Mechanism
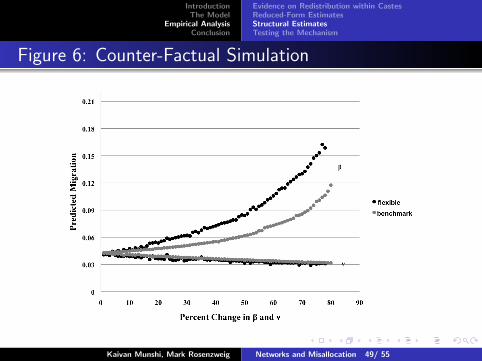
Structural Estimates
The structural estimates are used to
(i) provide independent support for the redistribution within castespredicted by the theory (external validation)
(ii) carry out counter-factual simulations
There are two exogenous variables in the model: MAk, RAk ≡VAk/M
2Ak
Although there is a single community in the theoretical analysis,there are 100 castes in the 2006 REDS census
Within each caste, j, we thus construct MAkj , RAkj
Kaivan Munshi, Mark Rosenzweig Networks and Misallocation 42/ 55

IntroductionThe Model
Empirical AnalysisConclusion
Evidence on Redistribution within CastesReduced-Form EstimatesStructural EstimatesTesting the Mechanism
Structural Estimates
Suppose, to begin with, that the β parameter and the F func-tion are known
For a given λkj vector, we can then solve for Nkj/Pj from thefixed-point condition
Total surplus can then be computed for each caste, j
If the model is correctly specified, predicted migration at thesurplus-maximizing λkj should match actual migration
Kaivan Munshi, Mark Rosenzweig Networks and Misallocation 43/ 55

IntroductionThe Model
Empirical AnalysisConclusion
Evidence on Redistribution within CastesReduced-Form EstimatesStructural EstimatesTesting the Mechanism
Structural Estimates
Now suppose that β is unknown
For an arbitrary β, we can go through the same steps
But predicted migration will not match actual migration
As β increases, migration will decline in each income-class ineach caste
Thus there exists a unique β for which (overall) predicted andactual migration match
Kaivan Munshi, Mark Rosenzweig Networks and Misallocation 44/ 55

IntroductionThe Model
Empirical AnalysisConclusion
Evidence on Redistribution within CastesReduced-Form EstimatesStructural EstimatesTesting the Mechanism
Structural Estimates
Finally describe how the F (ε) function is derived
Let ε be characterized by the exponential distribution
F (ε) = 1− eνε, E(ε) = 1/ν
Satisfies A1-A3
Kaivan Munshi, Mark Rosenzweig Networks and Misallocation 45/ 55

IntroductionThe Model
Empirical AnalysisConclusion
Evidence on Redistribution within CastesReduced-Form EstimatesStructural EstimatesTesting the Mechanism
Structural Estimates
ν is estimated in two steps
1 Use REDS and NSS data to compute the average income-gainfrom migration for households with migrants, ε̃, and its utility-equivalent ε̂ = log(1 + ε̃)
2 Use the percent of households with migrants, x, together withthe properties of the exponential distribution, to derive ν
ν =−log(x/200)
ε̂
As a robustness test, estimate ν within absolute income classesand within castes
Kaivan Munshi, Mark Rosenzweig Networks and Misallocation 46/ 55

IntroductionThe Model
Empirical AnalysisConclusion
Evidence on Redistribution within CastesReduced-Form EstimatesStructural EstimatesTesting the Mechanism
Table 7: Structural Estimates
measured single νrelative consumption migration relative consumption migration
(1) (2) (3) (4)
Relative Income Class:1 0.843 0.032 0.801 0.000
(0.071) (0.00020)2 0.854 0.034 0.817 0.014
(0.070) (0.0073)3 0.871 0.051 0.834 0.039
(0.063) (0.0083)4 0.887 0.046 0.868 0.060
(0.044) (0.0089)5 1.000 0.051 1.000 0.100
(0.014)overall 0.043 0.043β 1.410
(0.91)α –γ –
Source: 2006 REDS CensusKaivan Munshi, Mark Rosenzweig Networks and Misallocation 47/ 55

IntroductionThe Model
Empirical AnalysisConclusion
Evidence on Redistribution within CastesReduced-Form EstimatesStructural EstimatesTesting the Mechanism
Table 7: Structural Estimates
estimating ν by casterelative consumption migration relative consumption migration
(7) (8) (9) (10)
Relative Income Class:1 0.751 0.000 0.730 0.032
(0.097) (0.000081) (0.083) (0.0095)2 0.767 0.011 0.744 0.032
(0.092) (0.010) (0.064) (0.052)3 0.792 0.029 0.765 0.046
(0.070) (0.025) (0.055) (0.027)4 0.842 0.055 0.825 0.044
(0.044) (0.033) (0.037) (0.013)5 1.000 0.119 1.000 0.051
(0.062) (0.0074)overall 0.043 0.041β 0.845 0.991
(0.92) (0.18)α – 0.012
(0.050)γ – 4.45
(0.91)
Source: 2006 REDS CensusKaivan Munshi, Mark Rosenzweig Networks and Misallocation 48/ 55
IntroductionThe Model
Empirical AnalysisConclusion
Evidence on Redistribution within CastesReduced-Form EstimatesStructural EstimatesTesting the Mechanism
Figure 6: Counter-Factual Simulation
Kaivan Munshi, Mark Rosenzweig Networks and Misallocation 49/ 55
IntroductionThe Model
Empirical AnalysisConclusion
Evidence on Redistribution within CastesReduced-Form EstimatesStructural EstimatesTesting the Mechanism
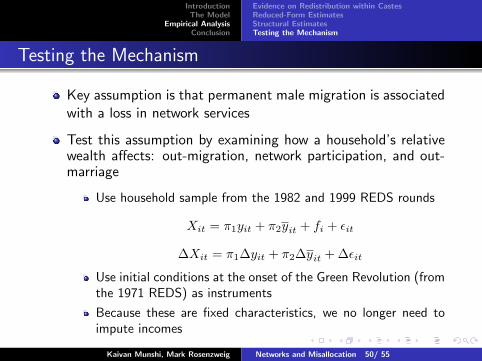
Testing the Mechanism
Key assumption is that permanent male migration is associatedwith a loss in network services
Test this assumption by examining how a household’s relativewealth affects: out-migration, network participation, and out-marriage
Use household sample from the 1982 and 1999 REDS rounds
Xit = π1yit + π2yit + fi + εit
∆Xit = π1∆yit + π2∆yit + ∆εit
Use initial conditions at the onset of the Green Revolution (fromthe 1971 REDS) as instruments
Because these are fixed characteristics, we no longer need toimpute incomes
Kaivan Munshi, Mark Rosenzweig Networks and Misallocation 50/ 55
IntroductionThe Model
Empirical AnalysisConclusion
Evidence on Redistribution within CastesReduced-Form EstimatesStructural EstimatesTesting the Mechanism
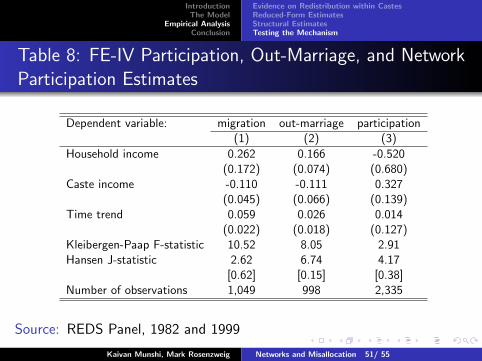
Table 8: FE-IV Participation, Out-Marriage, and NetworkParticipation Estimates
Dependent variable: migration out-marriage participation(1) (2) (3)
Household income 0.262 0.166 -0.520(0.172) (0.074) (0.680)
Caste income -0.110 -0.111 0.327(0.045) (0.066) (0.139)
Time trend 0.059 0.026 0.014(0.022) (0.018) (0.127)
Kleibergen-Paap F-statistic 10.52 8.05 2.91Hansen J-statistic 2.62 6.74 4.17
[0.62] [0.15] [0.38]Number of observations 1,049 998 2,335
Source: REDS Panel, 1982 and 1999
Kaivan Munshi, Mark Rosenzweig Networks and Misallocation 51/ 55
IntroductionThe Model
Empirical AnalysisConclusion
Conclusion
Why does India have migration rates that are so much lowerthan comparable developing economies?
Formal insurance is particularly weak in India [no evidence]
Informal insurance works particularly well there [high levels ofrisk-sharing have been documented throughout the developingworld]
There is, however, more to consumption-smoothing than risk-sharing
The size, scope, and connectedness of caste networks may beexceptional
Recent genetic evidence indicates that strict endogamy emerged1900 years ago
Kaivan Munshi, Mark Rosenzweig Networks and Misallocation 52/ 55

IntroductionThe Model
Empirical AnalysisConclusion
Conclusion
Can policies be implemented to increase mobility in this econ-omy?
We perform two counter-factual experiments with the estimatedmodel
1 Provision of credit to wealthy households
2 Government safety net for poor households
Kaivan Munshi, Mark Rosenzweig Networks and Misallocation 53/ 55

IntroductionThe Model
Empirical AnalysisConclusion
Figure 7: Reducing Risk in Higher Income-classes
Kaivan Munshi, Mark Rosenzweig Networks and Misallocation 54/ 55
IntroductionThe Model
Empirical AnalysisConclusion
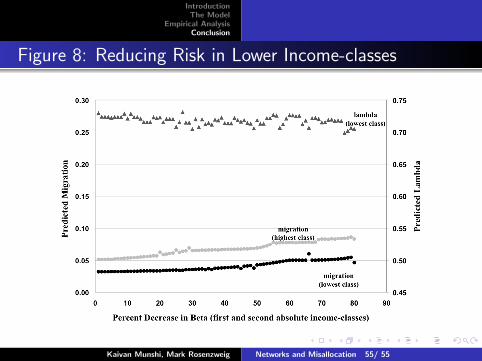
Figure 8: Reducing Risk in Lower Income-classes
Kaivan Munshi, Mark Rosenzweig Networks and Misallocation 55/ 55