Network Rail Monitor - Home | Office of Rail and...
95
Network Rail Monitor Quarters 3-4 of Year 3 of CP5 16 October 2016 to 31 March 2017 11 July 2017 Network Rail Monitor Quarters 3-4 of Year 3 of CP5 16 October 2016 to 31 March 2017 20 July 2017
-
Upload
nguyenminh -
Category
Documents
-
view
223 -
download
0
Transcript of Network Rail Monitor - Home | Office of Rail and...
Network Rail Monitor
Quarters 3-4 of Year 3 of CP5
16 October 2016 to 31 March
2017
11 July 2017
24 November 2016
Network Rail Monitor
Quarters 3-4 of Year 3 of CP5 16 October 2016 to 31 March 2017
20 July 2017
Contents
1. Overview 4
Health and safety 4
Train service performance 5
Asset management 6
Developing the network 6
Expenditure and finance 7
Reporting on Network Rail’s performance in CP6 9
2. Health and Safety 10
Performance against key indicators 10
Risk Management Maturity Model RM3 12
Track 14
Civils and Drainage 15
Electrical Safety 18
Level Crossings 19
Worker Safety 21
Occupational health 21
3. Train service performance 24
National level performance 24
Delivery of performance at TOC level 27
Other performance interventions and measures 31
Freight performance 33
4. Asset management 36
Asset performance 36
Asset sustainability 39
Maintenance activity based planning 40
ORBIS milestones 41
Asset management capability 42
Asset data quality 42
5. Developing the network 44
Delivery progress 44
Projects at risk 45
Changes to future milestones 46
Enhancements Improvement Programme (EIP) 46
6. Expenditure and finance 49
Overall financial performance 49
Expenditure and financial performance 49
Regulatory financial performance 50
Efficiency 53
Network Rail’s net debt, RAB, headroom and borrowing 54
Asset disposals 56
Route level analysis of financial performance 56
Route level analysis 57
7. The railway in Wales 62
Health and safety 62
Train performance 64
Asset management 66
Developing the network 67
Expenditure and financial performance 67
8. Y Rheilffyrdd yng Nghymru 72
Iechyd a diogelwch 72
Perfformiad trenau 75
Rheoli asedau 76
Datblygu'r rhwydwaith 77
Gwariant a pherfformiad ariannol 78
9. Glossary 83

Office of Rail and Road | 20 July 2017 Network Rail Monitor Q3-4 2016-17 | 4
1. Overview
Health and safety
1.1 Network Rail has delivered good safety management in 2016-17, in some cases
reaching a higher level than predicted at the start of Control Period 5 (CP5). There
were no passenger fatalities on infrastructure or stations managed by Network Rail
during the year, but sadly 2016-17 saw one contractor fatality arising from a road
traffic accident. The workforce Lost time Injury Frequency Rate (LTIFR) reduced
over the year in line with Network Rail’s target. The number of RIDDOR specified
injuries was 90 compared to 72 in 2015-16.
1.2 However, Network Rail’s rate of improvement has slowed and we need to see that
the company has the building blocks in place to continue to deliver improved safety
performance in the future. There has been no further improvement in Network Rail’s
management maturity as measured by the RM3 maturity model. We have seen a
plateauing in performance indicators on asset condition (for example on track
geometry) and in the course of our inspections, we continued to find instances
where Network Rail staff did not comply with the company’s rules, procedures and
engineering standards. We also noted Network Rail’s lack of progress with the
implementation and integration into the business of important systemic changes
such as Business Critical Rules, Role Based Competency, Risk Based
Maintenance, and the Linear Asset Decision Support tool.
1.3 In some areas, our inspections have shown that Network Rail may be relying on risk
control processes heavily dependent on the knowledge, competence and expertise
of individual staff. This increases the vulnerability of those controls. There were two
significant incidents in 2016-17 where it was only human intervention - the last line
of defence - that prevented a very serious outcome. These were the Grove Nook
Lane (Barrow on Soar) bridge collapse in August 2016 and the Hunton Bridge
Tunnel (Watford) cutting failure in September. Network Rail must continue to push
for further improvements, particularly in assurance activities, to promote more
reliable and sustainable control of risk.
1.4 The asset safety lagging indicators, for example track geometry and rail breaks, are
currently favourable. But some assets are vulnerable, especially earthworks and
structures and associated drainage. Our inspections and reviews suggest that
deferral of renewals work is increasing pressure on maintenance and inspection
functions, placing further demand on a safety control system which is heavily reliant
on human intervention.
Office of Rail and Road | 20 July 2017 Network Rail Monitor Q3-4 2016-17 | 5
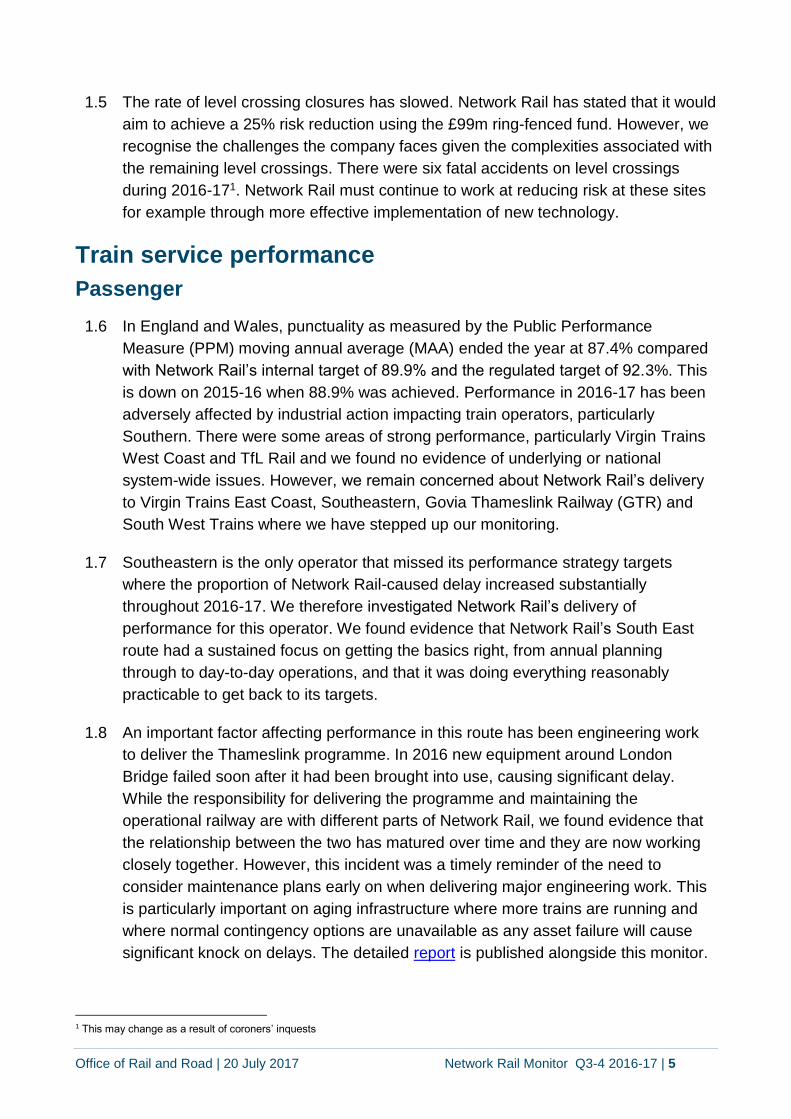
1.5 The rate of level crossing closures has slowed. Network Rail has stated that it would
aim to achieve a 25% risk reduction using the £99m ring-fenced fund. However, we
recognise the challenges the company faces given the complexities associated with
the remaining level crossings. There were six fatal accidents on level crossings
during 2016-171. Network Rail must continue to work at reducing risk at these sites
for example through more effective implementation of new technology.
Train service performance
Passenger
1.6 In England and Wales, punctuality as measured by the Public Performance
Measure (PPM) moving annual average (MAA) ended the year at 87.4% compared
with Network Rail’s internal target of 89.9% and the regulated target of 92.3%. This
is down on 2015-16 when 88.9% was achieved. Performance in 2016-17 has been
adversely affected by industrial action impacting train operators, particularly
Southern. There were some areas of strong performance, particularly Virgin Trains
West Coast and TfL Rail and we found no evidence of underlying or national
system-wide issues. However, we remain concerned about Network Rail’s delivery
to Virgin Trains East Coast, Southeastern, Govia Thameslink Railway (GTR) and
South West Trains where we have stepped up our monitoring.
1.7 Southeastern is the only operator that missed its performance strategy targets
where the proportion of Network Rail-caused delay increased substantially
throughout 2016-17. We therefore investigated Network Rail’s delivery of
performance for this operator. We found evidence that Network Rail’s South East
route had a sustained focus on getting the basics right, from annual planning
through to day-to-day operations, and that it was doing everything reasonably
practicable to get back to its targets.
1.8 An important factor affecting performance in this route has been engineering work
to deliver the Thameslink programme. In 2016 new equipment around London
Bridge failed soon after it had been brought into use, causing significant delay.
While the responsibility for delivering the programme and maintaining the
operational railway are with different parts of Network Rail, we found evidence that
the relationship between the two has matured over time and they are now working
closely together. However, this incident was a timely reminder of the need to
consider maintenance plans early on when delivering major engineering work. This
is particularly important on aging infrastructure where more trains are running and
where normal contingency options are unavailable as any asset failure will cause
significant knock on delays. The detailed report is published alongside this monitor.
1 This may change as a result of coroners’ inquests
Office of Rail and Road | 20 July 2017 Network Rail Monitor Q3-4 2016-17 | 6
1.9 Cancellations and Significant Lateness (CaSL) ended the year at 4.0%, 1.1
percentage points (pp) above (i.e. worse than) the internal target and 1.8 pp above
the regulatory target. This is also worse than 2015-16 when 3.1% was achieved.
Freight
1.10 Network Rail’s performance for the freight sector was relatively strong. The Freight
Delivery Metric (FDM) MAA at the end of the year stood at 94.4%, well ahead of the
national regulatory target of 92.5%.
Asset management
1.11 Network Rail has seen the overall reliability of assets improve slightly over the
course of year. The Composite Reliability Index (CRI), which measures asset
reliability across the network compared to the end of CP4, improved reaching
+15.8%, compared to +14.8% at the end of 2015-16. But the underlying picture
varies across different types of assets. Larger improvements in track reliability
(+13.9%, up from +10.4%) and telecoms (+3.4%, up from -23.5%) were offset by
falls in earthworks (-31.4%, down from -17.6%) and operational property (+28.5%,
down from +33.6%).
1.12 On asset renewals carried out this year, Network Rail significantly exceeded its
planned volumes for the year for civils (underbridges 13% and earthworks 93%
above plan respectively) and electrification and power (overhead line 24% and third
rail +3% below plan).
1.13 There was however, a 12% shortfall in plain line track works due to a fall in high
output productivity, and a smaller shortfall in signalling works (6%). £800m worth of
work has been deferred, which will have longer-term implications for network
sustainability. Network Rail has not delivered the regulated outputs for the new
Civils Asset Management System (CSAMS) and decommissioning of GEOGIS.
Developing the network
1.14 Network Rail completed 27 out of 41 Enhancement Delivery Plan (EDP) milestones
due to be completed in 2016-17. Four milestones were revised including the
Intercity Express Programme (IEP) test track on the Western Route. Of the 10
milestones missed, two were significant – Edinburgh to Glasgow Improvements
Programme (EGIP) Key Output 1 (infrastructure open for use) and Gospel Oak to
Barking electrification (entry into service for testing and driver training).
1.15 We are currently reviewing the Great Western Electrification Programme. We have
some concerns about the level of risk associated with the deliverability of the
December 2017 Entry into Service milestones contained in the EDP.
Office of Rail and Road | 20 July 2017 Network Rail Monitor Q3-4 2016-17 | 7
1.16 We are still concerned about Network Rail’s overall capability to plan and deliver
enhancements. The company has been unable to provide evidence that benefits
have been delivered through the Enhancements Improvement Programme (EIP) as
required under our Notice of October 2015 link. Progress against delivery
milestones in the plan itself has been good, but we have yet to see evidence that
new ways of working have been rolled out effectively across the business and are
delivering the expected capability improvements. The business change approach
for this programme does not appear to be in line with other examples of best
practice around Network Rail. We will continue to monitor this closely to confirm that
the required improvement from the baseline position in 2015 has been achieved.
1.17 This year was the first year of operation of the Memorandum of Understanding
between the Department for Transport (DfT) and Network Rail. This has driven an
increasingly collaborative approach to governance and portfolio management.
Expenditure and finance
1.18 In 2016-17, Network Rail underspent its net budget of £5,377m by £499m.
However, work to the value of £992m was not done and will be delivered at a later
date. This includes £800m of renewals work, £163m of enhancements work and
£29m of schedule 4 compensation payments for track possessions.
1.19 Taking this into account, for the work delivered, Network Rail underperformed
against its own budget by £335m on renewals (adjusted to £84m in line with the
RAB sharing mechanism)2 and £140m on enhancements (adjusted to £28m in line
with the RAB sharing mechanism)3. Network Rail's efficiency in 2016-17 for the core
business was -5.0% for the control period to date.
1.20 The gross renewals underperformance of £335m was largely due to less track work
(£132m) being delivered by the high output plant than planned. This led to
additional contractor claims and reduced volumes and higher cost of work actually
delivered. Other factors were:
the impact of additional scope and emergency work on civils as well as higher
unit rates (£114m); and
signalling issues including project delays (£38m).
Network Rail has also not delivered its planned efficiency initiatives.
2 Network Rail generally retains 25% of any out/underperformance of the renewals and enhancement costs. This is consistent with our
RAB roll forward policy.
3 The interpretation of this variance now reflects the recommendations of the Hendy Report (November 2015) and the subsequent
Enhancement Delivery Plan (EDP), which changed the baseline of the calculation of financial performance reflecting the increased
anticipated final costs (AFC) for many enhancement projects.

Office of Rail and Road | 20 July 2017 Network Rail Monitor Q3-4 2016-17 | 8
1.21 Enhancements underperformance was largely due to increased contract costs,
supply chain constraints and access issues on Northern Hub (£80m), EGIP (£38m),
East West Rail (£35m) and on the three projects electrifying the Shotts, Rutherglen-
Coatbridge and Stirling-Alloa lines ('collectively known as the Rolling Programme of
Electrification) in Scotland (£15m).
1.22 An underperformance against budget of £76m on schedule 8 compensation
payments reflects delays due to asset failures. It also reflects various infrastructure
incidents such as flooding, landslips and fires. Examples are severe flooding in
London in June 2016 (£10m), Storm Doris (£10m) and a landslip at Watford (£5m).
1.23 There is also an underperformance against budget of £65m in maintenance. This is
due to lower than planned efficiencies; higher costs of civils and building inspections
because of restricted access to sites; additional investment in the implementation of
performance improvement programmes; and increased levels of maintenance
needed because of the delay in renewals projects.
1.24 An outperformance in support costs (£36m) is primarily due to a favourable
reassessment of insurance liabilities to reflect a reduced level of expected claims.
1.25 Following the company’s classification to the public sector by the Office of National
Statistics (ONS), Network Rail agreed to borrow from DfT instead of issuing bonds.
The amount of new borrowing available from DfT is limited to £30.9bn across CP5
for Great Britain, after this was increased by £0.7bn following the Hendy Review.
1.26 Compared to its forecast at the start of CP5, Network Rail has spent more than it
expected on the renewals and enhancements work it delivered in 2014-15, 2015-16
and 2016-17. It is forecasting to spend more on work to be delivered during the last
two years of CP5, 2017-18 and 2018-19 as well. This means there is pressure on its
borrowing facility with DfT.
1.27 Network Rail’s latest business plan for Great Britain includes financial headroom of
£0.3bn during the remaining two years of CP5, i.e. it thinks it will not need to use
£0.3bn of the borrowing facility.
1.28 In our November monitor we noted the financial risks the company faces. These
risks remain and include: given its recent performance, the company may not
deliver its current planned efficiencies; movements in interest rates; inflation; and
the amount of money it needs to set aside for funding the cost of its financial
instruments4. In addition, asset disposal proceeds are uncertain and they are likely
to be lower than originally forecast. This is putting more pressure on Network Rail’s
4 Prior to reclassification, Network Rail borrowed directly from the financial markets. To reduce its exposure to interest rate, currency
and inflation fluctuations, Network Rail took out a range of financial instruments. Many of these require Network Rail to set money aside in the form of collateral, and this amount varies as markets move.
Office of Rail and Road | 20 July 2017 Network Rail Monitor Q3-4 2016-17 | 9
financial position. Network Rail needs to develop its contingency plans further to
address these pressures.
1.29 In case some of these income and cost pressures materialise, Network Rail has
plans to generate additional savings of £0.3bn in England & Wales, but they are not
guaranteed. Network Rail has received additional grant funding of £0.3bn from DfT
in 2017-18.
1.30 Network Rail has provided us with some high-level information on how it would deal
with further pressures, but we are concerned that the company does not have a
formal route-based plan in place for England & Wales to deal with these pressures,
although it does have one for Scotland. We will therefore continue to engage with
Network Rail on this issue and will monitor closely its plan to deliver its efficiency
savings in Great Britain.
1.31 We are making changes to the way we monitor Network Rail’s efficiency for CP5
and we will report on this in the next monitor. As part of our work on PR18 we are
consulting on the reasons why Network Rail has not delivered renewals efficiency
improvements in CP5, and how ORR should change its approach to assessing
Network Rail’s plans for CP6. In addition we have commissioned an independent
reporter study into the progress that Network Rail is making in developing these
CP6 plans, to help provide greater assurance that its final plans will contain robust
efficiency proposals across all areas of expenditure.
Reporting on Network Rail’s performance in CP6
1.32 Later this month, as part of PR18, we will be publishing our consultation on the
overall framework for regulating Network Rail in Control Period 6 (CP6). As part of
this, we want to consider our approach to reporting on all aspects of Network Rail’s
performance in CP6 – including through the Network Rail Monitors. An important
objective will be to make the Monitors more useful to stakeholders and a key
element will be a move towards more detailed reporting at route level in line with
Network Rail’s devolution agenda. We will therefore develop and implement, ahead
of April 2019, a reporting approach that accurately and fairly reports route
comparisons. We expect to consult stakeholders as part of that process.

Office of Rail and Road | 20 July 2017 Network Rail Monitor Q3-4 2016-17 | 10
2. Health and Safety
2.1 The railway is a system and we focus on health and safety issues across the whole
of that system. This section of the monitor reports on:
Network Rail’s performance against key health and safety indicators;
the findings from our inspections and investigations of Network Rail; and
other key issues.
Some of the issues we report on here are linked to other sections, particularly
section 4, Asset Management.
Performance against key indicators
2.2 During 2016-17, there were no passenger fatalities on infrastructure or stations
managed by Network Rail. However, there were three passenger fatalities at the
following stations which are managed by train operating companies:
at Hither Green station, on 1 April 2016, a passenger slipped off the edge of a
platform and was struck by a train;
at Horley station, on 22 October 2016, a passenger attempted to cross the
tracks between platforms and was struck by a train; and
at Barnt Green station, on 9 February 2017, two passengers crossed the tracks
between platforms, one of whom was struck and fatally injured by a train.
2.3 The year saw one contractor fatality arising from a road traffic accident on the A267
at Little London, East Sussex on 5 June 2016. Last year’s notable achievement of
zero industry-caused workforce or public fatalities has not therefore been repeated
this year. Unconfirmed data show that during 2016-17 there were six level crossing
fatalities compared to four in 2015-16.
2.4 Network Rail met two of its high-level safety objectives for the year. It outperformed
its target for close calls reported, recording 205,555 against a target of 120,000. At
the end of 2016-17 it had achieved a 7% reduction in all public fatalities. Suicides
were also down by 7%. Although level crossing fatalities increased, there was a
reduction in other accidental fatalities bringing the combined total down by 5%.
2.5 The following targets were missed:
on workforce safety, the Lost time Injury Frequency Rate (LTIFR) ended the
year at 0.449. A reduction in the number of lost time injuries was offset by an
increase in RIDDOR-specified injuries, 90 compared to 72 in 2015-16.
Office of Rail and Road | 20 July 2017 Network Rail Monitor Q3-4 2016-17 | 11
(Although narrowly missing its target of 0.447, this was Network Rail’s best ever
LTIFR);
at the end of the year, 76.3% of close calls had been closed out within 90 days
against Network Rail’s target of 80%. Scotland had the most significant shortfall,
recording 66%;
Train Accident Risk Reduction (a composite metric picking up various
programme milestones and volumes) was not met. At the end of the year, it
stood at 78.7% against a target of 80%. Parts of the programme were
significantly more successful than others and we highlight some of these in later
sections;
in relation to level crossings, Network Rail achieved a cumulative risk reduction
of 18.1% (from CP4 exit baseline). It missed its national target of 20% and four
out of ten of its Level Crossing Risk Reduction Programme milestones.
However, it should be noted that the targets are internal ones, not ORR-
imposed. Furthermore, this level of risk reduction has been achieved despite
the absence of anticipated law reform that would make level crossing closure a
smoother process; and
there has been a 34% increase in the number of road traffic accidents involving
Network Rail staff or contractors on duty compared to 2015-16 (up from 131 to
176). This is despite a 27% decrease in the number of road traffic offences.
Network Rail is undertaking a review of the Lifesaving Rules involving driving
incidents to ensure all routes and functions are investigating incidents
appropriately. We will await the conclusion of that work before deciding if we
need to do more to understand trends.
2.6 Last year we reported that many safety performance measures and precursor
indicators were at historically ‘best ever’ levels. 2016-17 has seen a levelling out of
those trends. Previously improving trajectories have ‘plateaued’ and in some cases,
we have seen reversals. Within the Train Accident Precursors Indicator Model
(PIM), for example, Infrastructure Operations and Level Crossings were marginally
worse than target. Even where the overall risk reduction trajectory is being met,
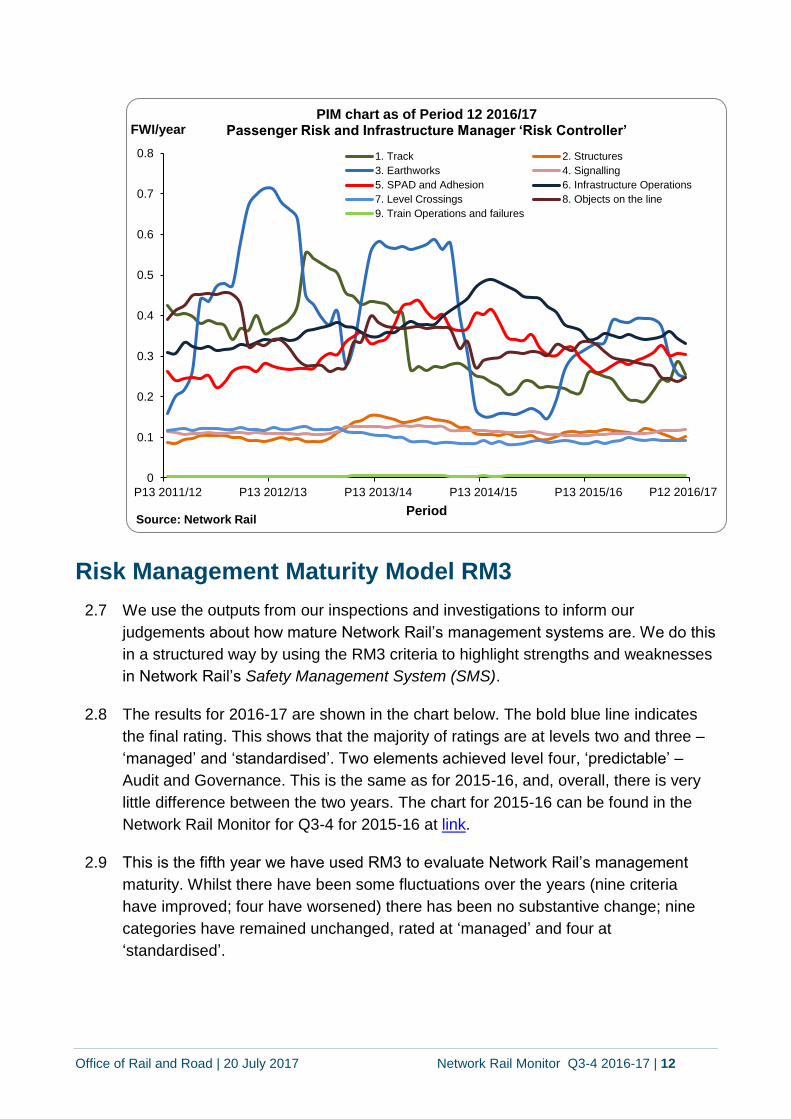
there are some sub-sets of data where performance has worsened. Track figures,
for example, are within target overall but there is a reported 54% increase in the
Twist and Geometry Faults sub-group over the past year (see the upturn in the
Track element of the following PIM chart).
Office of Rail and Road | 20 July 2017 Network Rail Monitor Q3-4 2016-17 | 12
Risk Management Maturity Model RM3
2.7 We use the outputs from our inspections and investigations to inform our
judgements about how mature Network Rail’s management systems are. We do this
in a structured way by using the RM3 criteria to highlight strengths and weaknesses
in Network Rail’s Safety Management System (SMS).
2.8 The results for 2016-17 are shown in the chart below. The bold blue line indicates
the final rating. This shows that the majority of ratings are at levels two and three –
‘managed’ and ‘standardised’. Two elements achieved level four, ‘predictable’ –
Audit and Governance. This is the same as for 2015-16, and, overall, there is very
little difference between the two years. The chart for 2015-16 can be found in the
Network Rail Monitor for Q3-4 for 2015-16 at link.
2.9 This is the fifth year we have used RM3 to evaluate Network Rail’s management
maturity. Whilst there have been some fluctuations over the years (nine criteria
have improved; four have worsened) there has been no substantive change; nine
categories have remained unchanged, rated at ‘managed’ and four at
‘standardised’.
0
0.1
0.2
0.3
0.4
0.5
0.6
0.7
0.8
P13 2011/12 P13 2012/13 P13 2013/14 P13 2014/15 P13 2015/16
FWI/year
Period
PIM chart as of Period 12 2016/17Passenger Risk and Infrastructure Manager ‘Risk Controller’
1. Track 2. Structures
3. Earthworks 4. Signalling
5. SPAD and Adhesion 6. Infrastructure Operations
7. Level Crossings 8. Objects on the line
9. Train Operations and failures
P12 2016/17
Source: Network Rail

Office of Rail and Road | 20 July 2017 Network Rail Monitor Q3-4 2016-17 | 13
2.10 The light blue shaded area on the chart below describes the range of ratings for
every criterion. Our final evaluation is determined by where the balance of the
evidence lies, but as the chart shows, there is considerable variation in many of the
SMS elements. We have seen this every year that we have carried out the RM3
assessment. It indicates inconsistency in the application of Network Rail’s SMS
across its network.
2.11 We prepare a detailed report each year for Network Rail describing our RM3
findings and sharing the evidence on which we base our judgements. This is the
start of our conversation about how safety management can be improved. For
2016-17, we pointed to repeated instances of failure to implement process
effectively. These included both well-established procedures (such as identifying
and acting on track geometry faults within prescribed timescales or documenting
interim mitigation for asset deferrals) and newer processes (such as introducing
Plain Line Pattern Recognition (PLPR) or the Linear Asset Decision Support tool).
We have seen some initiatives that have flowed from improved safety leadership
falter and fall short of their full potential; these include Business Critical Rules, Role
Based Competence and Planning and Delivering Safe Work (PDSW)5.
5 We note however, that progress with PDSW has been made, with the formal launch of the revised Standard 019 on 3 July 2017.
Office of Rail and Road | 20 July 2017 Network Rail Monitor Q3-4 2016-17 | 14
2.12 Our detailed RM3 report to Network Rail describes how we have seen a clear
commitment to making improvements in health and safety management. However
that same report identifies repeated evidence that delivery of these commitments is
constrained by:
changes of personnel in leadership roles;
deferral of renewals and reduced volumes of other work e.g. drainage
improvement work, and delays to other safety-related projects such as Business
Critical Rules etc; and
an increasing emphasis on reactive activities and a consequential loss of focus
on medium to longer-term improvement programmes.
2.13 The lack of growth in Network Rail’s management maturity, along with a slowing of
positive trends in performance indicators, suggests that Network Rail’s improved
safety management record of recent years may be vulnerable. The company needs
to focus on improvements, particularly in assurance activities, in order to promote
more reliable and sustainable control of risk.
Track
2.14 Trends in performance indicators show a mixed and sometimes complex picture for
2016-17. Track geometry and fault measures all still show an improvement
compared to CP4 exit, but for some the rate of improvement has slowed or even
begun to reverse.
2.15 Repeat twist faults, although still better than CP4 exit levels, have deteriorated over
the last year. It is a complex picture. Most routes show improving trends in new twist
faults, and some of the ‘repeats’ may be a reporting anomaly. We are pressing
Network Rail to establish the real level of repeat incidence and, thus, risk. We have
escalated our concerns about management of repeat track geometry faults and are
requiring the company to demonstrate plans to improve both nationally and on
individual routes.
2.16 Our inspections in 2016-17 showed:
there is a clear and systematic process for measuring and monitoring track
geometry, although robustness of delivery could be improved – especially
management of the output of Track Recording Vehicles;
in respect of assurance, follow-up and escalated track geometry management
concerns, we have more productive engagement with staff in the central
technical authority part of Network Rail. Engagement with the routes has been
more challenging and it is harder to secure route-level plans;
Office of Rail and Road | 20 July 2017 Network Rail Monitor Q3-4 2016-17 | 15
despite the commitment of staff in the Safety, Technical and Engineering
Directorate, information is often delayed and/or partial. Some individuals in
engineering and safety roles with whom we deal appear over-stretched and this
is reflected in the slow responses to many RAIB recommendations. In many
cases we are aware that substantial work has been done in response to
incidents, but Network Rail struggles to report it in a timely fashion;
Network Rail has made good progress with the fitment of tubular stretcher bars,
achieving 1,948 point ends against a target of 1,850. However, there are
indications that the post-Grayrigg improvements made to Switches and
Crossings (S&C) asset data in Ellipse have been eroded as many Maintenance
Delivery Units (MDUs) have, during the course of delivering stretcher bar
fitment, found that the data in Ellipse is no longer accurate;
delays were experienced in the implementation of Plain Line Pattern
Recognition and Eddy Current Testing for rolling contact fatigue;
the rollout of Business Critical Rules has been limited and future implementation
plans seem to lack drive. We have seen this initiative repeatedly reduced in
scope and ambition and its delivery timescales extended. Its first attempted
implementation was not sufficiently well-supported to be successful, a setback
from which the initiative has not fully recovered. To be effective, it requires
reprioritisation and resourcing.
role-based competence has fallen behind schedule. Without its full deployment
Network Rail will continue to struggle to demonstrate that its competence
management system (especially for Track Maintenance Engineers) is as
effective as it should be; and
inspections of deferred track renewals across all routes showed that there was
no demonstrably consistent means to manage the impact of deferrals. There
was no evidence of immediate safety risk, but it was not always clear that the
effects of deferral had been assessed fully, or that appropriate interim
mitigations had been identified and implemented. We have made a number of
recommendations to improve the rigour and transparency of processes to
manage deferrals.
Civils and Drainage
2.17 Monitoring the effectiveness of Network Rail’s management of civil assets such as
structures and earthworks is a high priority for ORR. This is because of the age of
these assets and their susceptibility to rapid deterioration in adverse weather. In
addition, signs of imminent failure are often hard or impossible to detect by visual
Office of Rail and Road | 20 July 2017 Network Rail Monitor Q3-4 2016-17 | 16
inspection. Finally, much of the work that Network Rail had planned to carry out
over the next two control periods has been deferred because of funding constraints.
2.18 The criticality of these assets is underlined by their inclusion in many of the
elements of Network Rail’s Train Accident Risk Reduction Programme. The
company did not deliver all the planned aspects of the programme during the year.
There was, for example, a significant delay in the achievement of the Civils
Strategic Asset Management Solution (CSAMS) with a knock-on effect on several
other initiatives for civil and drainage assets which rely on the improved quality and
ease of use of asset data CSAMS will bring.
2.19 The planned work on risk reduction measures for sites at high risk of damage from
water scour in extreme rainfall events was completed. However, the planned
volumes of drainage improvement work were not achieved in a majority of routes.
Network Rail’s professional Head of Drainage had identified these targets as
delivering train accident risk reduction.
2.20 PIM figures for both structures and earthworks are on a downward trajectory –
reflecting fewer incidents. This may be attributable in large part to relatively benign
weather. However, a number of incidents (such as the collapse of a bridge onto
open railway lines at Barrow on Soar in August 2016 and the derailment and
subsequent train collision due to a landslip at Watford in September 2016) provided
an illustration of the potential for catastrophic consequences and the vulnerability of
some of the controls and mitigations. Network Rail needs to maintain its focus on
the management of risks associated with this group of assets.
2.21 The following findings came out of our inspections during the year.
The management of risk associated with deferred renewals of structures and
earthworks varies from route to route. No immediate significant concerns were
identified during ORR site visits, but we concluded that Network Rail needs to
improve the standard of its recording of both the rationale for deferring a
renewal and the identification of mitigation measures.
Inspection and examination becomes even more important in the context of
deferred renewals. Despite this, we found that for some routes Network Rail
was unable to deliver earthworks and/or structures examinations in accordance
with the required standards. We have continued to press for improvements and
the backlogs have significantly reduced. But we are not convinced this is
sustainable in future because Network Rail has not yet demonstrated that it has
adopted measures to address the root causes of such backlogs. There is also
currently no programme for examination of Hidden Critical Elements (HCEs) in
operational property (buildings) assets, although work has now started on this.
Office of Rail and Road | 20 July 2017 Network Rail Monitor Q3-4 2016-17 | 17
Network Rail has made progress on the management of scour risk. Stage One
risk assessments are complete in most routes and remediation work has been
accelerated.
The examination regime for ancillary structures, in particular signal posts, has
been enhanced and a procedure to widen the scope of those improvements will
be introduced progressively until the final compliance date of April 2020.
Although some progress has been made, there are still gaps in Network Rail’s
asset knowledge, particularly in respect of drainage. More positively, work to
complete the identification of all earthworks assets has now been completed.
We have seen evidence of improvements in the centrally developed ‘Drainage
Roadmap’ describing planned works to develop drainage asset management
against an asset management excellence model template. This work is
encouraging but provision of adequate drainage systems and management of
those assets remains a concern.
We investigated a number of landslip incidents in 2016-17. We found that there
were too many barriers between asset disciplines, where the sharing of
knowledge across those boundaries could have delivered more effective control
of risk. Network Rail must improve its understanding of how individual asset
management systems work and how they interact to ensure a sufficient level of
system risk management is achieved. The company has acknowledged and
responded positively to this challenge.
Investigation of the derailment at Watford tunnel on 16 September 2016
revealed a weakness in Network Rail’s arrangements for responding to short-
notice notification of adverse or extreme weather. Steps are being taken within
LNW Route to address this matter, and these should also be considered by
other routes.
Although there have been some useful developments with remote monitoring
methods for earthworks, progress remains slow. Network Rail has not yet
developed a coherent strategy for the implementation of remote monitoring
across the network.
Several incidents during the year (notably the collapse of a retaining wall at
Liverpool Lime Street on 28 February 2017 depositing 200 tonnes of debris onto
railway lines and causing widespread disruption) have demonstrated the
potential impact of third party activities on the safe operation of the railway.
Network Rail, and the wider railway industry, need to consider how best to
minimise third party risks.

Office of Rail and Road | 20 July 2017 Network Rail Monitor Q3-4 2016-17 | 18
Electrical Safety
2.22 Our inspections have revealed varying levels of maturity in relation to the
management of risks from electrical assets. At a senior level within Network Rail,
and particularly within its Safety, Technical and Engineering Directorate, there is a
clear acknowledgement of and commitment to securing better compliance with the
law and improved control of risks. None of this is without significant challenge. The
legacy infrastructure pre-dates most of the significant legislation and was not
designed to comply. ‘New’ electrification schemes have to be fitted onto existing
infrastructure such as platforms, bridges and level crossings.
2.23 A very significant development has been the production of a decision support tool to
aid investment and renewal decisions. Network Rail intends to deploy this tool to
secure improved control of risk and legislative compliance for its ‘legacy’ assets
over three control periods (15 years). Network Rail estimates that, if left to
condition-related renewals, this process would take over 100 years. We welcome
the general approach proposed and will continue to scrutinise the detail of resulting
plans.
2.24 Throughout 2016-17, we have monitored Network Rail’s progress in delivering its
electrical safety improvement plans. There are a number of strands to this
programme, at varying stages of development. These include:
Safer, Faster isolations. For DC systems there are well-developed, practically
tested solutions. For AC, the physical equipment has not yet been developed
and consequently it has been much harder to arrive at solutions. We have
therefore told Network Rail that we would be content for more of the CP5 ring-
fenced funds to be spent on procuring and fitting equipment for DC networks;
and
Single Approach to Isolations. Network Rail is making progress. We have
challenged the company to ensure that the hierarchy in the Electricity at Work
Regulations is reflected properly and that terminology is easily understood.
2.25 We have continued to liaise closely with electrification projects throughout the year.
Network Rail has produced improved guidance for such schemes to aid them in
controlling risk and complying with the law, but there is still a legacy of option
selections made five to seven years ago when Network Rail’s and funders’
understanding of compliance requirements was not so well-developed. The result is
that we see expensive and difficult retrospective solutions, sometimes leading to
schemes overspending and becoming delayed.

Office of Rail and Road | 20 July 2017 Network Rail Monitor Q3-4 2016-17 | 19
2.26 In the course of our inspections, we met committed and enthusiastic staff, but we
have not yet seen a consistent level of understanding of legal requirements. This
has occasionally manifested in proposals that go beyond the reasonably
practicable. This arises because decisions are not underpinned by high quality
assessments of risk. In some schemes, we have seen good examples of risk
assessment, but Network Rail needs to ensure that projects improve mechanisms
for capturing and spreading such good practice.
2.27 We are inspecting the efficacy of Lifesaving Rules (LSRs) for electrical safety. The
work is not yet complete, so we have not finally reported. However, we have
communicated our interim finding that one rule, ‘Test before earth’ was well
understood and adopted, but the other rule ‘Test before touch’ at worksites was not
observed at any of the ten isolations inspected. This additional rule is central to staff
having confidence that their worksite is subject to a safe isolation of electrical
supply. Misunderstanding about the physical extent and timescales of isolations is
at the heart of incidents where staff have been harmed. Again these findings
illustrate the importance of Network Rail strengthening its own assurance
processes.
Level Crossings
2.28 Network Rail closed 67 crossings and achieved changes in public rights of way at a
further seven during 2016-17, still narrowly missing its own target for risk reduction.
This reflects the increasing difficulty in securing level crossing closure.
2.29 Overall, there were fewer events (as defined in the Level Crossing PIM chart) than
the five-year trend, but the overall level of risk in the PIM remained fairly constant.
Precursor risk associated with behaviour at automatic crossings increased. Actual
risk is outside the target risk reduction trajectory. Network Rail reports the moving
annual average (MAA) for significant level crossing events rose by 14.2% during
2016-17.
2.30 Events that occurred during the year show some of the significant areas where
Network Rail needs to concentrate its efforts. There were six fatalities at crossings,
two more than last year. Unlike the previous two years, these included occupants of
vehicles as well as pedestrians. In November 2016, a cyclist was struck and killed
at Old Stoke Road on LNW Route; on 3 January 2017, a passenger train struck a
road vehicle at Marston Automatic Half Barrier (AHB) crossing, fatally injuring the
driver; and at Frampton Mansell (Western) on 7 February 2017, a road vehicle
driver was killed when struck by a passenger train.
2.31 On 7 October 2016 at Virtual Quarry Open crossing on LNW route a train struck a
tipper truck attempting to cross the line. There were no injuries. Two injuries were
reported when a train struck a road vehicle at Nairns no. 117 crossing on 12 August
Office of Rail and Road | 20 July 2017 Network Rail Monitor Q3-4 2016-17 | 20
2016. On 25 August 2016, a passenger train struck a car which had incorrectly
turned onto the railway from Crescent Road crossing on LNW. On 27 May 2016, a
passenger train struck a lorry at Fishguard Harbour open crossing. Again, no
injuries resulted. All these incidents, though, had the potential for catastrophic harm
to rail passengers.
2.32 This was further illustrated on 10 April 2016 when a passenger train struck a tractor
at Hockham Road crossing in Anglia. Hockham Road, Frampton and Nairns no 117
are all crossings where the user is required to telephone the signaller to obtain
permission to cross. This can be a vulnerable means of controlling risk. Signallers
sometimes have incomplete information about positions of trains under their control,
particularly in long signal sections, and may make mistakes. These incidents also
emphasise the importance of Network Rail adopting a strategy to improve the
accuracy of information provided to crossing users.
2.33 Our main inspection programme in 2016-17 was of arrangements at whistle board
crossings. We inspected 128 crossings across all routes. We found that:
the quality of asset information was generally better than last year;
sounding of train horns was an unreliable warning. It was not always done, and
when the horn was sounded it was not always at the correct location to give
sufficient warning;
Network Rail risk assessments were improving but the aspirations of local
managers to improve risk control (by introducing additional warning
technologies, for example) were often frustrated by resource constraints and
slow industry processes;
whistle boards should be provided on both approaches to crossings – even
where sighting is sufficient – because it is a natural human response to expect
to hear a warning in both directions; and
consideration of additional risk during the ‘night time quiet period’ (NTQP) did
not lead to additional local measures.
2.34 Network Rail recognised the significance of its growing intelligence about greater
use than originally thought during the “extreme” hours of the NTQP - that is between
23:00 and midnight and between 06:00 and 07:00. Effective industry leadership
secured adoption of a reduction in the NTQP so that it is now between midnight and
06:00.
Office of Rail and Road | 20 July 2017 Network Rail Monitor Q3-4 2016-17 | 21
Worker Safety
2.35 There was one workforce fatality in 2016-17 – a serious road traffic accident which
occurred in June 2016. RIDDOR-specified injuries went up from 72 last year to 90
this year. This was significant enough to drive up the FWI (Fatalities and Weighted
Injuries) rate by 15.3% for 2016-17 compared to the previous year. On the other
hand, the wider normalised measure of LTIFR (Lost Time Injuries Frequency Rate)
decreased by 8.6% to its best ever level.
2.36 Network Rail’s concentrated focus on road driving safety has secured
improvements in a steady reduction in road traffic offences. Yet, at the same time,
road traffic accidents have increased. Work is continuing to review the LSRs and to
understand better the root causes of this apparently contradictory trend.
2.37 We welcome the more cautious, incremental approach set out in the latest edition of
NR/L2/OHS/019 ‘Safety of People working on or near the line’. We recognise
Network Rail’s efforts to regularise procedures across the network and support the
move to retain a single, accountable role for site safety and to involve that person in
planning. We also support a permit to work system. We accept that it is more
realistic to let Maintenance Delivery Units (MDUs) decide for themselves their
degree of readiness and appropriate timescales to proceed with change.
2.38 Our main inspection findings from 2016-17 are:
we have been impressed by the excellent LNE South initiative ‘safe and
effective worksites’. This shows that, with a little extra effort to plan work, there
is no need for frustrated access or excessive signaller workload and that Green
Zone working can be maximised;
we have highlighted the limitations to improvements that TOCs and FOCs can
make to depots electrified by 3rd rail and shown that Network Rail has landlord
responsibilities to eliminate and mitigate risks; and
we have seen the benefits of Plain Line Pattern Recognition (PLPR) and
negative short circuiting devices for worker safety and urge Network Rail to
expedite deployment of both initiatives.
Occupational health
2.39 During 2016-17, we observed a noticeable loss of leadership, focus and direction in
the period following the departure of the Head of Occupational Health and
Wellbeing. This interval allowed a markedly reduced commitment to improved
occupational health in parts of Network Rail. With the recent appointment of a Chief
Medical Officer, we look forward to a reversal of that trend.

Office of Rail and Road | 20 July 2017 Network Rail Monitor Q3-4 2016-17 | 22
2.40 We saw evidence that the company needs to further improve:
the way it measures progress in its health and wellbeing strategy;
the way it assesses the impact and effectiveness of the various initiatives; and
its understanding of the resources required to deliver its ambitions.
However, we also found increasing recognition of these areas for improvement and a
determination to address them.
2.41 We found that over the last 18 months there had been a shift in emphasis to
improve fitness for work or “wellness”. Network Rail needs to ensure that this does
not eclipse efforts to secure better basic occupational health compliance. We have
also seen some very positive progress in developing guidance and supporting
material to implement a refreshed approach to the management of mental health
concerns. Network Rail’s work in this area has been class leading.
2.42 We continued to find variations in the adoption and execution of national initiatives,
even where we considered the central programmes to be excellent – such as
asbestos management. We saw evidence of a tension between the aspirations of
the central technical authority and individual routes or parts of Infrastructure
Projects. For example, the web-based resource for health-specific improvement
frameworks was withdrawn in early 2016. In its place, as described in Network
Rail’s annual return, a range of educational material was made available. Our
inspections found that this was indeed the case but that no monitoring or reviews
had taken place to ensure understanding and adoption. Furthermore, the picture
varied greatly across routes. There was still a lack of basic understanding about
what the law requires, especially the ‘hierarchy of controls’ with elimination at the
top and PPE and process at the bottom.
2.43 As a result of inspection work during 2016-17, we wrote to Network Rail about Hand
Arm Vibration Syndrome (HAVS) management. Our site inspections showed a
worsening of arrangements in some cases, particularly regarding investigation of
new or worsening HAVS symptoms being carried out as a result of ‘tier one’ pre-
exposure baseline assessment, as required by legislation. We served an
Improvement Notice on assessment of HAVS risks at Chester MDU. We continue to
explore the thoroughness of Network Rail’s management of HAVS across the
network.
Office of Rail and Road | 20 July 2017 Network Rail Monitor Q3-4 2016-17 | 23
2.44 There was one example of very good practice for which we commend Network Rail.
When high output plant was brought in-house, Network Rail worked hard to
implement the existing plan to address the risks from silica in ballast dust released
during track renewals. It was noteworthy that emphasis was placed on elimination
(at quarries and aggregate handling depots) and suppression (within ballast
cleaning and track renewals systems) rather than adopting a default reliance on
PPE alone. Further – we found on site evidence of the setting out of clear
expectations, and active monitoring of compliance.
Office of Rail and Road | 20 July 2017 Network Rail Monitor Q3-4 2016-17 | 24
3. Train service performance
National level performance
3.1 Train performance continued to decline in the second half of 2016-17. At the end of
the year punctuality as measured by the Public Performance Measure (PPM)6
moving annual average (MAA) was 87.4%, a decline of 0.3 percentage points (pp)
in the last six periods. This was 2.5pp worse than Network Rail’s year-end internal
target and 4.9pp worse than the year-end regulatory target.
3.2 Over the same period, Cancellations and Significant Lateness (CaSL) MAA
increased by 0.3pp to 4.0%. It is now 1.1pp above (i.e. worse than) Network Rail’s
year-end internal target and 1.8pp above the year-end regulatory target.
6 PPM is an assessment of punctuality as delivered by train operators. ORR regulates Network Rail’s delivery of performance to the
train operators.
87.4%
92.3%
89.9%
84%
86%
88%
90%
92%
94%
96%
2011-12 2012-13 2013-14 2014-15 2015-16 2016-17
PPM (MAA)
Financial Year
England and Wales PPM (MAA)
Regulatory Target
NR Internal Target
0%
Source: Network Rail
Year End Targets
PPM is the proportion of trains arriving at their final destination on time. On time is within five minutes (or ten minutes for the long distance sector).
Office of Rail and Road | 20 July 2017 Network Rail Monitor Q3-4 2016-17 | 25
Factors behind the decline in performance
3.3 We engage regularly with Network Rail and train operating companies (TOCs) so
we can fully understand the performance trends. We have also undertaken regular
site visits to see at first hand the challenges Network Rail faces and how it plans to
tackle them. At this stage, our principal concerns are as set out below.
1. The performance of Govia Thameslink Railway (GTR)
3.4 At the end of 2016-17 GTR’s PPM MAA had fallen to 74.2%, 9.8pp below its year-
end Performance Strategy target. This has a significant impact on national level
performance as GTR operates 17% of services and accounts for 19.6% of
passenger journeys made in England and Wales.
3.5 Over the course of the last 18 months, there have been a number of reviews of train
service performance, including a cross industry review led by Chris Gibb on behalf
of the Secretary of State. We are continuing to monitor Network Rail’s delivery
closely, noting the renewed impetus and detailed attention it has brought in recent
months.
2. The performance of South West Trains (SWT)
3.6 Following a stable performance in 2015-16, the decline in PPM MAA over 2016-17
was the second worst in the country, with morning peak services between Raynes
Park and Waterloo being a major challenge. SWT’s PPM MAA fell from 85.6% at
the end of 2015-16 to 81.7% at the end of 2016-17. The proportion of Network Rail-
caused delay minutes is also high (at 70.8%). The forthcoming blockade to deliver
planned capacity enhancement works, highlights the need to improve performance.
In response, Network Rail has re-invigorated its oversight, prioritised key areas of
4.0%
2.9%
2.2%
0%
1%
2%
3%
4%
5%
2011-12 2012-13 2013-14 2014-15 2015-16 2016-17
CaSL (MAA)
Financial Year
England and Wales CaSL (MAA)
NR Internal Target
Regulatory Target
Source: Network Rail
Year End Target
CaSL is the proportion of trains which fail to run at all or fail to call at all booked stops or arrive at their final destination 30 minutes or more later than planned.
Office of Rail and Road | 20 July 2017 Network Rail Monitor Q3-4 2016-17 | 26
work to improve asset reliability and put in place measures to fix faults more quickly
(such as having fault teams on standby at key locations). We will continue to
monitor delivery of performance for this TOC closely.
3. The performance of Virgin Trains East Coast (VTEC)
3.7 Performance in 2016-17 continued to decline. While Network Rail-caused delay
minutes saw an absolute increase, their proportion decreased, due to worse
performance by the TOC. Issues with Overhead Line Equipment (OLE) have been
among the principal concerns. Network Rail has undertaken a detailed review of its
OLE resilience, focusing on rectification work in the Doncaster area. It has worked
closely with train operators on service recovery principles and the TOCs have
expressed confidence in what the company is doing. We will continue to monitor
closely.
4. The performance of Southeastern
3.8 Following noticeable improvements in PPM (MAA) in the second half of 2014-15,
performance declined sharply in 2015-16 continuing with a steady decline in 2016-
17 and ending the year at 86.1 % PPM, 2.4pp short of the performance strategy
target. The level of Network Rail-caused delay has also been high in 2016-17.
71.1% of delay minutes, 65.8% of PPM failures and 64.9% of CaSL failures were
attributable to Network Rail. In addition, new assets installed during engineering
work at London Bridge and Lewisham have failed in live operation soon after being
brought into use, causing significant disruption.
3.9 Network Rail has brought its activities across the South East Route into a
consolidated plan (the ‘Galaxy Plan’). It has reduced the number of infrastructure
failures and started a number of initiatives to tackle reactionary delay. There are
positive indications from the first periods of 2017-18, suggesting that there has been
a turnaround in asset performance on the South East Route.
3.10 We looked at Network Rail’s plans in more detail at the end of 2016-17 and
concluded that there may be a case for further regulatory action. We have therefore
undertaken a short investigation into the issues.
Investigation findings
3.11 In May 2017, we initiated an investigation of Network Rail’s delivery of performance
for Southeastern. We concluded that Network Rail was doing everything reasonably
practicable at the time to recover performance for Southeastern. However, we made
a number of observations on the steps that Network Rail was taking to improve
performance. The company has indicated that it is likely to accept these and will
work with ORR to agree timescales for responding to each of them. Our report can
be found here.
Office of Rail and Road | 20 July 2017 Network Rail Monitor Q3-4 2016-17 | 27
Our approach in year three of CP5 (2016-17)
3.12 We have held Network Rail to account for the delivery of Performance Strategy
targets, outputs that are locally agreed between the company and its customers (the
TOCs). When these are aggregated at a national level, this becomes Network Rail’s
internal target. But, for clarity, the internal target is not a regulatory target.
3.13 We set a ‘regulatory threshold’, outside which we will consider further action. For
PPM, this is 2.0pp below (worse than) Performance Strategy target and for CaSL,
this is 0.2pp above (worse than) the Performance Strategy target.
3.14 At the end of 2015-16, we considered regulatory intervention in respect of Network
Rail’s delivery to four TOCs all of which finished the year outside the regulatory
threshold, even after TOC-caused delays had been removed from the calculation.
We decided to monitor Network Rail’s delivery for these TOCs in 2016-17 more
closely. Of the four, TransPennine Express (TPE) has seen performance improve
during the year moving back within the regulatory threshold, with PPM MAA
improving by 2.8%. GTR, Southeastern, and Heathrow Express (HEx) have all
experienced a further decline in PPM MAA and at the end of the year were still
performing outside the threshold for regulatory intervention.
Delivery of performance at TOC level
PPM
3.15 At the end of 2016-17, five operators (Grand Central, London Midland, Northern,
TfL Rail and Virgin Trains West Coast (VTWC)) had met or were ahead of their
Performance Strategy targets. VTWC’s performance was particularly noteworthy
with the TOC achieving a PPM MAA of 89.1% against a target of 87.0%. Merseyrail
recorded the highest absolute PPM MAA score (95.8%), 0.5pp up on its
performance at the end of 2015-16.
3.16 Other than GTR, the worst performer was Hull Trains (HT). HT PPM MAA was
81.8%. This was 3.2pp below the 2016-17 Performance Strategy target. After GTR,
the worst franchised performer was Virgin Trains East Coast (VTEC). VTEC PPM
MAA increased to 83.1%, an improvement of 0.4pp in the last six periods, but at the
end of the year, it was still 3.9pp below the 2016-17 Performance Strategy target.
3.17 South West Trains (SWT) PPM MAA was 87.1% at the end of 2016-17, 3.7pp below
the Performance Strategy target. This is a reduction of 1.3pp in the last six periods.
The decline in PPM is not due to a single specific aspect of performance. Rather,
we have seen performance declining across all areas and cause codes.
Office of Rail and Road | 20 July 2017 Network Rail Monitor Q3-4 2016-17 | 28
3.18 Southeastern PPM MAA was 86.1% at the end of 2016-17, 2.4pp below the
Performance Strategy target. This is a reduction of 0.1pp in the last six periods.
TOC feedback has suggested that South East Route has focused on Sussex Area
(at the expense of Kent Area). The difference between temporary speed restriction
(TSR) volumes across the two routes may support this contention.
3.19 HEx PPM MAA was 89.8% at the end of 2016-17, 3.6pp below the Performance
Strategy target. This is a reduction of 1.0pp in the last six periods. The imposition of
a “two-track railway” effectively halving capacity at weekends continues to cause
HEx problems, while train regulation and OLE have also affected performance.
3.20 We continue to monitor Network Rail’s delivery of performance to each of these
TOCs closely, attending liaison meetings with routes and TOCs,
performance/Alliance Boards and quarterly reviews as appropriate.
CaSL
3.21 At the end of 2016-17, four operators (CrossCountry, Grand Central, Merseyrail and
TransPennine Express) met or were ahead of the CaSL targets in their performance
strategies. Merseyrail recorded the lowest (i.e. best) absolute CaSL MAA score
(1.7%), an improvement of 0.2pp relative to performance at the end of 2015-16.
3.22 Other than GTR, the worst performer was Hull Trains. CaSL MAA for this operator
increased (i.e. worsened) by 0.9pp in the last six periods reaching 7.6% at the end
of the year. This was 1.9pp worse than the 2016-17 Performance Strategy target.
3.23 The charts below show all operators’ performance ranked by difference to their
Performance Strategy targets at the end of 2016-17.
Office of Rail and Road | 20 July 2017 Network Rail Monitor Q3-4 2016-17 | 29
74.2%
83.1%
87.1%
89.8%
81.8%
86.1%
94.5%
88.4%
93.1%
88.8%
92.0%
91.9%
94.5%
89.7%
88.8%
95.8%
88.8%
91.1%
85.0%
94.7%
89.1%
-9.8 pp
-3.9 pp
-3.7 pp
-3.6 pp
-3.2 pp
-2.4 pp
-2.2 pp
-1.6 pp
-1.4 pp
-1.3 pp
-1.0 pp
-0.6 pp
-0.6 pp
-0.3 pp
-0.2 pp
0.0 pp
0.1 pp
0.1 pp
0.2 pp
1.3 pp
2.0 pp
-28 -26 -24 -22 -20 -18 -16 -14 -12 -10 -8 -6 -4 -2 0 2
70% 80% 90% 100% 110% 120%
Govia Thameslink Railway
Virgin Trains East Coast
South West Trains
Heathrow Express *
Hull Trains *
Southeastern
c2c
Great Western Railway
Chiltern Railways
Greater Anglia
East Midlands Trains
Arriva Trains Wales
London Overground
CrossCountry
TransPennine Express
Merseyrail
London Midland
Northern
Grand Central *
TfL Rail
Virgin Trains West Coast
Variance to End of YearPerformance Strategy Target (pp)
PPM MAA
PPM MAA 2016-17 Period 13
* Open Access Operators Source: Network Rail
Office of Rail and Road | 20 July 2017 Network Rail Monitor Q3-4 2016-17 | 30
Route scorecards
3.24 Network Rail introduced route scorecards in 2016-17 to monitor its Key
Performance Indicators and to align its train performance targets more closely with
TOC requirements. Most TOCs have agreed a PPM and CaSL target, while some,
e.g. VTEC, have set out a Right Time metric. Train performance accounts for 20%
of a route’s overall score. We use the data in the scorecards as part of the evidence
to determine whether Network Rail is doing everything reasonably practicable to
achieve its regulated performance outputs.
9.2%
6.9%
2.2%
7.6%
4.0%
3.6%
3.1%
2.3%
2.7%
1.8%
2.9%
1.8%
2.4%
2.9%
1.9%
3.0%
3.9%
5.0%
4.0%
1.7%
5.7%
4.5 pp
1.9 pp
0.9 pp
0.9 pp
0.8 pp
0.8 pp
0.6 pp
0.5 pp
0.5 pp
0.5 pp
0.4 pp
0.4 pp
0.3 pp
0.3 pp
0.2 pp
0.1 pp
0.1 pp
0.0 pp
0.0 pp
-0.2 pp
-0.4 pp
-20 -18 -16 -14 -12 -10 -8 -6 -4 -2 0 2 4 6
0% 2% 4% 6% 8% 10% 12% 14% 16%
Govia Thameslink Railway
Virgin Trains East Coast
c2c
Hull Trains *
Southeastern
South West Trains
Greater Anglia
London Overground
TfL Rail
Heathrow Express *
London Midland
Chiltern Railways
East Midlands Trains
Arriva Trains Wales
Northern
Great Western Railway
Virgin Trains West Coast
TransPennine Express
CrossCountry
Merseyrail
Grand Central *
Variance to End of YearPerformance Strategy Target (pp)
CaSL MAA
CaSL MAA 2016-17 Period 13
* Open Access Operators Source: Network Rail
Office of Rail and Road | 20 July 2017 Network Rail Monitor Q3-4 2016-17 | 31
3.25 Scorecards are at a relatively early stage of maturity, and there are still some areas
Network Rail needs to develop, for example:
Year-end forecasts – there is a lack of visibility of the methodology used to
produce the year-end forecasts for agreed performance metrics. Improving
these forecasts will increase the credibility of the metrics in the scorecard.
Prioritisation of effort – When a KPI is irrecoverable there is a possibility that
effort may be diverted to other KPIs that can still be achieved. For example, on
South East Route, it became obvious in the latter part of the year that GTR
PPM/ CaSL and Network Rail delay minutes (which amount to 10% of the
scorecard) were almost certainly going to be missed substantially. In these
cases, we need to be assured that Network Rail does not abandon the pursuit
of target in order to focus on other areas where the target is still deliverable.
Network Rail is addressing these and other issues as the scorecards evolve over
time.
Other performance interventions and measures
Delay minutes
3.26 We monitor Network Rail delay minutes as a key indicator of train performance. As
the chart on page 35 shows, at the end of 2016-17, 61% of delay minutes in
England and Wales were attributable to Network Rail, 29% were “TOC on Self”
(delays to a passenger train operating company's services caused by that
company) and 10% were “TOC on TOC” (delays to a passenger train operator’s
services caused by another train company). The position is broadly consistent with
previous years.
South East Reparations fund
3.27 Following a previous investigation into performance delivery to GTR in 2014-15,
Network Rail agreed to implement a £4.1m reparations fund. This comprised four
distinct activities:
the introduction of dedicated track teams;
the provision of additional station staff;
an expansion of the Land Sheriffs programme; and
the implementation of an Incident Management System (IMS).
3.28 Three of the schemes have been implemented successfully and have delivered a
range of benefits. The implementation of the fourth, IMS, has been delayed pending
its incorporation into a wider national programme. In financial terms, only half the
agreed fund has been spent to date and, while the delay to IMS seems prudent, it
Office of Rail and Road | 20 July 2017 Network Rail Monitor Q3-4 2016-17 | 32
does mean the anticipated benefits have been delayed. We will continue to monitor
progress in this area.
Network capability
3.29 ‘Network capability’ describes the capability of the network in terms of track mileage
and layout, line speed, gauge, route availability and the amount of electrified track.
Network Rail’s network licence requires the company to accurately describe and
maintain (subject to network change) the baseline capability for which it is funded
for the benefit of its stakeholders. For CP5, we said that the baseline capability of
the network would be that in place as at 1 April 2014.
3.30 The industry’s Network Capability Steering Group is the forum for engagement
between Network Rail and a range of industry stakeholders. Whilst we have not
received any formal complaints, a number of operators have raised concerns and
we have tasked Network Rail to improve its processes, so the information the
company holds and that stakeholders rely on adequately reflects the physical state
of the network enabling those stakeholders to plan their businesses with a
reasonable degree of assurance.
Network availability
3.31 Measures of network availability are intended to provide an indication of the impact
of planned engineering work on passengers and freight customers. Network
availability is currently measured using the Possession Disruption Index (PDI) for
Passengers (PDI-P) and Freight (PDI-F).
3.32 Network Rail has identified a number of inaccuracies that have been introduced to
the calculation for PDI-P which are affecting the ability to meet target. In particular,
alterations to service groups resulting from franchise changes since the beginning
of CP5 have resulted in either missing information or an arbitrary change the
estimated number of passengers using an affected service. Therefore, changes to
the value of PDI-P outturn are not necessarily a true reflection of the impact
possessions have on passengers. It is likely that similar issues also effect PDI-F.
3.33 As a result of these inaccuracies, Network Rail has proposed an alternative suite of
measures to monitor network availability. These are based on the processes used
to plan possessions, including the number of access disputes raised and the
number of possessions that attract the maximum notification discount for early
planning.
Office of Rail and Road | 20 July 2017 Network Rail Monitor Q3-4 2016-17 | 33
3.34 However, we require that Network Rail continues to report PDI, with some
modifications, until such time that it is possible to present an appropriate and
industry-agreed solution reflecting the experience of passengers and freight
customers. Further industry engagement on this area will be part of the Outputs
Framework consultation, which will be published at the end of July.
3.35 Network Rail has notified the ORR that the CP5 target for PDI-P is not likely to be
met, largely as a result of the issues identified above, with the possibility of PDI-F
target also being missed.
3.36 We acknowledge the complexities and inaccuracies present in the calculation for
PDI and will account for these in our assessment of Network Rail’s delivery of
network availability. We will also initiate an industry wide engagement exercise with
the aim of gathering further evidence of Network Rail’s behaviour in respect to
upholding the spirit of PDI. We anticipate this will conclude in late 2017.
Freight performance
3.37 The regulatory performance measure for freight is the Freight Delivery Metric
(FDM). This measures the percentage of freight trains arriving at their destination
within 15 minutes of scheduled time. FDM covers delays for which Network Rail is
responsible - i.e. not those caused by freight operators. The FDM at the end of
2016-17 was 94.4% 1.9pp ahead of the annual target of 92.5%.

Office of Rail and Road | 20 July 2017 Network Rail Monitor Q3-4 2016-17 | 34
90.8%
91.4%
91.5%
91.9%
92.3%
92.4%
92.5%
93.0%
93.2%
94.0%
94.3%
94.7%
95.4%
95.6%
95.7%
95.8%
95.8%
97.1%
97.4%
97.8%
85% 90% 95% 100%
Felixstowe/Thameside to Yorks
Southampton to West Mids/North West
Somerset to London/South East
East Mids/Peak Forest to London/South East
Felixstowe/Thameside to Mids/North West/Scotland
South East Local
Scotland to North West/Daventry/West Mids
Southampton to Yorks
South Wales to West Mids/North West
South Wales to London
South Wales to North East
Channel Tunnel to Daventry/West Mids/Wembley
Mail Traffic
North West and Cross Pennines
Scotland to Tyne/Tees/Yorks/East Mids
South Wales and West Locals
Mids Local
Miscellaneous
Immingham/Tyne to Yorks/Mids
Yorks Local
FDM MAA
FDM MAA by Strategic Freight Corridor - 2016-17 Period 13England and Wales: 94.2%
Source: Network Rail

Office of Rail and Road | 20 July 2017 Network Rail Monitor Q3-4 2016-17 | 35
61%
61%
63%
60%
54%
63%
51%
53%
71%
63%
70%
55%
58%
62%
63%
71%
71%
66%
67%
68%
58%
61%
37%
25%
35%
17%
36%
20%
41%
34%
9%
10%
14%
30%
16%
29%
25%
25%
24%
11%
22%
11%
39%
29%
3%
14%
2%
23%
11%
17%
8%
13%
20%
27%
16%
15%
26%
9%
12%
4%
5%
23%
11%
21%
3%
10%
95.8%
94.7%
94.5%
94.5%
93.1%
92.0%
91.9%
91.1%
89.8%
89.7%
89.1%
88.8%
88.8%
88.8%
88.4%
87.1%
86.1%
85.0%
83.1%
81.8%
74.2%
87.4%
1.7%
2.7%
2.2%
2.3%
1.8%
2.4%
2.9%
1.9%
1.8%
4.0%
3.9%
2.9%
5.0%
3.1%
3.0%
3.6%
4.0%
5.7%
6.9%
7.6%
9.2%
4.0%
218,100
82,100
127,100
490,400
142,900
158,300
328,200
868,600
50,500
103,400
102,800
423,900
85,100
440,500
529,600
593,600
651,100
6,400
51,100
4,600
1,096,900
6,555,000
0% 200% 400% 600% 800% 1000% 1200% 1400%
0% 20% 40% 60% 80% 100% 120% 140%
Merseyrail
TfL Rail
c2c
London Overground
Chiltern Railways
East Midlands Trains
Arriva Trains Wales
Northern
Heathrow Express
CrossCountry
Virgin Trains West Coast
London Midland
TransPennine Express
Abellio Greater Anglia
Great Western Railway
South West Trains
Southeastern
Grand Central
Virgin Trains East Coast
Hull Trains
Govia Thameslink Railway
- ENGLAND & WALES -
Proportion of Total Delay Minutes by Responsible Category: 2016-17
Network Rail on TOC Delays TOC on Self Delays Delays to TOC caused by another operator
PPMMAA
CaSLMAA
Trains Planned(Rounded)
Source: Network Rail

Office of Rail and Road | 20 July 2017 Network Rail Monitor Q3-4 2016-17 | 36
4. Asset management
Asset performance
4.1 During the first two years of CP5, Network Rail achieved a significant reduction in
service-affecting asset failures across the network, with the overall Composite
Reliability Index (CRI) showing a 14.8% improvement relative to the end of CP4.
This year asset performance has continued to improve for the network as a whole,
but by a smaller amount, with CRI rising to 15.8% by year-end. This is still well
ahead of the improvement trajectory Network Rail originally planned for CP5.
4.2 Wales and South East routes improved the most during the year, with in-year CRI
gains of 16.7pp and 13.7pp respectively. South East and Wessex have both made
considerable improvements of more than 25% since the end of CP4, although
Wessex actually declined by 4.7pp during the year after exceeding 30% in the
previous year. CRI improved by 4.0pp in LNW, but fell by 4.2pp in Western, which
has now improved by only 7.7pp since the end of CP4. There were slight falls of
around 1pp or less in in Anglia, LNE/EM and Scotland.
14.6%
0%
2%
4%
6%
8%
10%
12%
14%
16%
18%
2014-15 2015-16 2016-17
CRI
Financial Year
MAA
Source: Network Rail
CRI 2014-15 to 2016-17 (GB Network)
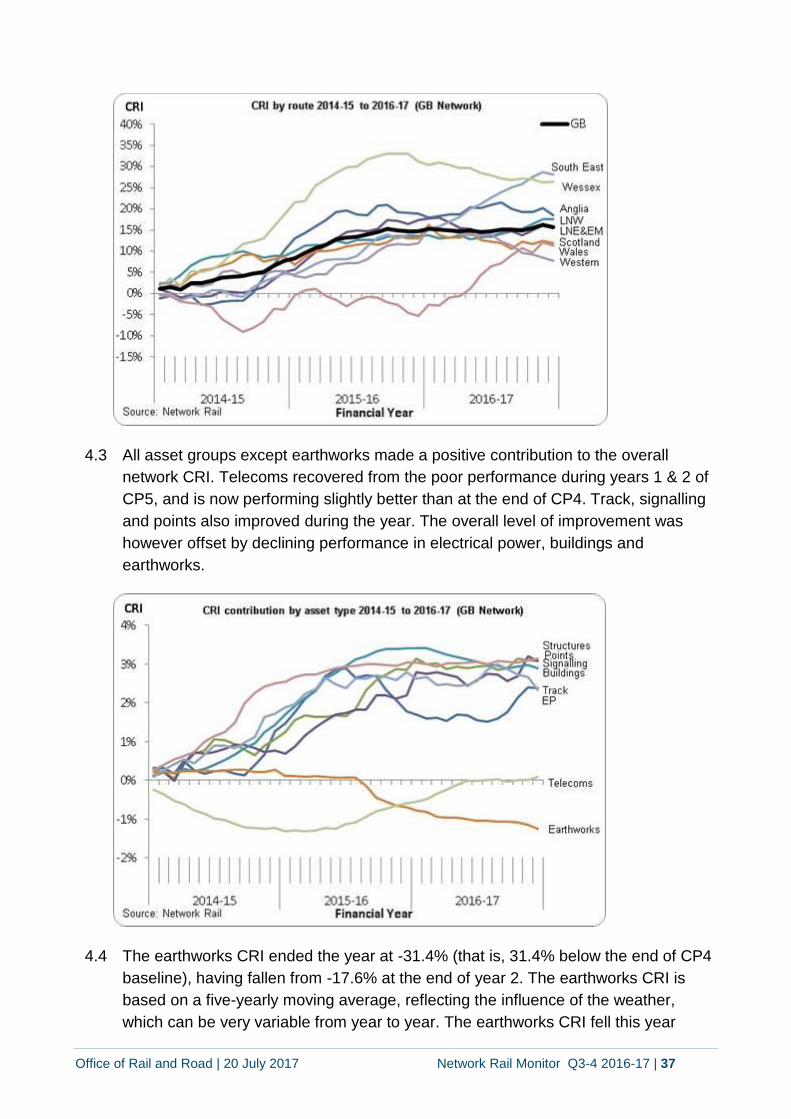
Office of Rail and Road | 20 July 2017 Network Rail Monitor Q3-4 2016-17 | 37
4.3 All asset groups except earthworks made a positive contribution to the overall
network CRI. Telecoms recovered from the poor performance during years 1 & 2 of
CP5, and is now performing slightly better than at the end of CP4. Track, signalling
and points also improved during the year. The overall level of improvement was
however offset by declining performance in electrical power, buildings and
earthworks.
4.4 The earthworks CRI ended the year at -31.4% (that is, 31.4% below the end of CP4
baseline), having fallen from -17.6% at the end of year 2. The earthworks CRI is
based on a five-yearly moving average, reflecting the influence of the weather,
which can be very variable from year to year. The earthworks CRI fell this year
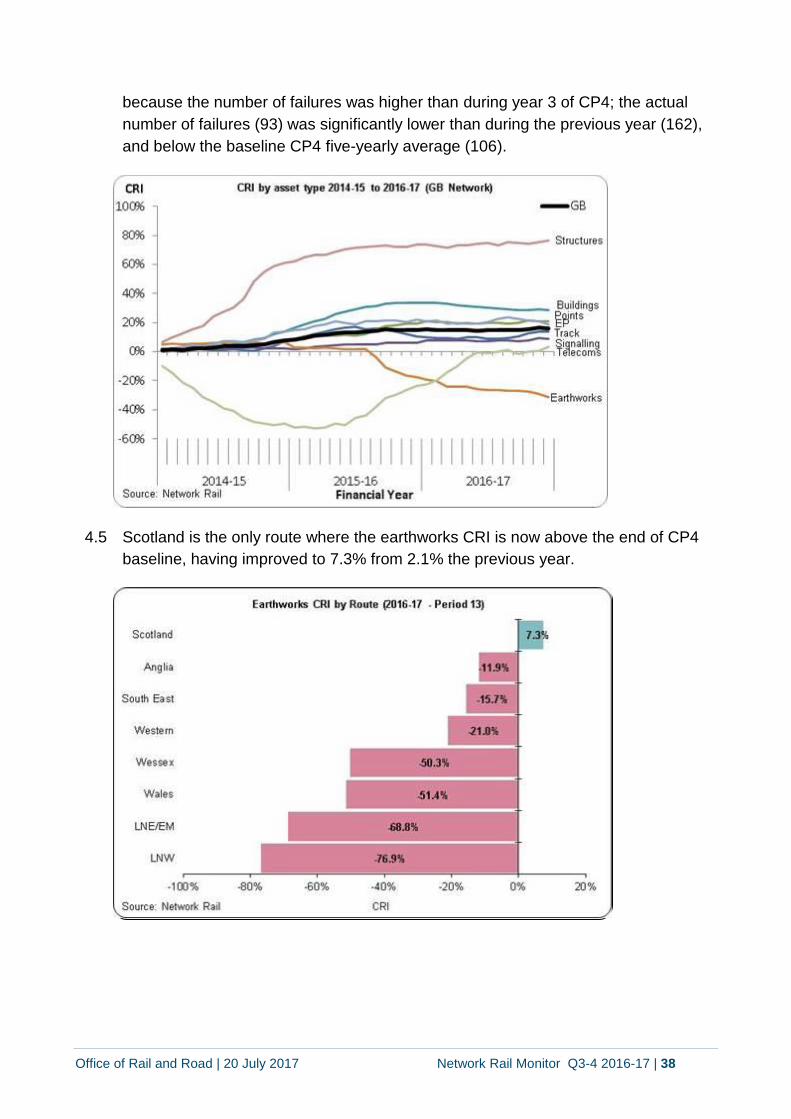
Office of Rail and Road | 20 July 2017 Network Rail Monitor Q3-4 2016-17 | 38
because the number of failures was higher than during year 3 of CP4; the actual
number of failures (93) was significantly lower than during the previous year (162),
and below the baseline CP4 five-yearly average (106).
4.5 Scotland is the only route where the earthworks CRI is now above the end of CP4
baseline, having improved to 7.3% from 2.1% the previous year.
-72.0%
-65.3%
-54.1%
-33.8%
-12.9%
-4.7%
-4.7%
3.2%
-80% -70% -60% -50% -40% -30% -20% -10% 0% 10%
LNE/EM
LNW
Wessex
Wales
South East
Anglia
Western
Scotland
Source: Network Rail CRI
Earthworks CRI by Route (2016-17 - Period 7)

Office of Rail and Road | 20 July 2017 Network Rail Monitor Q3-4 2016-17 | 39
Asset sustainability
4.6 Maintaining and renewing the network is fundamental to Network Rail’s
responsibilities. Regular maintenance counters the effects of wear and aging to
keep the assets safe and performing as intended, but eventually it becomes
uneconomic or impractical to maintain them any longer and they have to be
renewed.
4.7 Network Rail’s asset policies set out its approach to renewing the network assets so
that overall condition is sustained on the basis of least whole life cost. The volume
of renewals work required during CP5 in accordance with these policies was set out
by Network Rail in its 2014 delivery plan (DP14), so we monitor the actual volume of
work delivered to understand whether Network Rail is doing enough to sustain the
network.
4.8 During the first year of CP5 (2014-15), the volume of renewals work completed by
Network Rail was significantly less than planned. The situation improved last year to
finish on plan for the year overall except in some areas of civils renewals, but we
were concerned that Network Rail’s plan for the year had deferred a significant
proportion of the 2015-16 renewals originally planned in DP14. We were also
concerned that the cost of delivering renewals was significantly higher than budget.
4.9 This year civils renewals finished ahead of Network Rail’s business plan for the year
DP17 (13% ahead on underbridges, and 93% ahead on earthworks). This was
partly as a result of completing projects that were not finished as planned at the end
of last year. Signalling renewals were slightly below plan due to the re-phasing of
the Scotland Accelerated National Operating Strategy (SANOS) South scheme in
Scotland into next year. Plain line track renewal was 12% behind plan, mainly
because of lost production by the high output track renewal fleet.
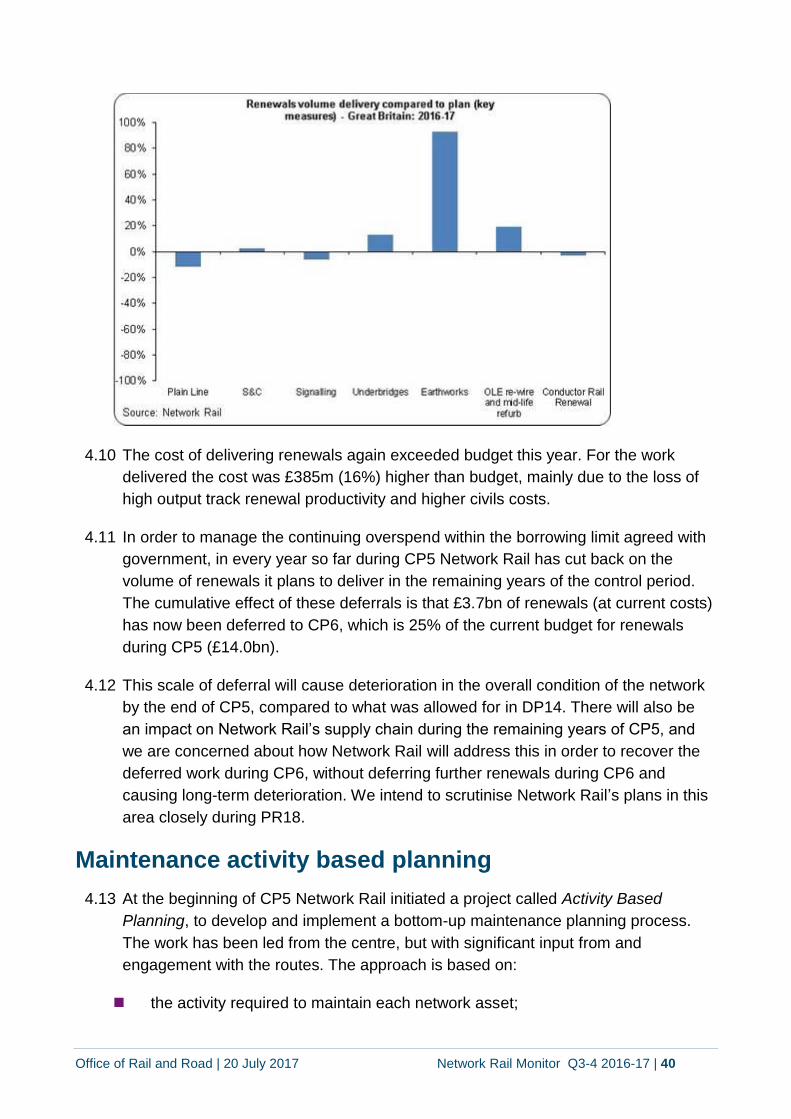
Office of Rail and Road | 20 July 2017 Network Rail Monitor Q3-4 2016-17 | 40
4.10 The cost of delivering renewals again exceeded budget this year. For the work
delivered the cost was £385m (16%) higher than budget, mainly due to the loss of
high output track renewal productivity and higher civils costs.
4.11 In order to manage the continuing overspend within the borrowing limit agreed with
government, in every year so far during CP5 Network Rail has cut back on the
volume of renewals it plans to deliver in the remaining years of the control period.
The cumulative effect of these deferrals is that £3.7bn of renewals (at current costs)
has now been deferred to CP6, which is 25% of the current budget for renewals
during CP5 (£14.0bn).
4.12 This scale of deferral will cause deterioration in the overall condition of the network
by the end of CP5, compared to what was allowed for in DP14. There will also be
an impact on Network Rail’s supply chain during the remaining years of CP5, and
we are concerned about how Network Rail will address this in order to recover the
deferred work during CP6, without deferring further renewals during CP6 and
causing long-term deterioration. We intend to scrutinise Network Rail’s plans in this
area closely during PR18.
Maintenance activity based planning
4.13 At the beginning of CP5 Network Rail initiated a project called Activity Based
Planning, to develop and implement a bottom-up maintenance planning process.
The work has been led from the centre, but with significant input from and
engagement with the routes. The approach is based on:
the activity required to maintain each network asset;
Office of Rail and Road | 20 July 2017 Network Rail Monitor Q3-4 2016-17 | 41
the labour, plant and materials required to deliver that maintenance; and
their costs.
4.14 These have been assessed individually for each maintenance delivery unit, using its
own records of time taken to complete standard jobs, time spent travelling to site,
material costs, etc. The large number of maintenance standard jobs has been
rationalised and standardised across routes and delivery units, and maintenance
reporting is being restructured to differentiate between planned preventative
activities, and fault-finding and fixing.
4.15 During the year, the project rolled out a planning tool implementing the approach.
The tool is now being used by the routes and their maintenance delivery units to
build up their plans for CP6. Some routes have also used it to validate their plans
for the remainder of CP5. For the first time, managers can see how maintenance
costs arise. The approach also generates a bottom-up requirement for the on-track
machines used by maintenance, which will allow Network Rail to manage the supply
of these resources more effectively to meet demand across the network as a whole.
4.16 We see this improved capability as a major step forward. We envisage it will
promote wider adoption of risk-based maintenance and remote condition
monitoring, as part of Network Rail’s wider maintenance strategy to move towards
an increasingly preventative maintenance regime.
ORBIS milestones
4.17 ORBIS stands for Offering Rail Better Information Services. It is an ambitious
programme aimed at improving asset management capability through improved
information management. It involves adopting consistent data specifications,
providing simpler mobile data capture tools, replacing out-dated asset information
systems, and providing improved decision support tools. For CP5 we set specific
regulatory outputs based on key milestones in Network Rail’s programme, to help
ensure it delivers all the benefits expected.
4.18 Prior to this year Network Rail had met all of these milestones. However, in June
2016 it missed the milestone for replacing the existing Civils Asset Register and
Reporting System (CARRS) with a new Ellipse-based asset management system
for civils structures known as CSAMS. Then in December 2016 Network Rail
missed the milestone to decommission GEOGIS, its legacy system covering
information, including location, on track and structures assets. Network Rail is now
expecting to achieve both milestones later in 2017. We will make an adjustment to
Network Rail’s 2016-17 financial performance to reflect these missed regulatory
outputs.
Office of Rail and Road | 20 July 2017 Network Rail Monitor Q3-4 2016-17 | 42
Asset management capability
4.19 During CP4, we assessed Network Rail’s asset management capability using
AMCL’s methodology known as AMEM. This is a benchmarking methodology
reflecting best practice across a number of industry sectors including rail. It is
aligned with what has since emerged as the international standard for asset
management, ISO 55000. For CP5 we set Network Rail the objective of achieving
excellence in asset management during CP5, as measured by AMEM, and we
made this a regulated output to underline its importance. Our strategy was to
ensure that Network Rail’s capability had improved in time for PR18, so that the
efficiency benefits would underpin its plans for CP6, and so we said the output
should be achieved by January 2018 rather than at the end of CP5.
4.20 To confirm whether Network Rail is on course to achieve the output we also said
that we would conduct an interim AMEM assessment partway into CP5. This
assessment has now been completed. It found that progress towards achievement
of the regulated output was mixed. One of six targets had already been achieved,
but in general much more needed to be done to apply initiatives at route level.
AMCL’s view was that in some areas, the process of devolution had resulted in a
loss of clarity about systems and processes, and the new arrangements had not yet
settled in and become robust. Network Rail believed it understood where these
shortfalls were, and had plans in place to achieve the regulated output in time for
the CP6 SBP submission, due in December 2017.
Asset data quality
4.21 The development and application of asset policy, and the use of advanced decision
support tools, are heavily reliant on Network Rail maintaining a comprehensive and
reliable dataset of information about all the network assets and their condition. In
PR13 we assessed the quality of Network Rail’s asset data and found it variable, so
for CP5 we set Network Rail the objective of delivering an improved asset dataset,
and we made it a regulated output to be achieved by April 2017, to support the
PR18 planning process. We said Network Rail should demonstrate A2 data quality
for the core asset data used in asset management decision making, which means it
should be maintained by an overarching information management system (A), and
that the data itself should be appropriately accurate and reliable (2).

Office of Rail and Road | 20 July 2017 Network Rail Monitor Q3-4 2016-17 | 43
4.22 Network Rail has responded by developing an approach that sees asset information
itself managed as an asset, to be maintained and renewed, with assurance
arrangements analogous to the arrangements for physical network assets, including
the appointment of a professional head. This is a best practice approach, and
reflects the requirements of the international standard for data quality, ISO8000.
This year Network Rail has been rolling out these arrangements in the routes,
including organising the resources necessary to manage asset data quality at route
level, and developing risk registers to focus action on priority areas.
4.23 We are currently assessing Network Rail’s evidence that it achieved the A
requirement in April 2017 and we expect to have reached a conclusion in August.
We are also in dialogue about how it will demonstrate the accuracy and reliability of
the data in its core asset dataset.

Office of Rail and Road | 20 July 2017 Network Rail Monitor Q3-4 2016-17 | 44
5. Developing the network
5.1 As reported in the previous monitors, Network Rail completed a re-planning
exercise in November 2015 called the Hendy Review. The purpose was to establish
a re-scheduled plan of England and Wales project milestones that would be
deliverable and affordable in CP5. Network Rail reflected the outcome of the Hendy
Review in a revised Enhancements Delivery Plan (EDP), published in March 2016.
This delivery plan, which is updated regularly, sets out Network Rail’s obligations to
its customers and rail users for enhancement projects in CP5. We continue to
monitor progress against the EDP.
Delivery progress
5.2 We monitor Network Rail against two major milestones:
the end of GRIP Stage 3 – this is the end of the development process where a
single option for design and delivery is selected; and
GRIP Stage 6/Entry into Service (EIS) – this is when construction is
substantively complete and services can begin.
5.3 Network Rail delivered 13 of the 19 GRIP Stage 6/EIS milestones it planned to
deliver since the March 2016 enhancements delivery plan was published. In the
second half of the year, this includes the completion of works originally planned for
Control Period 4 on the Midland Mainline to improve journey times between
Sheffield and St. Pancras. Network Rail also completed East West Rail Phase 1 to
enable journeys between London Marylebone and Oxford via Bicester.
5.4 Network Rail missed five GRIP Stage 6/EIS milestones in 2016-17. The three
missed in the second half of the year are:
Weather Resilience Fund - High Wind - LNE - a project to install light weight
portals on the Overhead Lines to improve the resilience to high winds;
Weather Resilience Fund - Coastal - SE - Enhanced Coastal Defences at
Folkestone Warren; and
Edinburgh to Glasgow Improvements Programme (EGIP) - Initial Phase Key
Output 1 (commentary on this project can be found in our Scotland Monitor).
5.5 During 2016-17, Network Rail completed 14 (GRIP 3) development milestones on
schedule, against a total of 22. The missed milestones in the second half of the year
were:
Northallerton to Newcastle Freight Loops
Access to Assets in the Western Route

Office of Rail and Road | 20 July 2017 Network Rail Monitor Q3-4 2016-17 | 45
South London High Voltage Grid (Wimbledon) upgrade (Phase 2)
East Coast Main Line (ECML) traction power supply upgrade7
5.6 Four milestones were revised in the year following the change control process
agreed between Network Rail its funders, stakeholders, and ORR (see below).
5.7 More information on Network Rail’s performance against its milestones can be
found here.
Projects at risk
5.8 As reported in previous monitors, the electrification of the Great Western mainline is
the highest profile programme at risk in the England and Wales portfolio of
enhancement projects. Both December 2016 milestones were completed on time
for two Great Western projects. These were Route Wide Capability Works for Train
Infrastructure Interfaces and Mainline Routes Gauge Capability. The routes
involved were the core main lines between London Paddington, Bristol, Plymouth,
Swansea and Worcester.
5.9 During the second half of the year, one new Great Western project started, the
North Cotswolds Line platform extensions. Work comprises platform extensions at
seven stations. This will facilitate use of these stations by the new Class 800 trains
when running in 2 x 5-car formation.
5.10 Significant progress has been made in the last six months, with successful
Christmas 2016 works and the installation of overhead line equipment through the
Severn and Patchway tunnels. New trains have been able to use the test section
between Tilehurst and Didcot for pre-service commissioning and acceptance trials.
5.11 In response to the deferral of approximately 15% of its scope (see last monitor) the
Great Western electrification programme has revised its delivery milestones. We
have carried out a validation exercise on the new programme and concluded that:
the content of the next major delivery milestone in December 2017,
electrification between Maidenhead and Didcot, is readily identifiable and will
allow ORR and others confidence to determine whether the full scope of works
has been delivered;
the likelihood of on time completion is good, but there are significant difficulties
left to overcome, such as shortage of possession access on this part of the
route in the second half of 2017; and
7 A change control for this milestone is currently under review.
Office of Rail and Road | 20 July 2017 Network Rail Monitor Q3-4 2016-17 | 46
we sought a period of programme stability to test that Network Rail was
delivering this programme efficiently. The calendar year 2017 provides a
suitable baseline to demonstrate this is being achieved
5.12 EGIP has performed below expectations. Key Output 1 (delivery of the
infrastructure required for electric train services to begin operation) a regulated
milestone, was missed in March 2017. This is a major failure for Network Rail on its
largest and most high profile project in Scotland and follows a year of poor
productivity on site, complications with Network Rail’s compliance to legal
electrification standards and uncontrolled cost increases. (More detail on EGIP is
included in the Scotland monitor).
5.13 The Gospel Oak to Barking Project failed to reach a significant milestone in
February 2017 and did not reach its regulated milestone in June 2017. This is a
significant failure for Network Rail as the infrastructure was returned into use with a
temporary capability at one location below that which was available before the work
started. Network Rail must now agree a strategy for taking possession of the
railway to complete the works as planned which will cause freight and passenger
services to be altered and passenger journeys to be affected. We will continue to
monitor this situation closely.
Changes to future milestones
5.14 The EDP sets out Network Rail’s obligations to funders and customers. Network
Rail regularly updates this document so that customers can rely on it in the planning
of their businesses.
5.15 Changes to the England and Wales enhancements portfolio require Network Rail
and DfT approval at a portfolio board. This is part of a process that allows the
effective management of project and portfolio baselines for outputs and funding. It
supports transparent decision-making and allows the impact of change to be
assessed. ORR approval is required for any change to Network Rail’s obligations to
its customers, as described in its regulated outputs in the EDP. Our decision letters
and a breakdown of the reasons given for the change control can be found on our
website.
Enhancements Improvement Programme (EIP)
5.16 It is approximately 18 months since Network Rail re-baselined a final version of the
EIP, in response to our investigation and decision in October 2015 that the
company was in breach of its licence regarding its management and delivery of
enhancement projects. During the year, Network Rail has made good progress
against its schedule of improvement activities. We are taking an independent view
Office of Rail and Road | 20 July 2017 Network Rail Monitor Q3-4 2016-17 | 47
of how the products have been embedded in the business and are sampling six
projects and programmes across GB. We will report on this in our next Monitor.
5.17 Network Rail has said that it will take time for the benefits of EIP to be realised and
it is therefore difficult at this time to say whether Network Rail’s capability has
improved. We are working with the company to understand how benefits should be
evidenced and monitored to provide the required evidence that the EIP has had the
desired effect of improving capability. We will report on the progress in our next
Monitor.
5.18 The Independent Reporter has been carrying out assurance activities on some of
the EIP workstreams. The resulting report is published alongside this monitor.
5.19 A summary of progress against each of the seven EIP workstreams is set out
below.
Clienting and governing the enhancement portfolio
5.20 In England and Wales, DfT acts as client for the enhancements portfolio. In broad
terms, the governance for the portfolio is via a series of programme boards which
make decisions on changes to any outputs or cost. There is also a Portfolio Board
which gives final approval to any changes and manages the affordability of the
portfolio. Both the portfolio and the programme boards are chaired by the DfT.
Similar arrangements are in place in Scotland with Transport Scotland acting as
client.
Project sponsorship and transition management
5.21 This workstream will improve the competency of project sponsors across Network
Rail. A new Head of Sponsorship is now in place and plans to enhance Network
Rail’s sponsorship capability are being implemented. Further plans to build on and
improve the sponsorship discipline will continue beyond the timescales of the EIP.
Cost planning, estimating risk and value management
5.22 This workstream is essential to improving the quality of project estimates throughout
the project lifecycle and should deliver more robust estimating to support the
periodic review process. There has been some delay to the programme on
resourcing and sourcing new software.
Project governance and gateway assurance
5.23 Network Rail has now started implementing peer reviews – short, focused reviews
undertaken at key decision points in the GRIP project or programme lifecycle.
These are undertaken by Network Rail staff who are independent from the project
team and business unit responsible for the successful delivery of the
Office of Rail and Road | 20 July 2017 Network Rail Monitor Q3-4 2016-17 | 48
project/programme. As part of the reporting from the Independent Reporter we have
seen evidence of the peer reviews taking place and actions being taken as a result.
Project portfolio monitoring
5.24 This workstream covers the implementation of a new project portfolio monitoring
system. This system is intended to deliver new ways of monitoring project and
programme performance for Network Rail projects. The aim is to change the
emphasis from reactive reporting to proactively examining measures such as future
schedule and detailed analysis of projects’ safety performance.
5.25 The system was developed to include the functionality specified to meet the EIP
requirements, so Network Rail is reporting this workstream as complete.
Subsequently the company has added plans to increase the functionality of the
system. It is planning to have it embedded in the organisation in October 2017.
Project delivery capability
5.26 Network Rail has created a programme, commercial and development function in its
Investment Projects directorate. This function will provide a more structured
approach to improving the capacity and capability of its people for these aspects of
programme management. As part of this workstream, critical resource supply and
demand modelling has also been completed. This will be essential in planning for
the long-term workbank into the next control period.
Safety by design
5.27 Network Rail issued a Safety by Design policy in December 2016. The policy aims
to reduce future safety risk when new infrastructure is designed. We have seen
evidence of the application of the policy. However we remain concerned about how
Network Rail will monitor the benefits of this workstream (which may take several
years to materialise) to ensure that the policy is achieving the aims it set out to, and
that any required amendments to the policy are captured at the earliest opportunity.
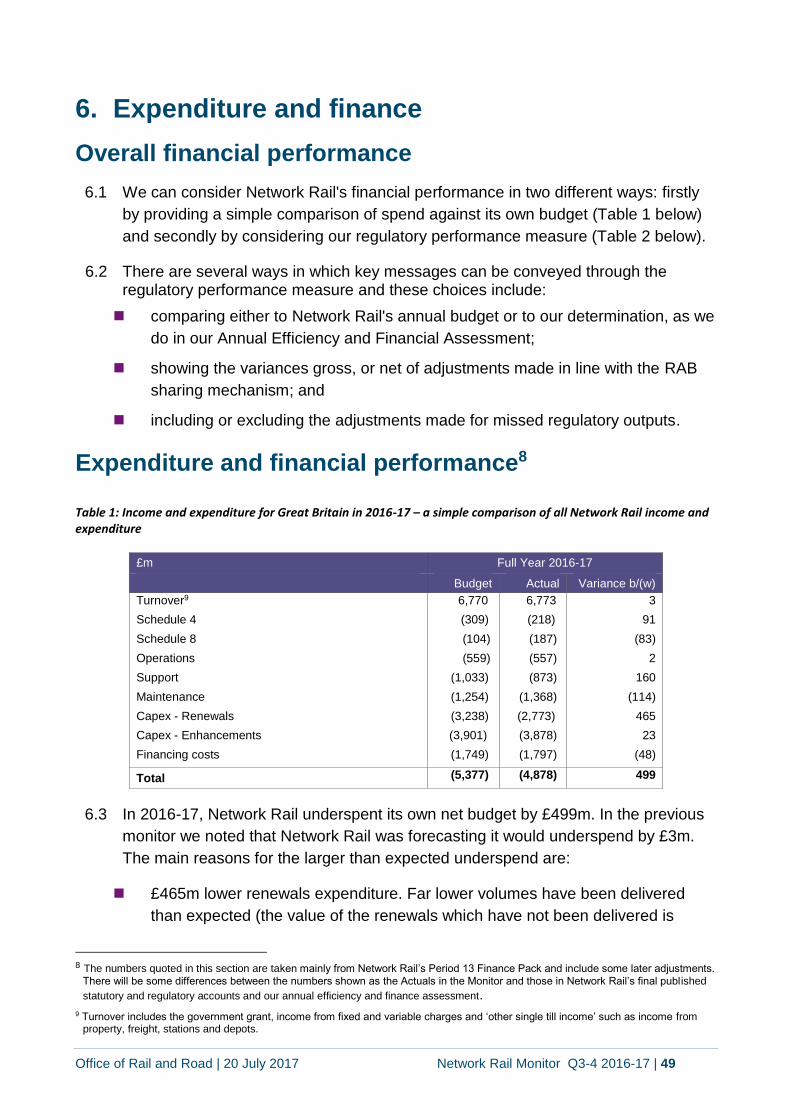
Office of Rail and Road | 20 July 2017 Network Rail Monitor Q3-4 2016-17 | 49
6. Expenditure and finance
Overall financial performance
6.1 We can consider Network Rail's financial performance in two different ways: firstly
by providing a simple comparison of spend against its own budget (Table 1 below)
and secondly by considering our regulatory performance measure (Table 2 below).
6.2 There are several ways in which key messages can be conveyed through the regulatory performance measure and these choices include:
comparing either to Network Rail's annual budget or to our determination, as we
do in our Annual Efficiency and Financial Assessment;
showing the variances gross, or net of adjustments made in line with the RAB
sharing mechanism; and
including or excluding the adjustments made for missed regulatory outputs.
Expenditure and financial performance8 Table 1: Income and expenditure for Great Britain in 2016-17 – a simple comparison of all Network Rail income and expenditure
£m Full Year 2016-17
Budget Actual Variance b/(w)
Turnover9 6,770 6,773 3
Schedule 4 (309) (218) 91
Schedule 8 (104) (187) (83)
Operations (559) (557) 2
Support (1,033) (873) 160
Maintenance (1,254) (1,368) (114)
Capex - Renewals (3,238) (2,773) 465
Capex - Enhancements (3,901) (3,878) 23
Financing costs (1,749) (1,797) (48)
Total (5,377) (4,878) 499
6.3 In 2016-17, Network Rail underspent its own net budget by £499m. In the previous
monitor we noted that Network Rail was forecasting it would underspend by £3m.
The main reasons for the larger than expected underspend are:
£465m lower renewals expenditure. Far lower volumes have been delivered
than expected (the value of the renewals which have not been delivered is
8 The numbers quoted in this section are taken mainly from Network Rail’s Period 13 Finance Pack and include some later adjustments.
There will be some differences between the numbers shown as the Actuals in the Monitor and those in Network Rail’s final published
statutory and regulatory accounts and our annual efficiency and finance assessment.
9 Turnover includes the government grant, income from fixed and variable charges and ‘other single till income’ such as income from property, freight, stations and depots.

Office of Rail and Road | 20 July 2017 Network Rail Monitor Q3-4 2016-17 | 50
£800m) and this work will be delivered at a later date (see Table 2 below)10.
Taking this into account the cost of the work Network Rail has done was £335m
higher than expected (adjusted to £84m in line with the RAB sharing
mechanism). This is largely due to less work being delivered by high output
plant and higher costs for the work done; additional contractor claims; and
delays to signalling projects. It has also not delivered its planned efficiency
initiatives;
an underspend against budget of £91m on schedule 4 costs largely due to the
reduced renewal activity and benign weather generally, particularly during the
winter; and
£160m lower support costs than budgeted largely due to a favourable
reassessment of insurance liabilities and group contingency not required. There
was also a reduction in traction electricity charges. These lower charges are
passed on to the train operators, also resulting in lower income.
6.4 There have also been some notable overspends:
increased Schedule 8 compensation for delays (£83m) is largely due to asset
failures (for example in signalling or in overhead supply lines) and including
large one-off events such as flooding, landslips and fires. Examples are severe
flooding in London in June 2016 (£10m), Storm Doris (£10m) and the landslip in
Watford (£5m);
higher maintenance costs (£114m) partly due to lower than planned efficiencies
delivered by the routes; £22m from reactive maintenance which had been
largely budgeted within renewals; higher costs of civils inspections mainly
because of restricted access to sites; additional investment in performance
improvement programmes; increased levels of maintenance needed because of
the delay in renewals projects; and
higher financing costs (£48m) mostly due to higher inflation.
Regulatory financial performance
6.5 As described in paragraph 6.1 above, we also use our regulatory performance
measure to monitor Network Rail’s performance. This measure provides a better
calculation of Network Rail’s performance because it:
excludes certain types of income and expenditure that are not as controllable by
Network Rail. These include network grant, fixed track access charges, traction
electricity income and costs and business rates;
10 Volumes here includes both work in progress and work commissioned on all asset types whereas volumes discussed in the Asset
Management section of this monitor (Section 4) includes work commissioned only on some asset types for which volumes are reported. Therefore, the comments on volumes in this section are not directly comparable to those in the asset management section.
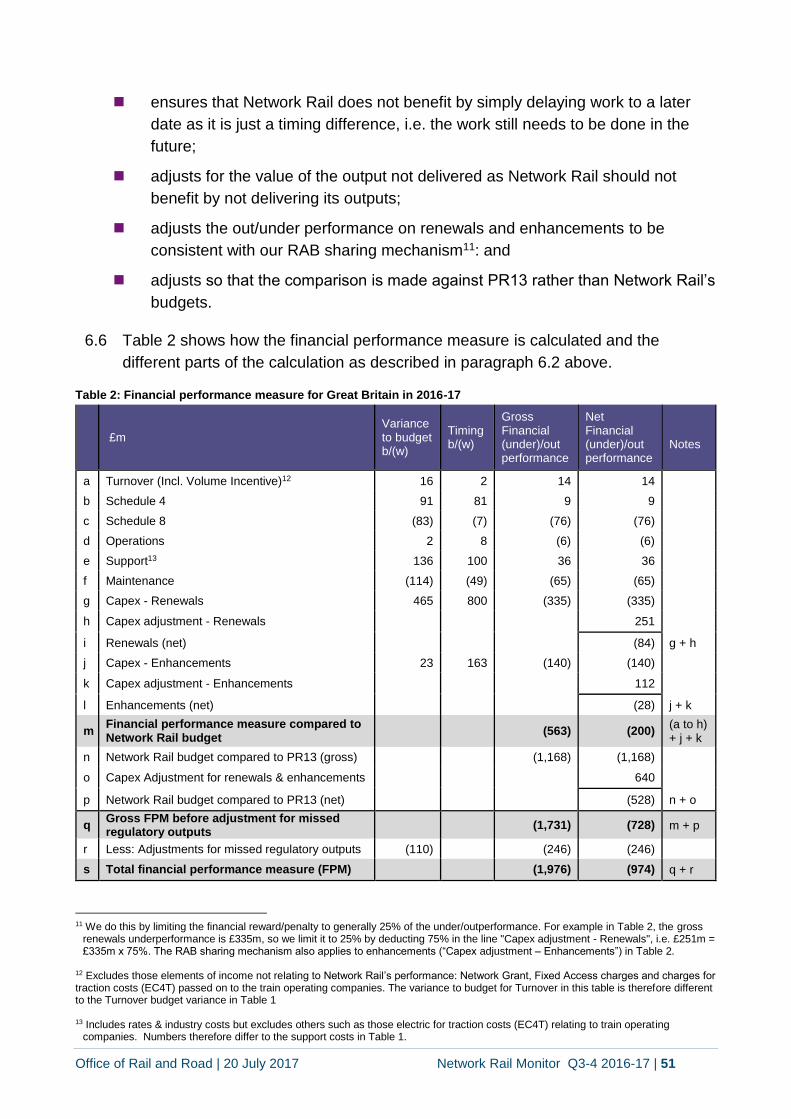
Office of Rail and Road | 20 July 2017 Network Rail Monitor Q3-4 2016-17 | 51
ensures that Network Rail does not benefit by simply delaying work to a later
date as it is just a timing difference, i.e. the work still needs to be done in the
future;
adjusts for the value of the output not delivered as Network Rail should not
benefit by not delivering its outputs;
adjusts the out/under performance on renewals and enhancements to be
consistent with our RAB sharing mechanism11: and
adjusts so that the comparison is made against PR13 rather than Network Rail’s
budgets.
6.6 Table 2 shows how the financial performance measure is calculated and the
different parts of the calculation as described in paragraph 6.2 above.
Table 2: Financial performance measure for Great Britain in 2016-17
£m Variance to budget b/(w)
Timing b/(w)
Gross Financial (under)/out performance
Net Financial (under)/out performance
NNotes
a Turnover (Incl. Volume Incentive)12 16 2 14 14
b Schedule 4 91 81 9 9
c Schedule 8 (83) (7) (76) (76)
d Operations 2 8 (6) (6)
e Support13 136 100 36 36
f Maintenance (114) (49) (65) (65)
g Capex - Renewals 465 800 (335) (335)
h Capex adjustment - Renewals 251
i Renewals (net) (84) g + h
j Capex - Enhancements 23 163 (140) (140)
k Capex adjustment - Enhancements 112
l Enhancements (net) (28) j + k
m Financial performance measure compared to Network Rail budget
(563) (200) (a to h) + j + k
n Network Rail budget compared to PR13 (gross) (1,168) (1,168)
o Capex Adjustment for renewals & enhancements 640
p Network Rail budget compared to PR13 (net) (528) n + o
q Gross FPM before adjustment for missed regulatory outputs
(1,731) (728) m + p
r Less: Adjustments for missed regulatory outputs (110) (246) (246)
s Total financial performance measure (FPM) (1,976) (974) q + r
11 We do this by limiting the financial reward/penalty to generally 25% of the under/outperformance. For example in Table 2, the gross
renewals underperformance is £335m, so we limit it to 25% by deducting 75% in the line "Capex adjustment - Renewals", i.e. £251m = £335m x 75%. The RAB sharing mechanism also applies to enhancements (“Capex adjustment – Enhancements”) in Table 2.
12 Excludes those elements of income not relating to Network Rail’s performance: Network Grant, Fixed Access charges and charges for traction costs (EC4T) passed on to the train operating companies. The variance to budget for Turnover in this table is therefore different to the Turnover budget variance in Table 1 13 Includes rates & industry costs but excludes others such as those electric for traction costs (EC4T) relating to train operating
companies. Numbers therefore differ to the support costs in Table 1.
Office of Rail and Road | 20 July 2017 Network Rail Monitor Q3-4 2016-17 | 52
6.7 Network Rail's 'gross' underperformance, i.e. without the adjustments described in
the third and fourth bullet points in paragraph 6.5 above, is £1,731m. This is
because:
Network Rail's gross financial performance for the full year is £563m adverse to
its own budget. This is largely because, compared to its own budget, it has
underperformed on Schedule 8 compensation payments (£76m), maintenance
(£65m), renewals (£335m), and enhancements (£140m) as explained above;
and
Network Rail's 2016-17 budget was itself £1,168m worse, on a gross FPM basis
(on a net FPM basis it was £528m worse) than our determination. This is mainly
due to lower planned efficiencies and higher unit costs than previously assumed
across most core business activities.
6.8 There are £246m of adjustments for its underdelivery of the PPM and CaSL train
performance regulatory outputs and for missing two of nine outputs for ORBIS in
2016-17. Including these adjustments, the total gross underperformance is £1,976m
as shown in Table 2 above.
6.9 The net underperformance compared to our determination and as the basis for
REBS calculations, is £974m in 2016-17 as shown in Table 2 above. This is the
Total gross FPM of £1,976 reduced by the three Capex adjustments (shown in rows
h, k & o of the table).
6.10 One of the key issues in calculating the Financial Performance Measure is how
Network Rail's deferral of volumes has been treated, particularly as the total value
of volumes that have not been delivered in 2016-17 but will be delivered at a later
date is £963m, (£800m on renewals and £163m on enhancements). The high level
of deferrals increases the risk that asset performance (and hence network
performance) deteriorates, increasing the whole life cost of the railway as additional
maintenance (both planned and reactive) is required in the interim. The continuing
high level of deferrals also makes it harder for Network Rail to adequately increase
renewals volumes in the future to compensate.
6.11 As can be seen in Table 2 above, taking into account deferrals, the financial
underperformance is mainly driven by renewals and enhancements as explained
below:
the gross renewals underperformance of £335m was largely due to: less track
work (£132m) being delivered by the high output plant where work could not be
carried out. This led to additional contractor claims and reduced volumes and
higher cost of work actually delivered; the impact of additional scope and
emergency work on civils as well as higher rates (£114m); and signalling issues

Office of Rail and Road | 20 July 2017 Network Rail Monitor Q3-4 2016-17 | 53
including project delays (£38m). It has also not delivered its planned efficiency
initiatives.
enhancements underperformance was largely due to increased contract costs,
supply chain constraints and access issues on Northern Hub (£80m), EGIP
(£38m), East West Rail (£35m) and on the three projects electrifying the Shotts,
Rutherglen-Coatbridge and Stirling-Alloa lines (collectively known as “the rolling
programme of electrification” in Scotland (£15m))14.
6.12 For each of the first three years of the control period, Network Rail has
underperformed against budget. This has continued even after the Hendy review
(Table 3).
Table 3: Gross FPM variance to budget for Great Britain during the first three years of CP5
(£m 2016-17 prices)
Efficiency15
6.13 Network Rail still needs to address the problems arising from cost escalation and
delays across both renewals and enhancements projects. There is continuing
underperformance in these key areas of the business.
6.14 Network Rail needs to focus on cost efficiency and effectiveness in order to address
the challenges set out in the regulatory settlement and it needs to do this while
delivering record levels of enhancement activity, high levels of renewals activity to
14 Network Rail is currently forecasting to achieve the revised enhancements baselines to the end of CP5 as recommended in the Hendy
Report for England and Wales. Forecast underspend in England and Wales compared to budget is £2m to the end of CP5 but £185m of expenditure has been deferred. So, for the work done, underperformance to the end of CP5 is expected to be £183m. For Scotland where the baseline remains the one set through the ECAM process, there is an overspend of £133m compared to budget, which includes £17m of work brought forward. So, for the work done, underperformance is expected to be £116m.Therefore, for Great Britain as a whole, underperformance to the end of CP5 is forecast to be nearly £300m.
15 For more information see our consultation
Gross FPM under- performance was £1,100m before Hendy adjustments to the baselines, (therefore worse than in 2014-15 when comparing on a like for like basis).
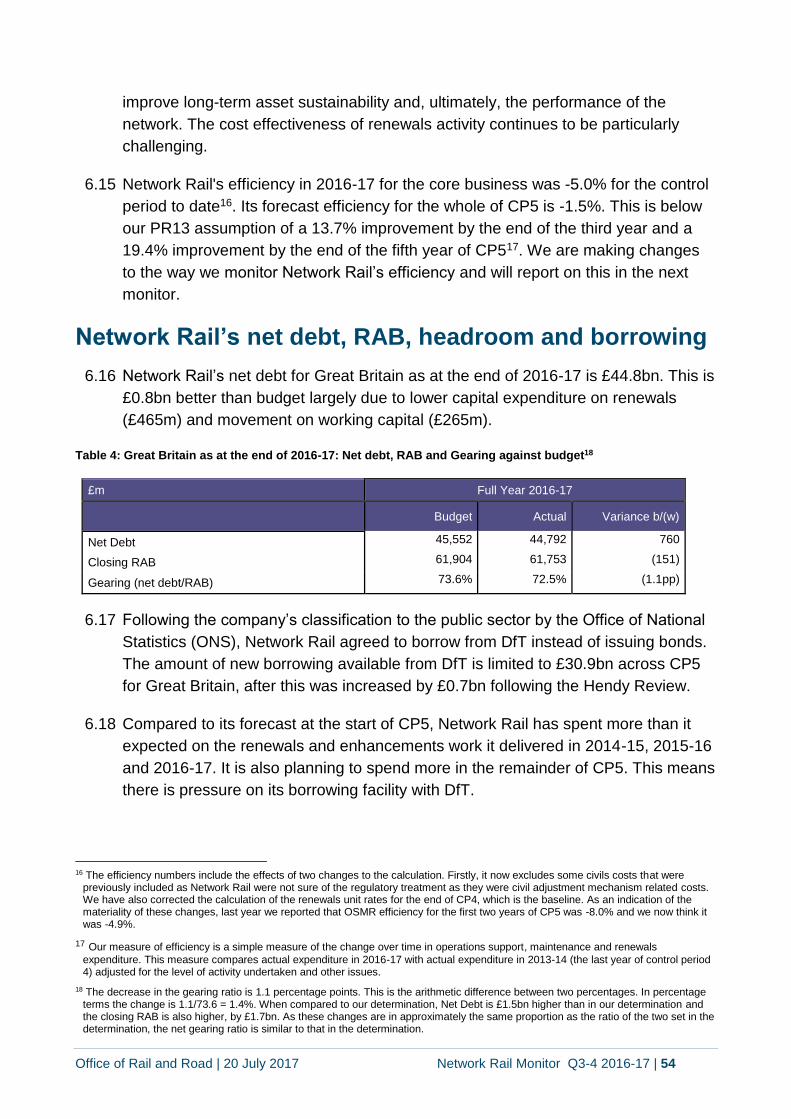
Office of Rail and Road | 20 July 2017 Network Rail Monitor Q3-4 2016-17 | 54
improve long-term asset sustainability and, ultimately, the performance of the
network. The cost effectiveness of renewals activity continues to be particularly
challenging.
6.15 Network Rail's efficiency in 2016-17 for the core business was -5.0% for the control
period to date16. Its forecast efficiency for the whole of CP5 is -1.5%. This is below
our PR13 assumption of a 13.7% improvement by the end of the third year and a
19.4% improvement by the end of the fifth year of CP517. We are making changes
to the way we monitor Network Rail’s efficiency and will report on this in the next
monitor.
Network Rail’s net debt, RAB, headroom and borrowing
6.16 Network Rail’s net debt for Great Britain as at the end of 2016-17 is £44.8bn. This is
£0.8bn better than budget largely due to lower capital expenditure on renewals
(£465m) and movement on working capital (£265m).
Table 4: Great Britain as at the end of 2016-17: Net debt, RAB and Gearing against budget18
£m Full Year 2016-17
Budget Actual Variance b/(w)
Net Debt 45,552 44,792 760
Closing RAB 61,904 61,753 (151)
Gearing (net debt/RAB) 73.6% 72.5% (1.1pp)
6.17 Following the company’s classification to the public sector by the Office of National
Statistics (ONS), Network Rail agreed to borrow from DfT instead of issuing bonds.
The amount of new borrowing available from DfT is limited to £30.9bn across CP5
for Great Britain, after this was increased by £0.7bn following the Hendy Review.
6.18 Compared to its forecast at the start of CP5, Network Rail has spent more than it
expected on the renewals and enhancements work it delivered in 2014-15, 2015-16
and 2016-17. It is also planning to spend more in the remainder of CP5. This means
there is pressure on its borrowing facility with DfT.
16 The efficiency numbers include the effects of two changes to the calculation. Firstly, it now excludes some civils costs that were
previously included as Network Rail were not sure of the regulatory treatment as they were civil adjustment mechanism related costs. We have also corrected the calculation of the renewals unit rates for the end of CP4, which is the baseline. As an indication of the materiality of these changes, last year we reported that OSMR efficiency for the first two years of CP5 was -8.0% and we now think it was -4.9%.
17 Our measure of efficiency is a simple measure of the change over time in operations support, maintenance and renewals
expenditure. This measure compares actual expenditure in 2016-17 with actual expenditure in 2013-14 (the last year of control period 4) adjusted for the level of activity undertaken and other issues.
18 The decrease in the gearing ratio is 1.1 percentage points. This is the arithmetic difference between two percentages. In percentage terms the change is 1.1/73.6 = 1.4%. When compared to our determination, Net Debt is £1.5bn higher than in our determination and the closing RAB is also higher, by £1.7bn. As these changes are in approximately the same proportion as the ratio of the two set in the determination, the net gearing ratio is similar to that in the determination.
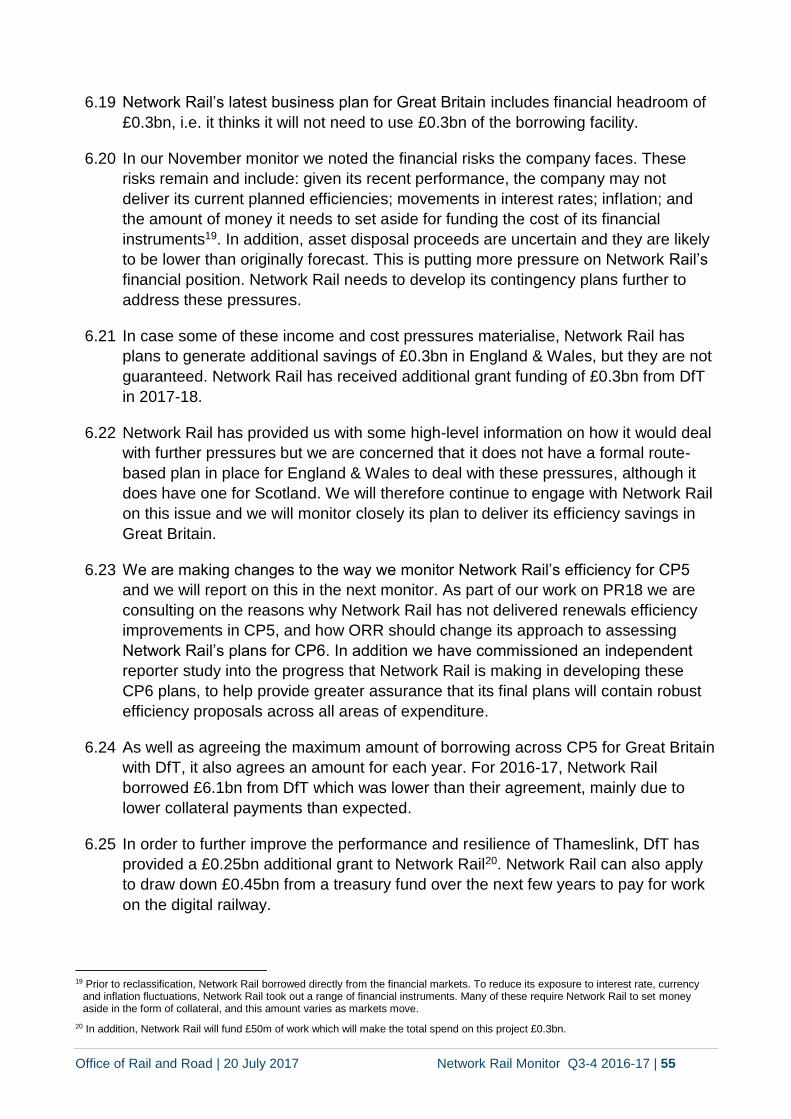
Office of Rail and Road | 20 July 2017 Network Rail Monitor Q3-4 2016-17 | 55
6.19 Network Rail’s latest business plan for Great Britain includes financial headroom of
£0.3bn, i.e. it thinks it will not need to use £0.3bn of the borrowing facility.
6.20 In our November monitor we noted the financial risks the company faces. These
risks remain and include: given its recent performance, the company may not
deliver its current planned efficiencies; movements in interest rates; inflation; and
the amount of money it needs to set aside for funding the cost of its financial
instruments19. In addition, asset disposal proceeds are uncertain and they are likely
to be lower than originally forecast. This is putting more pressure on Network Rail’s
financial position. Network Rail needs to develop its contingency plans further to
address these pressures.
6.21 In case some of these income and cost pressures materialise, Network Rail has
plans to generate additional savings of £0.3bn in England & Wales, but they are not
guaranteed. Network Rail has received additional grant funding of £0.3bn from DfT
in 2017-18.
6.22 Network Rail has provided us with some high-level information on how it would deal
with further pressures but we are concerned that it does not have a formal route-
based plan in place for England & Wales to deal with these pressures, although it
does have one for Scotland. We will therefore continue to engage with Network Rail
on this issue and we will monitor closely its plan to deliver its efficiency savings in
Great Britain.
6.23 We are making changes to the way we monitor Network Rail’s efficiency for CP5
and we will report on this in the next monitor. As part of our work on PR18 we are
consulting on the reasons why Network Rail has not delivered renewals efficiency
improvements in CP5, and how ORR should change its approach to assessing
Network Rail’s plans for CP6. In addition we have commissioned an independent
reporter study into the progress that Network Rail is making in developing these
CP6 plans, to help provide greater assurance that its final plans will contain robust
efficiency proposals across all areas of expenditure.
6.24 As well as agreeing the maximum amount of borrowing across CP5 for Great Britain
with DfT, it also agrees an amount for each year. For 2016-17, Network Rail
borrowed £6.1bn from DfT which was lower than their agreement, mainly due to
lower collateral payments than expected.
6.25 In order to further improve the performance and resilience of Thameslink, DfT has
provided a £0.25bn additional grant to Network Rail20. Network Rail can also apply
to draw down £0.45bn from a treasury fund over the next few years to pay for work
on the digital railway.
19 Prior to reclassification, Network Rail borrowed directly from the financial markets. To reduce its exposure to interest rate, currency
and inflation fluctuations, Network Rail took out a range of financial instruments. Many of these require Network Rail to set money aside in the form of collateral, and this amount varies as markets move.
20 In addition, Network Rail will fund £50m of work which will make the total spend on this project £0.3bn.

Office of Rail and Road | 20 July 2017 Network Rail Monitor Q3-4 2016-17 | 56
Asset disposals
6.26 Network Rail continues to look at the option of disposing of a number of its property
related assets. Its objective, in line with the Hendy report, is to raise extra funds to
support the railway enhancement programme without compromising the safe and
efficient operation of the railway. Any proposals must work legally and
commercially. They must also deliver value for money, satisfy any relevant policy
issues and demonstrate value for money.
6.27 The company is also still considering options to deliver sustainable growth and a
better long-term management and operating model at its 18 major stations. We
have had a number of detailed working-level discussions with Network Rail and its
advisers to explore the regulatory implications of the options.
6.28 Under its network licence, Network Rail will need our consent for disposing of
certain assets and we will consider the regulatory implications of its proposals as
they develop.
Route level analysis of financial performance
6.29 This section provides a simple comparison of route expenditure compared to
Network Rail’s budget in the year 2016-17. The data is not normalised to reflect
differences in characteristics of routes, such as length of track, electrification,
geography and types of services. Therefore, this analysis cannot be used to draw
conclusions about the relative performance of the routes. But it can highlight
particular issues at a route level or the differing impact of challenges faced across
Network Rail.
Table 5: Route level expenditure against budget21
Full Year 2016-17 Variances
£m Operations Support Maintenance Renewals Enhancements Total variances
Anglia (2) 0 3 42 (153) (110)
LNE/EML (5) 1 (49) 28 61 35
LNW (3) 1 (9) 34 121 145
Scotland 0 0 (2) 12 (55) (46)
S. East 9 (3) (29) 23 (14) (15)
Wales 0 (1) (3) 11 25 32
Wessex 1 1 (2) (1) 29 29
Western 1 1 (9) 33 117 142
Total 1 0 (100) 181 130 212
Central Units 1 160 (14) 284 (106) 324
Grand Total 2 160 (114) 465 23 53622
21 A positive variance reflects an underspend against budget. A negative variance relects an overspend.
22 Adding to this total the -£48m variances on finance costs, and the £11m variance on turnover and on schedules 4 & 8, equals the variance of £499m shown in Table 1.
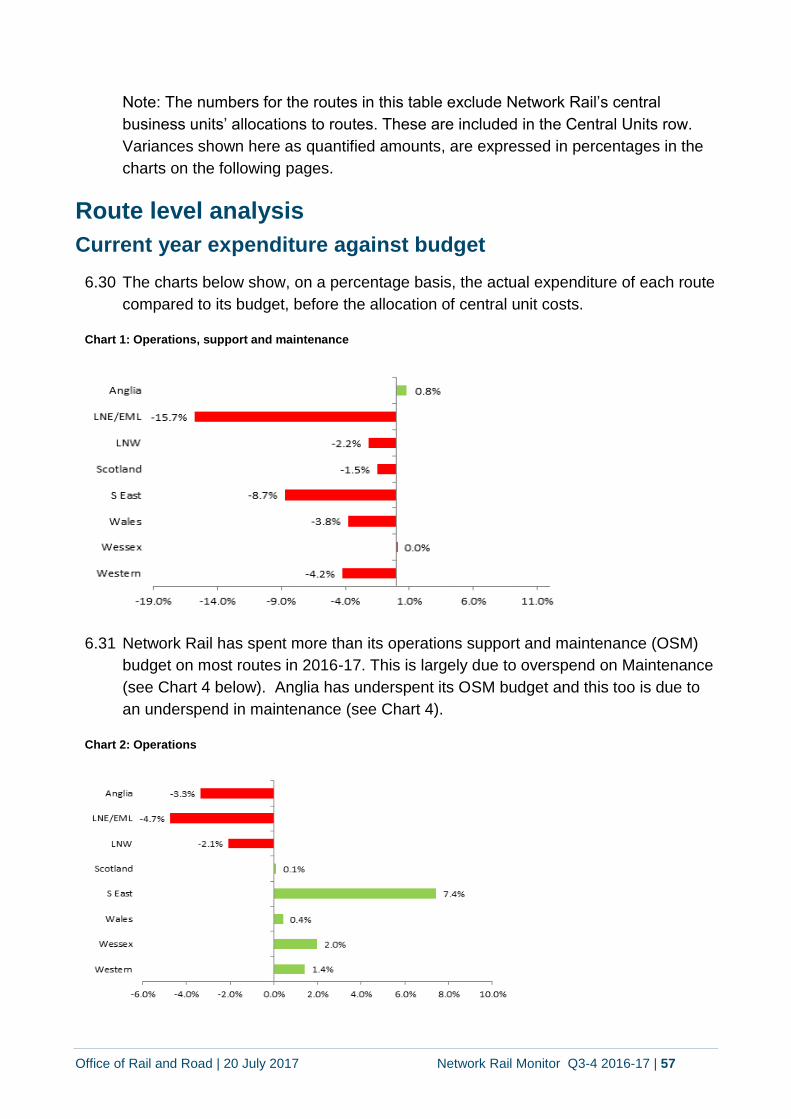
Office of Rail and Road | 20 July 2017 Network Rail Monitor Q3-4 2016-17 | 57
Note: The numbers for the routes in this table exclude Network Rail’s central
business units’ allocations to routes. These are included in the Central Units row.
Variances shown here as quantified amounts, are expressed in percentages in the
charts on the following pages.
Route level analysis
Current year expenditure against budget
6.30 The charts below show, on a percentage basis, the actual expenditure of each route
compared to its budget, before the allocation of central unit costs.
Chart 1: Operations, support and maintenance
6.31 Network Rail has spent more than its operations support and maintenance (OSM)
budget on most routes in 2016-17. This is largely due to overspend on Maintenance
(see Chart 4 below). Anglia has underspent its OSM budget and this too is due to
an underspend in maintenance (see Chart 4).
Chart 2: Operations

Office of Rail and Road | 20 July 2017 Network Rail Monitor Q3-4 2016-17 | 58
6.32 A budget for maintenance spend of £9m was incorrectly allocated to operations
causing an underspend in South East and contributing to the overspend for South
East shown in Chart 4 below.
Chart 3: Support
6.33 The large percentage overspends in support costs are relatively small in monetary
terms. For Anglia the variance is £0.4m, for Wales £0.7m and the largest for South
East is £2.8m. Partly this is because, at the route level, there is less consistency in
the budgets about the classification of costs between maintenance and support.
Chart 4: Maintenance
6.34 The largest route variances in monetary terms (see Table 5 above) are all in
maintenance, with civils and building costs originally planned within renewals
contributing to the large percentage changes in LNE/EML, South East and Western.
Delays to renewals projects also contributed as more maintenance work was
29.3%
34.2%
-32.5%
-105.5%
-5.6%
27.9%
14.2%
-50.9%
-150.0% -100.0% -50.0% 0.0% 50.0% 100.0% 150.0%
Western
Wessex
Wales
S East
Scotland
LNW
LNE/EML
Anglia
-7.7%
-2.1%
-4.7%
-19.6%
-2.0%
-2.7%
-21.4%
2.7%
-25.0% -20.0% -15.0% -10.0% -5.0% 0.0% 5.0%
Western
Wessex
Wales
S East
Scotland
LNW
LNE/EML
Anglia

Office of Rail and Road | 20 July 2017 Network Rail Monitor Q3-4 2016-17 | 59
needed to maintain performance and there were higher costs of civils inspections
because of restricted access to sites.
6.35 Anglia’s underspend in maintenance (£3m) is due to a difference in classification:
reactive maintenance expense on buildings and civils was classified during the year
as renewals and not maintenance as budgeted.
Chart 5: Renewals
6.36 Chart 5 shows variances on renewals before adjusting for deferrals. In general the
reason for the underspends is the high level of deferrals across the routes. Once we
have taken account of volumes not being delivered, all routes in the chart are
underperforming on the work done.
6.37 Anglia, LNE and LNW have each deferred around 25% of their renewals budget,
South East, Wessex and Western between 15%-20%, and Scotland and Wales
have deferred around 10%.
6.38 LNE, LNW and Wessex have the highest percentage of underperfomance with
negative FPM in the region of -16% to -21% of budgeted renewals. Anglia, South
East and Western have a negative FPM of around -8% and Scotland and Wales
have a negative FPM of around -5% of their renewals budget.

Office of Rail and Road | 20 July 2017 Network Rail Monitor Q3-4 2016-17 | 60
Chart 6: Enhancements
6.39 Chart 6 shows that most routes are underspending their budgets e.g. Thameslink
(£18m on LNE/EML), West Coast power supply upgrade (£13m on LNW) and Great
Western Electrification (£60m on Western). However, the Anglia route has
overspent by 56.8% (£153m), mainly due to the re-profiling of the Cross-Rail East
works between Shenfield and Liverpool Street (£104m) where work has been
brought forward and the spend in 2016-17 is nearly three times more than
budgeted. No increase is expected in the overall cost of the project, consequently
no underperformance has been recognised. Most of the remaining variances in
Anglia are from overspend in three third-party projects which are in Network Rail’s
budget, though not in our determination. These are Cambridge North Station,
£10.5m; Hackney Wick Station, £12m; and Gospel Oak-Barking OLE, £23.5m.
6.40 In Scotland where the projects are still governed by the ECAM efficient spend
baselines, there is an overspend of nearly 20% of the budget (£55m). This is mainly
in EGIP (£27m) where there has been underperformance as well as work being
brought forward to meet milestone targets in early 2017-18; and also in the Rolling
Programme of Electrification (£33m). The large volume of re-design and re-delivery
has led to significant increases in scope and costs of both these projects23. Overall
Scotland is reporting £56m underperformance in enhancements (before RAB
adjustment).
23 This is due to initial designs being found to be non-compliant with the minimum legal requirements for electrical clearances.

Office of Rail and Road | 20 July 2017 Network Rail Monitor Q3-4 2016-17 | 61
Current year financial performance
6.41 Table 6 below is a route-level breakdown of the net financial performance shown in
Table 2, i.e. it shows the total FPM of £200m by route and central units24.
Table 6: FPM - Route level net (under)/outperformance (before allocation of central unit costs)
FPM Full year income variances FPM Full year cost variances
Total Net FPM: full year
£m b/(w) FPM variances
(Turnover, schedules 4 & 8)
FPM (under)/out performance as
% of actual income
FPM variances (OSM,
Renewals, Enhancements)
FPM (under)/out performance as % of actual cost
Anglia (18) (21%) (10) (1.3%) (28)
LNE/EML (6) (2%) (55) (4.7%) (61)
LNW (9) (3%) (73) (4.4%) (82)
S. East (4) (3%) (24) (1.9%) (28)
Scotland 6 4% (23) (2.8%) (17)
Wales 7 16% (7) (1.4%) 0
Western (3) (2%) (11) (0.7%) (14)
Wessex (15) (17%) (7) (1.3%) (22)
Total (42) (3%) (210) (2.6%) (252)
Central Units25 (11) 0% 63 3.2% 52
Overall Total (53) (1%) (147) (1.8%) (200)
6.42 The overall net underperformance of £200m is largely due to:
£76m Schedule 8 payments reflecting longer than expected delays. Anglia (-13%), Wessex (-16%) and South East(-18%)26 were the routes most affected due to asset failures, for example in signalling or in overhead supply lines and also various infrastructure incidents such as flooding, landslips and fires including large one-off events such as the severe flooding in London, Storm Doris and a landslip in Watford.
£147m underperformance on OSM, renewals and enhancements, of which the largest elements are in:
LNE/EML (-5%, maintenance and renewals) see paragraphs 6.34 and 6.39 above;
LNW (-4%, renewals and enhancements). There has been significant underperformance on the Northern Hub project due to increases in signalling costs and increases in costs due to access issues; and
Scotland’s underperformance (-3%) includes the EGIP and Rolling programme of electrification enhancement projects (see paragraph 6.40).
24 Table 6 is net of the RAB sharing mechanism, which reduces the underperformance for Renewals and Enhancements. Without the
adjustment the net underperformance of -£200m would be -£563m.
25 There was £1.3bn of expenditure in the Central Units including traction electricity costs (which are recovered through income),
business rates and other industry costs as well as centrally managed capital projects such as IT, ORBIS and Plant & Machinery.
26 South East’s Schedule 8 underperformance (£26m) is not apparent in Table 6 as it is largely offset by a £27m outperformance from
Schedule 4.
Office of Rail and Road | 20 July 2017 Network Rail Monitor Q3-4 2016-17 | 62
7. The railway in Wales
Health and safety
7.1 Like the rest of the network, Wales has seen a slowing in what have been generally
positive trends on safety performance. During 2016-17, Network Rail met all its
commitments on train accident risk reduction volumes, apart from Road Vehicle
Incursion targets. We understand however that this relates to just one site and
agreement has been reached with the local authority to address the problem. There
was also a data/reporting issue on another measure – Signal Overrun Assessment
Tool (SORAT) assessments27.
7.2 When normalised by hours worked, Wales has the highest number of close calls
reported. Network Rail interprets this as a positive reflection of an open culture
rather than any indication that conditions are worse than other routes.
7.3 As part of the level crossing risk reduction programme legal consent has been
secured for the closure of Pilkins and Ystrad Fawr crossings. However, the risk is
still present as these crossings will remain physically open until a diversionary
bridge has been constructed. The bridge is due to be completed and the crossings
closed next year.
Assets
7.4 Assets in Wales have different characteristics, challenges and management history.
The unique environment of the Severn Tunnel, for example, has driven
considerable additional re-railing volumes to try to manage rolling contact fatigue.
Our inspections suggest that Network Rail’s asset management teams respond well
often bringing a new and innovative approach to stewardship of their portfolios.
Track
7.5 In the course of our inspection activity we found:
use of track recording vehicles could be improved – especially to underpin more
extensive use of risk-based maintenance (RBM);
adoption of RBM across Wales was patchy – although this is partly attributable
to the prevalence of ageing track assets which are unsuitable for RBM;
27 Wales appears to have more than 100 overdue assessments. In fact 38 are subject to a derogation (the signal is about to be
decommissioned or upgraded) and 60 of the assessments have been completed but have yet to be registered on the system.
Office of Rail and Road | 20 July 2017 Network Rail Monitor Q3-4 2016-17 | 63
where RBM has been adopted, it has not always been carried out as thoroughly
or extensively as the process requires and the full benefits have not always
been realised; and
track renewal deferral decisions were inspected as part of a national project. In
common with other parts of the network, we found that original renewal
decisions had been justified – so deferrals would be expected to have an
impact. We found that Network Rail could not always demonstrate a robust
approach to mitigating the effects of deferral. In particular, the impact on
maintenance was not fully assessed.
Signalling assets
7.6 Asset condition varied across the route. Recent renewal and enhancement activity
as part of Cardiff area re-signalling and preparation for electrification has brought
modern equipment to that part of the route, and removed many higher risk assets
such as single-cut cables. In contrast, deferrals such as Newport-Shrewsbury bring
the challenge of maintaining ageing assets beyond original plans.
Civils
7.7 Midway through the year the route appeared to be struggling to comply with
required actions to reduce the risk from scour at bridges. However, closer scrutiny
revealed that the bulk of the apparent backlog was due to data issues and poor
communication between the route and Network Rail’s centre. The action plan is
back on track.
7.8 There has been underdelivery of underbridge renewals volumes but this is more as
a result of problems securing road closures than difficulties with the assets
themselves. Earthworks renewals volumes have also been below forecasts for the
year.
7.9 We saw no evidence of inadequate risk control due to renewal deferrals. Network
Rail in Wales has expressed interest in remote condition monitoring at one or more
earthwork site at risk of failure. This is despite the route not being part of formal
RCM trials. We saw evidence of a move towards more renewal and refurbishment
(de-vegetation and netting) of rock cuttings – on a risk basis. We understand that
more of this type of work is planned for next year. Examinations of earthworks are
generally up to date. Dedicated vegetation gangs have been created for both
earthworks and structures – to prepare sites prior to examination. We note however,
that vegetation was still reported as a reason why examinations could not be carried
out as planned.
Office of Rail and Road | 20 July 2017 Network Rail Monitor Q3-4 2016-17 | 64
7.10 Wales has been at the forefront of developing drainage management good practice.
The MyWork drainage app is in use across Wales and users have suggested
improvements. As a result of adopting this app the accuracy and granularity of
information within Ellipse has been improved, resulting in a more thorough and
reliable inspection regime. Wales route scored very well in a recent Network Rail
drainage audit.
Off track
7.11 Wales route has been a pioneer in developing a risk-based, properly resourced
approach to off-track asset management. 2016-17 saw the delivery of a new
management structure for off-track, with drainage (see above) integrated into it.
7.12 Poor-condition fencing is one of a number of risks in respect of off-track assets. We
have observed that MDU staff are starting to use the MyWork app for fencing and
the intention is that this will lead to a ‘cleaner’, more accurate, asset register in
Ellipse, aiding better management of fencing. Similarly, management of lineside
vegetation raises challenges for the route. The MDUs have a Temporary Non
Compliance (TNC) because they require three years to meet the relevant vegetation
standard. We are pressing for vegetation management plans, which may include
the use of new technology, to put vegetation management onto a more sustainable
footing.
Construction issues
7.13 We meet Network Rail’s central Infrastructure Projects team regularly and carry out
joint site inspections. These often highlight basic improvements that could be made
in site safety and in the interface with maintenance functions. We have promoted
better adoption of Construction, Design and Management (CDM) regulation
requirements.
7.14 Manual handling issues in Wales have recently been the subject of ORR
enforcement action. This action complements some national improvement notices,
and we note that the route is playing an active part in finding innovative, effective
solutions that can be rolled out nationally.
Train performance
7.15 Arriva Trains Wales’ (ATW’s) Public Performance Measure (PPM) Moving Annual
Average (MAA) was 91.9% at the end of 2016-17, 0.6pp worse than the
performance strategy target. CaSL MAA was 2.9%, 0.3pp above (i.e. worse than)
the performance strategy target.
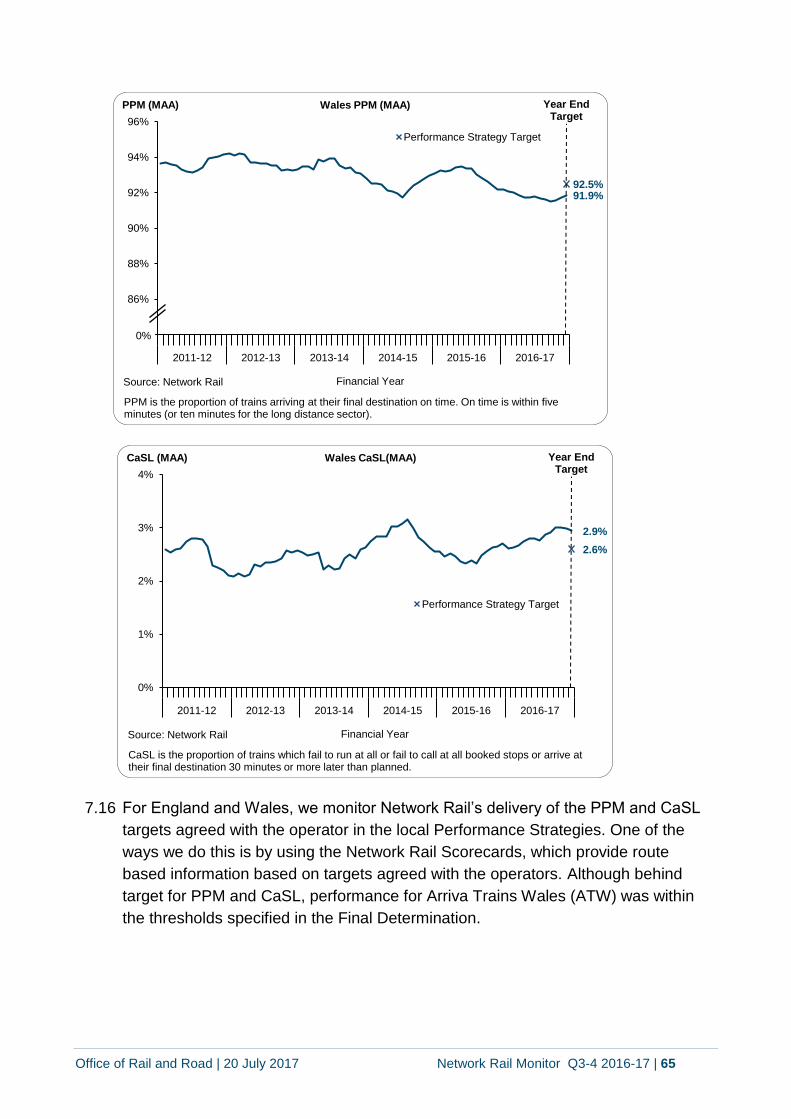
Office of Rail and Road | 20 July 2017 Network Rail Monitor Q3-4 2016-17 | 65
7.16 For England and Wales, we monitor Network Rail’s delivery of the PPM and CaSL
targets agreed with the operator in the local Performance Strategies. One of the
ways we do this is by using the Network Rail Scorecards, which provide route
based information based on targets agreed with the operators. Although behind
target for PPM and CaSL, performance for Arriva Trains Wales (ATW) was within
the thresholds specified in the Final Determination.
91.9%92.5%
84%
86%
88%
90%
92%
94%
96%
2011-12 2012-13 2013-14 2014-15 2015-16 2016-17
PPM (MAA)
Financial Year
Wales PPM (MAA)
Performance Strategy Target
0%
Source: Network Rail
Year End Target
PPM is the proportion of trains arriving at their final destination on time. On time is within five minutes (or ten minutes for the long distance sector).
2.9%
2.6%
0%
1%
2%
3%
4%
2011-12 2012-13 2013-14 2014-15 2015-16 2016-17
CaSL (MAA)
Financial Year
Wales CaSL(MAA)
Performance Strategy Target
Source: Network Rail
Year End Target
CaSL is the proportion of trains which fail to run at all or fail to call at all booked stops or arrive at their final destination 30 minutes or more later than planned.
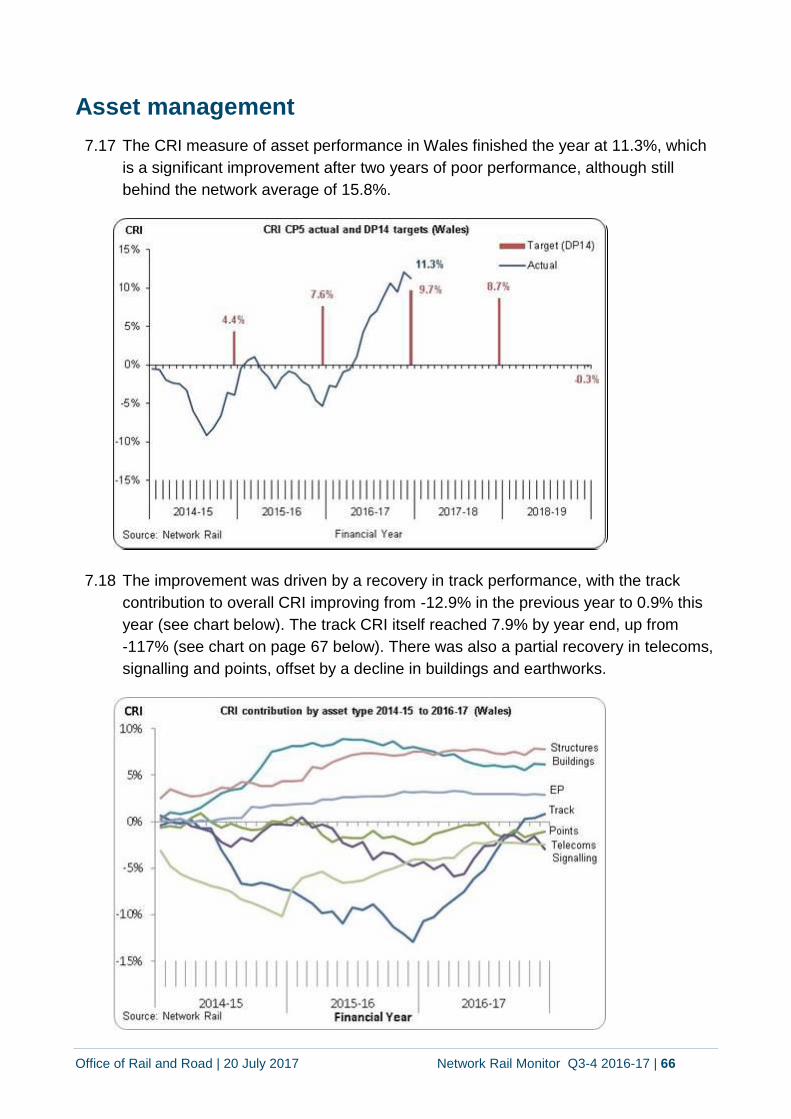
Office of Rail and Road | 20 July 2017 Network Rail Monitor Q3-4 2016-17 | 66
Asset management
7.17 The CRI measure of asset performance in Wales finished the year at 11.3%, which
is a significant improvement after two years of poor performance, although still
behind the network average of 15.8%.
7.18 The improvement was driven by a recovery in track performance, with the track
contribution to overall CRI improving from -12.9% in the previous year to 0.9% this
year (see chart below). The track CRI itself reached 7.9% by year end, up from
-117% (see chart on page 67 below). There was also a partial recovery in telecoms,
signalling and points, offset by a decline in buildings and earthworks.
5.1%
-10%
-8%
-6%
-4%
-2%
0%
2%
4%
6%
2014-15 2015-16 2016-17
CRI
Financial Year
MAA
Source: Network Rail
CRI 2014-15 to 2016-17 (Wales)

Office of Rail and Road | 20 July 2017 Network Rail Monitor Q3-4 2016-17 | 67
Developing the network
7.19 The final phase of the Cardiff Area Signalling Renewal scheme was delivered over
the Christmas/New Year period. The works were concentrated on the Cardiff
Central area and included the opening of new platform 8 at that station. This project
will enable an increase in the train service frequency to 16 trains per hour through
the central core, following a previous increase to 14 trains per hour in November
2014.
Expenditure and financial performance
7.20 We consider Network Rail's financial performance in two different ways; firstly by
providing a simple comparison of Network Rail's expenditure against its own budget
(Table 1 below) and secondly, by considering our regulatory performance measure
(Table 2 below).
7.21 There are several ways in which key messages can be conveyed through the
regulatory performance measure and these choices include:
comparing either to our CP5 determination, as we do in our Annual Efficiency
and Financial Assessment, or to Network Rail's annual budget;
showing the variances gross, or net of adjustments made in line with the RAB
sharing mechanism; and
including or excluding the adjustments made for missed regulatory outputs.
Track
-5.1%
Points-0.4%
Telecoms
-2.0%
-14%
-12%
-10%
-8%
-6%
-4%
-2%
0%
2%
2014-15 2015-16 2016-17
CRI
Financial YearSource: Network Rail
CRI by Category 2014-15 to 2016-17 (Wales)
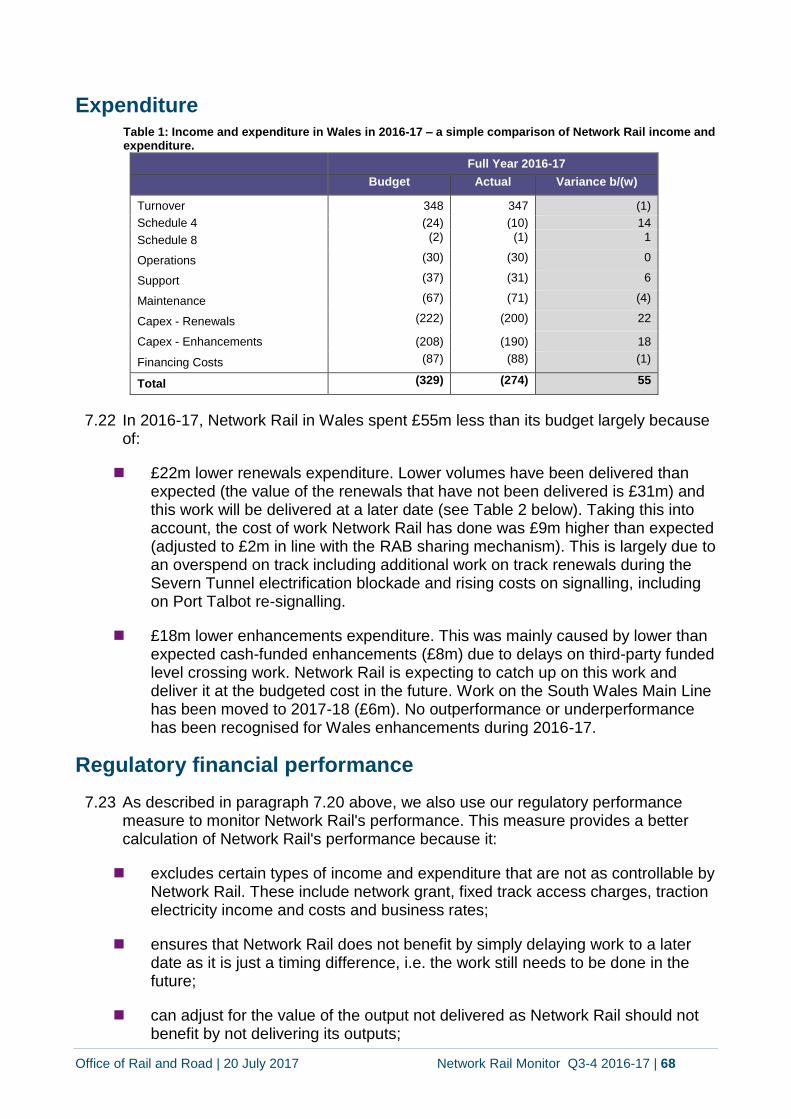
Office of Rail and Road | 20 July 2017 Network Rail Monitor Q3-4 2016-17 | 68
Expenditure Table 1: Income and expenditure in Wales in 2016-17 – a simple comparison of Network Rail income and expenditure.
Full Year 2016-17
Budget Actual Variance b/(w)
Turnover 348 347 (1)
Schedule 4 (24) (10) 14
Schedule 8 (2) (1) 1
Operations (30) (30) 0
Support (37) (31) 6
Maintenance (67) (71) (4)
Capex - Renewals (222) (200) 22
Capex - Enhancements (208) (190) 18
Financing Costs (87) (88) (1)
Total (329) (274) 55
7.22 In 2016-17, Network Rail in Wales spent £55m less than its budget largely because of:
£22m lower renewals expenditure. Lower volumes have been delivered than expected (the value of the renewals that have not been delivered is £31m) and this work will be delivered at a later date (see Table 2 below). Taking this into account, the cost of work Network Rail has done was £9m higher than expected (adjusted to £2m in line with the RAB sharing mechanism). This is largely due to an overspend on track including additional work on track renewals during the Severn Tunnel electrification blockade and rising costs on signalling, including on Port Talbot re-signalling.
£18m lower enhancements expenditure. This was mainly caused by lower than expected cash-funded enhancements (£8m) due to delays on third-party funded level crossing work. Network Rail is expecting to catch up on this work and deliver it at the budgeted cost in the future. Work on the South Wales Main Line has been moved to 2017-18 (£6m). No outperformance or underperformance has been recognised for Wales enhancements during 2016-17.
Regulatory financial performance
7.23 As described in paragraph 7.20 above, we also use our regulatory performance measure to monitor Network Rail's performance. This measure provides a better calculation of Network Rail's performance because it:
excludes certain types of income and expenditure that are not as controllable by Network Rail. These include network grant, fixed track access charges, traction electricity income and costs and business rates;
ensures that Network Rail does not benefit by simply delaying work to a later date as it is just a timing difference, i.e. the work still needs to be done in the future;
can adjust for the value of the output not delivered as Network Rail should not benefit by not delivering its outputs;
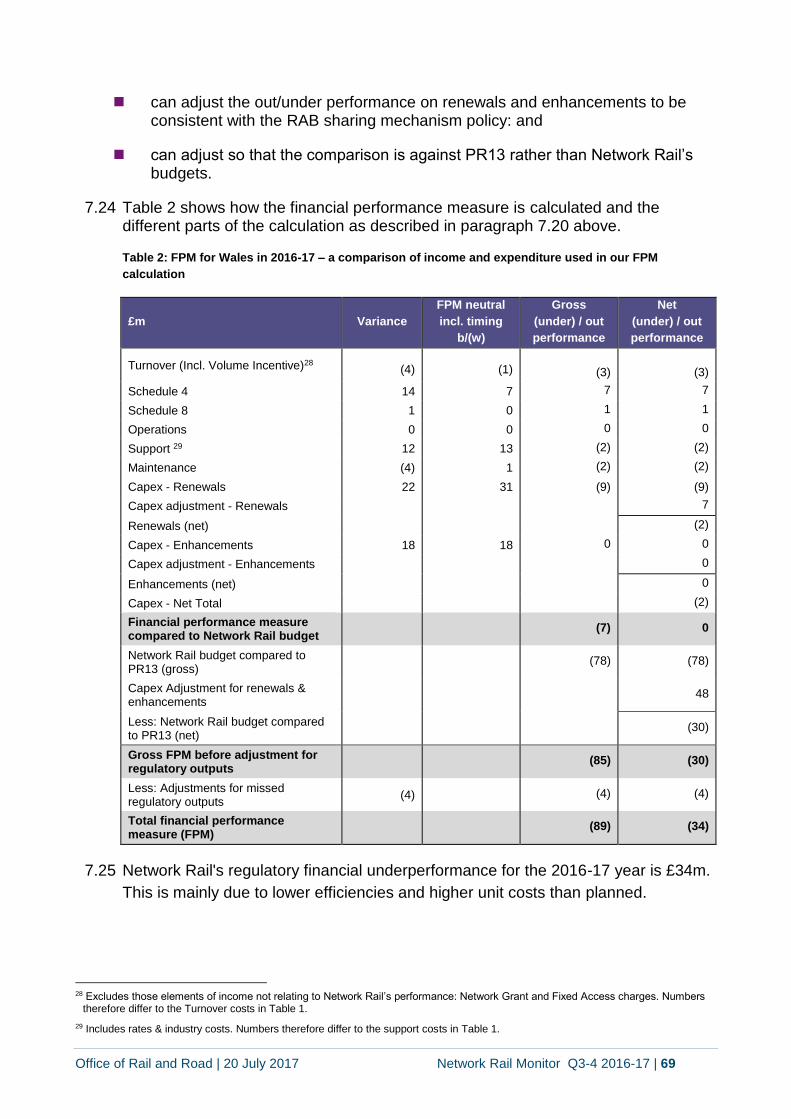
Office of Rail and Road | 20 July 2017 Network Rail Monitor Q3-4 2016-17 | 69
can adjust the out/under performance on renewals and enhancements to be consistent with the RAB sharing mechanism policy: and
can adjust so that the comparison is against PR13 rather than Network Rail’s budgets.
7.24 Table 2 shows how the financial performance measure is calculated and the different parts of the calculation as described in paragraph 7.20 above.
Table 2: FPM for Wales in 2016-17 – a comparison of income and expenditure used in our FPM
calculation
£m Variance
FPM neutral
incl. timing
b/(w)
Gross
(under) / out
performance
Net
(under) / out
performance
Turnover (Incl. Volume Incentive)28
(4)
(1)
(3)
(3)
Schedule 4 14 7 7 7
Schedule 8 1 0 1 1
Operations 0 0 0 0
Support 29 12 13 (2) (2)
Maintenance (4) 1 (2) (2)
Capex - Renewals 22 31 (9) (9)
Capex adjustment - Renewals 7
Renewals (net) (2)
Capex - Enhancements 18 18 0 0
Capex adjustment - Enhancements 0
Enhancements (net) 0
Capex - Net Total (2)
Financial performance measure compared to Network Rail budget
(7) 0
Network Rail budget compared to PR13 (gross)
(78) (78)
Capex Adjustment for renewals & enhancements
48
Less: Network Rail budget compared to PR13 (net)
(30)
Gross FPM before adjustment for regulatory outputs
(85) (30)
Less: Adjustments for missed regulatory outputs
(4) (4) (4)
Total financial performance measure (FPM)
(89) (34)
7.25 Network Rail's regulatory financial underperformance for the 2016-17 year is £34m.
This is mainly due to lower efficiencies and higher unit costs than planned.
28 Excludes those elements of income not relating to Network Rail’s performance: Network Grant and Fixed Access charges. Numbers
therefore differ to the Turnover costs in Table 1.
29 Includes rates & industry costs. Numbers therefore differ to the support costs in Table 1.
Office of Rail and Road | 20 July 2017 Network Rail Monitor Q3-4 2016-17 | 70
7.26 This financial underperformance is made up of a number of components, including
the following:
Network Rail’s gross financial performance for 2016-17 is £7m adverse to
Network Rail’s own budget. The largest area of underperformance, compared to
its own budget, is track renewals arising from additional work including the
Severn Tunnel electrification blockade and rising costs on signalling, including
work on Port Talbot re-signalling;
Network Rail’s 2016-17 budget is itself £78m worse, (on a gross30 FPM basis)
than our determination. This is due to lower efficiencies and higher unit costs
than assumed in our determination across most core business activities; and
Network Rail has estimated that we will make a £4m adjustment to financial
performance for its underdelivery of the regulatory outputs in 2016-17.
Efficiency
7.27 In Wales, Network Rail has reported a decline in efficiency of -7.8% on OSMR
(Great Britain -5.0%) for the control period to date compared to our PR13
determination of 10.1% for Great Britain as a whole31. This combines 8.0%
efficiency gains for operations, support and maintenance (Great Britain 6.8%) but a
20.5% decline in efficiency for renewals (Great Britain -17.1%) due mainly to the re-
signalling issues described above.
7.28 By the end of CP5 Network Rail Wales expects to achieve efficiency of 16.0% on
OSMR (i.e. it will exit CP5 16.0% more efficient than it started CP5). This compares
favourably to the position for Great Britain overall and reflects different levels of
activity on different asset types and different baselines specific to this route. But it is
lower than our 19.5% assumption.
Expenditure (excluding central unit cost allocations)
7.29 Central unit costs, such as various HQ costs and some property costs are allocated
to the routes. In 2016-17, these central costs of £1.3bn in Great Britain, came to
approximately 14% of the total route expenditure. These include traction electricity
costs (though not for Wales) which are recovered through income, business rates
and other industry costs as well as centrally managed capital projects such as IT,
ORBIS and plant & machinery.
30 In net FPM terms it was £30m worse.
31 Our measure of efficiency is a simple measure of the change over time in operations support, maintenance and renewals expenditure. This measure compares actual expenditure in 2016-17 with actual expenditure in 2013-14 (the last year of control period 4) adjusted for the level of activity undertaken and other issues.
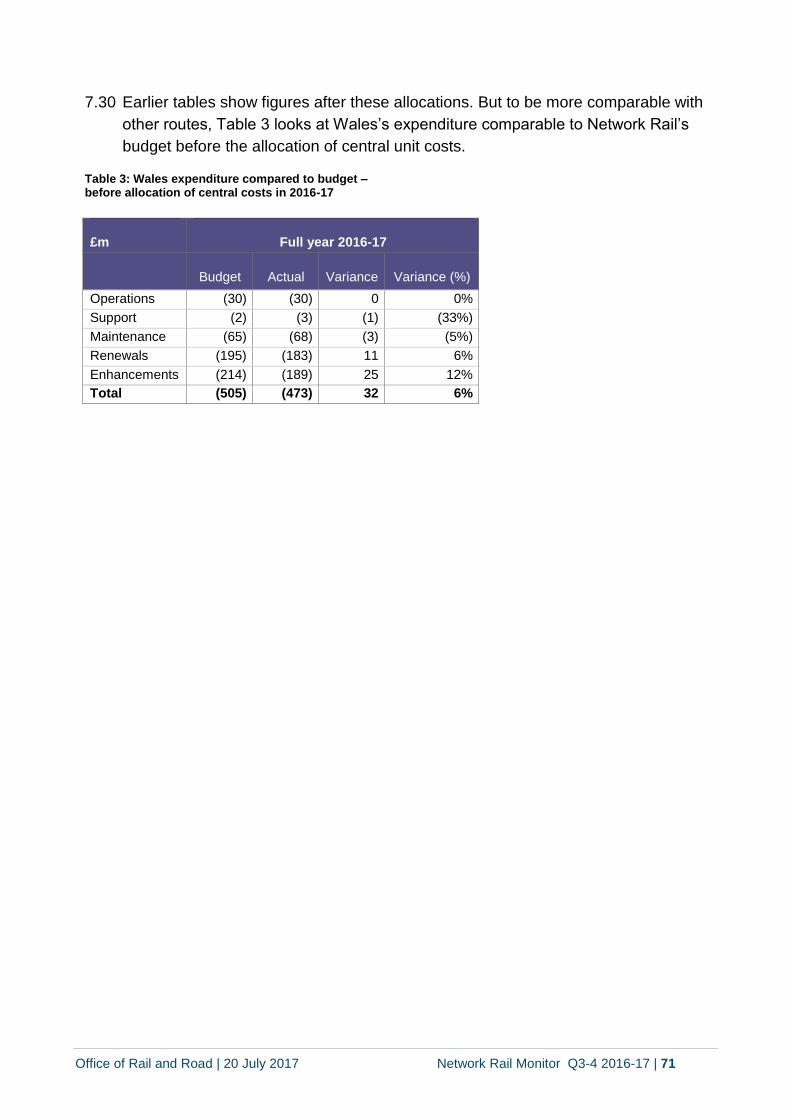
Office of Rail and Road | 20 July 2017 Network Rail Monitor Q3-4 2016-17 | 71
7.30 Earlier tables show figures after these allocations. But to be more comparable with
other routes, Table 3 looks at Wales’s expenditure comparable to Network Rail’s
budget before the allocation of central unit costs.
Table 3: Wales expenditure compared to budget – before allocation of central costs in 2016-17
£m Full year 2016-17
Budget Actual Variance Variance (%)
Operations (30) (30) 0 0%
Support (2) (3) (1) (33%)
Maintenance (65) (68) (3) (5%)
Renewals (195) (183) 11 6%
Enhancements (214) (189) 25 12%
Total (505) (473) 32 6%
Office of Rail and Road | 20 July 2017 Network Rail Monitor Q3-4 2016-17 | 72
8. Y Rheilffyrdd yng Nghymru
Iechyd a diogelwch
8.1 Fel gweddill y rhwydwaith, bu arwydd o arafu yng Nghymru hefyd ynghylch
tueddiadau cadarnhaol fel arfer ynghylch perfformiad diogelwch. Yn ystod 2016-17,
bu i Network Rail fodloni eu holl ofynion yn ymwneud â lleihau perygl o
ddamweiniau tren, heblaw am eu targedau Tresbasiad Cerbydau Ffordd. Rydym yn
deall fodd bynnag fod hyn yn berthnasol i un safle yn unig ac mae cytundeb wedi ei
sefydlu gyda'r awdurdod lleol i fynd i'r afael â'r broblem. Bu hefyd problem ynghylch
data/cofnodi ynghylch mesur arall - asesiadau Adnodd Asesu Signalau yn Gor-
redeg (SORAT)32.
8.2 Wrth normaleiddio hyn gyda'r nifer o oriau wedi eu gweithio, cafodd y nifer uchaf o
ddamweiniau posib agos iawn eu cofnodi yng Nghymru. Mae Network Rail yn
dehongli hyn fel nodwedd gadarnhaol o ddiwylliant agored yn hytrach nag unrhyw
arwydd fod amodau yn waeth na'r rheilffyrdd eraill.
8.3 Fel rhan o'r cynllun lleihau risg ar groesfannau gwastad, fe dderbyniwyd caniatâd
cyfreithiol ar gyfer cau croesfannau Pilkins ac Ystrad Fawr. Fodd bynnag, mae risg
yn dal i fod yna oherwydd bydd y croesfannau yn dal ar agor mewn gwirionedd nes
caiff pont gwrthdyniadol ei hadeiladu. Mae disgwyl y bydd y bont yn barod, ac felly
bod modd cau'r croesfannau, y flwyddyn nesaf.
Asedau
8.4 Mae gan asedau yng Nghymru wahanol nodweddion, heriau a hanes rheoli. Bu i
amgylchedd unigryw Twnnel Hafren, er enghraifft, olygu gwaith ail-dracio
ychwanegol sylweddol er mwyn ceisio rheoli 'rolling contact fatigue'. Mae ein
harchwiliadau yn awgrymu fod timau rheoli asedau Network Rail yn ymateb yn dda
ac yn aml yn rhoi gweithdrefn newydd ac arloesol ar waith ynghylch stiwardiaeth eu
portffolios.
Traciau
8.5 Yn ystod ein hymchwiliad bu inni ddarganfod:
Buasai modd gwella'r defnydd o gerbydau cofnodi traciau - yn enwedig i
danategu mwy o ddefnydd o Waith Cynnal a Chadw ar Sail Risgiau (RBM);
32 Mae'n debyg fod dros 100 asesiad hwyr yng Nghymru. A dweud y gwir, mae 38 yn amodol ar ran-
ddirymiad (caiff y signal ei ddi-gomisiynu neu ei uwchraddio) ac mae 60 o'r asesiadau wedi eu cwblhau ond
heb eu cofrestru ar y system hyd yn hyn.
Office of Rail and Road | 20 July 2017 Network Rail Monitor Q3-4 2016-17 | 73
Bu mabwysiadu Gwaith Cynnal a Chadw ar Sail Risgiau yn anghyson yng
Nghymru - mae hyn yn rhannol oherwydd cyffredinrwydd hen asedau traciau
sy'n anaddas ar gyfer Gwaith Cynnal a Chadw ar Sail Risgiau.
Lle mae Gwaith Cynnal a Chadw ar Sail Risgiau ar waith, dydy'r gwaith heb fod
mor drylwyr neu eang â gofyniadau'r broses ac ni chafodd y buddion llawn eu
cyflawni; a
fe gafodd penderfyniadau oedi ynghylch adnewyddu traciau ei ymchwilio fel
rhan o brosiect cenedlaethol. Yn gyffredin â rhannau eraill o'r rhwydwaith, bu
inni weld y cafodd penderfyniadau gwreiddiol ynghylch adnewyddu eu
cyfiawnhau - felly roedd disgwyl i oedi gael effaith. Bu inni weld nad oedd
Network Rail bob amser yn cynnig gweithdrefn gadarn ynghylch lliniaru'r
effeithiau yn sgil oedi. Yn benodol, ni chafodd yr effaith ar waith cynnal a chadw
ei asesu'n gyflawn.
Asedau Signal
8.6 Bu i gyflwr yr asedau amrywio ar hyd y traciau. Yn sgil gwaith adnewyddu a gwella
fel rhan o'r gwaith adnewyddu ar y signalau yn ardal Caerdydd a pharatoi ar gyfer
trydaneiddio cafodd offer modern ei osod yn y rhan hwnnw o'r daith. Hefyd bu iddyn
nhw gael gwared ar lawer o asedau risg uwch fel ceblau toriad-unigol. Yn
gyferbyniad i hyn bu'r oediadau fel Casnewydd-Amwythig yn golygu'r her o gynnal a
chadw hen asedau am yn hirach na'r cynlluniau gwreiddiol.
Asedau Peirianneg Sifil
8.7 Hanner ffordd trwy'r flwyddyn mae'n debyg yr oedd y llwybr yn trafferthu i
gydymffurfio gyda gwaith gofynnol er mwyn lleihau risg o sgwriad wrth pontydd.
Fodd bynnag, yn dilyn craffu manylach, daeth i'r amlwg fod y rhan fwyaf o'r ôl-
groniad yn sgil trafferthion data a chyfathrebu gwael rhwng y llwybr a chanolfan
Network Rail. Mae'r cynllun gweithredu ar waith unwaith eto.
8.8 Bu diffyg yn y gwaith adnewyddu is bontydd ond mae hyn fwy oherwydd problemau
gyda threfnu cau ffyrdd yn hytrach na thrafferthion gyda'r asedau eu hunain. Bu
cyfanswm y gwaith adnewyddu gwrthgloddiau yn is na'r rhagolygon ar gyfer y
flwyddyn hefyd.
8.9 Ni fu inni sylwi ar unrhyw dystiolaeth o waith rheoli risgiau annigonol yn sgil oedi
gyda gwaith adnewyddu. Bu i Network Rail yng Nghymru ddatgan diddordeb mewn
monitro cyflwr o bell un neu fwy safle cloddwaith mewn peryg o risg. Mae hyn er
gwaethaf nad ydy'r llwybr yn rhan o'r profion Monitro Cyflwr o Bell. Bu inni weld
tystiolaeth o fwy o waith adnewyddu ac adfer (clirio llystyfiant a rhwydo) toriadau
cerrig - ar sail risg. Rydym ar ddeall fod mwy o waith o'r fath hwn wedi ei drefnu ar
gyfer y flwyddyn nesaf. Mae archwiliadau o gloddwaith yn gyfredol yn gyffredinol.
Trefnwyd criwiau llystyfiant ymroddgar ar gyfer cloddwaith a strwythurau - er mwyn
Office of Rail and Road | 20 July 2017 Network Rail Monitor Q3-4 2016-17 | 74
paratoi safleoedd cyn archwiliadau. Rydym yn datgan fodd bynnag y cafodd
llystyfiant ei gofnodi eto fel rheswm pam nad oedd modd cynnal archwiliadau fel y
cynlluniwyd.
8.10 Bu Cymru ar y blaen gydag ymarfer da ynghylch datblygu gwaith rheoli draeniau.
Mae'r app draenio MyWork ar waith ledled Cymru a bu i ddefnyddwyr awgrymu
gwelliannau. O ganlyniad i fabwysiadu'r app hwn, bu i gywirdeb a thrylwyredd
gwybodaeth Ellipse wella gan ofalu fod trefn ymchwilio mwy dibynadwy a thrylwyr.
Bu i lwybr Cymru ennill sgôr uchel mewn archwiliad draenio gan Network Rail.
Oddi ar y Traciau
8.11 Bu llwybr Cymru yn arloesol gyda datblygu gweithdrefn ar sail risg gydag adnoddau
digonol ynghylch rheoli asedau oddi ar y traciau. Yn 2016-17 bu strwythur rheoli
newydd ar gyfer gwaith oddi ar y traciau, gyda draenio (gwelwch uchod) yn rhan
ohono.
8.12 Mae gwaith ffensio gwael yn un o'r nifer o risgiau yn ymwneud ag asedau oddi ar y
traciau. Bu inni sylwi fod staff Uned Darparu gwaith Cynnal a Chadw wedi dechrau
defnyddio'r app MyWork ar gyfer ffensio a'r bwriad ydy y bydd hyn yn golygu
cofrestr asedau 'fwy trefnus' a mwy cywir yn Ellipse a fydd yn help i reoli ffensio yn
well. Yn debyg, mae rheoli llystyfiant ger y traciau yn golygu heriau ar gyfer y llwybr.
Mae gan yr Unedau Darparu gwaith Cynnal a Chadw Diffyg Cydymffurfio Dros Dro
(TNC) oherwydd mae angen tair blynedd arnyn nhw i fodloni'r safon llystyfiant
perthnasol. Rydym yn mynd ati i ofalu fod cynlluniau rheoli llystyfiant, mae'n bosib y
bydd yn ymwneud â thechnoleg newydd, er mwyn gofalu fod gwaith rheoli llystyfiant
yn fwy cynaliadwy.
Materion Adeiladu
8.13 Rydym yn cyfarfod gyda thîm Prosiectau Isadeiledd canolog Network Rail yn
rheolaidd ac yn cynnal arolygon safle ar y cyd. Mae'r rhain yn aml yn tynnu sylw at
welliannau sylfaenol y gellir eu cyflawni fel rhan o waith diogelwch ar y safle ac yn y
rhyngwyneb gyda gweithrediadau cynnal a chadw. Bu inni hyrwyddo mwy o
ymdrech i fabwysiadu gofynion rheoleiddio Adeiladu, Dylunio a Rheoli (CDM).
8.14 Bu'n rhaid i ORR gymryd camau gorfodi yng Nghymru yn ddiweddar ynghylch
materion codi a chario. Mae'r camau yn ategu at rai rhybuddion gwella
cenedlaethol, ac rydym yn ymwybodol fod y llwybr yn chwarae rhan weithredol yn
dod o hyd i ddatrysiadau arloesol ac effeithiol y gellir eu defnyddio yn genedlaethol.
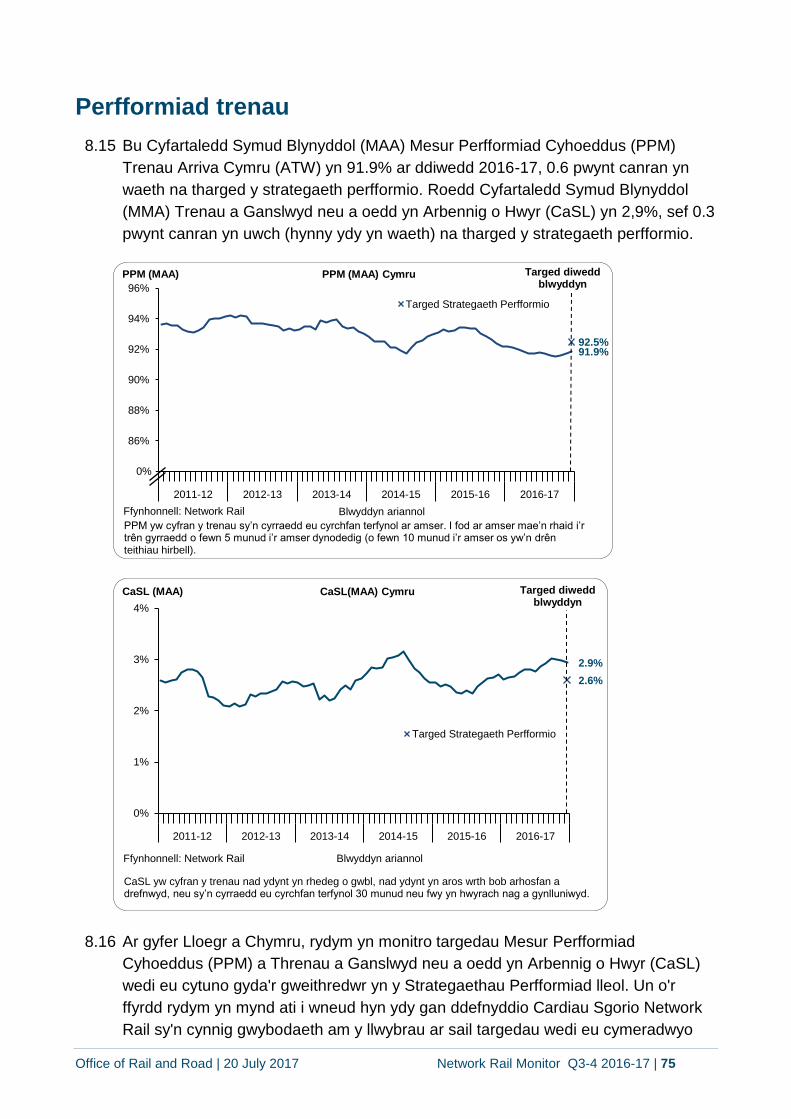
Office of Rail and Road | 20 July 2017 Network Rail Monitor Q3-4 2016-17 | 75
Perfformiad trenau
8.15 Bu Cyfartaledd Symud Blynyddol (MAA) Mesur Perfformiad Cyhoeddus (PPM)
Trenau Arriva Cymru (ATW) yn 91.9% ar ddiwedd 2016-17, 0.6 pwynt canran yn
waeth na tharged y strategaeth perfformio. Roedd Cyfartaledd Symud Blynyddol
(MMA) Trenau a Ganslwyd neu a oedd yn Arbennig o Hwyr (CaSL) yn 2,9%, sef 0.3
pwynt canran yn uwch (hynny ydy yn waeth) na tharged y strategaeth perfformio.
8.16 Ar gyfer Lloegr a Chymru, rydym yn monitro targedau Mesur Perfformiad
Cyhoeddus (PPM) a Threnau a Ganslwyd neu a oedd yn Arbennig o Hwyr (CaSL)
wedi eu cytuno gyda'r gweithredwr yn y Strategaethau Perfformiad lleol. Un o'r
ffyrdd rydym yn mynd ati i wneud hyn ydy gan ddefnyddio Cardiau Sgorio Network
Rail sy'n cynnig gwybodaeth am y llwybrau ar sail targedau wedi eu cymeradwyo
91.9%92.5%
84%
86%
88%
90%
92%
94%
96%
2011-12 2012-13 2013-14 2014-15 2015-16 2016-17
PPM (MAA)
Blwyddyn ariannol
PPM (MAA) Cymru
Targed Strategaeth Perfformio
0%
Ffynhonnell: Network Rail
Targed diwedd blwyddyn
PPM yw cyfran y trenau sy’n cyrraedd eu cyrchfan terfynol ar amser. I fod ar amser mae’n rhaid i’r trên gyrraedd o fewn 5 munud i’r amser dynodedig (o fewn 10 munud i’r amser os yw’n drên teithiau hirbell).
2.9%
2.6%
0%
1%
2%
3%
4%
2011-12 2012-13 2013-14 2014-15 2015-16 2016-17
CaSL (MAA)
Blwyddyn ariannol
CaSL(MAA) Cymru
Targed Strategaeth Perfformio
Ffynhonnell: Network Rail
Targed diwedd blwyddyn
CaSL yw cyfran y trenau nad ydynt yn rhedeg o gwbl, nad ydynt yn aros wrth bob arhosfan a drefnwyd, neu sy’n cyrraedd eu cyrchfan terfynol 30 munud neu fwy yn hwyrach nag a gynlluniwyd.

Office of Rail and Road | 20 July 2017 Network Rail Monitor Q3-4 2016-17 | 76
gyda'r gweithredwyr. Er bod Trenau Arriva Cymru heb gyrraedd ei dargedau Mesur
Perfformiad Cyhoeddus na nifer y Trenau a Ganslwyd neu a oedd yn Arbennig o
Hwyr, roedd ei berfformiad o fewn y trothwy sydd wedi'i nodi yn y Dyfarniad
Terfynol.
Rheoli asedau
8.17 Bu mesur Mynegai Dibynadwyedd Cyfansawdd (CRI) perfformiad asedau yng
Nghymru yn 11.3% erbyn diwedd y flwyddyn sy'n welliant sylweddol yn dilyn dwy
flynedd o berfformiad gwael ond dydy o dal heb gyrraedd y cyfartaledd rhwydwaith
o 15.8%.
8.18 Bu'r gwelliant yn sgil adferiad mewn perfformiad traciau, gyda'r cyfraniad traciau i'r
Mynegai Dibynadwyedd Cyfansawdd yn gwella o -12.9% y llynedd i 0.9% eleni
(gwelwch y siart isod). Bu i Fynegai Dibynadwyedd Cyfansawdd y traciau gyrraedd
7.9% erbyn diwedd y flwyddyn sy'n gynnydd o -117% (gwelwch y siart ar dudalen
77 isod). Bu hefyd adferiad rhannol mewn telathrebu, signalau a phwyntiau, wedi eu
gosod yn erbyn gostyngiad mewn adeiladau a gwaith tir.
4.4%
7.6%9.7% 8.7%
-0.3%
11.3%
-15%
-10%
-5%
0%
5%
10%
15%
2014-15 2015-16 2016-17 2017-18 2018-19
CRI
Blwyddyn ariannol
Targed (DP14)
Gwirioneddol
Ffynhonnell: Network Rail
CRI CP5 gwirioneddol a DP14 targedau (Cymru)
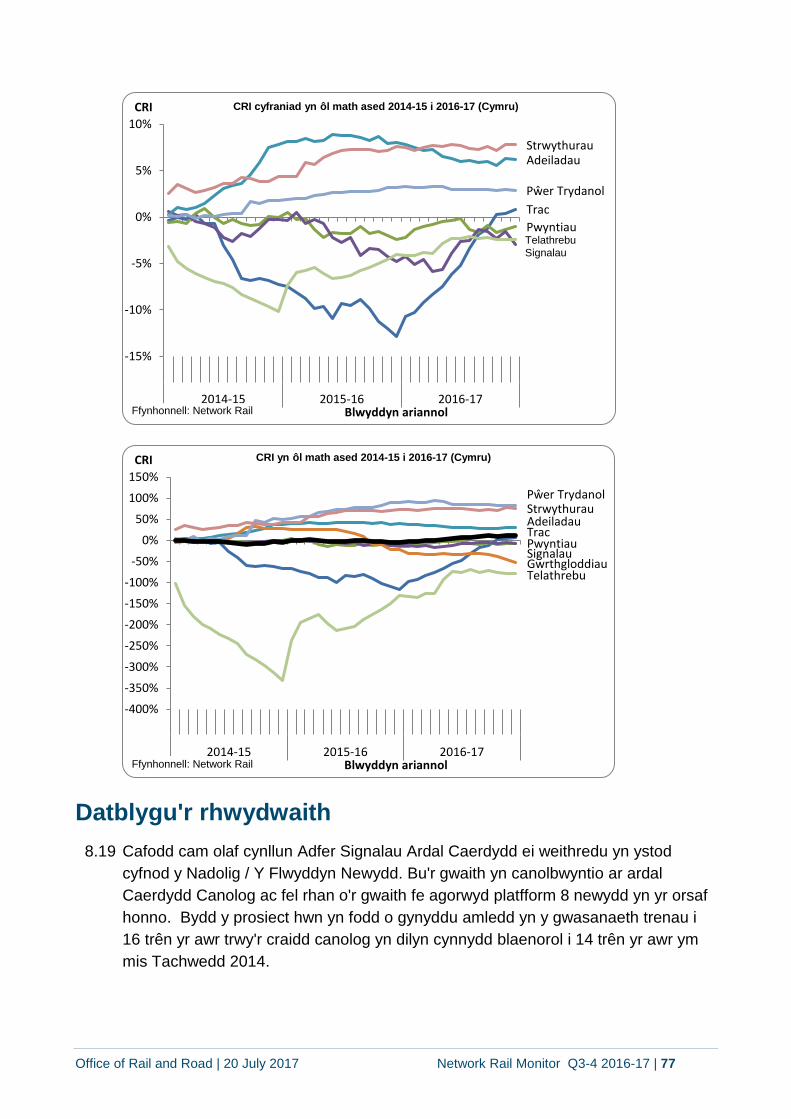
Office of Rail and Road | 20 July 2017 Network Rail Monitor Q3-4 2016-17 | 77
Datblygu'r rhwydwaith
8.19 Cafodd cam olaf cynllun Adfer Signalau Ardal Caerdydd ei weithredu yn ystod
cyfnod y Nadolig / Y Flwyddyn Newydd. Bu'r gwaith yn canolbwyntio ar ardal
Caerdydd Canolog ac fel rhan o'r gwaith fe agorwyd platfform 8 newydd yn yr orsaf
honno. Bydd y prosiect hwn yn fodd o gynyddu amledd yn y gwasanaeth trenau i
16 trên yr awr trwy'r craidd canolog yn dilyn cynnydd blaenorol i 14 trên yr awr ym
mis Tachwedd 2014.
Trac
Pwyntiau
Signalau
Adeiladau
Pŵer Trydanol
Strwythurau
Telathrebu
-15%
-10%
-5%
0%
5%
10%
2014-15 2015-16 2016-17
CRI
Blwyddyn ariannolFfynhonnell: Network Rail
CRI cyfraniad yn ôl math ased 2014-15 i 2016-17 (Cymru)
TracPwyntiauSignalau
Adeiladau
Gwrthgloddiau
Pŵer TrydanolStrwythurau
Telathrebu
-400%
-350%
-300%
-250%
-200%
-150%
-100%
-50%
0%
50%
100%
150%
2014-15 2015-16 2016-17
CRI
Blwyddyn ariannolFfynhonnell: Network Rail
CRI yn ôl math ased 2014-15 i 2016-17 (Cymru)

Office of Rail and Road | 20 July 2017 Network Rail Monitor Q3-4 2016-17 | 78
Gwariant a pherfformiad ariannol
8.20 Rydym yn dwyn i ystyriaeth perfformiad ariannol Network Rail mewn dwy ffordd; yn
gyntaf gan gynnig cymhariaeth syml o wariant Network Rail yn erbyn ei gyllideb ei
hun (Tabl 1 isod) ac yn ail, drwy ystyried ein mesur perfformiad rheoleiddiol (Tabl 2
isod).
8.21 Mae sawl ffordd y gallwn gyfleu negeseuon allweddol drwy'r mesur perfformiad
rheoleiddiol ac ymysg y dewisiadau mae'r canlynol:
cymharu un ai gyda'n penderfyniad CP5 fel y gwnawn ni yn ein Hasesiad
Effeithiolrwydd a Chyllid Blynyddol, neu gyda chyllideb flynyddol Network Rail;
yn dangos gros yr amrywiannau, neu net yr addasiadau wedi eu gweithredu yn
cydymffurfio gyda mecanwaith rhannu RAB; a
chynnwys neu hepgor yr addasiadau ar gyfer allbynnau rheoleiddiol coll.
Gwariant Tabl 1: Incwm a gwariant yng Nghymru yn 2016-17 - cymhariaeth syml o incwm a gwariant Network Rail.
Blwyddyn gyflawn 2016-17
Cyllideb Gwirioneddol Amrywiant (b/w)
Trosiant 348 347 (1)
Cynllun Atodol 4 (24) (10) 14
Cynllun Atodol 8 (2) (1) 1
Gweithredu (30) (30) 0
Cefnogaeth (37) (31) 6
Cynnal a Chadw (67) (71) (4)
Capex - Adnewyddu (222) (200) 22
Capex - Gwelliannau (208) (190) 18
Costau Ariannu (87) (88) (1)
Cyfanswm (329) (274) 55
8.22 Yn 2016-17, bu i Network Rail yng Nghymru wario £55m yn llai na'i gyllideb, yn
bennaf oherwydd:
gwariant gwaith adnewyddu £22m yn llai. Bu cyfeintiau llai na'r disgwyl (bu
gwerth y gwaith adnewyddu heb ei weithredu yn £31m) ac fe gaiff y gwaith hwn
ei gwblhau yn hwyrach ymlaen (gwelwch Dabl 2 isod). Gan ddwyn hyn i
ystyriaeth, bu cost gwaith Network Rail yn £9m yn fwy na'r disgwyl (wedi ei
addasu i £2m i gydymffurfio gyda mecanwaith rhannu RAB). Mae hyn yn bennaf
oherwydd (£8m) ar draciau gan gynnwys gwaith ychwanegol ar adnewyddu
traciau yn ystod gwarchae trydaneiddio Twnnel Hafren a chostau cynyddol ar
arwyddo (£5m), gan gynnwys £2m ar waith ail-arwyddo ym Mhort Talbot.
£18m yn llai o wariant ar welliannau. Roedd hyn yn bennaf oherwydd
gwelliannau, wedi eu hariannu gydag arian parod, is na'r disgwyl yn sgil oedi

Office of Rail and Road | 20 July 2017 Network Rail Monitor Q3-4 2016-17 | 79
ynghylch gwaith croesfan wastad wedi ei ariannu gan gyrff trydydd-parti. Mae
Network Rail yn disgwyl dal fyny efo'r gwaith a chynnal y gwaith am y gost a
gofnodwyd yn y gyllideb yn hwyrach eleni (£8m). Cafodd gwaith ar Brif Linell De
Cymru ei symud i 2017-18 (£6m). Ni fu allberfformiad nac ychwaith
tanberfformiad ynghylch gwaith gwelliannau yng Nghymru yn ystod 2016-17.
Perfformiad ariannol rheoleiddiol
8.23 Fel y disgrifwyd ym mharagraff7.21uchod, rydym hefyd yn defnyddio ein mesur
perfformiad rheoleiddiol er mwyn monitro perfformiad Network Rail. Mae'r mesur
hwn yn cynnig cyfrifiad gwell o berfformiad Network Rail oherwydd y canlynol:
Mae'n hepgor mathau penodol o incwm a gwariant nad oes modd i Network Rail
eu rheoli cymaint. Mae'r rhain yn cynnwys grant rhwydwaith, costau mynediad
traciau sefydlog, incwm trydan tracsiwn a chostau a chyfraddau busnes;
Mae'n gofalu nad ydy Network Rail yn elwa o oedi rhag gwneud gwaith tan
ddyddiad hwyrach oherwydd gwahaniaeth amser ydy o'n unig, h.y. mae dal
angen cwblhau'r gwaith yn y dyfodol;
Mae'n medru addasu ar gyfer gwerth yr allbwn heb ei gwblhau gan na ddylai
Network Rail elwa drwy beidio â chynnig ei allbynnau;
Mae'n medru addasu'r all/tanberfformiad ar waith adnewyddu a gwelliannau i
gydymffurfio gyda pholisi mecanwaith rhannu RAB: ac
Mae'n medru addasu fel bod y gymhariaeth yn erbyn PR13 yn hytrach na
chyllidebau Network Rail.
8.24 Mae Tabl 2 yn ymdrin â'r gwahanol ffyrdd o gyflwyno'r mesur perfformiad ariannol
fel y disgrifwyd ym mharagraff 8.20 uchod.

Office of Rail and Road | 20 July 2017 Network Rail Monitor Q3-4 2016-17 | 80
Tabl 2: Mesur Perfformiad Ariannol (FPM) ar gyfer Cymru yn 2016-17 - cymhariaeth o incwm a gwariant a
ddefnyddwyd yn ein cyfrifiad Mesur Perfformiad Ariannol.
£m Amrywiant
Mesur
Perfformiad
Ariannol
niwtral yn
cynnwys
amser b/(w)
Gross
(Tanberfformiad) /
allberfformiad
Net
(Tanberfformiad) /
allberfformiad
Trosiant (yn cynnwys Cymhelliant Cyfaint)33
(4)
(1)
(3)
(3)
Trefnlen 4 14 7 7 7
Trefnlen 8 1 0 1 1
Gweithrediadau 0 0 0 0
Cefnogaeth 34 12 13 (2) (2)
Cynnal a Chadw (4) 1 (2) (2)
Capex - Adnewyddu 22 31 (9) (9)
Addasiad Capex - Adnewyddu 7
Adnewyddu (net) (2)
Capex - Gwelliannau 18 18 0 0
Addasiad Capex - Gwelliannau 0
Gwelliannau (net) 0
Capex - Cyfanswm Net (2)
Mesur perfformiad ariannol o gymharu gyda chyllideb Network Rail
(7) 0
Cyllideb Network Rail o gymharu gyda PR13 (gros)
(78) (78)
Addasiad Capex ar gyfer adnewyddu a gwelliannau
40
Llai: Cyllideb Network Rail o gymharu gyda PR13 (net)
(30)
Gros Mesur Perfformiad Ariannol cyn addasiad ar gyfer allbynnau rheoleiddiol
(85) (30)
Llai: Addasiad ar gyfer allbynnau rheoleiddiol coll
(4) (4) (4)
Cyfanswm Mesur Perfformiad Ariannol (FPM)
(89) (34)
8.25 Mae tanberfformiad ariannol rheoleiddiol Network Rail ar gyfer y flwyddyn 2016-17
yn £34m. Mae hyn yn bennaf oherwydd effeithiolrwydd is a chostau uned uwch na'r
disgwyl.
8.26 Mae'r tanberfformiad ariannol hwn yn gyfuniad o sawl elfen, gan gynnwys y
canlynol:
Mae perfformiad ariannol gros Network Rail ar gyfer 2016-17 yn £7m yn groes i
gyllideb Network Rail ei hun. Y maes lle bu'r mwyaf o danwariant, o gymharu
33Yn hepgor yr elfennau incwm sydd ddim yn berthnasol i berfformiad Network Rail: Grant Rhwydwaith a chostau Mynediad Sefydlog.
Mae'r rhifau felly yn amrywio i'r costau Trosiant yn Nhabl 1.
34 Yn cynnwys cyfraddau a chostau diwydiant Mae'r rhifau felly yn amrywio i'r costau cefnogi yn Nhabl 1.

Office of Rail and Road | 20 July 2017 Network Rail Monitor Q3-4 2016-17 | 81
â'i gyllideb ei hun ydy adnewyddu traciau (£8m) yn deillio o waith ychwanegol
gan gynnwys gwarchae trydaneiddio Twnnel Hafren a chostau cynyddol ar
arwyddo (£5m), yn cynnwys gwaith gwerth £2m ar ail-arwyddo Port Talbot.
Mae cyllideb 2016-17 Network Rail ei hun yn £78m yn waeth, o ran gros35 nag
ein penderfyniad. Mae hyn yn sgil effeithiolrwydd llai a chostau uned uwch nag
inni eu tybio yn ein penderfyniad ynghylch y rhan fwyaf o waith busnes craidd; a
8.27 Bu i Network Rail amcan y byddwn yn gwneud addasiad o £2m i'n perfformiad
ariannol am y tanddarpariaeth o'r allbynnau rheoleiddiol Mesur Perfformiad
Cyhoeddus (PPM) yn 2016-17.
Jhgjhgjhg Effeithiolrwydd
8.28 Yng Nghymru, bu i Network Rail ddatgan gostyngiad yn yr effeithiolrwydd o -7.8%
ar Weithrediadau, Cefnogaeth, Cynnal a Chadw ac Adnewyddu (OSMR) (Prydain
Fawr -5.0%) ar gyfer y cyfnod rheoli hyd yn hyn o gymharu â'n penderfyniad PR13
o 10.1% ar gyfer Prydain Fawr yn ei chyfanrwydd36. Mae hyn yn cyfuno'r enillion
effeithiolrwydd o 8.0% ar gyfer gweithrediadau, cefnogaeth a gwaith cynnal a chadw
(Prydain Fawr 6.8%) ond gostyngiad o -20.5% mewn effeithiolrwydd ar gyfer gwaith
adnewyddu (Prydain Fawr -17.1%) yn bennaf oherwydd trafferthion ail-arwyddo yn
ardal Caerdydd fel y soniwyd amdanyn nhw uchod.
8.29 Erbyn diwedd CP5 mae Network Rail Cymru yn disgwyl cyflawni effeithiolrwydd o
16.0% ar Weithrediadau, Cefnogaeth, Cynnal a Chadw ac Adnewyddu (OSMR)
(H.y. bydd yn gadael CP5 yn 16.0% yn fwy effeithlon ers cychwyn CP5). Mae hyn
yn llai na'n amcan ni o 19.5%
Gwariant (ac eithrio dyraniadau cost uned ganolog)
8.30 Caiff costau uned canolog, fel amryw gostau HQ ac eiddo eu dyrannu i'r llwybrau.
Yn 2016-17, bu'r costau canolog o £1.3biliwn ym Mhrydain Fawr yn oddeutu 14% o
gyfanswm gwariant y llwybr. Mae'r rhain yn cynnwys costau trydan tracsiwn (ond
nid ar gyfer Cymru), caiff eu hadennill drwy incwm, cyfraddau busnes a chostau
diwydiant eraill hefyd fel prosiectau cyfalaf caiff eu rheoli yn ganolog fel prosiectau
Cyfrifiadureg, ORBIS a pheiriannau.
8.31 Mae'r tablau blaenorol yn dangos y ffigyrau ar ôl dyraniadau hyn. Ond i fod yn fwy
cymaradwy â llwybrau eraill, mae Tabl 3 yn ymdrin â gwariant Cymru o gymharu
gyda chyllideb Network Rail cyn dyrannu'r costau uned canolog.
35 yn nhermau Mesur Perfformiad Ariannol roedd £30m yn waeth.
36Mae ein mesur effeithiolrwydd yn fesur syml o'r newid dros amser mewn gwariant ynghylch gweithrediadau, cynnal a chadw a gwaith adnewyddu. Mae'r mesur hwn yn cymharu gwariant gwirioneddol yn 2015-16 gyda gwariant gwirioneddol yn 2013-14 (y flwyddyn olaf o gyfnod rheoli 4) wedi ei addasu ar gyfer lefel y gwaith a materion eraill
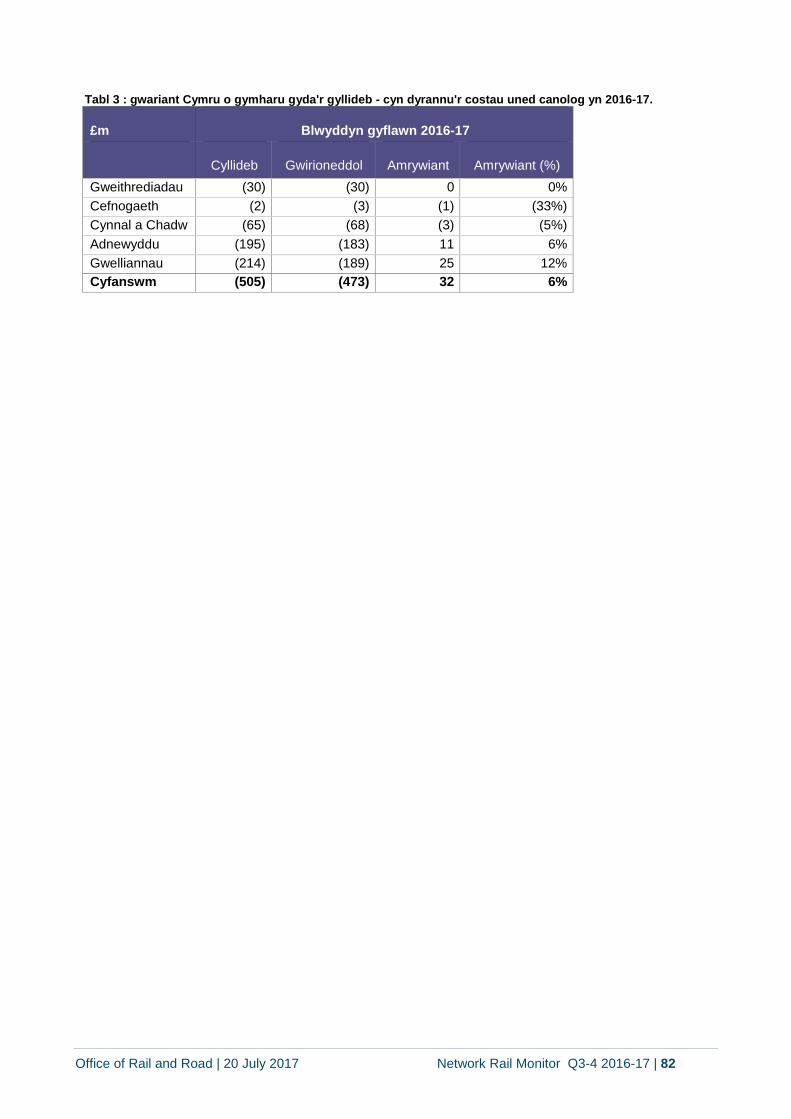
Office of Rail and Road | 20 July 2017 Network Rail Monitor Q3-4 2016-17 | 82
Tabl 3 : gwariant Cymru o gymharu gyda'r gyllideb - cyn dyrannu'r costau uned canolog yn 2016-17.
£m Blwyddyn gyflawn 2016-17
Cyllideb Gwirioneddol Amrywiant Amrywiant (%)
Gweithrediadau (30) (30) 0 0%
Cefnogaeth (2) (3) (1) (33%)
Cynnal a Chadw (65) (68) (3) (5%)
Adnewyddu (195) (183) 11 6%
Gwelliannau (214) (189) 25 12%
Cyfanswm (505) (473) 32 6%
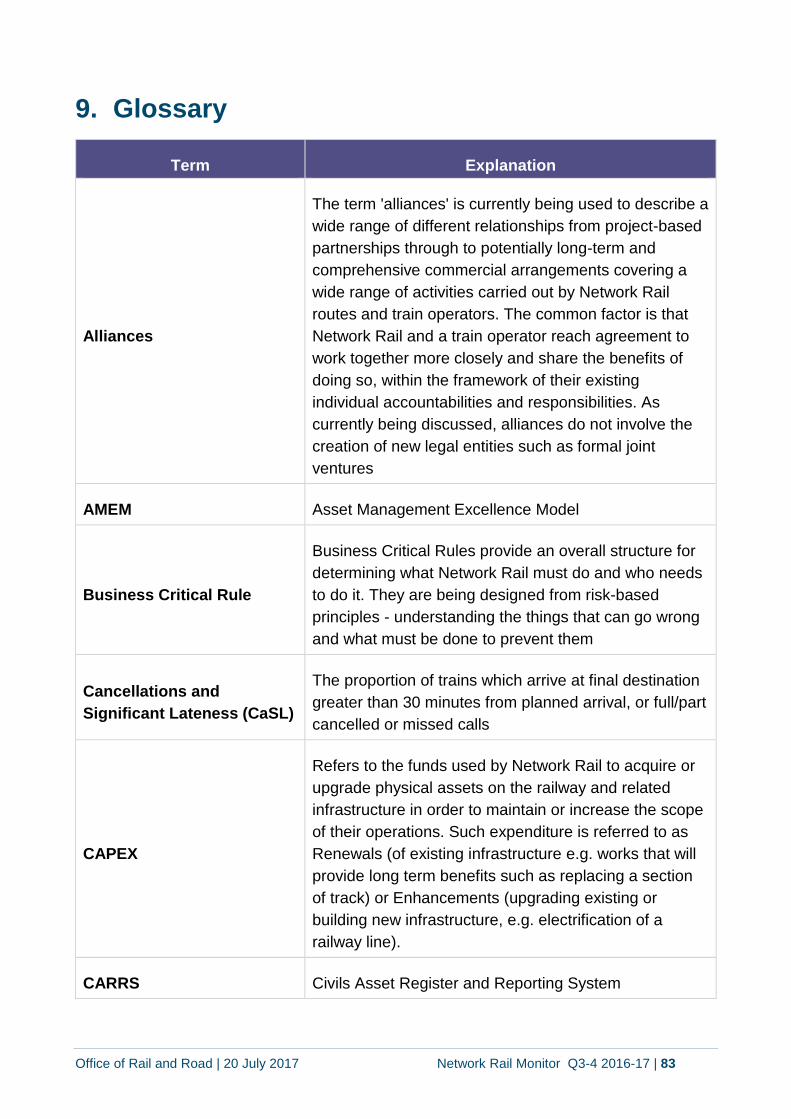
Office of Rail and Road | 20 July 2017 Network Rail Monitor Q3-4 2016-17 | 83
9. Glossary
Term Explanation
Alliances
The term 'alliances' is currently being used to describe a
wide range of different relationships from project-based
partnerships through to potentially long-term and
comprehensive commercial arrangements covering a
wide range of activities carried out by Network Rail
routes and train operators. The common factor is that
Network Rail and a train operator reach agreement to
work together more closely and share the benefits of
doing so, within the framework of their existing
individual accountabilities and responsibilities. As
currently being discussed, alliances do not involve the
creation of new legal entities such as formal joint
ventures
AMEM Asset Management Excellence Model
Business Critical Rule
Business Critical Rules provide an overall structure for
determining what Network Rail must do and who needs
to do it. They are being designed from risk-based
principles - understanding the things that can go wrong
and what must be done to prevent them
Cancellations and
Significant Lateness (CaSL)
The proportion of trains which arrive at final destination
greater than 30 minutes from planned arrival, or full/part
cancelled or missed calls
CAPEX
Refers to the funds used by Network Rail to acquire or
upgrade physical assets on the railway and related
infrastructure in order to maintain or increase the scope
of their operations. Such expenditure is referred to as
Renewals (of existing infrastructure e.g. works that will
provide long term benefits such as replacing a section
of track) or Enhancements (upgrading existing or
building new infrastructure, e.g. electrification of a
railway line).
CARRS Civils Asset Register and Reporting System
Office of Rail and Road | 20 July 2017 Network Rail Monitor Q3-4 2016-17 | 84
CDM Construction (Design and Management) Regulations
2015
CEFA Civil Engineering Framework Agreement
Central technical authority
Civils A term describing only those responsible for structures
such as bridges
Composite Reliability Index
(CRI)
It provides an indication of the contribution of asset
reliability to the safety and performance of the railway.
Control Period
A control period is the period to which an access
charges review (e.g. a periodic review) applies. Control
periods are typically five years in length, but maybe
shorter or longer depending on what the regulator
decides as part of the review.
CP6 covers from 1 April 2019 to 31 March 2024 CP5 covers from 1 April 2014 to 31 March 2019 CP4 covers from 1 April 2009 to 31 March 2014 CP3: 1 April 2004 to 31 March 2009 CP2: 1 April 2001 to 31 March 2004 CP1: from the privatisation of Railtrack to 31
March 2001
CSAMS Civils Strategic Asset Management Solution
DPI Delay per incident
DfT Department for Transport
Earthworks Natural earth slopes and earth-related structures such
as cuttings and embankments
East West Rail Planned project to connect East Anglia with Milton
Keynes and Oxford.
ECAM Enhancements cost adjustment mechanism
Office of Rail and Road | 20 July 2017 Network Rail Monitor Q3-4 2016-17 | 85
Eddy Current Testing
A system using electromagnetism to detect and assess
discontinuities in metal; adapted specialist technology to
categorise maximum crack length and depth in every
metre of rail.
EDP Enhancements Delivery Plan
EGIP Edinburgh to Glasgow Improvements Programme
EIP Enhancements Improvement Programme
EIS Entry into service
Ellipse
Computer based asset management system used by
Network Rail to record and prioritise the maintenance
work required to be done and when.
Enhancements
Schemes to change to network outputs, usually
involving construction, that improves network capacity
or capability (e.g. enabling higher speeds, allowing
heavier loads) relative to the level of network outputs
funded at the last relevant periodic review. Usually
outputs are required at specific times (in contrast to
most renewals).
Final Determination Our final determination sets out our overall package of
decisions for the periodic review 2013 (PR13).
Fixed Track Access
Charges
The fixed track access charge (FTAC) recovers
Network Rail’s net revenue requirement. The net
revenue requirement is the revenue that we determined
in a periodic review is required by Network Rail to run
its business, after accounting for the income received
from short-run variable track access charges, regulated
station charges, other single till income and the network
grant. The FTAC is only paid by franchised passenger
train operators.

Office of Rail and Road | 20 July 2017 Network Rail Monitor Q3-4 2016-17 | 86
FPM Financial Performance Measure
Freight Delivery Metric
(FDM)
This measure tracks the punctuality of freight services
at destination as well as taking into account Network
Rail caused delays.
Gauge
Distance between the inner running faces of two rails on
the same track. Also used to describe the "envelope"
through which train profiles must fit; this is the structure
gauge.
Gearing
Gearing refers to the level of a company's debt related
to its equity capital, usually expressed in percentage
form. It is a measure of a company's financial leverage
and shows the extent to which its operations are funded
by lenders versus shareholders.
GEOGIS
"Geographic and Infrastructure Systems" - A major
database of railway infrastructure assets containing
information on the physical location of track, buildings
and structures.
Green Zone
An area of protection for workers, which separates work
on the railway line from train movements. The simplest
way of arranging such a zone is to stop movements of
all trains on all lines at the location concerned.
Fencing off the work area may be an acceptable
alternative but requires reduced speed operation.
GRIP
Guide to railway investment projects. A Network Rail
formal procedure through which every investment
project on Network Rail’s network must pass. It consists
of a number of stages; at the end of these a review is
carried out and if the project cannot meet the pass
criteria it is stopped or held until it does.
Office of Rail and Road | 20 July 2017 Network Rail Monitor Q3-4 2016-17 | 87
GSM-R
Global system for mobile communications - railway. An
international wireless communications standard for
railway communication.
GTR Govia Thameslink Railway
GWEP Great Western Electrification Programme
HAVS Hand Arm Vibration Syndrome
HCE Hidden Critical Elements -
High Output Track renewal A system for renewing track in part or as a whole far
more quickly than has been possible in the past.
HSE Health and Safety Executive
IMS Incident Management System
Independent Reporter
A consultant whose role is to provide ORR with
independent, professional opinions and advice relating
to Network Rail's (as the railway licence holder)
provision or contemplated provision of railway services,
with a view to ORR relying on those opinions or advice
in the discharge by ORR of its functions.
Intercity Express
Programme (IEP)
An initiative of the Department for Transport (DfT) to
procure new trains to replace the InterCity 125 fleet on
the East Coast Main Line and Great Western Main Line.
There are to be two variants: the Class 800, which are
electric/diesel-electric hybrids and the Class 801, which
are electric only.
Investments Investments cover all enhancements but also include
major projects such as route upgrades or renewals.
Office of Rail and Road | 20 July 2017 Network Rail Monitor Q3-4 2016-17 | 88
Linear Asset Decision
Support tool
System used to consolidate Network Rail’s complex
engineering data and provide insight from that data to
engineers, enabling them to make better decisions on
managing the track.
Linespeed
The maximum safe speed for a train to travel on any
section of railway line taking into account infrastructure
limitations.
LNE/EM London Northeast / East Midlands Route
LNW London Northwest Route
LSR Life Saving Rules
LTIFR Lost time Injury Frequency Rate
MDU Maintenance Delivery Units
MOU Memorandum of understanding
Moving Annual Average
(MAA)
Moving annual average - the average of the last 13
four-week time periods.
Network Grant A proportion of Network Rail’s income in the past has
been paid directly by DfT and Transport Scotland in the
form of network grants. Over CP5, more than 60% of
Network Rail’s income is forecast to come from network
grants.
Network Licence Network Rail operates under a network licence. This
licence contains a set of conditions under which
Network Rail must operate. As the operator and owner
of the national rail infrastructure, it has a key role to play
in railway safety and improving railway performance
Office of Rail and Road | 20 July 2017 Network Rail Monitor Q3-4 2016-17 | 89
and efficiency. The network licence is a tool we have for
holding Network Rail to account.
Network Rail managed
stations
Managed stations are the stations at which Network
Rail is the station facility owner. There are currently 18
managed stations, these are all large stations. A list of
the managed stations is available on the Network Rail
website.
NTQP Night time quiet period
ONS Office of National Statistics
Operational Property Buildings, land and structures in use as part of the
operational railway.
OPEX Operating expense: as distinct from CAPEX (capital
expenditure), OPEX refers to ongoing costs incurred by
Network Rail to maintain the railway infrastructure.
Examples of OPEX include routine safety checks on the
railway tracks or repairing signalling when it fails.
ORBIS Offering Rail Better Information Services. A Network
Rail initiative, its aim is to make information available in
all forms including a mobile access and a local view to
avoid site visits.
Overhead Line Equipment
(OLE)
An assembly of metal conductor wires, insulating
devices and support structures used to bring traction
supply current to suitably equipped traction units. The
conducting wires are normally strung between masts or
poles in some form of catenary arrangement but simple
systems may have a single trolley wire.
Performance Strategy Jointly prepared plans agreed between Network Rail
and a train operator to improve performance.

Office of Rail and Road | 20 July 2017 Network Rail Monitor Q3-4 2016-17 | 90
Plain Line Pattern
Recognition (PLPR)
Technology used to monitor the condition of the track
Plain Line Track Track without switches and crossings
Planning and Delivering
Safe Work (PDSW)
PDSW is a wholesale reform of how infrastructure
projects are planned and delivered safely and,
ultimately, it makes clear who is responsible.
Possession Disruption
Index (PDI)
'Possession disruption index – passenger' (PDI-P) and
'Possession disruption index – freight (PDI-F)': a graph
indicating the level of disruption caused by possessions
over a period of time.
Network Rail needs to restrict access to the network to
carry out many of its maintenance and renewals
activities.
These restrictions of access are referred to as
possessions. Possessions are considered to be
'disruptive' if they impact on the running of passenger or
freight operators' normal timetabled services.
Possessions Network Rail needs to restrict access to its network to
carry out many of its maintenance and renewals
activities. These restrictions of access are referred to as
possessions.
PPE Personal Protective Equipment
Public Performance
Measure (PPM)
The Public Performance Measure (PPM) is the
percentage of trains arriving at their final destination
within 5 minutes of their scheduled arrival time (within
10 minutes for long distance services).
RAB Regulatory asset base: The Office of Rail and Road's
calculation of the value of Network Rail's assets.
Office of Rail and Road | 20 July 2017 Network Rail Monitor Q3-4 2016-17 | 91
RBM Risk Based Maintenance
Regulated Outputs
These are outputs that we determine as part of our
periodic review that Network Rail is required to deliver
over the relevant control period.
Relay Room A building housing safety critical electrical and
electronic signalling equipment such as relays that
interface with trackside equipment such as points and
signals.
Renewals Major capital works or replacement of the network in
order to maintain its required capability. These may be
required at specific times but are more often carried out
according to Network Rail's own timetable
RIDDOR Reporting of Injuries, Diseases and Dangerous
Occurrences Regulations 2013.
Right Time Performance measure measuring train arrival within one
minute of the scheduled time
RM3
Rail Management Maturity Model: the tool we use to
assess an organisation's ability to achieve excellence in
controlling health and safety risks.
ROC Route Operating Centres
Rolling contact fatigue General term covering all types of damage incurred at
the wheel rail interface.
Route availability A code used to indicate which rolling stock can use
which routes.
RPI Retail Price Index

Office of Rail and Road | 20 July 2017 Network Rail Monitor Q3-4 2016-17 | 92
Safety Management System
(SMS)
In essence, it is a formal arrangement for a safer
working environment. All operators and duty holders are
now required to have arrangements in place for
managing safety risks. A safety management system
defines roles and responsibilities, sets arrangements for
safety mechanisms, involves workers in the process
and ensures continuous improvement.
Schedule 4
Schedule 4 (the possessions regime) is the part of
passenger and freight operators’ track access contract
with Network Rail that sets out arrangements for
compensation to the operator in the event of planned
disruption to their services.
Schedule 8
Schedule 8 (the performance regime) is the part of
passenger, freight and charter operators’ track access
contract with Network Rail that sets out arrangements
for compensation in the event of unplanned disruption
to services.
Scour
The removal of material from a bed or bank of a
watercourse or material from a beach by current or
wave action. This is a particular problem where the
removed material was providing support or restraint to a
structure such as a bridge pier or retaining wall,
ultimately leading to its collapse.
Section Manager
A supervisory post responsible for the day to day
maintenance of the track within a permanent way
section or area or division.
Single-cut cables
The provision of controls in only the feed or return side
of a circuit, used only where there is no risk of false
feeds or faults to earth.
SORAT Single Overrun Asset Tool

Office of Rail and Road | 20 July 2017 Network Rail Monitor Q3-4 2016-17 | 93
Switches and Crossings
(S&C)
Track consisting of switches (an assembly of two
movable rails – the switch rails) and two fixed rails (the
stock rails) and crossings (an assembly that permits the
passage of wheel flanges across other rails where
tracks intersect.
SWML
South West Mainline
SWT Southwest Trains
Temporary Non Compliance
(TNC)
An approved time-bound derogation from a requirement
in a company standard.
Temporary Speed
Restriction (TSR)
Temporary speed restriction imposed for safety
reasons. This can arise from the poor condition of track,
structures, earthworks, hot weather effects, or following
track relaying until the track bed is stabilised.
TOC Train operating companies: run the (passenger and
freight) trains and services on the network.
Track Geometry The horizontal and vertical alignment of the track.
Train Accident Precursors
Indicator Model (PIM)
RSSB’s Precursor Indicator Model (PIM) provides a
measure of the underlying risk from train accidents by
tracking changes in the occurrence of accident
precursors
Train Regulation The itinerary for any of the driver, guard and/or train
manager of a train.
Tubular Stretcher Bars
The function of a stretcher bar is to keep the two rails in
a railway switch a defined distance apart at all times
and to ensure that both rails move simultaneously as a
coupled pair when commanded
Office of Rail and Road | 20 July 2017 Network Rail Monitor Q3-4 2016-17 | 94
Twist Faults Where particular misalignments between the heights of
rails which can cause the risk of train derailment.
Underbridge Bridges that allow passage under the railway.
Whistle Board
A white circular sign with a grey edge and black W in
the centre that indicates to a train driver that they must
sound the horn or whistle. This is often used to provide
warning to users of accommodation, footpath and
occupation crossings.

Geoffrey Charin
© Crown copyright 2017
This publication is licensed under the terms of the Open Government Licence v3.0 except where otherwise stated. To view this licence, visit nationalarchives.gov.uk/doc/open-government-licence/version/3 or write to the Information Policy Team, The National Archives, Kew, London TW9 4DU, or email: [email protected].
Where we have identified any third party copyright information you will need to obtain permission from the copyright holders concerned.
This publication is available at orr.gov.uk
Any enquiries regarding this publication should be sent to us at orr.gov.uk