Network Performance Report 2016 - MCMC · Network Performance Report 2016 ... Lastly, on the wired...
44
Network Performance Report 2016 Measuring broadband and voice performance Published: 27 January 2017
Transcript of Network Performance Report 2016 - MCMC · Network Performance Report 2016 ... Lastly, on the wired...

Network Performance Report 2016 Measuring broadband and voice performance
Published: 27 January 2017
2
Contents
Section Page 1 Executive Summary 3 2 Wireless broadband performance 5 3 Wired broadband performance 25 4 Voice call performance 30

3
Executive Summary This report provides information on the results of network performance measurement conducted by
MCMC across six regions within Malaysia. The respective regions are Central, Southern, Northern,
Eastern, Sarawak and Sabah. The measurement involves measuring performance of mobile and fixed
wireless broadband, wired broadband and voice on public cellular service. Service providers evaluated
were Celcom, DiGi, Maxis and U Mobile for public cellular service and mobile broadband. As for fixed
wireless broadband the service providers measured were Packet One (now known as Webe) and YES.
Lastly, on the wired broadband network performance, service providers involved were Maxis, Time
DotCom and Telekom Malaysia (TM). It is important to note that the results shown here does not reflect
the Malaysian-wide performance and is limited to the areas being measured. However, the
measurements were done in major cities for each regional areas to reflect on the performance in high
demand areas.
The results provide snapshots of performance from January to December 2016. During which all
operators involved in the assessment may have carried out varying degree of network maintenance and
modernization on their network which may have impacted their results. All results were gathered based
on the offered service at the particular tested areas. For mobile broadband, the user equipment (UE) or
mobile phones were not locked into any particular technology band but measurements were done in 3G
and LTE coverage areas. Meanwhile for fixed wireless broadband, measurements were conducted in
areas having WiMAX coverage. For wired broadband, the measurements were conducted at customer’s
premises who had subscribed to either fibre or Digital Subscriber Line (DSL) type of broadband internet
service.
KEY METRICS
The report focuses on the key metrics being measured based on the Mandatory Standards imposed by
MCMC which are relevant to the consumer experience. The network performance being measured for
wireless and wired broadband are throughput (download and upload speeds), network latency and
packet loss. Then for voice call performance, the parameters measured are call setup success rate
(CSSR) and dropped call rate (DCR). This report will present the average results across all regions, as
well as the distributions, to give a glimpse of the performance for the particular test areas.
For wireless broadband, only download speeds were taken into account due to the dynamic
characteristics and asymmetrical design of the wireless network. The proportion of tests that produced
download speeds greater than 650 kbit/s is considered as an addition to the overall averages, as such
speeds are likely to be sufficient to support basic videos services. The percentage of the time a
subscriber is able to get throughput above the required speed will give good indication on the
consistency of the network and how the networks respond under stressed conditions.
For wired broadband, both download and upload speeds were measured. Throughput measured must
not be less than 70% of the subscribed level for DSL and must not be less than 90% of the subscribed
level for fibre. For both DSL and fibre, the required proportion for the minimum throughput is 90% of
the measured time.

4
In terms of voice call performance, successfully setting up and maintaining a voice call remains
important for many consumers. Therefore, the minimum CSSR level required is set at 95% while the DCR
must not be more than 3%.
Overall results and as well as results within each region for all the discussed services will be described in
detail in the following sections within this report.

5
Wireless Broadband Performance
Background
From January to November 2016, MCMC conducted a nationwide wireless broadband network
performance measurement based on the Mandatory Standards for Quality of Service (QoS) on Wireless
Broadband Services. The measurement was segregated into two categories for wireless broadband:
cellular mobile broadband and fixed wireless broadband. For cellular, the requirement is to have at least
650 kbit/s throughput for at least 65% of the time. While for fixed wireless broadband, the throughput
requirement is at least 650 kbit/s for at least 80% of the time. For the period of 2016- end 2017,
networks deployed are mostly 3G technology. Beginning 2018, after spectrum re-farming is completed
the throughput requirement is set to 1Mbps.Higher standards set for fixed wireless broadband is due to
its main characteristics on serving data only whilst no load required to deliver voice via circuit switch
network such as in cellular mobile’s 3G network. Other aspects of the network performance being
measured are the network latency must not be more than 250 ms packet round trip time at least 70% of
the time and packet loss not more than 3%.
The method of measurement for the above are based on MCMC’s own test device which is a standard
user equipment (UE) with installed proprietary software to interact with probe and server designed for
this purpose of measurement. The download speeds are measured by downloading files from a host
server located in the Malaysian Internet Exchange (MyIX) in Kuala Lumpur. While network latency is
calculated based on packets round trip time between user end and MyIX. The UE or smartphones used
for cellular test are category 4 (CAT4) phones which are LTE capable. Therefore, results shown hereafter
only reflect the capabilities of the test phones. Category 4 phones were chosen to fairly benchmark
between the existing network providers. While fixed wireless broadband or WiMAX services were
measured using consumer end modem attached to a probe.
The selection of the test location is based on a number of criteria, but must at least have 3G coverage
and typically the location tested are areas with high data usage such as commercial areas, business
areas, towns, tourist hotspots, complaint areas that are within coverage and government administration
office areas.
Nationwide Overall Results
Figure 1 outlines the overall results of the measurement for the key metrics at an aggregate level across
all regions for cellular mobile broadband. While Figure 2 outlines the overall results for fixed wireless
broadband WiMAX.
Figure 1: Key metrics scorecard for cellular mobile broadband
Service Provider Throughput Network Latency
Average Download Speed
Speeds over 650 kbit/s
% of the time latency ≤ 250 ms
Packet Loss
Celcom 18.97 Mbit/s 99.28% 94.08% 1.10%
DiGi 16.55 Mbit/s 98.88% 88.18% 0.52%

6
Maxis 22.89 Mbit/s 99.76% 90.28% 0.49%
U Mobile 11.74 Mbit/s 98.56% 72.92% 3.95%
Figure 2: Key metrics scorecard for WiMAX
Service Provider Throughput Network Latency
Average Download Speed
Speeds over 650 kbit/s
% of the time latency ≤ 250 ms
Packet Loss
Packet One 4.58 Mbit/s 93.30% 88.28% 1.71%
YES 5.62 Mbit/s 89.37% 94.37% 0.34%
Based on average results obtained from measurements conducted by MCMC at an aggregate level
across all regions, it could be observed that Maxis offers the fastest download speed compared to all
other service providers with an average speed of 22.89 Mbit/s. Overall ranking on the average download
speed for all service providers across all regions is shown in Figure 3 below:
Figure 3: Average Download Speeds Ranking Nationwide
From the throughput measurement results, Maxis recorded the fastest average download speeds in 5
out of 6 regions during the measurement period. Maxis was fastest in terms of download speeds in
southern, northern, eastern, Sarawak and Sabah region. While only in central region Maxis did not
manage to top the throughput chart, instead it was Celcom which recorded the fastest download speed
in areas covering from Klang Valley to Negeri Sembilan. There is a gap between the average speeds
obtained from cellular mobile broadband against speeds obtained from fixed wireless broadband. This is
mainly due to the rapid rollout of LTE service across all 6 regions by the cellular service providers. The
WiMAX technology measured for fixed wireless broadband were not able to offer similar or match the
high data rate characteristics of LTE network.
It is also important to note that the measurements were conducted mainly on a street level
environment, whereby the received signals on test devices are usually at good to optimum levels. This is
to reflect on the existing outdoor base stations which takes into account the street level network
7
deployments. Therefore, the experience might differ if not degraded if consumers were to access the
network from within a building due to signal attenuation caused by walls penetration loss.
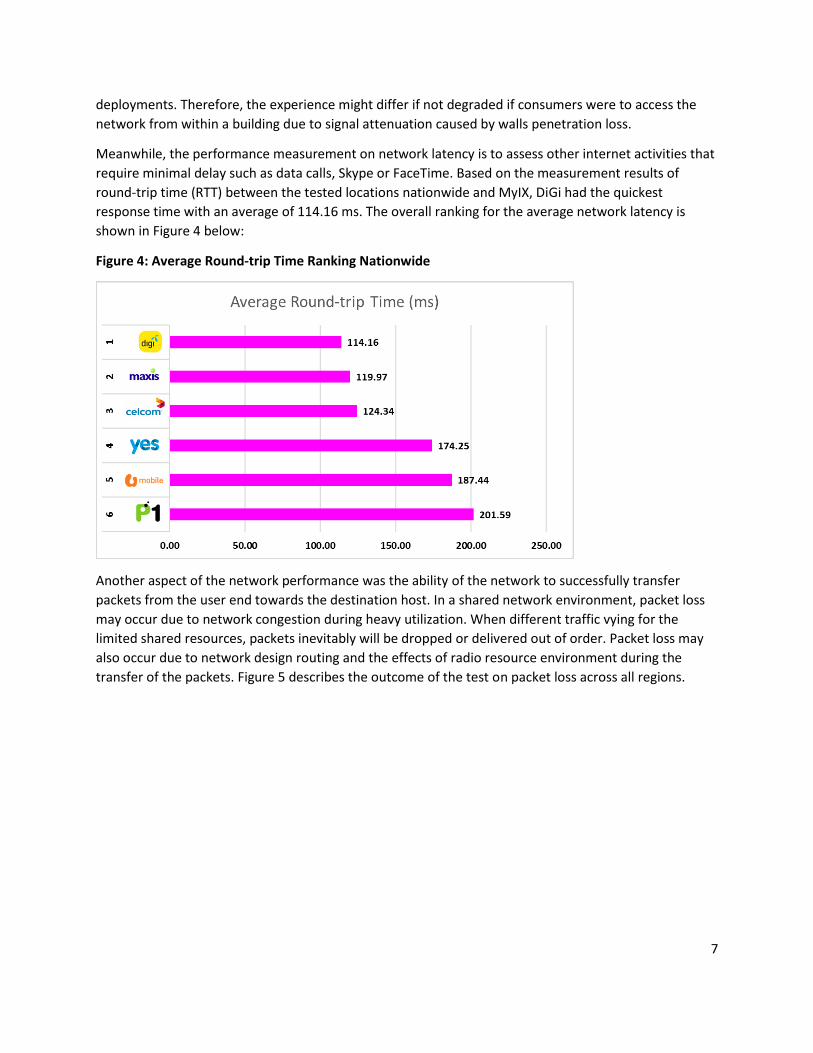
Meanwhile, the performance measurement on network latency is to assess other internet activities that
require minimal delay such as data calls, Skype or FaceTime. Based on the measurement results of
round-trip time (RTT) between the tested locations nationwide and MyIX, DiGi had the quickest
response time with an average of 114.16 ms. The overall ranking for the average network latency is
shown in Figure 4 below:
Figure 4: Average Round-trip Time Ranking Nationwide
Another aspect of the network performance was the ability of the network to successfully transfer
packets from the user end towards the destination host. In a shared network environment, packet loss
may occur due to network congestion during heavy utilization. When different traffic vying for the
limited shared resources, packets inevitably will be dropped or delivered out of order. Packet loss may
also occur due to network design routing and the effects of radio resource environment during the
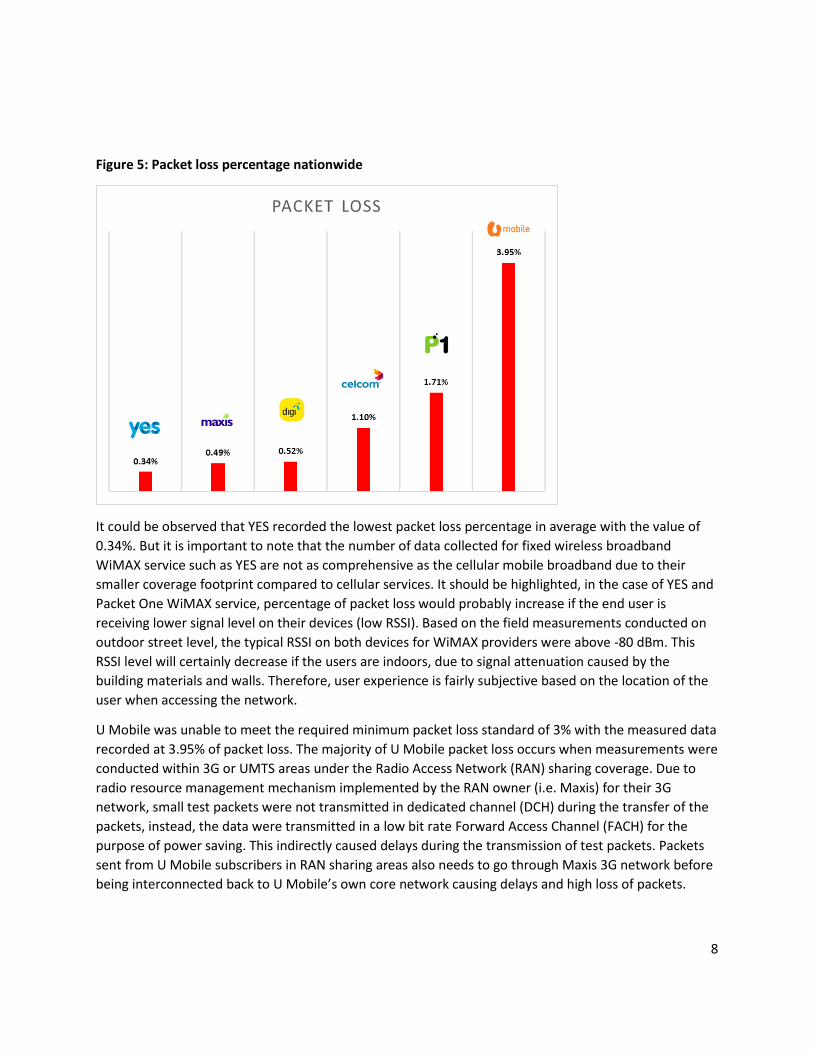
transfer of the packets. Figure 5 describes the outcome of the test on packet loss across all regions.
8
Figure 5: Packet loss percentage nationwide
It could be observed that YES recorded the lowest packet loss percentage in average with the value of
0.34%. But it is important to note that the number of data collected for fixed wireless broadband
WiMAX service such as YES are not as comprehensive as the cellular mobile broadband due to their
smaller coverage footprint compared to cellular services. It should be highlighted, in the case of YES and
Packet One WiMAX service, percentage of packet loss would probably increase if the end user is
receiving lower signal level on their devices (low RSSI). Based on the field measurements conducted on
outdoor street level, the typical RSSI on both devices for WiMAX providers were above -80 dBm. This
RSSI level will certainly decrease if the users are indoors, due to signal attenuation caused by the
building materials and walls. Therefore, user experience is fairly subjective based on the location of the
user when accessing the network.
U Mobile was unable to meet the required minimum packet loss standard of 3% with the measured data
recorded at 3.95% of packet loss. The majority of U Mobile packet loss occurs when measurements were
conducted within 3G or UMTS areas under the Radio Access Network (RAN) sharing coverage. Due to
radio resource management mechanism implemented by the RAN owner (i.e. Maxis) for their 3G
network, small test packets were not transmitted in dedicated channel (DCH) during the transfer of the
packets, instead, the data were transmitted in a low bit rate Forward Access Channel (FACH) for the
purpose of power saving. This indirectly caused delays during the transmission of test packets. Packets
sent from U Mobile subscribers in RAN sharing areas also needs to go through Maxis 3G network before
being interconnected back to U Mobile’s own core network causing delays and high loss of packets.

9
Regional Results
Central Region
Figure 6 shows the aggregate measurement results of throughput test in central region. Measurements
were conducted in Q1 and with some additional tests in Q4, 2016. Central region test location covers
some part of Kuala Lumpur, Selangor and Negeri Sembilan.
Figure 6: Central region average throughput (cellular mobile & fixed wireless)
Result shows that Celcom offers the fastest download speed in central region areas with an average
speed of 24 Mbit/s. Followed by Maxis at 21 Mbit/s, Digi at 16 Mbit/s and U Mobile at 14 Mbit/s.
Meanwhile for WiMAX providers, YES recorded an average speed of 7 Mbit/s and P1 at 3 Mbit/s. All
service providers able to provide consistent speeds over 650 kbit/s for more than 80% of the time during
the measurement period.
Results for the average round-trip time (RTT) and packet loss for measurement conducted within central
region are shown in Figure 7 below:

10
Figure 7: Central region network latency and packet loss performance
All service providers were able to meet both RTT and packet loss percentage requirements except for
Packet One which had the highest packet loss percentage at 6%. In average Celcom had the fastest
response with an average RTT of 121 ms during tests conducted in central region areas. Both Celcom
and Maxis displayed good network reliability with lowest packet lost percentage at 0.8% respectively.
Test location areas within central region are marked in the map shown below:

11
Overall, the results revealed commendable download speeds for all cellular mobile and fixed wireless
broadband service for majority of the test locations within central region. A partial of the test locations
were selected based on consumer complaints on broadband service speed. Test were conducted on a
street level statically nearby the complaint locations. One example of a complaint area is in Bandar
Puteri Puchong, whereby Digi recorded an average download speed of 2 Mbit/s, but the signal
fluctuated between 3G signal and EDGE signal even though the area is within 3G coverage. The
fluctuation of the receiving signals caused unstable connection to the end user, therefore consumers
will experience lags during web browsing or data connection activities. Results shown that Digi managed
to achieve download speeds over 650 kbit/s for only 60% of the time during the test measurement. Test
results key metrics for complaint area in Bandar Puteri Puchong is shown in figure 8.
Figure 8: Bandar Puteri Puchong complaint area key metrics
Service Provider Throughput Network Latency
Average Download Speed
Speeds over 650 kbit/s
% of the time latency ≤ 250 ms
Packet Loss
Celcom 34.53 Mbit/s 100% 100% 0%
DiGi 2.77 Mbit/s 60% 61.54% 33.85%
Maxis 43.21 Mbit/s 100% 100% 0%
U Mobile 11.24 Mbit/s 100% 88.46% 9.23%

12
Due to the unstable connection, high packet loss could also be observed for Digi and U Mobile. The area
tested is a prime commercial area; highly populated during day time and surrounded by buildings and
shop lots. The measurement was conducted in quarter 1, 2016 and the results have been shared with all
related service providers and they are expected to resolved any issues concerning the complaint area.
Southern Region
Measurements were conducted in the southern region during the Q1 2016 period. Areas covered under
the region were Bandar Melaka, Alor Gajah, Muar, Batu Pahat, Skudai and Johor Bahru. Figure 9 shows
the aggregate results of the throughput measurement conducted in those areas.
Figure 9: Southern region average throughput (cellular mobile & fixed wireless)
Based on measurement test conducted, Maxis recorded the fastest download speed for southern region
with an average speed of 21 Mbit/s, followed by Celcom with 19 Mbit/s, U Mobile in third with average
speed of 16 Mbit/s and Digi with 15 Mbit/s. As for WiMAX providers, the speeds recorded were more or
less the same as in central region with average speed of 6 Mbit/s for YES and 4 Mbit/s for P1. In terms of
consistency in providing download speeds over 650 kbit/s; Celcom, Digi and Maxis were able to deliver
100% of the time at the areas tested in southern region.
Results for the average round-trip time (RTT) and packet loss for measurement conducted within
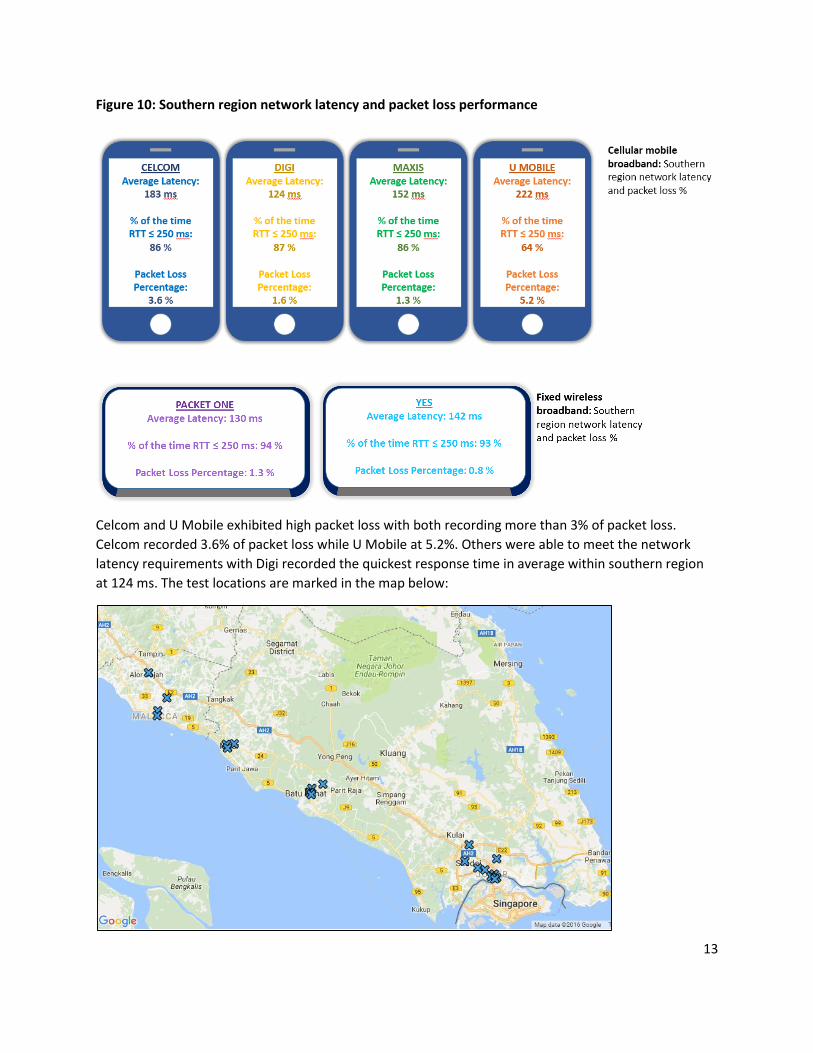
southern region are shown in Figure 10.
13
Figure 10: Southern region network latency and packet loss performance
Celcom and U Mobile exhibited high packet loss with both recording more than 3% of packet loss.
Celcom recorded 3.6% of packet loss while U Mobile at 5.2%. Others were able to meet the network
latency requirements with Digi recorded the quickest response time in average within southern region
at 124 ms. The test locations are marked in the map below:

14
Northern Region
From April to June 2016, wireless broadband QoS measurement resumed in the northern region areas
starting from Perlis, then Kedah, Penang and finally in Perak. The Q2 measurements were conducted
mostly in commercial areas or areas with townships and additional measurements in some complaint
areas as well. Figure 11 shows the aggregate measurement results of throughput test in northern
region.
Figure 11: Northern region average throughput (cellular mobile & fixed wireless)
Based on the measurement results, Maxis came out on top for the fastest download speed with an
average speed of 22 Mbit/s, followed by Digi and Celcom with both recorded around 18 Mbit/s. As for
U Mobile the average speed was 9 Mbit/s. There is a gap between the top three cellular providers and U
Mobile in terms of throughput due to majority of U Mobile’s coverage were in 3G compared to the
others which have LTE coverage in most parts of the northern towns. To be exact 86 % of U Mobile
measurement in northern region were in 3G mode due to the coverage footprint. Both WiMAX
providers; Packet One and YES, recorded comparable download speeds with average speed of around 4
Mbit/s. All service providers were able to deliver consistent speeds over 650 kbit/s more than 80 % of
the time.

15
Results for the average round-trip time (RTT) and packet loss for measurements conducted within
northern region are shown in Figure 12.
Figure 12: Northern region network latency and packet loss performance
During the Q2 test in northern region, it was observed that Digi shown vast improvement in terms of the
average round-trip time taken by packets travelling in their network. The average RTT recorded for Digi
was 37 ms. Meanwhile Maxis and Celcom also recorded respectable average RTT with 64 ms and 99 ms
respectively. This may be due to the fact that all three service providers were well ready with LTE
network in most part of the northern towns which includes Kangar, Arau, Sungai Petani, Jitra, Alor Setar,
Georgetown, Batu Feringghi, Bukit Mertajam, Kuala Kangsar, Ipoh, Manjung, Teluk Intan. Only U Mobile
was unable to meet the requirement of 70 % of the time, with the recorded result of only 67 % of the
time packets travelling in U Mobile network able to achieve below 250 ms. All other service providers
able to meet the key metrics requirement.
The test locations for northern region are marked as shown in map:

16
Eastern Region
In Q3 2016, from July to September, measurements were conducted in eastern region covering areas in
Kelantan, Terengganu and Pahang. The Q3 measurements were also conducted mostly in commercial
areas, areas with townships and additional measurements in some complaint areas as well. Figure 13
shows the average throughput in eastern region.
Figure 13: Eastern region average throughput (cellular mobile & fixed wireless)

17
In eastern region, it was observed that Maxis offers the fastest download speed with an average speed
of 27 Mbit/s. It is quite impressive for Maxis to achieve that level of average speed considering Celcom
and Digi were only able to achieve average speeds of 17 Mbit/s and 16 Mbit/s respectively in eastern
region test areas. U Mobile on the other hand recorded an average speed of 7 Mbit/s, this is because
100% of the U Mobile measurements were conducted on 3G networks. In fact, U Mobile does not have
LTE coverage in all the test locations in eastern region.
As for WiMAX providers, both P1 and YES recorded average speeds of 5 Mbit/s. In terms of consistency
in providing speeds over 650 kbit/s, all service providers were able to provide more than 80% of the
time.
Results for the average round-trip time (RTT) and packet loss for measurements conducted within
eastern region are shown in Figure 14.
Figure 14: Eastern region network latency and packet loss performance

18
Based on the network latency test conducted in eastern region, Digi continues to impress with statistics
of having the quickest response time with the recorded average RTT of 39 ms. This shows that Digi
network is well prepared for future services that require low latency, for example service such as voice
over LTE (VoLTE). Maxis average latency of 57 ms is commendable and expected for a service provider
with large LTE service coverage. Celcom average RTT of 82 ms puts them in third place behind Maxis and
Digi. While U Mobile average RTT of 195 ms still able to meet the minimum average requirement with
them recording 72% of the time RTT less than 250 ms. However due to majority of U Mobile coverage
were in 3G RAN sharing sites, the packet loss percentage by U Mobile is the highest at 6.2%. All other
service providers were able to meet the key metrics requirement.
The test locations for eastern region are marked as shown in the next map. Areas covered were Kota
Bharu, Tanah Merah, Machang, Kuala Krai, Setiu, Permaisuri, Kuala Terengganu, Marang, Hulu
Terengganu, Kerteh, Chukai, Kuantan, Pekan, Maran, Temerloh and Bentong.

19
Sarawak Region
In October, the wireless broadband network performance QoS measurement resumed in Sarawak. The
areas covered were Kuching, Lundu and Samarahan. For Sarawak region, YES does not have any
coverage for its WiMAX service, while Packet One was in the midst of dismantling their existing sites to
make way for upgrades. Figure 15 outlines the average throughput for all service providers in Sarawak.
Figure 15: Sarawak region average throughput (cellular mobile & fixed wireless)

20
Maxis again recorded the fastest download speed with an average speed of 19 Mbit/s. Followed by Digi
and U Mobile with both recorded average speeds of 16 Mbit/s. Celcom recorded an average speed of 7
Mbit/s in Sarawak region. U Mobile have good LTE presence in Kuching and Lundu areas resulting in
better performance result in Sarawak. All four providers were able to provide consistent speeds over
650 kbit/s in the measured areas.
Results for the average round-trip time (RTT) and packet loss for measurements conducted within
Sarawak region are shown in Figure 16.
Figure 16: Sarawak region network latency and packet loss performance
Digi maintained its good performance on network latency during the Q4 Sarawak measurement with an
average RTT of 49 ms. Other service providers were also able to meet all the requirements. The test
locations in Sarawak are shown in the map below.

21
Sabah Region
The nationwide measurement concluded in November with Sabah region. During the measurements in
Sabah, areas covered were Kota Kinabalu, Kota Belud, Tuaran and Tamparuli. Figure 17 outlines the
aggregate throughput across the test locations in Sabah.
Figure 17: Sabah region average throughput (cellular mobile & fixed wireless)

22
Maxis had the fastest average download speed in Sabah test measurement areas at 20 Mbit/s, followed
by Digi at 13 Mbit/s, U Mobile at 10 Mbit/s and Celcom at 8 Mbit/s. As for WiMAX providers, YES
average download speed is at 6 Mbit/s while Packet One at 2 Mbit/s. Packet One only have coverage in
Kota Kinabalu city center. Maxis also had the most consistent download speed performance in Sabah,
with 100% of the tests coming in at greater than 650 kbit/s. Other service providers could provide the
same consistency at more than 80% as well.
Results for the average round-trip time (RTT) and packet loss for measurements conducted within Sabah
region are shown in Figure 18.
Figure 18: Sabah region network latency and packet loss performance

23
Again, Digi was the quickest on the response time with recorded average RTT at 49 ms, followed by
Maxis at 73 ms, Celcom at 99 ms , YES at 105 ms, Packet One at 135 ms and lastly U Mobile at 204 ms. U
Mobile only had their own built RAN in Kota Belud area with LTE service, other locations were RAN share
sites with Maxis 3G. Due to that, U Mobile recorded worst packet loss percentage at 6.5% during the
measurement period. The test locations in Sabah region are marked in map below:
Test Location Technology for Cellular Service Providers
As mentioned earlier in the report, all tests were conducted within areas which have at least 3G
coverage. For benchmarking purposes, all service providers were tested concurrently regardless of the
different technologies on certain test location, as long as they have at least 3G coverage then the

24
measurement will resume. Figure 19 describes the percentage of coverage technology on all test
locations, for all region per service provider.
Figure 19: Test location technology per service provider
It is important to note that all tests were conducted in areas with certain criteria as specified earlier,
therefore Figure 19 does not resemble the real total percentage of the LTE or 3G coverage for each
region. But it does gives an idea to consumers on the availability of coverage and what to expect in
certain areas, for example in northern region it shows that three of the major cellular service providers
were able to offer LTE in most major towns in the northern states. As for southern region, tests were
conducted in Melaka city, Muar town, Batu Pahat town, Skudai and Johor Bahru areas. It also shows the
three major providers were able to offer LTE for these towns as well.

25
Although the test coverage will not be as close as to the real nationwide coverage area, but it gives an
indication as to how service providers would perform and the availability of coverage based on the test
location areas.
Wired Broadband Performance
Background
From January to November 2016, MCMC conducted a nationwide wired broadband network performance
measurement based on the Mandatory Standards for Quality of Service (QoS) on Wired Broadband
Services. The requirement is to have throughput at least 70% of subscribed level for DSL technology (using
copper as a last mile) and at least 90% of subscribed level for using optical fibre as a last mile. Both
throughput must not be less than 90% of the time. Other aspects of the network performance being
measured are the network latency must not be more than 85 ms packet round trip time for at least 95%
of the time and packet loss not more than 1% from the total packet sent.
The method of measurement for the above are based on MCMC’s own test tools and methodology, using
probes and server that is designed for this purpose of measurement. The speeds are measured by
downloading and uploading files between user and a host server located in the Malaysian Internet
Exchange (MyIX) in Kuala Lumpur. While network latency is calculated based on packets round trip time
between user end and MyIX.
A total of 133 locations were selected for the measurement and selection is based on MCMC complaints
area and Service Providers subscriber’s list. Wired broadband is divided into 2 technologies; copper(DSL)
as a last mile or fibre to the home.
Nationwide Overall Results
Figure 20 outlines the overall results of the measurement for the key metrics at an aggregate level
across all regions for wired broadband.
Figure 20: Key metrics scorecard for wired broadband
Service Provider Throughput (Upload and Download) Network Latency
Percentage of sample ≥ 70% subscribed speed (DSL)
Percentage of sample ≥ 90% subscribed speed (Fibre)
% of the time latency ≤ 85ms
Packet Loss
TM 93.82 86.93 88.95 1.81
Maxis 94.17 94.81 96.36 0.48
TIME - 72.51 100.00 3.28
Overall 92.60 90.95 93.90 1.34 *no TIME customers were tested for DSL technology

26
Based on average results obtained from measurements conducted by MCMC at an aggregate level across
all regions, it shows that Maxis offers the better quality and more stable internet connection compared
to others.
Overall Results by Speed Subscribed
Result below shows the percentage of the time for user to get the download speed at least 70% of
subscribed packages for copper as a last mile while for fibre is at least 90% of subscribed packages.
Figure 21: Copper as a last mile
Figure 21 shows that users who subscribed to package of between 4.1 to 6.0 Mbps will experience the
speed of at least 70% of the subscribed package for 93.66% of the time, which is in compliance with the
Mandatory Standards. While for other subscribed speeds, result show average of less than 90% of the
time users will be able to experience speed of at least 70% of the subscribed package. It shows copper as
a last mile can perform better for the speed 6Mbps and below. The stability of the result also depends on
the quality of the copper, contention ratio, distance, joints and other factors.
Figure 22: Optical fibre as a last mile
92.72%98.10%
84.51% 81.15%
5.0-10.0 MBPS 10.1-20.0MBPS 20.1- 50.0MBPS 50.1 MBPS AND ABOVE
Percentage of the time for Fibre
87.74% 87.76%
93.66%
75.40%
1.0-2.0 MBPS 2.1-4.0 MBPS 4.1-6.0 MBPS 6.1-8.0 MBPS
Percentage of the time for Copper
27
Figure 22 shows that users who subscribed to package of between 5.0 to 20.0 Mbps will experience at
least 90% of subscribed speed more than 90% of the time while for other subscribed speeds above 20
Mbps it shows that consumers would not be able to experience more than 90% of the time. It shows fibre
as a last mile can perform better for speeds 20Mbps and below. Some of Service Providers explained that
the higher speed packages show poor quality due to modem limitation and users may need to upgrade
the modem firmware to experience the optimum level.
Results by Technology for each Region
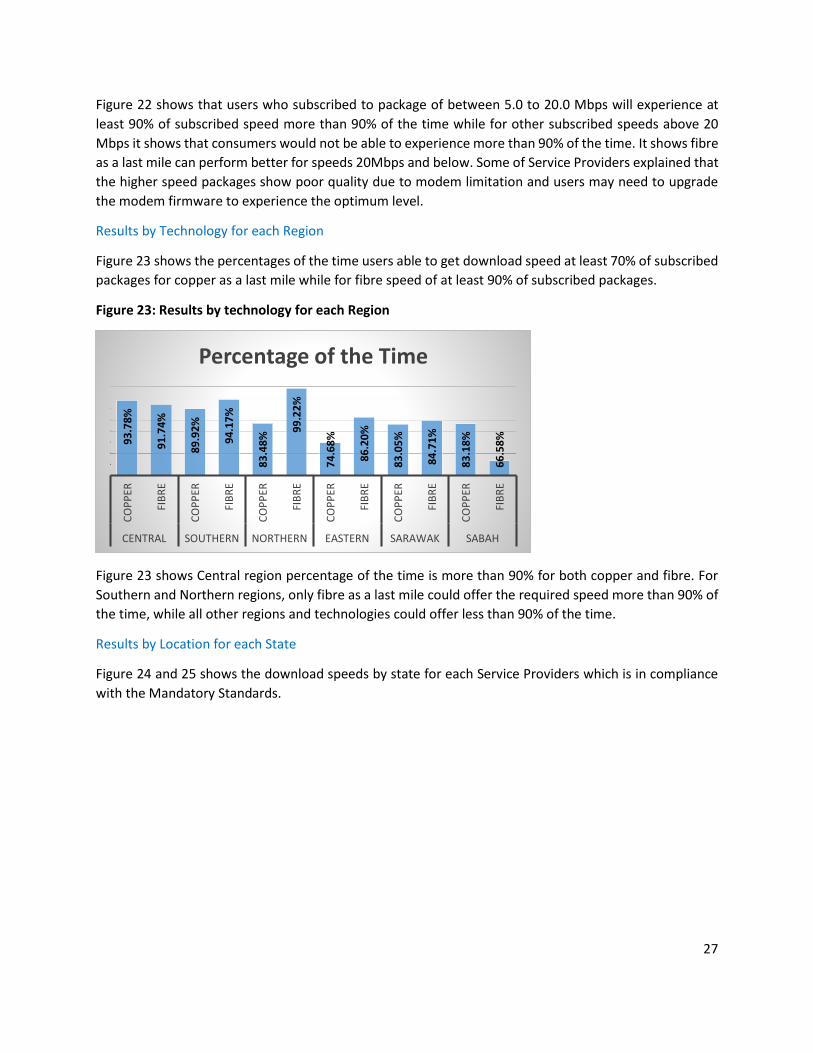
Figure 23 shows the percentages of the time users able to get download speed at least 70% of subscribed
packages for copper as a last mile while for fibre speed of at least 90% of subscribed packages.
Figure 23: Results by technology for each Region
Figure 23 shows Central region percentage of the time is more than 90% for both copper and fibre. For
Southern and Northern regions, only fibre as a last mile could offer the required speed more than 90% of
the time, while all other regions and technologies could offer less than 90% of the time.
Results by Location for each State
Figure 24 and 25 shows the download speeds by state for each Service Providers which is in compliance
with the Mandatory Standards.
93
.78
%
91
.74
%
89
.92
%
94
.17
%
83
.48
%
99
.22
%
74
.68
%
86
.20
%
83
.05
%
84
.71
%
83
.18
%
66
.58
%
CO
PP
ER
FIB
RE
CO
PP
ER
FIB
RE
CO
PP
ER
FIB
RE
CO
PP
ER
FIB
RE
CO
PP
ER
FIB
RE
CO
PP
ER
FIB
RE
CENTRAL SOUTHERN NORTHERN EASTERN SARAWAK SABAH
Percentage of the Time
28
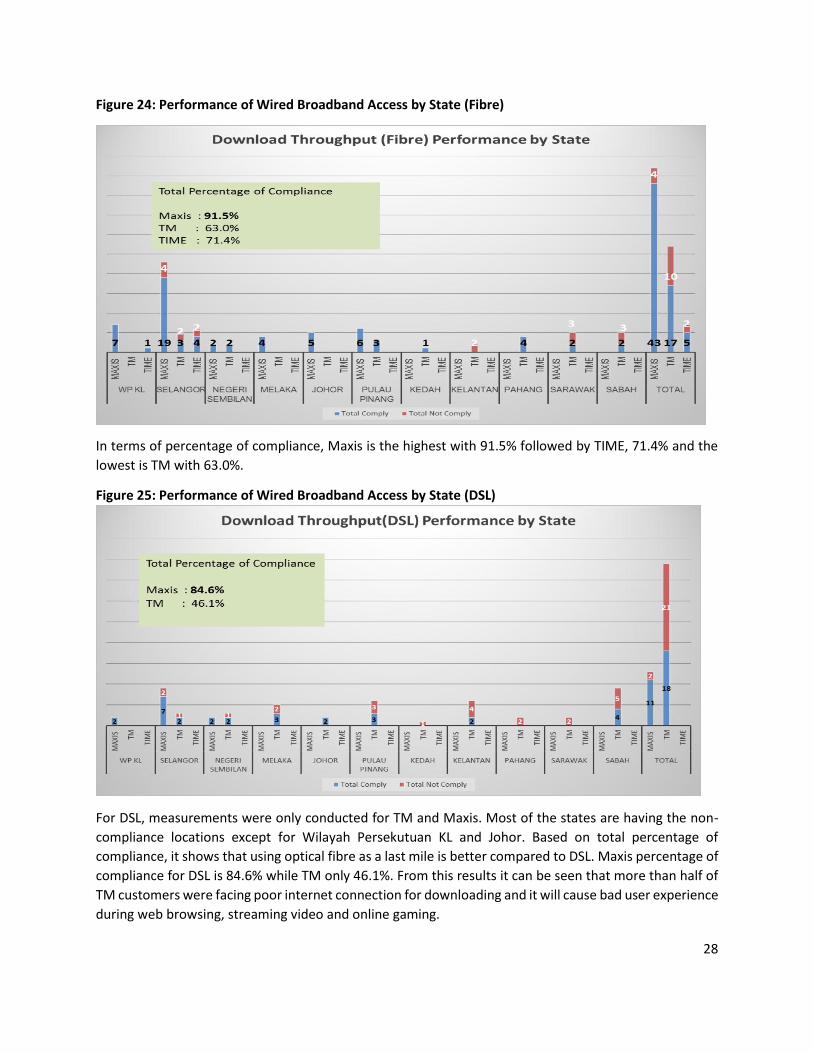
Figure 24: Performance of Wired Broadband Access by State (Fibre)
In terms of percentage of compliance, Maxis is the highest with 91.5% followed by TIME, 71.4% and the
lowest is TM with 63.0%.
Figure 25: Performance of Wired Broadband Access by State (DSL)
For DSL, measurements were only conducted for TM and Maxis. Most of the states are having the non-
compliance locations except for Wilayah Persekutuan KL and Johor. Based on total percentage of
compliance, it shows that using optical fibre as a last mile is better compared to DSL. Maxis percentage of
compliance for DSL is 84.6% while TM only 46.1%. From this results it can be seen that more than half of
TM customers were facing poor internet connection for downloading and it will cause bad user experience
during web browsing, streaming video and online gaming.

29
Currently, total number of users using copper as a last mile is 950,000 and total number of user using
optical fibre as a last mile is 876,000. Based from the result of this assessment, it gives an indication that
majority of complaints will be from DSL users since more than half of the users are still subscribed to DSL
technology which is copper as a last mile.
Feedbacks and plans from Service Providers to improve the quality of the internet for the affected areas
have been collected. For an example, to replace the poor copper quality to optical fibre, shortened the
distance of the copper between access node to the user end etc.
Service Providers may also need to do more awareness on how the internet or broadband service works.
Some consumers are not aware of the difference between using wired and wireless broadband, the
limitation of using internet over Wi-Fi, interference between Wi-Fi signals and other information required
to educate users on how to use internet properly.
TIME subscribers are given free upgrades according to the table below. However, the free upgrades do
not include changing of the modem.
Below are TM’s latest offers on their THANK YOU Campaign for loyal customers.
VIP5 at RM149 Upgrade to VIP10 at RM149
Current Package - VIP 5 Hot Upgrade Package - VIP 10
1 HSI Price RM149 RM199
2 *Discount None RM50
3 HyppTV Pack None None
4 Call Plan None None
5 Call Rate F2F: Free F2M: 10 cent/min
F2F: Free F2M: 10 cent/min
6 Total Price RM149 RM149
7 Current Contract Validity Completed 24 months contract & good payment
No contract
VIP10 at RM199 Upgrade to VIP20 at RM199
VIP 10 VIP 20
1 HSI Price RM199 RM249
2 *Discount None RM50
3 HyppTV Pack None None
4 Call Plan None None
5 Call Rate F2F: Free F2M: 10 cent/min
F2F: Free F2M: 10 cent/min
30
6 Total Price RM199 RM199
7 Current Contract Validity Out of 24 months contract No contract renewal
MCMC will continue to perform random audits on these networks in 2017. The public can register their
interest for a test at their premises and email to [email protected]. We will get back to you in due
time for an agreed timeslot. The registration only applies to Fixed Broadband subscribers (TM, TIME and
Maxis) and Wimax subscribers (YES and P1).
Voice Call Performance
Background
From January to December 2016, MCMC conducted voice call performance test to assess the performance
of Celcom, Digi, Maxis and UMobile in delivering the voice services to their subscribers. This assessment
was conducted in accordance to the Mandatory Standard for Quality of Service (Public Cellular Service),
Determination No.1 of 2015. The network performance indicator used in measuring the voice call
performance was the Dropped Call Rate and the Call Setup Successful Rate.
Key Performance Indicator
Two main criteria measured for the voice call performance are:
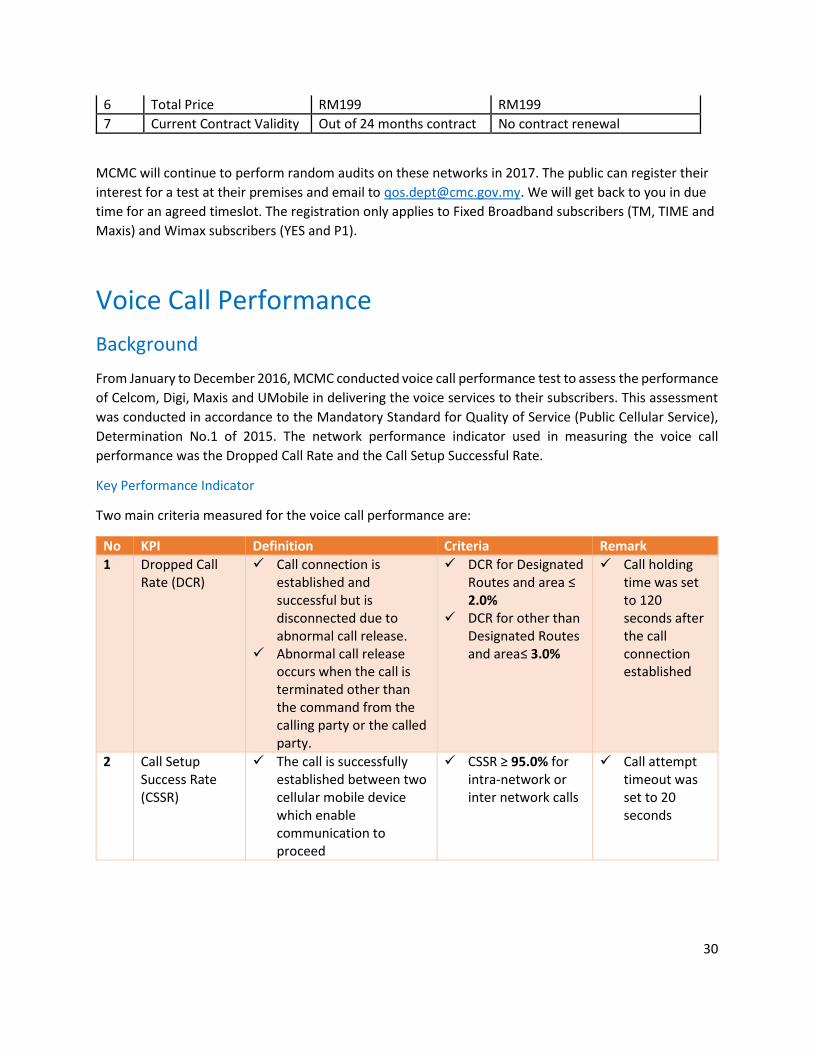
No KPI Definition Criteria Remark
1 Dropped Call Rate (DCR)
Call connection is established and successful but is disconnected due to abnormal call release.
Abnormal call release occurs when the call is terminated other than the command from the calling party or the called party.
DCR for Designated Routes and area ≤ 2.0%
DCR for other than Designated Routes and area≤ 3.0%
Call holding time was set to 120 seconds after the call connection established
2 Call Setup Success Rate (CSSR)
The call is successfully established between two cellular mobile device which enable communication to proceed
CSSR ≥ 95.0% for intra-network or inter network calls
Call attempt timeout was set to 20 seconds

31
Methodology
The tests were carried out in accordance to the “Guideline to the Commission Determination on the
Mandatory Standards for Quality of Service (Public Cellular Service) Determination No.1 of 2015).
The call samples were collected by way of drive test and static test in routes or locations that have
cellular coverage identified in the following manners:
a. Confirmation from the public cellular service providers;
b. Through the coverage information advertised by the public service providers; or
c. Through the network indicator display on test phones
The equipment used for data logging generally consist of four (4) units of mobile phone, a laptop
installed with QoS software to control the script and data logging and also a GPS for positioning.
It must be noted that these results do not represent the service provider overall network performance.
It is based on the specific routes, at a particular time of day and that particular type of mobile phones
used when the measurements were carried out.
Test Route area
The test route selected is mainly on the highways, main road, industrial area, tourist spot, commercial
areas and town ship. Table below shows the test route categories and also the summary of
measurements covered by MCMC from January to December 2016.
No Category Location Total distance covered
Total hours measurement
1 Designated routes and area
a. Area in Putrajaya b. Area in Cyberjaya c. MEX highway d. KLIA to Subang Airport via
ELITE highway e. Subang Airport to Jalan
Duta via NKVE highway
3,736 km 81 hours
2 Nationwide
a. Central region (CRO) b. Northern region (NRO) c. Southern region (SRO) d. Eastern region (ERO) e. Sabah region (SBRO) f. Sarawak region (SWRO)
a. 3,466 km b. 6,362 km c. 3,150 km d. 4,770 km e. 3,122 km f. 3,004 km
a. 85 hours b. 175 hours c. 96 hours d. 127 hours e. 119 hours f. 103 hours
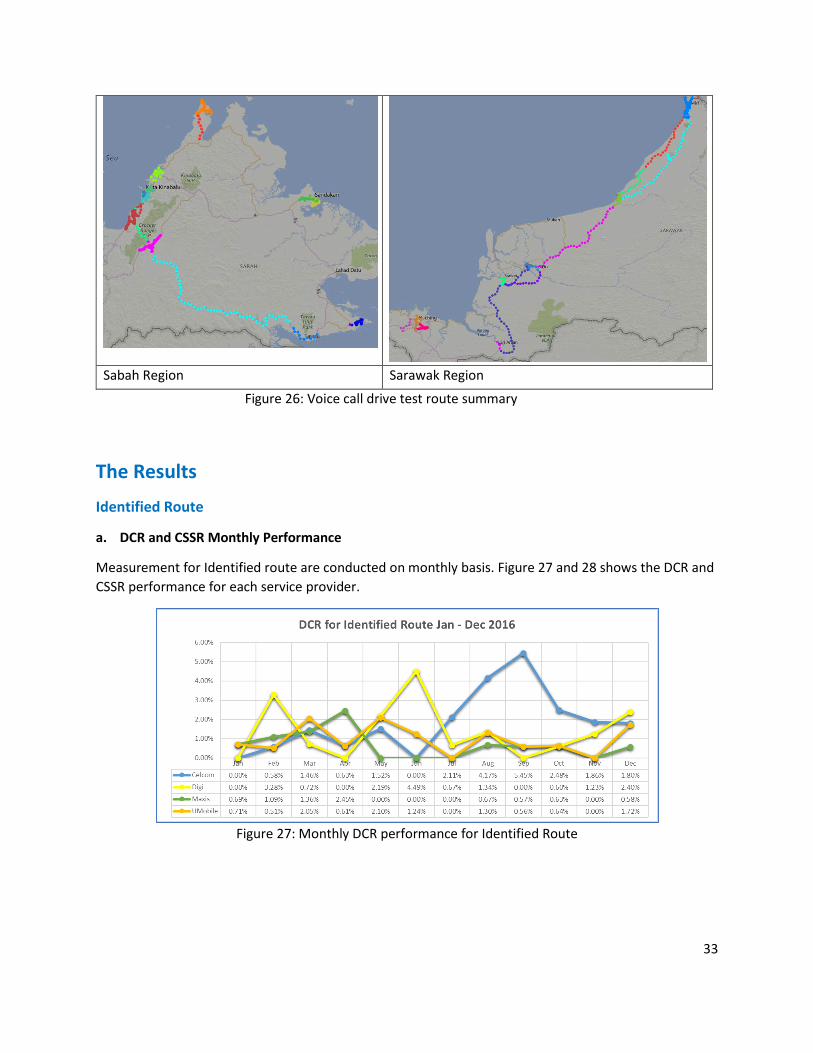
MCMC has managed to cover about 27,610 km of test route and 786 hours of data collection measured
from the 13 states in Malaysia. Figure 26 shows the summary of the drive test route covered.

32
Eastern Region (Kelantan, Terengganu, Pahang)
Northern Region (Perlis, Kedah, Pulau Pinang and Perak)
Central Region (Selangor, Kuala Lumpur and Negeri Sembilan)
Southern Region (Johor and Melaka)
33
Sabah Region Sarawak Region
Figure 26: Voice call drive test route summary
The Results
Identified Route
a. DCR and CSSR Monthly Performance
Measurement for Identified route are conducted on monthly basis. Figure 27 and 28 shows the DCR and
CSSR performance for each service provider.
Figure 27: Monthly DCR performance for Identified Route

34
Figure 28: Monthly CSSR Performance for Identified Route
Maxis was the most to achieve 0.00% DCR based on four measurements conducted in May, Jun, July and
November, followed by Digi with three measurements (January, April, September). Celcom and UMobile
scored the same results only in two measurements.
Celcom shows an increase in DCR from July to September due to the network modernization work
conducted in the test area. CSSR performance was also affected during this period causing a decrease in
August results with 94.74%.
Umobile had site acquisition problem in one of the blindspot area identified during test in March.
Handover issue and site outages were also detected in May results and had been rectified by Umobile.
Digi had the highest DCR in June with 4.49% (7 dropped calls from 156 calls connected). Four of the
dropped calls were caused by handover issue along the MEX highway and Putrajaya test route.
The serving network for each test route during the voice call test are as summarized as in Figure 29. The
test phone was set to automatic network selection mode to reflect actual user behavior when using the
mobile phone to make calls.
Figure 29: Serving technology during voice call services

35
Majority of the voice call services in the drive test route were served by the UMTS network. UMTS
technology have the capability to provide subscriber with both data and voice services while GSM is
primarily intended for voice services. GSM network only contributed less than 10% of the serving
coverage for most of the service provider.
b. Service Provider ranking
Figure 30 and 31 shows the ranking of each service provider based on the overall DCR and CSSR result
from January – December 2016.
Figure 30: Overall DCR performance ranking Figure 31: Overall CSSR performance ranking
In terms of the Dropped Call performance, Maxis scored the lowest DCR results ranging from 0.00% to
2.45%, producing an average DCR of 0.68%. UMobile is in the second place (0.94%) and Digi in third
(1.43%). Celcom recorded the highest overall DCR with 1.85%.
As for the call connection performance, Maxis scored the highest among other service provider with
overall CSSR of 99.53%. Digi and UMobile also performed well with CSSR of 99.42% and 99.38%. Celcom
was at the last rank with 98.71%.
c. Final Score
Figure 32 summarized the results of each service provider based on the Identified Route assessment
conducted for year 2016.

36
Figure 32: Summary of identified route performance
Based on the overall results, all four service provider achieved the Mandatory Standard requirement for
Dropped Call Rate (DCR ≤ 2%) and Call Setup Successful Rate (CSSR ≥ 95%) in year 2016.
Nationwide
a. DCR and CSSR Half Yearly Performance
Measurement for all states are conducted once in every six months. The test route during the first half
are repeated in the second half to be able to gauge network performance. Figure 33 and 34 depicts the
results for dropped call and call setup success rate based on the overall nationwide results.
Figure 33: Overall nationwide DCR performance for first and second half 2016
Figure 34: Overall nationwide CSSR performance for first and second half 2016

37
For the dropped call results, all service providers successfully maintain below the 3% Mandatory
Standard DCR requirement for both half of the year.
However, there is an increase in the dropped call results during the second half period except for Maxis
who shown improvement of 0.05% in the DCR. The increase rate for other service provider observed is
between 0.16% to 0.64% compared to the first half result.
There is a decrease in CSSR performance for all service provider between 0.05% to 0.47% during the
second half but still able to achieve the minimum CSSR of 95%.
b. Statistics by Region
Figure 35, 36, 37 and 38 depicts the DCR performance for Celcom, Digi, Maxis and UMobile in different
region for each half of 2016.
Figure 39, 40, 41 and 42 depicts the CSSR performance for Celcom, Digi, Maxis and UMobile in different
Figure 35: Celcom DCR nationwide Figure 36: Digi DCR nationwide
Figure 37: Maxis DCR nationwide Figure 38: UMobile DCR nationwide

38
region for each half of 2016.
Figure 43 and 44 shows the overall performance of the dropped call and call setup success rate for each
region.
Figure 43: DCR results per region Figure 44: CSSR results per region
Figure 39: Celcom CSSR nationwide Figure 40: Digi CSSR nationwide
Figure 41: Maxis CSSR nationwide Figure 42: UMobile CSSR nationwide

39
Sarawak region scored the lowest dropped call rate whereby the average DCR recorded is at 0.61%.
Southern region has the second lowest dropped call with average of 0.62%. The highest dropped call
was observed in Sabah region with average DCR of 1.59% for the four service providers.
Celcom showed the best dropped call performance in three regions (Northern, Eastern and Sabah)
between other service providers, while Digi in Central and Southern, and UMobile in Sarawak.
Maxis ranked the highest dropped call rate in four regions (Northern, Eastern, Sabah and Southern).
Although Celcom scored the best DCR performance in three regions, however Celcom ranked the lowest
DCR performance in Central and Sarawak region.
Regarding the performance of call setup success rate, the four service provider produced an intense
result in Sabah, Sarawak and Central with the average CSSR results of 99.33%, 99.35% and 99.32%
consecutively.
Digi was at the top in three regions (Northern, Eastern and Central) for the CSSR results, followed by
Celcom in two regions (Sabah and Southern) and Maxis in Sarawak region. The range of the highest CSSR
was between 99.23% to 99.71%.
UMobile was seen to have the lowest CSSR results in three regions (Northern, Eastern and Southern),
Celcom in two regions (Central and Sarawak) and Digi in Sabah region. The range of the lowest CSSR was
between 96.99% to 99.04%.
The serving network for nationwide test route during the voice call test are as summarized as in Figure
45. The test phone was set to automatic network selection mode to reflect actual user behavior when
using the mobile phone to make calls.
Majority of the voice calls were served by the UMTS 3G network for Celcom, Digi and Maxis in all regions
except for UMobile whereby GSM is serving more than 50% of the voice calls in Northern, Southern,
Sabah and Sarawak via domestic roaming in partnership with Maxis.
Figure 45: Serving technology during voice call services

40
c. Service Provider ranking
Figure 46 and 47 shows the ranking of service provider based on the nationwide assessment on CSSR
and DCR conducted from January to December 2016.
Figure 46: Nationwide DCR ranking Figure 47: Nationwide CSSR ranking
Celcom ranked the best dropped call performance based on the nationwide results with 0.83%, followed
by Digi at the second place (1.06%), UMobile on the third rank (1.16%) and Maxis at the last rank
(1.41%) between the four service provider.
Although Maxis did shown improvement on the DCR performance in the second half 2016, however
Maxis produced the highest DCR results during the first half 2016 (1.62%), causing the overall result at
the last rank.
Three service provider managed to score more than 99% of call setup successful rate with Digi in the
first place (99.28%), Celcom at the second place (99.22%) and Maxis at third (99.11%). Umobile scored
98.64% and rank the fourth based on the overall CSSR results.
d. Final Results
Figure 48 summarized the overall results of each service provider based on nationwide assessment
conducted for year 2016.
Figure 48: Summary of nationwide performance for voice call

41
In summary, all service provider achieved the Mandatory Standard requirement for both Dropped Call
Rate (DCR) and Call Setup Successful Rate (CSSR) in year 2016.
Summary of Complaints
Wired Broadband Complaints
While conducting the assessments we received 23 complaints on poor internet connection.
Figure 49: Complaint from Users
The pie chart illustrates the percentage of complaints from users on the quality of wired broadband
service in 2016. It can be seen most of the complaints were about slow browsing after office hour or
during weekends and request for fibre as a last mile which is 39% for each complaint. While for
intermittent connection is 13% and for IPTV service buffering is only 9%.
Feedbacks and actions taken by service providers for non-compliance locations.
There are 34 feedbacks from SP to improve the affected user and the summary of the feedbacks as figure
50 below.
39%
13%9%
39%
Complaints from Users
Slow browsing after officehour/during weekend
Internet connectionintermittent
IPTV buffering
Request for fibre as a lastmile

42
Figure 50: Feedbacks from Service Providers(SP)
The above chart illustrates the feedbacks from Service Provider to rectify and improve the non-compliance
locations on the Mandatory Standards. It can clearly be seen that service providers managed to improve
the affected locations with 62% ratifications done. While another 26% is still pending to set an
appointment with the users to verify the issue and 12% of the affected areas has its service terminated.
Wireless Broadband Complaint
MCMC received 294 complaints related to wireless broadband services such as slow internet speed and
connection issue.
Referring to figure 51, highest complaints
were made in Selangor (22%). The second
highest with 20% involved unknown
location whereby the complainant lodged
a complaint but did not disclose the
problem area.
The lowest complaints were observed in
Putrajaya, Terengganu, and Perlis with
only 1% from the total complaint.
62%12%
26%
Feedbacks from Service Providers
Rectify and Solve problem
Service terminated
Pending forappoinment/verification
wireless broadband
complaints 2016
Figure 51: Summary of wireless broadband complaint by states

43
Wimax broadband provider, YES broadband (YTL) recorded the highest complaints received by MCMC
with 72 complaints. The highest complaints were in an unknown area whereby the complainant did not
disclose the problem location.
The second highest location was in Pulau Pinang with 15 complaints, followed by Selangor (12
complaints) and Johor (10 complaints). Another Wimax broadband service provider, Packet One (Webe)
recorded a total of 35 complaints, which the highest was observed in Johor (9 complaints), followed by
Selangor with 8 complaints.
Both Maxis and Celcom were having the highest complaints in Selangor, UMobile in Kuala Lumpur (9
complaints) and Digi with 6 complaints in Selangor and unknown area. Digi recorded the lowest total
complaints with only 25 complaints.
Without the detail information on problem location addressed by the complainant, it will be difficult to
handle the wireless broadband complaint and also in resolving the issue.
Cellular Dropped Call Complaints
Figure 52: Wireless broadband complaint by SP
dband complaint on internet speed by SP

44
A total of 51 complaints on dropped calls issue
were lodged to MCMC in 2016.
Figure 53 shows that Selangor having the
highest dropped call issues with 25%, followed
by Kuala Lumpur (17%) and also in an unknown
area (16%).
Perak recorded the lowest dropped calls issue
with only 2% from the total complaints.
Celcom recorded the highest number of dropped call issue with 16 complaints, mostly notable in Kuala
Lumpur and in the unknown area. Digi is on the second highest total complaints (13 complaints), while
Maxis at third with 12 complaints and the lowest was seen from UMobile.
Dropped call
complaints
2016
Figure 53: Dropped call complaint by states
dband complaint on internet speed by SP
Figure 54: Dropped call complaint by SP
dband complaint on internet speed by SP
Source: Complaint Bureau Department, MCMC from January to October 2016