
NETWORK MONITORING : Using Nagios as an Example Tool
72
Afeez Yusuff NETWORK MONITORING : Using Nagios as an Example Tool Bachelor’s thesis CENTRAL OSTROBOTHNIA UNIVERSITY OF APPLIED SCIENCES Degree Programme in Information Technology May 2012
Transcript of NETWORK MONITORING : Using Nagios as an Example Tool

Afeez Yusuff
NETWORK MONITORING : Using Nagios as an Example
Tool
Bachelor’s thesis
CENTRAL OSTROBOTHNIA UNIVERSITY OF APPLIED
SCIENCES
Degree Programme in Information Technology
May 2012

ABSTRACT
CENTRAL OSTROBOTHNIA
UNIVERSITY OF APPLIED
SCIENCES
Date
MAY 2012
Author
Afeez Abiola
Yusuff
Degree programme
Information Technology
Name of thesis
NETWORK MONITORING: Using Nagios as an Example Tool
Instructor
Männistö Sakari
Pages
[49 + 16 appendix]
Supervisor
Männistö Sakari The aim of this thesis is to implement a network monitoring using an open source
network management utility to check the state of network elements and associated
services. Such management tools must have capability to detect and respond to
faults in the network by generating appropriate alert to notify the system
administrator accordingly.
Nagios core was used as the network management utility for the network for
demonstration of monitoring exercise. Theoretical functions of the Nagios Core
were presented and a concise description of SNMP was addressed in relation to the
Nagios functionalities. Nagios was configured with its plug-ins and used against a
test-laboratory network run in the Linux environment. The test network comprised
of two switches, one router and the Nagios server. The results from the Laboratory
demonstration exercises are presented in the framework.
Furthermore, the implementations of Nagios for optimal performance can be
laborious, but my experiences with Nagios and its resourceful outcomes proved to
be worthwhile. Nagios is therefore recommended for use in companies and
institutions for monitoring their networks. Also, the laboratory part of this thesis
could be used as a learning module for students to acquire skills and to identify the
importance of network monitoring.
Key words Network Management, Nagios core, Simple Network Management Protocol

Table of Contents
1 INTRODUCTION ........................................................................................................... 1
2 NETWORK MANAGEMENT ....................................................................................... 4
2.1 What is Network Management? ................................................................................ 4
2.2 Network Management Architecture ........................................................................ 5
2.3 Network Management Operation ............................................................................. 7
2.4 Functional Division of Network Management ........................................................ 8
2.4.1 Fault Management ................................................................................................. 9
2.4.2 Configuration Management ................................................................................. 9
2.4.3 Accounting Management ..................................................................................... 9
2.4.4 Performance Management ................................................................................. 10
2.4.5 Security Management ......................................................................................... 10
2.5 Network Monitoring Technique .............................................................................. 11
2.6 Network Management Protocol ............................................................................... 12
2.6.1 SNMP .................................................................................................................... 12
2.6.2 User Datagram Protocol ..................................................................................... 14
2.6.3 SNMP Messages Types ....................................................................................... 16
2.6.4 SNMP Management Information Base (MIB) ................................................. 19
2.6.5 CMIP Common Management Information Protocol ....................................... 20
3 OPEN SOURCE NETWORK MONITORING TOOLS (NMTs) ............................. 22
3.1 Zabbix ........................................................................................................................... 22
3.2 Cacti ............................................................................................................................... 23
3.3 Munin ........................................................................................................................... 23
3.4 Zenoss .......................................................................................................................... 23
3.5 Nagios .......................................................................................................................... 24
3.6 Why is Nagios selected? ............................................................................................. 25
4.2 Nagios Setup Prerequisites ....................................................................................... 27

4.3 Nagios Installation ..................................................................................................... 28
4.4 Nagios Configuration ................................................................................................ 32
4.4.1 nagios.cfg (Main Config file) .............................................................................. 32
4.4.2 Cgi.cfg file ............................................................................................................. 34
4.5 Plug-ins Enhancement ............................................................................................... 34
5 LAB ASSIGNMENT AND DEMONSTRATION ...................................................... 36
5.1 Prototype of Laboratory Task ................................................................................... 36
5.2 Hosts Status Display .................................................................................................. 43
5.3 Services Status Display .............................................................................................. 46
6 CONCLUSION .............................................................................................................. 48
REFERENCES
APPENDICES

ABBREVIATIONS
CGI Common Gateway Interface
CMIP Common Management Internet Protocol
CMISE Common Management Information Service Element
GUI Graphical User Interface
IP Internet Protocol
MIB Management Information Base
NMA Network Management Architecture
NMS Network Management System
NMT Network Management Tool
OID Object Identifier
PDU Packet data Unit
SNMP Simple Network Management Protocol
TCP Transport Control Protocol
UDP User Datagram Protocol

1
1 INTRODUCTION
As the computer networking became more popular, every aspect of life has been
shifted to network technologically inclined, which results to increased computing
power, sharing of resources and communication between users. The proliferation
in the network technologies poses challenges to the network administrator on how
to manage and control the emerged network. In computer networks, challenges
may arise, which may disrupt the state of such network. Typically, computer
network management challenges grow as the computer network expands. Thus,
the need to manage the network arises upon the network growth.
However, network management systems have been utilized in the past in attempts
to address such network challenges. These early network management systems
were typically operated by monitoring and logging a large volume of information
from the network devices. Such information was interpreted and evaluated by an
experienced network administrator. Despite the skillful knowledge of the network
administrator, it became burdensome to network administrator to handle. This is
particularly the case as the networking devices became more intelligent and more
effective technologies emerged, couple with the complexity in the present
network.
Based on the foregoing, it is therefore desirable to provide an automated network
management system which can systemize the knowledge of the networking-expert
such that common problems can be detected, isolated and fixed by alerting the
network personnel before such problems become critical. In this regard, in an
attempt to ensuring a healthy network, it is necessary to adopt an automated

2
mechanism to organize and manage the network. These mechanisms are generally
implemented in a form of one or more computer programs known as network
management systems or applications.
There are numerous open source and off-the-shelf network management
applications that can be used to handle network management issues while the
selection can be based on the network requirement. In this work, an open source
network management application named Nagios will be employed. This network
management application is used to examine and demonstrate network monitoring
of the network infrastructure and provision of alerts when modifications or
problems are detected. This exercise will be the focus of this thesis.
The aim of this thesis is to explore the network management and to demonstrate
how network-related problems that arise from the network can be monitored and
attended to, with the aid of an open source monitoring application. This aim will
be achieved by setting up NAGIOS, an open source monitoring tool and designing
a prototype network that will be basis for demonstrating the efficacy of the Nagios
to monitor running hosts, available services, and associated server load thresholds
on the proposed network.
The outline of the remaining part of this work is highlighted as follows: Chapter 2
gives explanation of network management and highlights the division of network
management. Network monitoring techniques and scopes are presented. Selected
network management protocols are also presented.

3
Chapter 3 introduces selected network monitoring software and gives a brief look
into their features. Also, justifications for choosing Nagios over other network
monitoring software are discussed.
Chapter 4 presents Nagios in details from its set-up requirement, installation, and
its architecture. It briefly introduces the concept of plug-in enhancement.
Chapter 5 presents the prototype of laboratory framework for the demonstration
of network monitoring using Nagios. Definitions of network devices and enabling
of services are presented for monitoring to be functional. Also the snapshots of the
monitoring activities are presented accordingly. Chapter 6 entails the conclusion
followed by references with appendices.

4
2 NETWORK MANAGEMENT
2.1 What is Network Management?
Network management (NM) refers to the broad subject of managing computer
networks. NM consists of a set of functions to control, plan, deploy, allocate,
coordinate, and manage network resources. It involves a number of software and
hardware products that system administrators use to manage a network.
(Webopedia 2011.)
Network Management can be identified as any approach that includes monitoring
the performance of the network, detecting and recovering from faults, configuring
the network resources, maintaining accounting information for cost and billing
purposes, and providing security by controlling access to the information flows in
the network. However, network management covers a wide area, including
security, performance, fault, and configuration. These aspects will be detailed later
in this work. However, this thesis primarily focuses on performance management,
both monitoring (detection) and control (resolution). (Jianguo 2009, 10.)
In general, network management functions include verification of the status of all
network devices such as routers, switches, hubs and computers. NM also entails
recording and analyzing error messages from all the aforementioned devices in
order to monitor the health of all devices. (Sebastian & Adrian 2009,79.)

5
2.2 Network Management Architecture
Network management architecture (NMA) illustrates the hierarchy in which the
participating devices are arranged in a network. The NM arrangement resembles
management structures at workplaces where there will be a manager and group of
employees reporting to the manager. There are certain rules or norms governing
communication between the manager and the employees. The components of the
network management system (NMS) include: manager, a set of agents, and a
management protocol for the manager to interact with the agents, and the
management information base (MIB) or management database that stores
information about the network elements being managed. (Haojin 1999, 26.)
A manager is a management entity that resides at a host computer that has a
collection of network applications and plays the role of controlling the network
nodes. Its main responsibilities include maintaining a network view of the
network being managed, regular interval collection of information from each
network element, and analyzing the collected information to decide if control
actions are necessary or not. (Haojin 1999, 26.)
An agent is also a management entity that is responsible for executing the
management instructions sent from the manager and reporting to the manager
any abnormal conditions that may arise at the network element. However, an
agent communicates occasionally through a proxy to act on network elements. In
other words, it does not act directly on network elements. As shown in Graph 3,
the proxy appears as a link between agent and the network elements in the
network architecture. A management protocol provides mechanism for interaction

6
between the manager and the agents. The standard management protocol used for
this mechanism is simple network monitoring protocol (SNMP), which resides at
the application layer of the internet network hierarchy. And, an MIB is a database
for storing the management information. In other words, MIB stores the
information of network elements that are being managed. (Haojin 1999, 26.)
GRAPH 1. Network Management Architecture (adapted from Haojin, 1999)
Network Management System (NMS)
Mgmt
entity
Agent Agent Agent
Agent
Mgmt
database
Mgmt
database
Mgmt
database
Mgmt
database
Proxy
Network
Network
Management
Protocol
Managed devices

7
2.3 Network Management Operation
Having identified and explained the components of the network management
system above, it is necessary to discuss the operation of network management. A
network management operation can be initiated either from both management
entities (manager or agent). Such an operation can only be completed with
participation from both management entities. All the management operations
allowed for the SNMP can be group into three generic categories namely the query
operation, the set operation and the reporting event.
Query Operation: Here a manager queries an agent for information on the
network element such as status, states or statistics. (Haojin 1999, 27.)
Set Operation: With this second category, the manager requests that an agent
modify the information in the agent’s MIB to achieve the effect of changing the
attributes of the network elements. (Haojin 1999, 27.)
Reporting Events: This operation is initiated by the agent. The agent reports an
abnormal event to the manager that has occurred at the agent side. The three types
of operations associated with the network management protocols are shown in the
Graph 4 below. (Haojin 1999, 27.)

8
Management Station
Manager
GRAPH 2. Component and Operation of a Network Management System
(adapted from Haojin, 1999)
2.4 Functional Division of Network Management
In general, network management can be grouped into five functional divisions.
These divisions are sometimes described as FCAPS (Fault, Configuration,
Accounting, Performance and Security) for convenience. However, this thesis will
focus on the performance/fault management that entails both controlling and
monitoring of the network resources. (Martin 2003, 399; Tejinder & Stephen 2002,
2.)
agent agent agent
MIB MIB MIB
MIB
Network
element
Network
element
Network
element
set operation
query operation
reporting events

9
2.4.1 Fault Management
The main purpose of fault management is detecting, diagnosing, repairing and
reporting network equipment and services failure in order to keep the network
running efficiently. Fault management includes functions such as alarm
surveillance, fault localization, test management, correcting the fault and trouble
administration. Fault management informs the manager what the network is
doing. This report can be seen in the Graph 2 above which shows the reporting
event arrow from the managed device to the manager. (Haojin 1999, 344.)
2.4.2 Configuration Management
Configuration management is a very complicated area of network management. It
is responsible for the monitoring and controlling the configuration information of
the network. Configuration management covers five areas such as network
planning and engineering, installation, service planning and negotiation,
provisioning, and status and control. Configuration management informs the
manager where everything resides in the network. (Haojin 1999, 272.)
2.4.3 Accounting Management
Accounting management is responsible for keeping the records of usage of
network resources and computes charges/billings for such usage. Accounting
management tells the manager when the network is being used and computes cost
of resources consumed (Strategic Planning Bureau 1999).

10
2.4.4 Performance Management
Performance management is the top level network management operation. It is
responsible for monitoring, controlling and optimizing the overall network
performance, both within and across network services. Performance management
includes functions such as gathering statistical information, maintaining and
examining logs of the system state histories and altering system modes of
operation for the purpose of conducting performance management activities.
(Tejinder et al., 2002, 18.)
2.4.5 Security Management
Security management is responsible for securing the network, the management
system that manages the networks and management transactions. In addition,
security management is intended to prevent intrusion if at all possible, to detect
intruders in case of intrusions promptly and to recover from and limit the
consequences of such intrusions as efficiently as possible. Here, the manager is
informed of who is using the network. (Haojin 1999, 433.)
All of these functional divisions are what make up the monitoring and controlling
parts of the network management. When considering network monitoring, fault
management, accounting management and performance management are very
important. However, the controlling part of the network uses configuration
management and security management.

11
2.5 Network Monitoring Technique
Having discussed NMS in the preceding sections, it is pertinent to streamline the
focus of this thesis to the network monitoring, which is a subset of functions
involved in the network management. Network monitoring entails a system that
constantly observes and analyzes the status and behavior of network which
comprises network devices such as switches, hubs, routers, printers, computers
and their associated services. This system notifies the network administrator either
via e-mails, pagers, or SMS. The method for notification is solely based on the
user-defined method. (Ethan 2011.)
To that end, a number of software applications and tools are available for
performing network monitoring. At the most basic level, network monitoring is
done by sending a ping, which is a monitoring tool that requires instantaneous
reply from each computer or network device on the network. If such a network
device fails to respond or takes too long to respond, the network monitoring
system notifies the network administrator of the problem. (Dev, Emery, Rustici,
Brown, Wiggin, Gray & Scott, 1996.)
However, network monitoring software handles the monitoring of the network by
continuously taking regular virtual snapshots of the network’s workflow. Also
track records of irregularities discovered in the workflow are kept. In the event
whereby such irregularities are so deviated from the recorded snapshots, the
network administrator will be notified. Nagios is the main network monitoring
software application used in this thesis to explore the aforementioned scenario.

12
(Dev et al., 1996.). Some other selected monitoring applications are discussed in
chapter three.
2.6 Network Management Protocol
Network management protocols are used by the NMS to access managed devices.
In this thesis, two most commonly used network management protocols are
discussed, namely: Simple Network Management Protocol (SNMP) and Common
Management Information Protocol (CMIP).
2.6.1 SNMP
SNMP (Simple Network Management Protocol) is a widely used internet-standard
protocol in the network management arena. It was created in 1988 to meet the
growing need for a standard for managing internet protocol (IP) devices. (Douglas
& Kevin 2005, 1.)
An SNMP is a simple set of operations (and the information these operations
gather) that give the administrators the ability to change the state of some SNMP-
based device. Usually, SNMP is associated with managing routers, but it is
pertinent to identify the fact that there are other devices that can be managed as
well. Such devices are hubs, bridges, printers, workstations, servers,
uninterruptible power supplies (UPSs). (Douglas & Kevin 2005, 1.)

13
The SNMP can be employed in many ways such as to monitor the health of the
routers, switches and other network hardware, but can also be used to control
network devices, or take other automatic actions if problems arise. SNMP can
monitor information ranging from the relatively simple to standardized items like
the amount of traffic flowing into and out of an interface, or state of the air
temperature inside a router. (Douglas & Kevin 2005, ix.)
SNMP is categorized with various versions. It is denoted as SNMPv1, SNMPv2
and SNMPv3. The sequence of the versions is based on the ongoing development
on the design of SNMP for its additional functionalities. The earliest version
SNMPv1 was characterized with its lightweight design and it is proved to be good
for managing relatively small networks and could not scale to large network
(geographical dispersed enterprises). (Douglas & Kevin 2005, 19; Damianos 2001,
16-17.)
The second generation of the SNMP standard known as SNMPv2 was developed
to overcome shortcomings of SNMPv1 by expanding its functionalities to include
OSI-based as well as TCP/IP-based networks. SNMPv2 makes SNMP a more
robust management protocol by offering better efficiency, error control and
manager-manager communication. As for SNMPv3, its main focus is on the
security, not scalability. In effect, SNMPv2 will be employed in this thesis rather
than SNMPv3 as the security is not the interest of this work. (Douglas & Kevin
2005, 73.)

14
2.6.2 User Datagram Protocol
Having discussed SNMP’s versions in the previous section, it is necessary to
highlight details of protocol used by SNMP in order to facilitate the exchange of
management information between the manager and the agent. SNMP uses the
User Datagram Protocol (UDP) as the transport protocol for passing data between
the manager and the agent. In contrary to Transport Control Protocol (TCP) that is
connection-oriented, UDP does not establish connection between the agent and
the NMS while exchanging datagram (packets) as defined in RFC 768. Though,
SNMP over the TCP can be implemented in special-case situations whereby agent
is being developed for proprietary piece of equipment. Such a situation will result
to the network being flooded in a heavily congested network while retransmitting
to achieve TCP reliability. (Douglas & Kevin 2005, 19.)
SNMP uses UDP port 161 for sending and receiving requests and port 162 for
receiving traps from managed devices. The aforementioned port numbers are
default for every device that implements SNMP, but some vendors allow changes
to be made to the default ports in the agent’s configuration. However, if such
changes are made, NMS must be aware of the changes so that the device can be
queried on the correct ports. (Douglas & Kevin 2005, 20.)
In an attempt to understand how an SNMP message passes through the protocol
layers at the manager and the agent, a TCP/IP protocol suit is used as shown in the
Graph 5 below. This model is often referred to as a protocol stack since each layer
uses the information from the layer directly below it and provides a service to the
layer directly above it. (Douglas & Kevin 2005, 20.)

15
NMS Agent
SNMP request sent from the NMS to the agent on port 161
Response to SNMP request sent from the agent to port 161 on the NMS
Trap sent to port 162 on the NMS
GRAPH 3. TCP/IP communication model and SNMP (adapted from Douglas &
Kevin 2005, 20)
Referring to the above protocol stack in Graph 4, each layer represents an event
that occurs when either an NMS or an agent wishes to perform an SNMP function
(e.g. a request or trap). These functions are discussed in the next passage.
Application Application
UDP UDP
IP IP
Network Access Protocol Network Access Protocol
Internetwork connecting NMS to agent

16
2.6.3 SNMP Messages Types
SNMP uses a limited number of Packet Data Units (PDU) for messages exchange
between the manager and the agent. The SNMP PDUs are defined by the ASN.1
(Abstract Syntax Notation one) data types. There are five PDUs that have been
defined in the first version of the standard (SNMPv1) to enhance inspection or
alteration to the managed objects of an SNMP agent’s MIB (Martin 2003, 384). The
five PDUs are:
Get-Request: this PDU is sent from SNMP manager to SNMP agent to
request status information for the purpose of monitoring the network.
Get-Next-Request: this is similar to a Get Request message, but it is
specifically designed to allow the SNMP manager to scan through a MIB (a
table or matrix of data) in the SNMP agent to locate a specific value.
Set-Request: it is used to change the value of a MIB object.
Get-Response: it is the response message sent by an SNMP agent to an
SNMP manager in response to GetRequest, GetNextRequest or SetRequest
that was discussed earlier.
Trap: this allows SNMP agent to send report to SNMP manager unsolicited
that is without a request and notifies of an event, i.e. change of status, or
alarm condition.
TABLE 1: SMNP PDU format (Adapted from Haojin 1999, 91)
(a) Generic format of SNMP message
Version Community name SNMP PDU

17
(b) The structure of GetRequest, GetNextRequest, SetRequest, GetResponse,
SMNPv2-Trap, and InforRequest PDUs
PDU-type request-id error-status error-index variable-bindings
(c) The Structure of GetBulkRequest PDU
PDU-type request-id non-repeater max-repetitions variable-bindings
(d) Variable-bindings Field
name1 value1 name2 value2 …….. nameN valueN
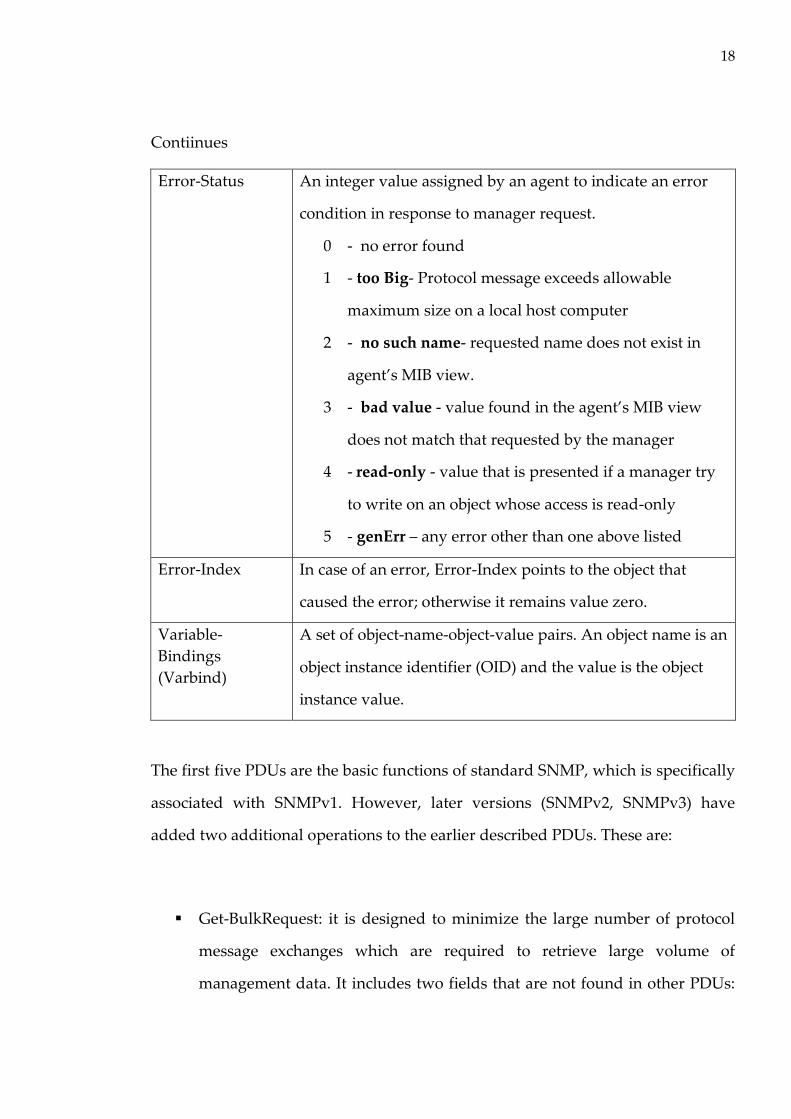
The fragmented TABLE 1 indicates structures of SNMP PDU format. Each field is
briefly described in TABLE 2 below.
TABLE 2. Fields in the SNMP message
Field Description
SNMP Version An integer value in the range (0...2147483617- a 32-bit
value). The value ‘0’ represents SNMPv1
Community Name An alphanumerical value (i.e. an OCTET-STRING) which
indicates community name that the SNMP message belongs
PDU- Type
An integer representation for type of an SNMP PDU, i.e.,
GetRequest, GetNextRequest, SetRequest, GetResponse, or
Trap.
Request-ID An integer to uniquely identify a request (i.e., GetRequest,
SetRequest, or GetNextRequest) sent from a manager to an
agent
Continues
18
Contiinues
Error-Status An integer value assigned by an agent to indicate an error
condition in response to manager request.
0 - no error found
1 - too Big- Protocol message exceeds allowable
maximum size on a local host computer
2 - no such name- requested name does not exist in
agent’s MIB view.
3 - bad value - value found in the agent’s MIB view
does not match that requested by the manager
4 - read-only - value that is presented if a manager try
to write on an object whose access is read-only
5 - genErr – any error other than one above listed
Error-Index In case of an error, Error-Index points to the object that
caused the error; otherwise it remains value zero.
Variable-
Bindings
(Varbind)
A set of object-name-object-value pairs. An object name is an
object instance identifier (OID) and the value is the object
instance value.
The first five PDUs are the basic functions of standard SNMP, which is specifically
associated with SNMPv1. However, later versions (SNMPv2, SNMPv3) have
added two additional operations to the earlier described PDUs. These are:
Get-BulkRequest: it is designed to minimize the large number of protocol
message exchanges which are required to retrieve large volume of
management data. It includes two fields that are not found in other PDUs:

19
non-repeater and max-repeater. Non-repeaters field specifies the number of
variables in the variable bindings list for which a single lexicographical
successor is to be returned. Max-repeater field indicates the number of
lexicographical successors to be returned for the remaining variables.
GetInformationRequest: this PDU is used in manager-to-manager
communication i.e. it is generated and sent by an entity acting in a manager
role, on behalf of an application, to another SNMP entity acting in an agent
role, to provide management information. (Martin 2003, 385.)
2.6.4 SNMP Management Information Base (MIB)
Management Information Base is a database that comprises a set of objects for
management purpose. Such MIB’s object is a software representation of a
managed network element such as routers, switches, workstations or even a piece
of software related to the management perspective. The NMS communicate to the
managed devices through the managed objects. A subset of Abstract Syntax
Notation One (ASN.1) is used to specify an object. Each managed object in the MIB
is uniquely denoted by an object identifier (OID). A naming scheme is used to
construct the OID for the managed objects of the SNMP MIB. This can be followed
through the MIB tree hierarchical structure in the GRAPH 5 below. (James 2006,
25.)
Referring to the Graph 5, the standard SNMP MIB known as MIB-II is identified as
1.3.6.1.2.1. Its name is denoted as ISO.org.DOD.Internet.Management.mib-2. Also,
Cisco has unique OID that is associated to all the Cisco devices which is

20
1.3.6.1.4.1.9. Cisco associated name is
ISO.org.DOD.Internet.Private.Enterprise.CISCO.
GRAPH 4. OSI registration tree (adapted from Haojin 1999, 34)
2.6.5 CMIP Common Management Information Protocol
Common Management Information Protocol is used for the exchange of
management information between two entities (manager and agent). CMIP
activities are achieved by a related service known as Common Management
Information Service Element (CMISE). CMISE provides access to managed
information in the managed objects and uses CMIP to issue requests for the
management services. Such services can be categorized into two groups:
management operation services initiated by a manager to request an agent to
provide certain services or information. The other is notification services used by
ISO(1)
STD(0) reg-auth(1) mem(2) org(3)
DOD(6)
Internet(1)
Directory(1) Management(2) Experiment(3) Private(4) Security(5) SNMPv2(6)
MIBII(1) Enterprise(1)
System(1) Interface(2) SNMP(11) CISCO(9) IBM

21
the management agents to inform the managers of occurred events. (Haojin 1999,
32.)
Both cases are specified in terms of primitives that can be viewed as commands or
procedure calls with parameters. The seven services are listed below:
M-CREATE: requests the agent to create new instance(s) of a managed object
class or attributes within a managed object.
M-DELETE: requests the agent to delete existing instances of managed object
class(es) or attributes within a set contained in a managed object.
M-GET: directs the agent to return the attribute values of managed objects.
M-SET: requests the agent to change the value of the managed object
attribute(s).
M-ACTION: directs the agent to cause one or more managed objects to execute
an action.
M-EVENT_REPORT: Here service is issued by an agent to send a notification
to managers.
M-CANCEL-GET: requests agent to cancel an outstanding M-GET request.
However, in spite the versatility in the features of the CMIP over the former
SNMP protocol, it is still less adopted. This is a result of its complexity and slow
evolutionary process of the standard. (Damianos 2001.)
The idea behind earlier discussed network management protocols is used by the
available network monitoring tools in order to handle network management
functionalities. Selected numbers of network monitoring tools are discussed in
chapter 3.

22
3 OPEN SOURCE NETWORK MONITORING TOOLS (NMTs)
This thesis has identified Nagios as a network monitoring tool that will be
explored in carrying out network monitoring activities. Under that note, it is
deemed necessary to acknowledge the fact that there are other numerous available
network monitoring tools that are available for the same purpose. A selected
number of NMTs will be identified and described. However, the list of randomly
selected NMTs is not necessarily connected to the order of preference of usage,
rather selected based on popularity. The selected NMTs are as follows;
3.1 Zabbix
Zabbix is a network monitoring solution that is written and distributed under the
GPL General Public License version 2, i.e. its source code is freely distributed and
available for general public. It was created by Alexei Vladishev. Its latest version is
Zabbix 1.8.7. (Zabbix SIA 2011.)
Zabbix is solely designed to monitor and track the status of various network
services, severs and other network hardware. Zabbix users enjoy its great
visualization functionalities including user-defined views, zooming and mapping.
With Zabbix, multiple choices of databases are available for storing monitoring
data, like MySQL, PostgreSQL, Oracle, IBM DB2 or SQLite. In addition, Zabbix
offers excellent reporting and data visualization features based on the stored data.
(Zabbix SIA 2011; Wikipedia 2011.)

23
3.2 Cacti
Cacti is an open source network monitoring tool that employs RRDtool for the
network graphing solution. Information used for creating and populating the
graphs is stored in a MySQL database. With its graphing utility, it enhances
graphical visualization of CPU load, network bandwidth utilization, network
traffic and more. (The Cacti Group 2009.)
In addition, it is also endowed with built in SNMP support that can use PHP-
SNMP, UCD-SNMP, or NET-SNMP. This SNMP support is useful for creating
traffic graphs with MRTG. (The Cacti Group 2009.)
3.3 Munin
Munin is actually similar to the previously described Cacti. It uses also RRDTool
to present the output in a pretty graph via web interface. Munin is considerably
special with its ease of creating new plug-ins and the play capability of the plug-
ins. Munin stores monitoring data in RRD files and automatically updates the
graphs accordingly. (Munin wiki 2006.)
3.4 Zenoss
Zenoss is also an open source application like its previously discussed
counterparts. It is a network management platform based on the Zope application
server. Zenoss Core presents a web interface that proffers a better solution to the

24
system administrator to monitor availability, inventory/configuration,
performance and events. Zenoss has capabilities in the following areas;
monitoring availability of network devices using SNMP, SSH, WMI, monitoring of
network services and host resources on most network operating systems and also
supports Nagios plug-in format. (Wikipedia 2011.)
3.5 Nagios
Nagios is one of the most popular computer network monitoring software
application. It is developed by Ethan Galstad, as an open source, Unix-based
enterprise monitoring package with a web-based front-end or console. It provides
monitoring of network services (SMTP, POP3, HTTP, FTP, SNMP, SSH) and host
resources (processor load, disk usage, system logs) and essentially any device or
service that have address and can be contacted via TCP/IP. It can monitor host
running Microsoft Windows, Unix/Linux, Novell Netware, and other operating
system. (Nagios Community 2011; James 2006, xx.)
With Nagios, own service check can be created depending on needs by developing
simple plug-ins by using tools of choice (shell scripts, C++, Perl, Ruby, Python,
PHP, C#, etc.). In the event of service or host problems, Nagios has contact
notification in its configuration to handle and resolve such events either via email,
pager, or user-defined method. (Nagios Community 2011.). Nagios installation
prerequisites, configuration and plug-ins are discussed in chapter four.

25
3.6 Why is Nagios selected?
In this thesis, Nagios was chosen as the network monitoring tool. The reasons for
this fact are not far-fetched, owing to some of its features over its counterparts.
Though, previously discussed tools work in a way similar to Nagios but it has
proven to be better over the others in some aspects.
In the same vein, Nagios has been around for much longer than other and has
extensions (plug-ins) that are simple to develop, using well known languages.
Also, it has built professional communities that have contributed to development
of plug-ins which enhance its better monitoring performances. With plug-ins, the
monitoring capability of Nagios is limitless, so far a script can be written for (Perl
scripts, Shell, C programs etc.) because it performs all its monitoring checks using
plug-ins. (Wojceich, 2008, 9).
Similarly, considering the aspect of scanning the monitored devices, Nagios uses
four states to describe status: OK, WARNING, CRITICAL, UNKNOWN rather
than monitoring value or graphs that may be ignored when it needed a quick
attention. Also, Nagios gives report of number of services that are up and running
in both warning state and critical state with aid of its friendly GUI for service
status display. This presents a good overview of infrastructure status. (Wojceich,
2008, 9.)

26
4 UNDERSTANDING NAGIOS SETUP
4.1 Nagios Architecture
In order to get clearer picture of how Nagios works, it is necessary to look into its
architecture. Its architecture is based or built on a server/client model. This
architecture can be seen in the Graph 6 below. This depicts a Nagios server
running on a host, and plug-ins running on the server and all other remote hosts
to be monitored. This plug-ins sends information to the server, which in turn
displays them on GUI.
GRAPH 5. Nagios Architecture (Adapted from TEINS Training, 2005)
In addition, Nagios can be said to be composed of three parts namely; A
scheduler, a GUI, and the plug-ins. These are described as below:

27
A scheduler: is a server part of Nagios that checks plug-ins at regular
interval and do some actions according to the results from the checked
plug-ins.
A GUI: is the interface of Nagios that is displayed in webpage generated by
the Common Gateway Interface (CGI). The interface can display
configurations, alerts, state buttons (green, OK/red, Error), MRTG graphs
etc.
The plug-ins: They are configurable by the user. They check a service and
return a result to the Nagios server in order to take corresponding actions.
(TEINS Training 2005.)
4.2 Nagios Setup Prerequisites
To set up a functional Nagios server, there are basic requirements that must be
met before the set up can be achieved. Having known from the preceding chapter
that Nagios runs on a variety of Linux, UNIX and Berkeley Software Distribution
(BSD) operating system, a Linux distribution (Ubuntu 11.04) was selected and
installed on a virtual machine. Virtual machine was considered because it
provides easy way to test software, especially if an alternate operating system is
involved. (Ethan 2011; Michael 2009.)
After installing and updating the operating system, the following packages are
manually installed on the Ubuntu installation before continuing:
Apache 2, a web server that Nagios uses to display information on web
page. By using command prompt, and typing “sudo apt-get apache2”,
Apache 2 is installed. And to verify the installation and start Apache2

28
“sudo /etc/init.d/apache2 start” command is used and if everything is fine,
OK response is given.
PHP, a programming language for creating dynamic webpages that can be
served on webservers. Command “sudo apt-get install libapache2-mod-
php5” is issued to install PHP.
GCC Compiler and development libraries which are needed to compile
some plug-ins and Perl Modules
GD development libraries, required to produce graphs and status map.
Command “sudo apt-get install libgd2-xpm-dev” is issued to install gd2
(Ethan 2011.) The subsequent section gives detail information for Nagios
installation.
4.3 Nagios Installation
Having completed installation of prerequisite packages discussed in the preceding
section, the next exercise is to download the latest Nagios core from Nagios
website at www.nagios.org. Before installing Nagios core, a user was created to
run the service and a group to run external commands. To achieve this, the
following commands are issued sequentially in the command prompt.
sudo passwd nagios
sudo groupadd nagcmd
sudo usermod -a -G nagcmd nagios
sudo usermod -a -G nagcmd www-data

29
At this point, a directory was made for storing the previously downloaded Nagios
source code tarballs which were extracted with commands “tar xzf nagios-
3.2.3.tar.gz” as used below and followed by changing the directory to extracted
folder and install with the following command:
mkdir ~/downloads
cd ~/downloads
wget http://prdownloads.sourceforge.net/sourceforge/nagios/nagios-3.2.3.tar.gz
wget http://prdownloads.sourceforge.net/sourceforge/nagiosplug/nagios-plug-
ins-1.4.11.tar.gz
tar xzf nagios-3.2.3.tar.gz
cd nagios-3.2.3
./configure --with-command-group=nagcmd
make all
make install
make install-init
make install-config
make install-commandmode
make install-webconf
Afterwards, a user account for logging into Nagios interface was created in a
given directory by issuing: “sudo mkdir /usr/local/nagios/etc”.
And a new password was created: “sudo htpasswd -c
/usr/local/nagios/etc/htpasswd.users nagiosadmin”. This password is required to
login to the Nagios web interface. After the created password, Apache2 was

30
restarted to make the new settings take effect: “sudo /etc/init.d/apache2 restart”.
The next task is to compile and install the Nagios plug-ins. This was achieved by
extracting the Nagios plug-ins source code tarball, and changing the directory to
the extracted folder. The command issued is shown below:
tar xzf nagios-plug-ins-1.4.11.tar.gz
cd nagios-plug-ins-1.4.11
./configure --with-nagios-user=nagios --with-nagios-group=nagios
make
make install
Nagios was configured to automatically start when the system boosts with this
line of command: “sudo ln -s /etc/init.d/nagios /etc/rcS.d/S99nagios”.
To verify the sample Nagios configuration files, command “sudo
/usr/local/nagios/bin/nagios -v /usr/local/nagios/etc/nagios.cfg” was run.
And if the output from the last issued command shows no errors, then Nagios can
be started with the command: “/etc/init.d/nagios start”
At this stage, Nagios server can be accessed through the web browser by typing:
http://hostname/nagios or http://127.0.0.1/nagios. The Graph 6 shows Nagios
access interface with username as nagiosadmin and password, which was issued
during the installation.

31
GRAPH 6. Nagios Access Interface
After clicking OK button in the above screenshot, front page of Nagios server will
be displayed along with its features itemized in the left sections. This is as shown
in Graph 7 below.
GRAPH 7. Nagios Front Page
The above screenshot illustrates basic setup of Nagios server. However, there is
need for further configuration of the Nagios server according to the network
requirements. This can be achieved by working on the configuration files of the
Nagios. To this end, it is necessary to understand the configuration files in Nagios
and these are described in the next chapter.

32
4.4 Nagios Configuration
During manual installation of Nagios as discussed in the previous section, some
configuration files are installed by default in the /usr/local/nagios/etc/ directory.
However, there are several other configuration files that need to be created or
edited before monitoring can be started in Nagios. Though, configuring Nagios
can be complex and take quite a while, but it allows a great deal of flexibility on
completion. (Ethan 2009.)
To this end, Nagios has two main configuration files, cgi.cfg and nagios.cfg. These
files are discussed below.
4.4.1 nagios.cfg (Main Config file)
The nagios.cfg file is the main configuration file that controls all other program
operations. This file is actually read by both the Nagios daemon and the CGIs. It
contains a number of directives that influence how the Nagios daemon operates.
Its cfg_file and cfg_dir directives allow configuration to be split into manageable
groups using resource file and object definition files as shown in Graph 9 below.
(Ethan 2009.)
The resource files are mainly used for storing sensitive configuration information
like password without making the information available to the CGIs. Also stores
user-defined macros. While object definition files are locations where all the
devices to be monitored are defined and how they are monitored. (Ethan 2009;
Michael 2009.) The objects in Nagios are displayed in the Table 3 below.

33
TABLE 6. Nagios objects
Object Used for
hosts servers or devices being monitored
hostgroups group of hosts
services services being monitored
servicegroups groups of services
timeperiod scheduling of checks and notifications
commands checking hosts and services
notifying contacts
event handling
contacts individuals to alert
contactgroups groups of contacts
GRAPH 8. Nagios configuration relationship (Adapted from Ethan 2009)

34
4.4.2 Cgi.cfg file
The cgi.cfg file is primarily used to control the Web interface and its associated
CGI (Common Gateway Interface) programs. This file contains a reference to the
main configuration file, so the CGIs know how the Nagios is being configured and
where the object definitions are stored. (Ethan 2009.)
As part of this thesis undertaking, a number of object definitions and services
enabling will be made in the next chapter so as to buttress the information in the
current section.
4.5 Plug-ins Enhancement
Nagios alone cannot perform any monitoring act unless it runs external programs
called plug-ins. This is as result of the fact that Nagios does not include any
internal mechanisms for checking the status of hosts and services on the network.
This checking is achievable by running plug-ins (compiled executables or scripts
like Perl scripts, shell scripts etc.) via the command line. However, the results from
the plug-ins are used by the Nagios to determine the current status and necessary
actions (running event-handling, sending-out notifications) are made. (Ethan
2009.)
From the preceding section 4.3, a number of plug-ins including the check-host-
alive, check_ping, check_http, check_tcp commands are made available from the
Nagios plug-ins package during installation. By default, the plug-ins are installed
in /usr/lib/nagios/plug-ins directory. But, some distributions may install them in a
different directory. Additionally, Nagios supports writing of individual or

35
customized plug-ins if needed. Also, there is possibility of downloading or
checking for suitable plug-ins from the Nagios community from either the links;
Nagios plug-ins project at http://nagiosplug.sourceforge.net/, Nagios downloads
page at http://www.nagios.org/download/, http://www.nagiosexchange.org/.
(Ethan 2009; Michael 2009.)

36
5 LAB ASSIGNMENT AND DEMONSTRATION
This chapter describes implementation of the network management system,
Nagios to demonstrate the monitoring of a number of network devices (hosts) and
associated services residing in the hosts. This is achieved by setting up a test
network and configuring Nagios’s object configuration files to implement the
monitoring of the network. In this view, a number of snapshot views of the
Nagios’s outcome in respect to monitored states of the network elements are
presented accordingly.
5.1 Prototype of Laboratory Task
NagiosServer:192.168.10.3 PC_2:192.168.10.4 PC_1:192.168.11.3 PC_3:192.168.11.4
LAN-2/ 192.168.11.0/24LAN-1/192.168.10.0/24
Router1
Fa 0/0 192.168.10.1 Fa 0/1: 192.168.11.1
Vlan 99: 192.168.11.5Vlan 99:192.168.10.5
Switch#1 Switch#2
GRAPH 9. TOPOLOGY DIAGRAM

37
TABLE 7. Addressing Table
Device
(Hostname)
Interfaces IP Address Subnet Mask Default
gateway
NagiosServer NIC 192.168.10.3 255.255.255.0 192.168.10.1
PC_1 NIC 192.168.11.3 255.255.255.0 192.168.11.1
PC_2 NIC 192.168.10.4 255.255.255.0 192.168.10.1
PC_3 NIC 192.168.11.3 255.255.255.0 192.168.11.1
Switch#1 Vlan 99 192.168.10.3 255.255.255.0 192.168.10.1
Switch#2 Vlan 99 192.168.11.3 255.255.255.0 192.168.11.1
cisco_router Fa0/0
Fa0/1
192.168.10.1
192.168.11.1
255.255.255.0
255.255.255.0
N/A
Learning Objectives
Setup the network according to the given Topology
Configure the PCs, Switches, Router and Nagios Server
Configure and Enable SNMP on the Switches and Router
Create and define host devices in the Nagios Server
Define services associated to the host devices in the Nagios Server
Verify changes to Nagios configuration files
Scenario
In this Lab exercise, a network that is similar to the one shown in the Topology
will be created. Begin by cabling according to the Topology and performing initial
router and switches configurations required for connectivity. IP addresses that are
provided in the addressing table are used to apply an addressing scheme to the
network device. Also, this Laboratory introduces how to configure router and
switches to send SNMP traps to Network Management System (Nagios). Note, all
operations will be implemented in Linux Environment. A root user level password

38
would be required in the command line in order to effect changes to Nagios
server.
Task 1: Setup the network according to the given Topology
Step 1: Cable a network that is similar to the one in Topology
Step 2: Power-on Ubuntu virtual machines on four different PCs and cable
according to the Topology
Task 2: Configure the PCs, Switches, Router and Nagios Server
Step 1: Perform basic configuration tasks on network devices (Switches & Router)
Set hostname
Set DNS lookup to “disabled”
Set EXEC mode password
Configure console connection and virtual terminal line passwords
Save running configuration to NVRAM
Step 2: Refer to addressing table to assign IP addresses and subnet masks to the
PCs and Nagios Server
Step 3: Create a management vlan 99 to assign IP addresses to both switches with
appropriate default-gateway
Note, the configuration is done through the Tera terminal. Enter the configuration
mode and issue the following commands for each switch.
Switch#1 Switch#2 interface vlan 99
ip address 192.168.11.5 255.255.255.0
no shutdown
exit
ip default-gateway 192.168.11.1
interface vlan 99
ip address 192.168.10.5 255.255.255.0
no shutdown
exit
ip default-gateway 192.168.10.1
Task 3: Configure and Enable SNMP on the Switches and Router

39
Step 1: Create optional settings for identifying devices.
Note SNMP configuration commands are issued at the configuration mode. Do the
following for router and both switches.
Cisco_Router(config)# snmp-server contact Yusuff-Network Admin
Cisco_Router(config)# snmp-server location COU, Kokkola, FIN
Step 2: Create a community string for NMS to access the devices.
This community string gives NMS to access the SNMP enabled devices. Now, issue the
command below.
Cisco_Router (config)# snmp-server community public RO
RO gives the NMS the right to only view the device configuration and statistics
unlike RW that allows NMS to read and write to the device configuration.
Step 3: Configure both switches and router to send SNMP traps to NMS
To achieve this, issue command with the community string (public) and specify IP
address of the NMS. And configure SNMP to send traps if interface go down or
system is rebooted.
Cisco_Router (config)# snmp-server host 192.168.10.3 version 2c public
Cisco_Router (config)# snmp-server enable traps snmp linkdown linkup coldstart warmstart
To verify the SNMP configuration, snmpwalk command was issued on NMS to
retrieve management information from the monitored devices (router and
switches). The commands for snmpwalk for router and switches are shown below
respectively.

40
snmpwalk –v 2c –c public 192.168.10.1
snmpwalk –v 2c –c public 192.168.10.3
snmpwalk –v 2c –c public 192.168.11.3
On issue one of the above commands, list of management information like OID and MIB
view etc are displayed accordingly.
Task 4: Create and define host devices in the Nagios Server
Step 1: On the Nagios server, enter as a root user in the terminal with appropriate
password. Issue this command:
sudo –s
Step 2: Change directory to the nagios.cfg file and edit the file as discussed in
section 4.4.1. This is done at the root level from the step 1. Afterwards, create an
object file where the hosts and their services will be defined.
root@ubuntu: cd /usr/local/nagios/etc
root@ubuntu: /usr/local/nagios/etc#
root@ubuntu: /usr/local/nagios/etc#sudo gedit nagios.cfg
Now we can define an object configuration file here named iwolomo.cfg in the nagios.cfg file.
This is done by writing two lines below. Save and close the whole nagios.cfg file.
#Definitions for monitoring an afeezgreen network
cfg_file=/usr/local/nagios/etc/objects/iwolomo.cfg
After saving nagios.cfg file, change to object.cfg directory as shown below
root@ubuntu: /usr/local/nagios/etc#cd objects/
root@ubuntu: /usr/local/nagios/etc/objects#
Open the created objects file “iwolomo.cfg” where the hosts and associated services are defined.
root@ubuntu: /usr/local/nagios/etc/objects# gedit iwolomo.cfg
The output from the last “gedit iwolomo.cfg” will be a plain text editor. This is
where hosts and services are defined. One host and service definition will be

41
discussed here and the complete definitions are provided in the appendix section
of this literature.
Definition for switch is as shown below. Note, both router and switches are
defined in the same template, so both have same definition except for unique IP
address differences.
define host{
use generic switch
host_name switch#1
alias switch#1
address 192.168.10.5
hostgroups switches
}
Task 5: Define services associated to the host devices in the Nagios Server
Below is the definition of service to monitor port status of the switch via SNMP
# Monitor Port 1 status via SNMP
define service{
use generic-service
host_name switch#1
service_description Port 1 Link Status
check_command check_snmp!-C public -o ifOperStatus.1 -r 1 -m RFC1213-MIB
}
Refer to the appendix section to see the remaining part of the definition. After
completion of host and services to be monitored save and close the editor.
Task 6: Verify changes to Nagios configuration files

42
It is important to verify changes made to the nagios configuration. This is done to
check if there is any error or warning that must be attended to before restarting
the nagios server in order to effect the changes in the main file. To achieve this,
issue the command below:
/usr/local/nagios/bin/nagios -v /usr/local/nagios/etc/nagios.cfg
If everything looks fine, the following lines will be shown otherwise number of
errors/warnings will be shown and indicates the line number that need correction.
Nagios Core 3.2.3
Copyright (c) 2009-2010 Nagios Core Development Team and Community Contributors
Copyright (c) 1999-2009 Ethan Galstad
Last Modified: 10-03-2010
License: GPL
Website: http://www.nagios.org
Reading configuration data...
Read main config file okay...
Processing object config file '/usr/local/nagios/etc/objects/commands.cfg'...
Processing object config file '/usr/local/nagios/etc/objects/contacts.cfg'...
Processing object config file '/usr/local/nagios/etc/objects/timeperiods.cfg'...
Processing object config file '/usr/local/nagios/etc/objects/templates.cfg'...
Processing object config file '/usr/local/nagios/etc/objects/localhost.cfg'...
Processing object config file '/usr/local/nagios/etc/objects/iwolomo.cfg'...
Read object config files okay...
Running pre-flight check on configuration data...
Checking services...
Checked 32 services.
Checking hosts...
Checked 7 hosts.
Checking host groups...
Checked 2 host groups.
Continues

43
Continues
Checking service groups...
Checked 0 service groups.
Checking contacts...
Checked 1 contacts.
Checking contact groups...
Checked 1 contact groups.
Checking service escalations...
Checked 0 service escalations.
Checking service dependencies...
Checked 0 service dependencies.
Checking host escalations...
Checked 0 host escalations.
Checking host dependencies...
Checked 0 host dependencies.
Checking commands...
Checked 24 commands.
Checking time periods...
Checked 5 time periods.
Checking for circular paths between hosts...
Checking for circular host and service dependencies...
Checking global event handlers...
Checking obsessive compulsive processor commands...
Checking misc settings...
Total Warnings: 0
Total Errors: 0
Things look okay - No serious problems were detected during the pre-flight check
If this appears, then Nagios can be reloaded to effect the changes with the below
command.
To reload Nagios: /etc/init.d/nagios reload
5.2 Hosts Status Display
Having reload Nagios server, changes made can be viewed from the Nagios
graphical user interface. All defined network devices and associated services to be
monitored are displayed by clicking on the appropriate item in the left panel of

44
Nagios GUI. The graph 9a shows hosts detail display from the test network. The
output from the display indicates that Nagios server has features that distinguish
between network devices that are down and those unreachable. Also, it presents
color differences for indicating UP and DOWN states. Thus, reduces response time
to correct defects in the networks.
However, examining output of the display in Graph 9a indicates that there are
technical corrections that have to be made. This could be as a result of error in
cabling test network or the configuration issues. After thorough examining and
appropriate corrections were made, the output of the current host details is shown
in the Graph 9b.
GRAPH 9a. Hosts Status Details Display

45
GRAPH 9b. Host Status Details Display
Alternatively, host status details can be viewed in structural representation of the
network elements. This can be seen by clicking on the map in the left panel. The
Map view shown below presents color partition in which green stands for UP state
for the networked devices while other color presents either down or unreachable
state.
GRAPH 10. Map View of Hosts Status Details

46
5.3 Services Status Display
All services attached to each network devices are presented in this section. The
current services’ status along with time the last check took place on each network
monitored devices are displayed. Such detail information is resourceful because it
allows the network administrator to act accordingly. The graph below indicates
the service status information.
GRAPH 11. Services Status Display
However, if reported errors on either monitored hosts or services required to be
fixed, a control measure is created, whereby monitoring checks on the concerned
hosts or services are suspended. This is achieved by scheduling a downtime for
the hosts/services for the period of time to fix the problems. However, Nagios
automatically resume monitoring checks on the hosts/service as soon as the

47
scheduled time elapses. The Graph 12 below shows scheduled downtime for
cisco_router.
GRAPH 12. Downtime scheduling for cisco_router
From the above view, a downtime was scheduled for two hours and a comment
was added to explain the reasons that warranted downtime on the cisco_router.
This prevents false notifications from the cisco_router during the scheduled
period. Additionally, other configuration parts of the monitoring for Nagios are
presented in the appendix.

48
6 CONCLUSION
Network monitoring is widely employed for the purpose of observing and
analyzing the status and behaviors of the network and providing notifications to a
network administrator through a messaging system, usually, emails, when a
device fails. This thesis’ goals are to explore the network management of a simple
network and demonstrate how issues that arise from the network can be
monitored and attended to, with the aid of an open source monitoring application,
Nagios.
During the course of the project it became evident that the thesis writer had to
make a thorough research to understand the intricacies abound the subject
matters, and also to understudy documentations in order to configure Nagios to
perform the monitoring activities, the effect of which assisted to complete this
work. Afterwards, to demonstrate network resources monitoring, a prototype
laboratory exercise was developed and Nagios server was used as NMS for hosts
and associated services status analysis.
However, benefits for monitoring network resources were realized during the
laboratory exercise in the following area: improvement in quality which was
uncovered as the Nagios server presented the problem as soon as it occurred;
better faults determination that provides means of identifying real source of
problems; and prompt errors notifications that allowed immediate response to
faults. The three listed benefits were studied in this thesis work and it was notable
from the outcomes that configuring a monitoring system that proffers such

49
benefits will result to an improved state for network devices and services
involved. These successful outcomes meet the objectives set at start of the thesis
work.
In conclusion, in order to maintain and periodically verify the health status of
network devices and associated services, the three earlier discussed benefits must
be established while implementing a network management system. However, it is
therefore clear that if organizations could implement a management system that
meets the mentioned benefits requirements, hence, the outcome will essentially
improve the network uptime and reduce the cost and save time of running the
faults troubleshooting. Also laboratory part of the thesis work could be
recommended as the learning module for students to identify the significance of
network monitoring.

REFERENCES
Douglas, R. and Kelvin J. 2005. Essential SNMP. 2nd Edition. Sebastopol, CA:
O’Reilly Media.
Damianos, G. 2001. Mobile Software Agents for Network Monitoring and
Performance Management. PhD thesis, University of Essex.
Dev, H., Emery, H., Rustici, S., Brown, M., Wiggin, S., Gray, W. and Scott, P. 1996.
Cabletron Systems Inc. Network management system using model-based
intelligence. USA. US5504921.
Ethan, G. 2011. Nagios Core “Ubuntu Quickstart Installation Guides”. Available:
http://nagios.sourceforge.net/docs/nagioscore/3/en/quickstart-ubuntu.html.
Accessed 29 September 2011.
Haojin, W. 1999. Telecommunications Network Management. NY: The McGraw-
Hill.
James, T. 2006. Pro Nagios 2.0 Administrations. Berkeley, CA: Apress.
Jianguo, D. 2010. Advances in Network Management. Boca Raton, FL: Auerbach.
Martin, P. 2003. Data Networks, IP and the Internet: Protocols, Design and
Operation. Chicester, WS: John Willy & Sons.
Michael, T. 2009. Monitoring Network and Service Availability with Open-Source
Software. Winner of the LITA/Ex Libris Writing Award, 2009. Available:
http://www.ala.org/ala/mgrps/divs/lita/publications/ital/29/1/silver.pdf. Accessed
27 July 2011.
Munin Wiki 2011. Available: http://munin-monitoring.org. Accessed 29 September
2011.
Nagios Community 2011. Available:
http://nagios.sourceforge.net/docs/3_0/about.html#whatis. Accessed 29 September
2011.
Nagios Core (Ubuntu Quickstart), 2011. Available:
http://nagios.sourceforge.net/docs/3_0/quickstart-ubuntu.html. Accessed 2
September 2011.

Sebastian, A. and Adrian, F. 2009. Network Management: Know it all. Burlington,
MA: Morgan Kaufmann.
Strategic Planning Bureau, 1999. Network Management Architecture Guidelines.
Commonwealth of Massachusetts. Committee on Information Technology Version
2.0. Available:
http://www.mass.gov/Eoaf/docs/itd/policies_standards/networkmanagementarchi
tectureguidelines.pdf. Accessed 14 September 2011.
TEIN Training, 2005. Availability Management Nagios Overview. Available:
http://www.interlab.ait.ac.th/tein2/Presentations/Availability%20Management%20
Nagios%20Overview%20v2.pdf. Accessed 1 October 2011.
Tejinder, S. and Stephen, H. 2002. Network Management in Wired and Wireless
Networks. Norwell, MA: Kluwer.
Webopabia 2011. Available:
http://www.webopedia.com/TERM/N/network_management.html. Accessed 15
September 2011.
Wojceich, K. 2008. Learning Nagios 3. Birmingham: Packt.
Zabbix SIA, 2011. Available: http://www.zabbix.com. Accessed 20 September 2011.

APPENDIX 16/1
Router Configuration Scripts
cisco_router#sh run
hostname cisco_router
!
boot-start-marker
boot-end-marker
!
enable secret 5 $1$FsHj$pvGBm8dDRJnm6W/br.ciF1
enable password cisco
!
ip source-route
!
ip cef
multilink bundle-name authenticated
!
interface FastEthernet0/0
ip address 192.168.10.1 255.255.255.0
duplex auto
speed auto
!
interface FastEthernet0/1
ip address 192.168.11.1 255.255.255.0
duplex auto
speed auto

APPENDIX 16/2
interface Serial0/1/0
no ip address
shutdown
no fair-queue
clock rate 125000
!
interface Serial0/1/1 no ip address
shutdown
clock rate 125000
!
router rip
network 192.168.10.0
network 192.168.11.0
!
ip forward-protocol nd
!
no ip http server
!
snmp-server community Bon2go_monlo RO 1
snmp-server trap-source FastEthernet0/0
snmp-server location Kokkola, COUniversity

APPENDIX 16/3
snmp-server contact Afeez Yusuff-Network Admin
snmp-server enable traps snmp linkdown linkup coldstart warmstart
snmp-server host 192.168.10.3 version 2c Bon2go_monlo
!
control-plane
!
line con 0
password cisco
login
line aux 0
line vty 0 4
password cisco
login
!
scheduler allocate 20000 1000
end
Switch Configuration Scripts
end
switch#1#sh run
!
version 12.2

APPENDIX 16/4
no service pad
service timestamps debug datetime msec
service timestamps log datetime msec
no service password-encryption
!
hostname switch#1
!
boot-start-marker
boot-end-marker
!
enable secret 5 $1$.uDU$w1dDGpHYmctbAN8pcQmRS/
!
no aaa new-model
system mtu routing 1500
ip subnet-zero
!
no ip domain-lookup
!
spanning-tree mode pvst
spanning-tree extend system-id
!
vlan internal allocation policy ascending

APPENDIX 16/5
!
interface FastEthernet0/1
switchport access vlan 99
switchport mode access
!
interface FastEthernet0/2
switchport access vlan 99
switchport mode access
spanning-tree portfast
!
interface FastEthernet0/3
switchport access vlan 99
switchport mode access
spanning-tree portfast
!
interface Vlan1
no ip address
no ip route-cache
shutdown
!
interface Vlan99
ip address 192.168.10.5 255.255.255.0
no ip route-cache

APPENDIX 16/6
!
ip default-gateway 192.168.10.1
ip http server
ip http secure-server
snmp-server community Bon2go_monlo RO
snmp-server location Kokkola, COUniversity
snmp-server contact Afeez Yusuff-Network Admin
snmp-server enable traps snmp linkdown linkup coldstart warmstart
snmp-server host 192.168.10.3 version 2c Bon2go_monlo
!
control-plane
!
banner motd ^Cotd#You are accessing Yusuff'Lab#
!
line con 0
password cisco
logging synchronous
login
line vty 0 4
password cisco
logging synchronous
login

APPENDIX 16/7
line vty 5 15
login
!
end
switch#2#sh run
Building configuration...
Current configuration : 3695 bytes
!
version 12.2
no service pad
service timestamps debug datetime msec
service timestamps log datetime msec
no service password-encryption
!
hostname switch#2
!
boot-start-marker
boot-end-marker
!
enable secret 5 $1$dA6N$Y/gQeHLD1fUjmPIeB62XJ/
!

APPENDIX 16/8
no aaa new-model
system mtu routing 1500
ip subnet-zero
!
no ip domain-lookup
!
spanning-tree mode pvst
spanning-tree extend system-id
!
vlan internal allocation policy ascending
!
interface FastEthernet0/1
switchport access vlan 99
switchport mode access
!
interface FastEthernet0/2
switchport access vlan 99
switchport mode access
spanning-tree portfast
!
interface FastEthernet0/3
switchport access vlan 99
switchport mode access

APPENDIX 16/9
spanning-tree portfast
!
interface Vlan1
no ip address
no ip route-cache
shutdown
!
interface Vlan99
ip address 192.168.11.5 255.255.255.0
no ip route-cache
!
ip default-gateway 192.168.11.1
ip http server
ip http secure-server
snmp-server community Bon2go_monlo RO
snmp-server location Kokkola, COUniversity
snmp-server contact Afeez Yusuff-Network Admin
snmp-server enable traps snmp linkdown linkup coldstart warmstart
snmp-server host 192.168.10.3 version 2c Bon2go_monlo
!
control-plane
!
banner motd ^C You are accessing Yusuff's Lab^C

APPENDIX 16/10
!
line con 0
password cisco
logging synchronous
line vty 0 4
password cisco
logging synchronous
login
line vty 5 15
login
!
end
Nagios Object Configuration File “iwolomo.cfg”
define host{
use generic-switch
host_name cisco_router
alias cisco_router
address 192.168.10.1
hostgroups switches
}

APPENDIX 16/11
# Define the switch that we'll be monitoring
define host{
use generic-switch
host_name switch#1
alias switch#1
address 192.168.10.5
hostgroups switches
}
define host{
use generic-switch
host_name switch#2
alias switch#2
address 192.168.11.5
hostgroups switches
parents cisco_router
}
define hostgroup{
hostgroup_name switches
alias Network Switches
members switch#1, switch#2
}

APPENDIX 16/12
# Define the Nagios Server (NMS)
define host{
use linux-server
host_name UbuntuNagios
alias UbuntuNagios
address 192.168.10.3
}
# Define host for the adjoining PCs
define host{
use linux-server
host_name cclinux
alias cclinux
address 192.168.11.3
parents switch#2
}
define host {
use linux-server
host_name cclinux#2
alias cclinux#2
address 192.168.10.4
parents switch#2
}

APPENDIX 16/13
#SERVICE DEFINITIONS
# Create a service to PING to switch
define service{
use generic-service
host_name switch#1, switch#2, cclinux, cclinux#2,
UbuntuNagios, cisco_router
service_description PING
check_command check_ping!200.0,20%!600.0,60%
normal_check_interval 5
retry_check_interval 1
}
# Monitor uptime via SNMP
define service{
use generic-service
host_name switch#2
service_description Uptime
check_command check_snmp!-C public -o sysUpTime.0
}

APPENDIX 16/14
# Monitor Port 1 status via SNMP
define service{
use generic-service
host_name switch#1
service_description Port 1 Link Status
check_command check_snmp!-C public -o ifOperStatus.3 -r 1
-H 192.168.10.5
}
# Monitor bandwidth via MRTG logs
define service{
use generic-service
host_name cisco_router
service_description Port 1 Bandwidth Usage
check_command
check_local_mrtgtraf!/var/lib/mrtg/192.168.10.1_2.log!
AVG!1000000,1000000!5000000,5000000!10
}
# Define a service to check for PCs.
define service {
use local-service
host_name cclinux, cclinux#2
service_description Root Partition
check_command check_local_disk!20%!10%!/ }

APPENDIX 16/15
define service{
use local-service
host_name cclinux, cclinux#2, UbuntuNagios
service_description Current Users
check_command check_local_users!20!50
}
define service{
use local-service
host_name cclinux, cclinux#2
service_description Total Processes
check_command check_local_procs!250!400!RSZDT
}
# Define a service to check the load on the PCs
define service{
use local-service
host_name cclinux, cclinux#2
service_description Current Load
check_command check_local_load!5.0,4.0,3.0!10.0,6.0,4.0
}

APPENDIX 16/16
define service {
use local-service
host_name cclinux, cclinux#2, UbuntuNagios
service_description Swap Usage
check_command check_local_swap!20!10
}


![Nagios core vs. nagios xi presentation power point.pptx [diperbaiki]](https://static.fdocuments.us/doc/165x107/58a44c4b1a28ab55068b48bb/nagios-core-vs-nagios-xi-presentation-power-pointpptx-diperbaiki.jpg)