Network Models and Algorithms for Strategic and Economic Reasoning Michael Kearns Computer and...
29
Network Models and Algorithms for Strategic and Economic Reasoning Michael Kearns Computer and Information Science University of Pennsylvania World Congress of the Game Theory Society Marseille, July 2004 Joint work with: Sham Kakade, John Langford, Michael Littman, Luis Ortiz, Robin Pemantle, Satinder Singh, Siddarth Suri
-
date post
21-Dec-2015 -
Category
Documents
-
view
216 -
download
0
Transcript of Network Models and Algorithms for Strategic and Economic Reasoning Michael Kearns Computer and...

Network Models and Algorithms for Strategic and
Economic ReasoningMichael Kearns
Computer and Information ScienceUniversity of Pennsylvania
World Congress of the Game Theory SocietyMarseille, July 2004
Joint work with: Sham Kakade, John Langford, Michael Littman, Luis Ortiz, Robin Pemantle, Satinder Singh, Siddarth Suri

International Trade
[Krempel&Pleumper]
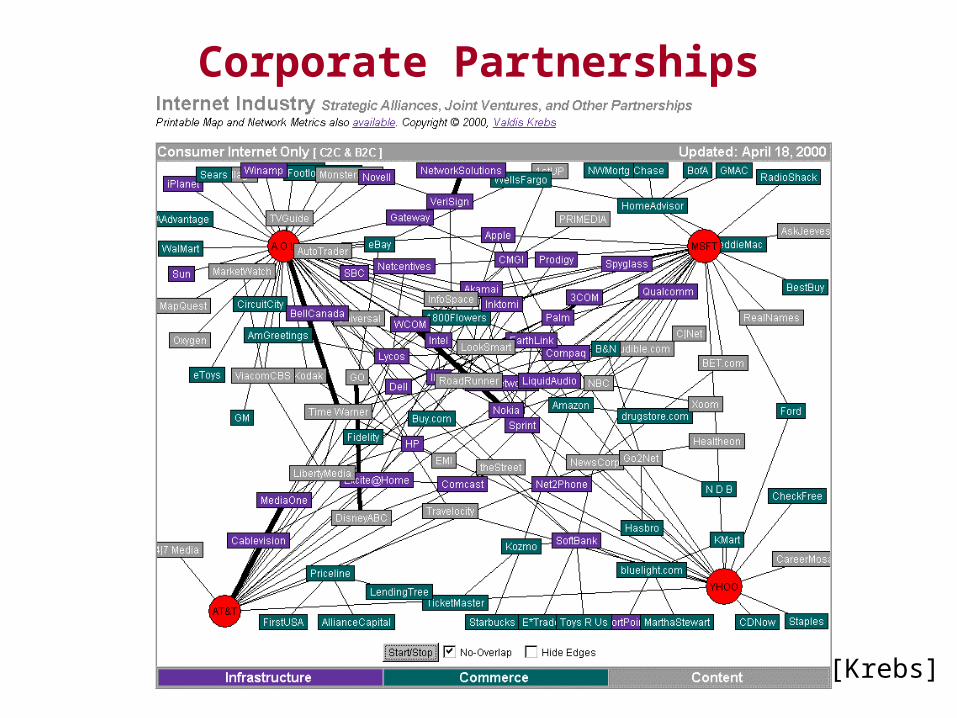
Corporate Partnerships
[Krebs]

Gnutella

Internet Routers

Artist Mark Lombardi
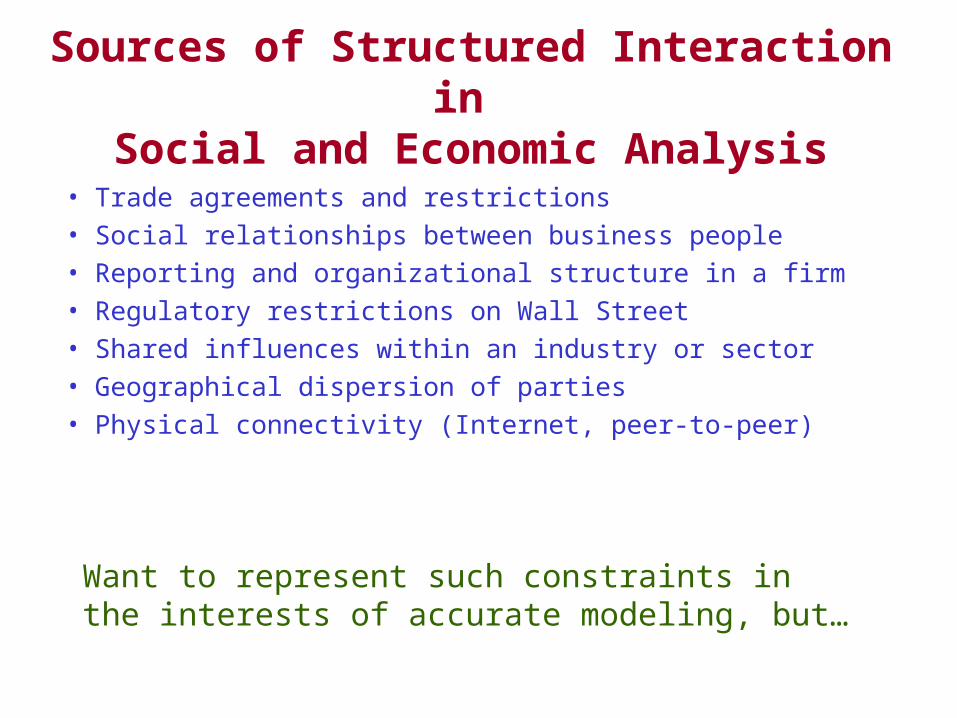
Sources of Structured Interaction in
Social and Economic Analysis• Trade agreements and restrictions• Social relationships between business people• Reporting and organizational structure in a firm• Regulatory restrictions on Wall Street• Shared influences within an industry or sector• Geographical dispersion of parties• Physical connectivity (Internet, peer-to-peer)
Want to represent such constraints in the interests of accurate modeling, but…

• Computational benefits of modeling network structure?– improved algorithms for equilibrium computation– distributed, local computation and adaptation– richer kinds of “conditional equilibrium” queries
• How does network topology influence outcomes?– local interaction vs. global equilibrium– coalitions, correlations and network structure– price variation, wealth distribution and network structure
• What kinds of networks to examine?– social network theory and generative models– small worlds, preferential attachment and random graphs
A rich blend of ideas and methods from economics, computerscience, artificial intelligence, statistics, and mathematics
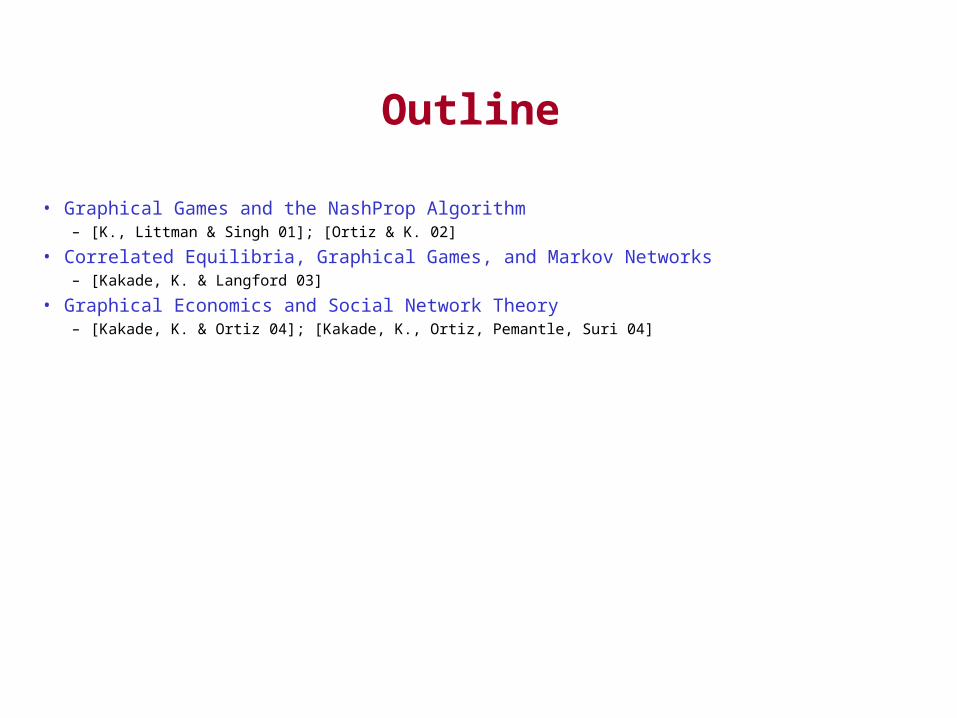
Outline
• Graphical Games and the NashProp Algorithm– [K., Littman & Singh 01]; [Ortiz & K. 02]
• Correlated Equilibria, Graphical Games, and Markov Networks– [Kakade, K. & Langford 03]
• Graphical Economics and Social Network Theory– [Kakade, K. & Ortiz 04]; [Kakade, K., Ortiz, Pemantle, Suri 04]

Graphical Games and NashProp

Graphical Models for Game Theory
• Alternative to normal form, which grows exp(n) for n players• Undirected graph G capturing local (strategic) interactions• Each player represented by a vertex• N_i(G) : neighbors of i in G (includes i)• Assume: Payoffs expressible as M_i(a) where a over only N_i(G)• Graphical game: (G,{M_i})• Compact representation of game • Exponential in max degree (<< # of players)• Must still look for special structure for efficient computations• Related models: [Koller & Milch 01] [La Mura 00]
2
4
3
5
8
7
6
1

The NashProp Algorithm
• Local message-passing; tables of “conditional” Nash equilibria• Approximate (all NE) and exact (one NE) versions• Provably efficient (polynomial in representation size) for trees • NashProp: generalization to arbitrary topology• Close relationship to network models for probabilistic reasoning
– Bayesian networks, Markov networks– junction tree algorithm, belief propagation
U1 U2 U3
W
V
T(w,v) = 1 <--> an “upstream” Nash where V = v given W = w <--> u: T(v,u_i) = 1 for all i, and v is a best response to u,w

• Table dimensions are probability of playing 0• Black shows T(v,u) = 1• Ms want to match, Os to unmatch• Relative value modulated by parent values• =0.01, = 0.05

Experimental Performance
number of players
com
pu
tati
on
tim
e
Correlated Equilibria, Graphical Games and Markov Networks
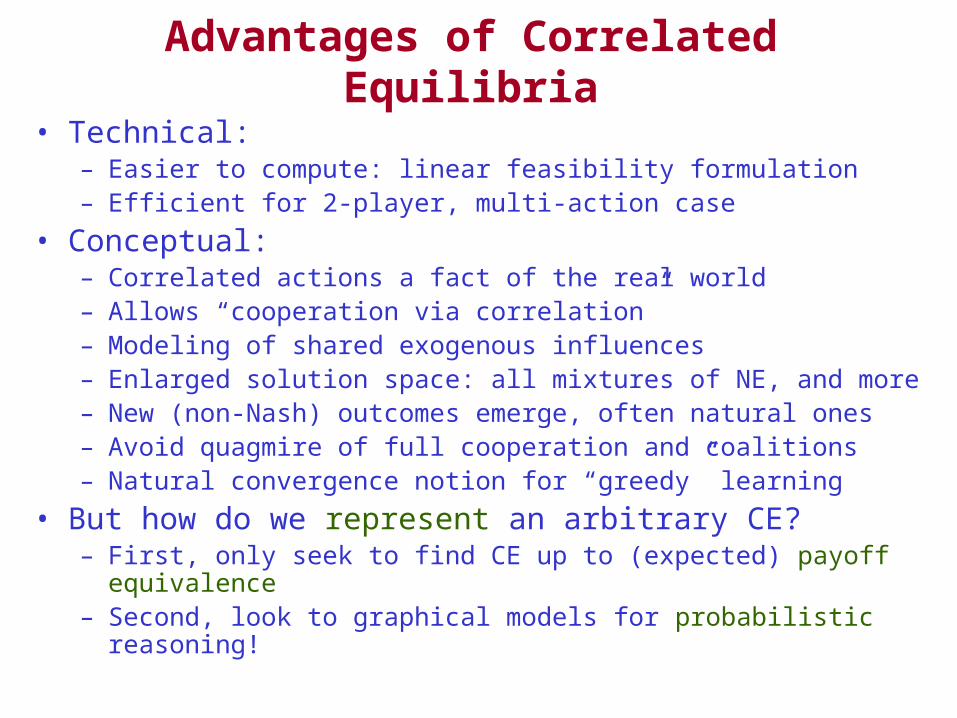
Advantages of Correlated Equilibria
• Technical:– Easier to compute: linear feasibility formulation– Efficient for 2-player, multi-action case
• Conceptual:– Correlated actions a fact of the real world– Allows “cooperation via correlation”– Modeling of shared exogenous influences– Enlarged solution space: all mixtures of NE, and more– New (non-Nash) outcomes emerge, often natural ones– Avoid quagmire of full cooperation and coalitions– Natural convergence notion for “greedy” learning
• But how do we represent an arbitrary CE?– First, only seek to find CE up to (expected) payoff
equivalence– Second, look to graphical models for probabilistic reasoning!

Graphical Games and Markov Networks
• Let G be the graph of a graphical game (strategic structure)• Consider the Markov network MN(G):
– Form cliques of the local neighborhoods of G
– Introduce potential function c on each clique c
– Joint distribution P(a) = (1/Z) c c(a) – Markov networks common in AI, statistics, physics (Ising
model),…• Theorem: For any game with graph G, and any CE of this game,
there is a CE with the same payoffs that can be represented in MN(G)
• Preservation of locality!• Direct link between strategic and probabilistic reasoning in CE• Computation: In trees (e.g.), can compute a CE efficiently
– Parsimonious LP formulation

Graphical Economicsand
Social Network Theory

A Network Model of Exchange Economies
• Begin with the classical framework:– k goods or commodities– n consumers, each with their own endowments and utility functions
• But now assume an undirected network dictating exchange– each vertex is a consumer– edge between i and j means they are free to engage in trade– no edge between i and j: direct exchange is forbidden
• Note: can “encode” network in goods and utilities– for each raw good g and consumer i, introduce virtual good (g,i)– think of (g,i) as “good g when sold by consumer i”– consumer j will have
• zero utility for (g,i) if no edge between i and j• j’s original utility for g if there is an edge between i and j

Graphical Economics: Basic Theory
• Network equilibria always exist (under AD condition analogues)– does not follow from AD due to zero endowments of “foreign” goods– appeal to Debreu’s quasi-rationality: zero wealth may ignore zero
prices– wealth propagation lemma: spread of capital on connected graph
• ADProp algorithm:– computes controlled approximation to graphical equilibrium– message-passing on conditional prices and inbound/outbound
demands– efficient for tree topologies and smooth utilities
• Remarks: – Scarf’s algorithm– complete network, linear utility case: poly-time algorithm [DPSV 02]– complete network, smooth utility case: poly(n), exp(k) [KKO 04]
2
4
3
5
8
7
6
1

A Sample Network and Equilibrium
• Network is union of all edges shown
• 2 goods (cash and wheat)• Symmetry in endowments and
utility functions– buyers have $1– sellers have 1 unit wheat
• Solid edges:– exchange at equilibrium
• Dashed edges:– competitive but unused
• Dotted edges:– non-competitive prices
• Note price variation– 0.33 to 2.00
• Degree does not determine price!– e.g. S5 vs. S14

Economics Properties of Social Networks
• How does network structure influence:– price variation in large economies?– wealth distribution (Pareto’s power law)?– computation of market equilibrium?
• Made possible by combination of:– social network models
• preferential attachment (“rich get richer”)• Erdos-Renyi (random graphs)
– math econ exchange models• e.g. Fisher, Walras-Wald, Arrow-Debreu
– advances in equilibrium computation• algorithms for linear and general utilities
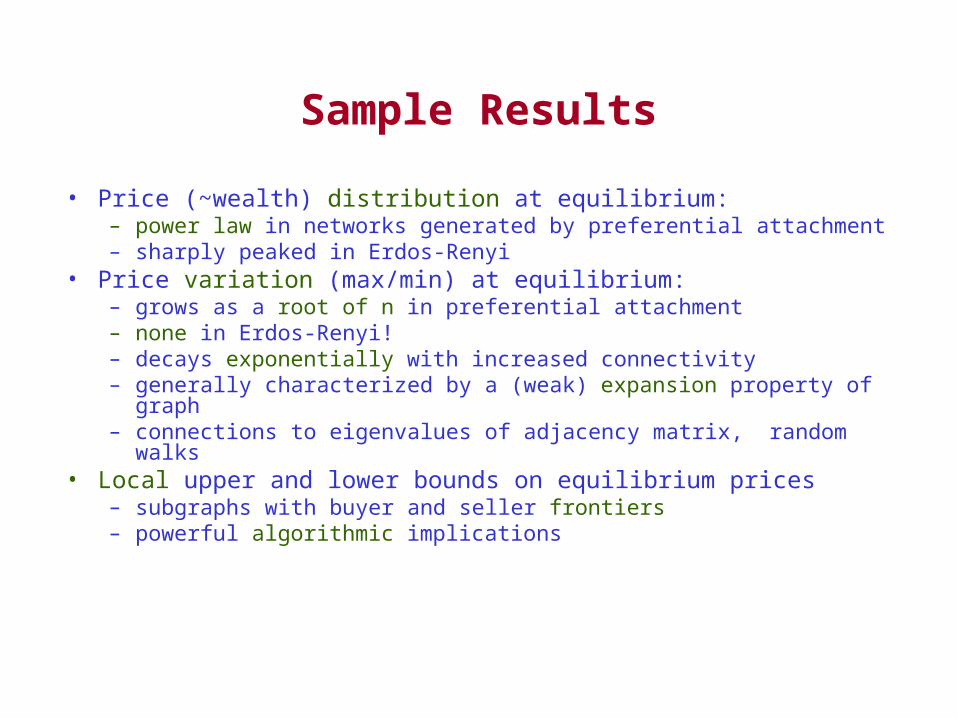
Sample Results
• Price (~wealth) distribution at equilibrium:– power law in networks generated by preferential attachment – sharply peaked in Erdos-Renyi
• Price variation (max/min) at equilibrium: – grows as a root of n in preferential attachment– none in Erdos-Renyi!– decays exponentially with increased connectivity– generally characterized by a (weak) expansion property of
graph– connections to eigenvalues of adjacency matrix, random walks
• Local upper and lower bounds on equilibrium prices– subgraphs with buyer and seller frontiers– powerful algorithmic implications

Quality of Local Approximations
Model: ()n = 50 to 250 (five plots)each plot averages 5 trials
•Very mild dependence on n•k = 5 gives exact solution; k = 3 is 60% faster (n = 250)

An Amusing Experimental Illustration

U.N. Comtrade Data Network
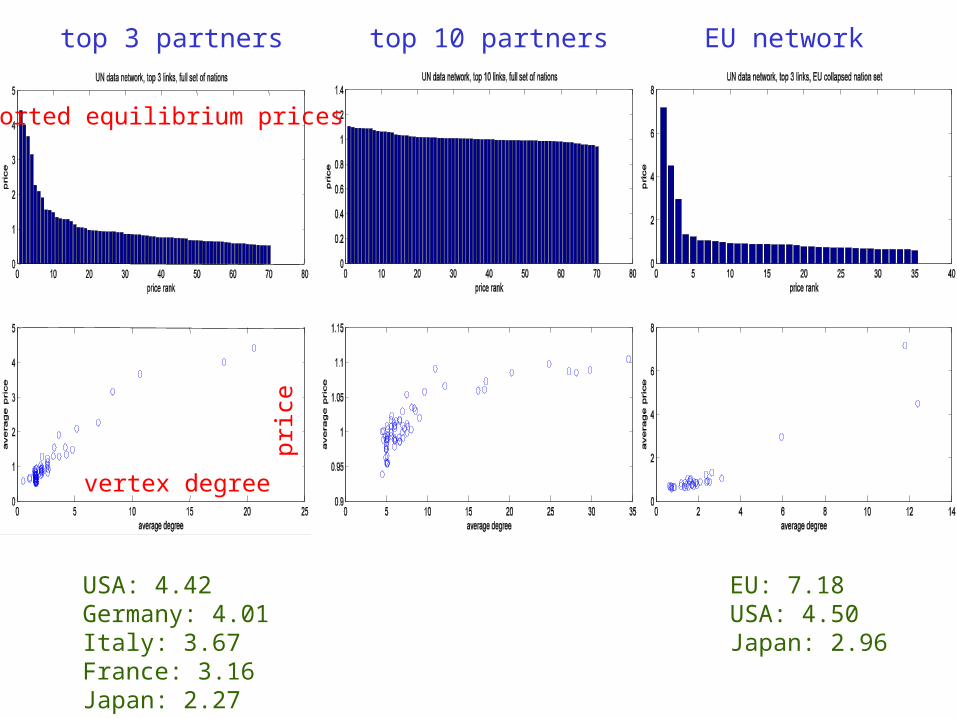
USA: 4.42Germany: 4.01Italy: 3.67France: 3.16Japan: 2.27
top 3 partners top 10 partners EU network
sorted equilibrium prices
vertex degree
pri
ce
EU: 7.18USA: 4.50Japan: 2.96

European Union Network

USA: 4.42Germany: 4.01Italy: 3.67France: 3.16Japan: 2.27
top 3 partners top 10 partners EU network
sorted equilibrium prices
vertex degree
pri
ce
EU: 7.18USA: 4.50Japan: 2.96