Network marketing organizations: Compensation plans ... · Network marketing organizations:...
26
Ž . Intern. J. of Research in Marketing 15 1998 401–426 Network marketing organizations: Compensation plans, retail network growth, and profitability Anne T. Coughlan a, ) , Kent Grayson b a Department of Marketing, Kellogg Graduate School of Management, Northwestern UniÕersity, 2001 Sheridan Road, EÕanston, IL 60208-2008, USA b London Business School, London, UK Abstract Network marketing organizations, or NMOs, are retail selling channels that use independent distributors not only to buy and resell product at retail, but also to recruit new distributors into a growing network over time. Commissions and markups on personal sales volumes, and net commissions on the personal sales volumes of downlines, are the methods of compensation commonly used to motivate NMO distributors. In this paper, we develop, analyze, and calibrate a dynamic decision model of the growth of a retail NMO. Descriptive and prescriptive insights show how compensation and other model parameters affect distributor motivation, sales, and network growth and profitability. q 1998 Elsevier Science B.V. All rights reserved. Keywords: Network marketing organizations; Direct selling; Compensation plans; Decision support models 1. Introduction Companies like Amway, Mary Kay, NuSkin, or Shaklee are examples of an increasingly popular form of retail distribution channel: the network mar- Ž . keting organization or NMO . Although direct-sell- ing organizations have historically used standard di- rect sales forces to distribute their products, today 70% of direct-sales revenues are generated by net- work marketing organizations and business units. In 1995, that amounted to US$11.6 billion in annual Ž . sales Direct Selling AssociationrUSA, 1995 . These companies have grown significantly not just in the United States, but throughout the world. Independent distributors play two key roles in NMOs: they sell ) Corresponding author. Tel.: q1-847-491-2719; Fax: q1-847- 491-2498; E-mail: [email protected] product, and they recruit new distributors. The NMO’s compensation plan structure can have a pro- found effect on how distributors’ time is spent, and therefore plays a critical role in the company’s over- all growth and success through time. In this paper, we define what NMOs are, how they are operated, and how they use compensation to incentivize their distributor salespeople. We then develop and discuss a model of NMO network growth that shows how compensation and other network characteristics af- fect growth and profitability of the NMO distributor and the network as a whole. We use original data collected from NMOs to illustrate how the model can be used to calibrate sales performance and make predictions about future performance of an NMO network. Managing the productivity of retail salespeople has been a focus of many different authors. One 0167-8116r98r$19.00 q 1998 Elsevier Science B.V. All rights reserved. Ž . PII: S0167-8116 98 00014-7
Transcript of Network marketing organizations: Compensation plans ... · Network marketing organizations:...
Ž .Intern. J. of Research in Marketing 15 1998 401–426
Network marketing organizations: Compensation plans, retailnetwork growth, and profitability
Anne T. Coughlan a,), Kent Grayson b
a Department of Marketing, Kellogg Graduate School of Management, Northwestern UniÕersity, 2001 Sheridan Road, EÕanston, IL60208-2008, USA
b London Business School, London, UK
Abstract
Network marketing organizations, or NMOs, are retail selling channels that use independent distributors not only to buyand resell product at retail, but also to recruit new distributors into a growing network over time. Commissions and markupson personal sales volumes, and net commissions on the personal sales volumes of downlines, are the methods ofcompensation commonly used to motivate NMO distributors. In this paper, we develop, analyze, and calibrate a dynamicdecision model of the growth of a retail NMO. Descriptive and prescriptive insights show how compensation and othermodel parameters affect distributor motivation, sales, and network growth and profitability. q 1998 Elsevier Science B.V.All rights reserved.
Keywords: Network marketing organizations; Direct selling; Compensation plans; Decision support models
1. Introduction
Companies like Amway, Mary Kay, NuSkin, orShaklee are examples of an increasingly popularform of retail distribution channel: the network mar-
Ž .keting organization or NMO . Although direct-sell-ing organizations have historically used standard di-rect sales forces to distribute their products, today70% of direct-sales revenues are generated by net-work marketing organizations and business units. In1995, that amounted to US$11.6 billion in annual
Ž .sales Direct Selling AssociationrUSA, 1995 . Thesecompanies have grown significantly not just in theUnited States, but throughout the world. Independentdistributors play two key roles in NMOs: they sell
) Corresponding author. Tel.: q1-847-491-2719; Fax: q1-847-491-2498; E-mail: [email protected]
product, and they recruit new distributors. TheNMO’s compensation plan structure can have a pro-found effect on how distributors’ time is spent, andtherefore plays a critical role in the company’s over-all growth and success through time. In this paper,we define what NMOs are, how they are operated,and how they use compensation to incentivize theirdistributor salespeople. We then develop and discussa model of NMO network growth that shows howcompensation and other network characteristics af-fect growth and profitability of the NMO distributorand the network as a whole. We use original datacollected from NMOs to illustrate how the modelcan be used to calibrate sales performance and makepredictions about future performance of an NMOnetwork.
Managing the productivity of retail salespeoplehas been a focus of many different authors. One
0167-8116r98r$19.00 q 1998 Elsevier Science B.V. All rights reserved.Ž .PII: S0167-8116 98 00014-7

( )A.T. Coughlan, K. Graysonr Intern. J. of Research in Marketing 15 1998 401–426402
stream of marketing research has contrasted the useof independent-agent sales forces with that of com-
Žpany-employee sales forces Anderson, 1985;.Churchill et al., 1985; Weiss and Anderson, 1992 .
Such comparisons have supported the claim thatsome marketing environments are better suited forindependent agents, while others are better suited foremployee salespeople. However, these approachesgroup all independent-agent sales forces under asingle theoretical umbrella. The purpose of this re-search is to understand a distinct approach to manag-ing independent retail salespeople: the network mar-keting organization.
NMOs differ from other retail selling channels inseveral important ways. We define NMOs as thoseorganizations that depend heavily or exclusively on
Ž .personal selling, and that reward sales agents for aŽ . Ž .buying products, b selling products, and c finding
other agents to buy and sell products.NMOs have several distinctive characteristics:
1. They are typically lean organizations, using inde-pendent distributors or reps to sell their products,rather than hiring and managing a large employeesales force.
2. Most NMOs do not advertise or have a retail-storefront presence. This makes retail sales forcemotivation a crucial component of business suc-cess in this form of channel.
3. Distributors in an NMO do not receive a salary,as many other retail salespeople do; their paydepends on the commissions and retail markupsthey can generate. Thus, the system is very heav-ily performance-oriented.
4. NMOs offer an effective ‘menu’ of compensationopportunities, similar to the menu-of-contracts
Ž .concept discussed in Lal and Staelin 1986 . AnNMO distributor can either sell retail product orcan recruit and manage other distributors. Thiseffectively gives the NMO distributor the oppor-tunity to work on the task that best suits her 1
ability.These distinctive characteristics of NMOs suggest
the need for a deeper understanding of how they
1 For expositional convenience, we will refer to distributors asfemale. Most NMO distributors are in fact women, so the pronounchoice is apt.
work, what motivates their distributors to perform invarious ways, and the implications of these actionsfor network sales, growth, and profitability overtime.
1.1. Components of NMO distributor compensation
NMO distributors are compensated for each oftheir efforts in different ways. 2 First, distributorspurchase products at wholesale prices, and may ei-ther use these discounted products themselves orretail the products to others for a profit. Suggestedmarkups usually range from 40 to 50%. Second,distributors receive a monthly commission for their‘personal volume’, which is the value of every prod-uct they personally buy or sell. Third, distributorsreceive a net commission on the sales of those they
Žrecruit into the network who are called their ‘down-.line distributors’ . This third compensation compo-
nent is the most complex aspect of NMO compensa-tion, and is best illustrated with an example.
ŽConsider the example in Fig. 1. Catherine among.others has been recruited by Janet. As Catherine’s
sponsor, Janet is the first person in Catherine’s ‘up-line’, and Janet therefore receives a commission onCatherine’s successful selling efforts. Anne, Lysa,and Paulette, on the other hand, have been directlyrecruited by Catherine, and are on the first level ofCatherine’s ‘downline’. Thus, Catherine receives acommission on their successful selling efforts—andso does Janet. Although many compensation planslimit the number of levels upon which a distributormay earn downline commission, it is not unusual forNMOs to offer such commissions on up to six levelsdownline. This makes Catherine eligible for commis-sions not only on the sales of her direct recruits, butalso on those of her recruits’ recruits, her recruits’recruits’ recruits, etc.
In most NMOs, the commission rate increases asa function of overall group volume. For each distrib-utor, this group volume is the combined sum of allpersonal sales, plus all sales generated by every
2 Descriptions of compensation plans in this section are basedon the authors’ review of three industry compensation plans:Amway, NuSkin International, and Shaklee Corporation. Otherswill be profiled in the section below on empirical analysis.

( )A.T. Coughlan, K. Graysonr Intern. J. of Research in Marketing 15 1998 401–426 403
Fig. 1. Example of an NMO network.
person in the distributor’s downline network. How-ever, in the typical NMO compensation system, eachdistributor’s net commission rate on her downlines’volumes is the difference between this distributor’scommission rate and the commission rate of herdownlines.
For example, suppose Janet sells US$200 worthof product in the month of October. Susan, Cather-ine, and Kent each sell US$100, and Anne, Lysa,and Paulette each sell US$50. Here, Janet’s personalÕolume is US$200, but her group Õolume is US$650,and it is this latter volume on which her commissionis based. Suppose Janet’s company has a very simplecommission system where monthly volumes of up toUS$99 earn commission rates of 3%; monthly vol-umes of US$100 to US$275 earn 5%; and monthlyvolumes of US$276 or over earn 7%. 3 Under thissystem, Janet earns 7% on her group volume ofUS$650, or US$45.50; but of that US$45.50,US$12.50 goes to Catherine for 5% of her groupvolume of US$250; and US$5.00 goes to each ofJanet’s other two direct downlines, who earn 5% ontheir volume of US$100. Of Catherine’s US$12.50,US$1.50 is deducted to pay Anne, Lysa, and Paulettetheir 3% commission on their US$50 sales volumes
3 Although downline commission rates begin as low as 3 to5%, they climb as high as 12 to 27% for monthly volumes ofUS$7000 to US$10,000.
each. Thus, in net, Anne, Lysa, and Paulette eachmake US$1.50 in commissions; Catherine makesUS$8.00 in commissions; Janet’s other two down-lines each make US$5.00 in commissions; and Janet
Žmakes US$23.00 in commissions all will also makemoney on wholesale-to-retail markups on their per-
.sonal volume .
1.2. Sales motiÕators in NMOs
It is generally believed that both non-monetaryand monetary factors motivate NMO distributors tosell. On the non-monetary side, buyer–seller rela-tionships are of great importance in determining thesuccess of a distributor, probably much more so thanin conventional and industrial marketing settings. 4
In their study of an organization similar to an NMO, 5
Ž .Frenzen and Davis 1990 have supported the argu-ment that the strength of social relations betweenbuyer and seller correlates strongly with the likeli-
Ž .hood of a sale. In addition, as Biggart 1989, p. 161observes, NMOs ‘‘work through social conditionsand institutions’’. Distributors recruit new distribu-tors during their contact with the everyday world,and each new recruit brings a new set of sociallinkages for possible use by the network. Becausethe social impact of turning social networks intosales opportunities is particularly important to NMOsŽ .Grayson, 1996 , it will therefore be important to tryto capture the notion that NMO recruiting uses per-sonal contacts to build the network.
It is also clear that money motivates NMO distrib-utors, just as it motivates most salespeople. In oursurvey of NMO executives, over 40% mention busi-
4 Ž .For example, Crosby and Stephens 1987 and Crosby et al.Ž .1990 examined the buyer–seller relationship in the insuranceindustry, but found conflicting, and therefore inconclusive, evi-dence concerning the influence of buyer–seller relationships onseller effectiveness.
5 Ž .The study made by Frenzen and Davis 1990 used Tupper-ware participants as subjects. Tupperware uses a ‘party plan’system, which is similar to NMOs in that individuals are rewardedfor inviting others to buy products and to have parties. However,party-plan companies differ from NMOs in the following ways:Ž .a rewards are not heavily commission-based, and instead include
Ž .significant numbers of product incentives, b people are usuallyeligible for rewards only for those on the level directly below
Ž .them, and c those who hold parties do not have to train orsupervise those they invite to the parties.
( )A.T. Coughlan, K. Graysonr Intern. J. of Research in Marketing 15 1998 401–426404
ness or financial reasons as the motivation for join-ing an NMO. The NMO company that can under-stand the linkage among compensation structure, dis-tributor behavior, sales, and profits will improve itsability to grow its business profitably. For example,the more a company rewards retail sales, the moreslowly its distributor network will grow, becauserecruitment is not a relatively lucrative activity. Con-versely, the more intensively recruitment is re-warded, the faster the distributor network will grow.Furthermore, the number of levels on which a com-pany offers downline commissions will influencehow a distributor spends her time: commission onmore levels will encourage a distributor to activelyrecruit and train more deeply into the network, whilecommission on fewer levels will encourage a distrib-utor to recruit and train a broader downline network.
Thus, understanding the nature of marketplacedemand for the company’s products, along with thepropensity of new distributors to join the network asa result of being recruited by upline distributors, willhelp the NMO company set a compensation systemthat effectively and profitably balances its distribu-tors’ incentives to sell product versus to grow theirdownline networks.
2. A model of NMO compensation and networkgrowth
Our model of NMO compensation is comprised ofthree distinguishable parts. The first, described inSection 2.1 below, captures the sales response func-tion. The second, described in Section 2.2, capturesthe social network attributes of an NMO. The third,described in Section 2.3, formalizes the compensa-tion plan offered to distributors. The model then usesthese three components to postulate an income-maxi-mizing distributor who splits her time among produc-tive NMO activities. Because our goal is to under-stand distributor performance in response to the in-centives provided, we build a model focused on aparticular distributor whom we will denote ‘i’. Weassume that the focal distributor, i, is recruited intothe network at the same time as another distributor,‘ j’, and both will be building their downline net-works simultaneously. We do this to account for thefact that any distributor recruiting and selling in a
network marketing firm is always either directly orindirectly competing against other distributors in thenetwork for both sales and new distributor recruits.
The model assumes certainty in the sales responsefunctions. In light of this, the distributor’s attitudetoward risk is a moot point. However, a model withuncertainty and risk-neutral distributors would pro-duce similar results; risk aversion would induce moreconservative behavior, the specifics of which woulddepend on what activities are subject to the greatestuncertainty. The actual risk attitude of NMO distrib-utors is an empirically unresolved issue. Morebroadly, the academic salesforce compensation litera-
Žture see, e.g., Coughlan and Sen, 1989; Coughlan,.1993 typically assumes salespeople to be either
risk-neutral or risk-averse, although it is oftenclaimed among practitioners that salespeople are in-herently risk-preferring. As the issue is unresolved,particularly in the NMO context, we proceed withour certainty approach.
Distributor i is assumed to split her available timeeach period between selling product and network-
Žbuilding that is, adding new distributors to her. 6downline . This decision is based on the rewards
that she gets for recruiting and selling, given herview of how the rest of the network is operating inthat time period. A time period is an arbitrary lengthof time over which performance is measured andcompensation rewarded. The most commonly-usedcompensation periods at network marketing firmsappear to be monthly or weekly. Distributor j spendsa fraction m of her time on network-building andjtŽ .1ym of her time on selling product; the analo-jt
gous proportions for any downline distributor ineither i’s or j’s downline network are m andd tŽ .1ym , respectively. We assume that m and md t jt d t
are equal to the fraction of time spent recruiting byŽ .distributor i in period ty1 . This permits us to
represent all distributors as modifying their timeallocations over time in response to changing recruit-
6 In reality, selling product and recruiting may occur simultane-ously. However, our empirical data suggest that distributors cannonetheless estimate the time spent on each activity separately. Athird activity, network management, also consumes time, butbecause it is not a direct income-producing activity, we do notmodel it here.

( )A.T. Coughlan, K. Graysonr Intern. J. of Research in Marketing 15 1998 401–426 405
ing conditions, while retaining model tractability.The total time available for network marketing activ-ities per period is T for distributor i; T for distribu-i j
tor j; and T for downlines in i’s or j’s networks.d
Distributor i is assumed to maximize her incomeover a two-period horizon, given the constraint of Ti
total hours available per period for selling and re-cruiting activities.
2.1. Sales response functions
We posit a log-reciprocal model of sales responsefor distributor i in any time period t, modified toinclude a separate intercept term:
bir sa qexp a y , 1Ž .i , t 0 i i si , t
where r is the dollar value of sales by distributor ii, t
in period t, s is the number of hours spent sellingi, t
product by distributor i in period t, and a , a , b0 i i i
are parameters.ŽThis is an s-shaped function of selling time see
Hanssens and Parsons, 1993, for other applications.of the log-reciprocal model of sales response , with
w Ž .xsales converging asymptotically to a qexp a as0 i i
distributor i’s time spent selling approaches an infi-nite number of hours. Practically speaking, however,i’s sales are constrained by the total time constraint,T . The parameter b is a curvature parameter, gov-i i
erning how responsive on the margin sales are toŽ .selling time. Conceptually, the structure in Eq. 1
allows distributor i to vary her time allocation be-havior in response to both the compensation planfacing her and the time-varying size of the network.Distributor i is assumed to know the time allocationrules of all other distributors in the network.
Similarly, the sales response functions facing jand all downline distributors in the network in periodt, respectively, are:
bjr sa qexp a y ,j , t 0 j j 1ym TŽ .jt j
2Ž .bd
r sa qexp a y ,d , t 0d d 1ym TŽ .d t d
where r is the dollar value of sales by distributor jj, t
in period t, r is the dollar value of sales by ad, t
downline distributor in period t, and a , a , a , a ,0 j 0d j d
b , b are parameters.j d
We construe the existing legal requirements thatdistributors must actually sell product in order forthe NMO to avoid being classified as an illegalpyramid scheme as implying that s is strictly posi-i, t
tive for all t. This prevents the sales response func-Ž . Ž .tions in Eqs. 1 and 2 above from being undefined,
as they would be if s s0 were permitted. Finally,i, t
note that sales are a recurring event each period,representing the fact that most products sold through
Žsuccessful NMOs are consumables e.g., cosmetics,.household products, or telecommunications services .
2.2. Recruitment of new distributors
Our discussion above notes the ‘social network’aspect of recruiting new distributors into an NMO.One distributor recruits others by socially interactingwith them in one form or another. We represent thisprocess by adapting a diffusion model formulation to
Ž .the recruitment process Bass, 1969 . We find thismodel structure attractive because it allows for net-
Žwork growth via both inherent attraction the ‘in-.novation effect’ and by the spread of word-of-mouth
Ž .the ‘imitation effect’ .We assume that distributor i recruits new down-
line distributors into her network in period t accord-ing to the following functional rule:
q sp T ys qyn yn y2Ž . Ž .i , t i i i , t i , ty1 j , ty1
c qc q2i , ty1 j , ty1qk Pi ž /q
P qyn yn y2 , 3Ž .Ž .i , ty1 j , ty1
where q is the number of new downline distribu-i, t
tors recruited by distributor i in period t, n isi, ty1
the total number of distributors eÕer recruited intoŽ . Ži’s downline by the end of period ty1 not in-
.cluding i , n is the total number of distributorsj, ty1
eÕer recruited into j’s downline by the end of periodŽ . Ž .ty1 not including j , p is the coefficient ofi
Ž .‘innovation’ a parameter for distributor i, q is theŽ .number of distributors ever recruited beyond which
Ž .no new recruiting can take place a parameter , k isiŽ .the coefficient of ‘imitation’ a parameter for dis-
tributor i, c is the total number of actiÕe distrib-i, ty1Ž .utors in i’s downline at the end of period ty1
Ž .not including i , and c is the total number ofj, ty1

( )A.T. Coughlan, K. Graysonr Intern. J. of Research in Marketing 15 1998 401–426406
actiÕe distributors in j’s downline at the end ofŽ . Ž .period ty1 not including j .
The first term in the q function is the ‘innova-i, t
tion’ term, comprised of an innovation parameter,p ; the amount of time spent recruiting; and thei
number of potential distributors not yet recruited intothe network. We thus assume that time spent recruit-ing increases the number of distributors that can berecruited. The variable q represents a ceiling on thenumber of distributors that can ever be recruited; ifthis number is reached or exceeded in some timeperiod t, no new recruiting can occur in later timeperiods because the network potential has been ex-hausted. Thus, we interpret q roughly as the poten-tial number of distributors that can be recruited intothe network, but because of the ‘integer’ nature of
Žrecruiting i.e., one cannot recruit a fraction of a.distributor , the ultimate number of distributors ever
recruited into a particular network may exceed or fallshort of q by some margin.
The second term in the recruiting function is the‘imitation’ term, consisting of an imitation parame-ter, k ; the proportion of all active distributors re-i
maining in the network; and the untapped potentialdistributors. This is the standard imitation componentof a diffusion model. We do not model the imitationeffect as being influenced by recruiting time, becausethe inherent concept of an imitation effect is thatmore passive word-of-mouth and other external ef-fects contribute to the imitation phenomenon. As in astandard diffusion model, this formulation has theproperty that passive word-of-mouth helps recruitnew distributors, but as the network approaches ma-turity, it becomes harder and harder to recruit morenew distributors. Eventually, the network will stopgrowing when all potential distributors have beenrecruited.
Distributor attrition is a universal issue in networkmarketing that we allow for by assuming that ci, ty1
/n and c /n . Specifically, we assumei, ty1 j, ty1 j, ty1
that c sn sq and c sn sq ; but there-i,1 i,1 i,1 j,1 j,1 j,1
after:
c sc PaP 1qq qqŽ .i , t i , ty1 d , t i , t
c sc PaP 1qq qqŽ .j , t j , ty1 d , t j , t
n sn qq qc Pq 4Ž .i , t i , ty1 i , t i , ty1 d , t
n sn qq qc Pq .j , t j , ty1 j , t j , ty1 d , t
Ž .The parameter a a-1 is the fraction of downlinedistributors who are retained in the network each
Ž Ž .period thus, 1ya is the fraction subject to attri-.tion . While estimates of attrition vary widely, re-
search indicates that attrition of 100% per year is notŽuncommon Brodie, 1995; Direct Selling Associa-
.tionrUK, 1996 . We show below that the actualamount of attrition varies over time depending on thenetwork’s level of maturity.
New distributor recruitment is done by all distrib-utors currently in the network until all potential fornew recruitment is exhausted, at which point time isallocated entirely to selling effort by all distributors.Distributor j’s recruiting function is analogous toi’s, adjusted for the amount of time j spends recruit-ing, m T : 7
jt j
q sp Pm PT qyn yn y2Ž .j , t j jt j i , ty1 j , ty1
c qc q2i , ty1 j , ty1qk Pj ž /q
P qyn yn y2 . 5Ž .Ž .i , ty1 j , ty1
Similarly, each downline spends m T hours perd t d
time period recruiting new distributors into the net-work, and each one recruits q new downline dis-d, t
tributors of her own in period t according to thefollowing function:
q sp Pm PT qyn yn y2Ž .d , t d d t d i , ty1 j , ty1
c qc q2i , ty1 j , ty1qk Pd ž /q
P qyn yn y2 . 6Ž .Ž .i , ty1 j , ty1
Finally, while the equations for q , q , and qi, t j, t d, t
permit fractional downline distributors to be re-cruited, in the analysis we round these numbers toget more realistic integer recruitment figures.
2.3. Distributor income
Ž .Distributor i makes income on a markup onŽ .personal retail volume sold, b commissions on
7 We allow j’s recruiting parameters to vary from i’s in thestatement of the formal model. However, in the empirical analysisbelow, we will restrict i’s and j’s parameters to be equal, forsimplicity of exposition.

( )A.T. Coughlan, K. Graysonr Intern. J. of Research in Marketing 15 1998 401–426 407
Ž .personal volume, and c net commissions on thevolume of her downline distributors. We assume an
Žaverage markup of C cents per dollar so that, forexample, if distributor i sells a product for a retail
. 8price of US$1.00, she makes C cents in markup .As mentioned above, commission rates are generallyquoted as a percentage of group Õolume, and theyincrease as group volume increases. Let i’s groupvolume in period t be denoted as R . Then wei, t
approximate the usual step-function for commissionswith the continuous function below:
b sg 1yexp yg R , 7Ž . Ž .i , t 1 2 i , t
Ž .where g is the asymptotic high commission rate1
that can be earned, and g is a shape parameter. The2
commission rate function is concave: commissionincreases, but at a decreasing rate, with group vol-ume. The formula for group volume can be moreexplicitly written as:
t
R sr q R , 8Ž .Ýi , t i , t d , t ,mms1
wheret
Ž tymy1.R sa Pq 1qq r .Ž .Łd , t ,m i ,m d ,k d , tksmq1
Here, R is the group volume in period t of ad, t,m
downline recruited by i in period m. Thus, the sumof the R over all m from 1 to t is the sum of alld, t,m
the group volumes of all downlines recruited directlyby i in any period prior to t—or more simply, thetotal volume generated by all downlines in i’s net-work. R is calculated by multiplying a singled, t,m
Ž .downline’s volume in period t r by all downlinesd, t
remaining in i’s network in period t; those who arestill active are all those recruited directly by i in anyprior period, and all those ever recruited into theirnetworks through time, adjusted by the attrition fac-
8 For simplicity, we keep C fixed for all distributors, includingi and j. Our empirical research reveals that distributors tend to setretail prices consistent with the markups suggested by the NMOfirm. Given this, the NMO’s suggestion of a retail markup can beviewed as tantamount to the setting of a retail price. While weacknowledge each distributor’s right to set a retail price in theory,the fact that they do not deviate in practice from suggested retailprices makes it possible to assume an average markup, rather thanmodel the distributor as choosing retail prices.
tor. Note that the earlier in time a downline distribu-tor is recruited by i, the larger her own downlinenetwork is in t; thus it is important to account foreach ‘generation’ of recruits separately.
In this paper, we model a ‘unilevel’ compensationplan. 9 Here, each distributor’s group commission
Ž .rate is calculated as in Eq. 7 above. The distributormakes this commission on every dollar of her per-sonal Õolume, that is, the volume of product that shepersonally sells each period. Beyond this, the distrib-utor makes net commissions on the sales of herdownline distributors. The net commission rate issimply the difference between the distributor’s groupvolume commission and the group commission rateof her downline distributor. Thus, as a downline’sown network grows and her group commission raterises, the upline distributor makes less and less in netcommissions from that downline. It is not unusualfor the upline to make no net commission income on
Ža downline’s group volume which happens whenboth the upline and her downline are in the samecommission category, frequently the maximum pos-
.sible commission . More formally, a downline dis-tributor ‘d’ recruited by i in period h earns a groupcommission rate in period t of b . Then the netd, t,h
commission rate earned by i on d’s group volume isjust:
g sb yb . 9Ž .t ,h i , t d , t ,h
We can then express distributor i’s income inperiod t as:
t
w xy s Cqb r q g PR . 10Ž . Ž .Ýi , t i , t i , t t ,h d , t ,hhs1
To reflect the idea that distributors recruit down-lines in the hopes of a stream of future returnsŽ .rather than just a one-period payout , we assumethat distributor i maximizes her income in period t,
9 This is a very common type of network marketing compensa-tion plan. The other most common plan type is the ‘breakaway’plan, where a downline distributor ‘breaks away’ from her uplinesponsor when she reaches a certain level of group volume herself.After this point, the upline no longer can count the breakaway’sgroup volume in her total group volume, but does make a flat-rate
Ž .override usually on the order of 5% on all sales of the break-away’s network thereafter. Because this compensation plan re-quires several significant modifications to the present model, weleave investigation of this plan’s characteristics to later research.

( )A.T. Coughlan, K. Graysonr Intern. J. of Research in Marketing 15 1998 401–426408
Ž .plus the income she can plan on getting in tq1from the downlines she recruits in period t, subjectto the constraint that total time per period be nogreater than T hours. 10 Formally, distributor i does:i
t
max y q g PR Pa 1qq 11Ž . Ž .Ýi , t t ,h d , t ,h d , tsi , t hs1
s.t. s (T .i , t i
Finally, for reference we give the NMO firm’sgross profit function. 11 The NMO itself does not setany decision variables in this model, but we will usethe profit function to report below on the profitabil-ity implications of different scenarios. The firm’sprofit in period t is expressed as:
p s 1yb yC PRŽ .t i , t i , t
q 1yb yC PR , 12Ž .Ž .j , t j , t
where
b sg 1yexp yg PRŽ .j , t 2 2 j , t
Žand R is the distributor j’s group volume with aj ,t.form analogous to that for R .i, t
Ž .Distributor i’s optimand in Eq. 11 above is ahighly nonlinear objective function, with no analyticclosed-form solution to the first-order conditions foreach period. Thus we proceed below to illustrate theproperties of the model through a numerical analysis,
10 Many salesforce compensation models now use a utility-max-imizing approach rather than an income-maximizing one. Our dataindicate that a specific amount of total time is spent on networkmarketing activities and that the time is then allocated betweenselling and network-building activities. We can represent the
Ž . Ž .2distributor’s utility therefore as U s y s ,Õ y d s q Õi, t i, t i, t i, t i, t i, t
where y is income over whatever horizon distributor i has; si, t i, t
is selling time; Õ is network-building time; and d is a parameteri, t
representing the disutility of time. The total time available is someT hours, so that the constraint that T s s q Õ implies that thei i i, t i, t
distributor’s optimization problem is to choose s to maximizei, tŽ Ž .. 2U s y s , T y s y dT . This is equivalent to an incomei, t i, t i, t i i, t i
maximization problem, and is the problem we solve here.11 Gross profit here is defined as profit gross of cost of goods
Ž .sold COGS and any other expenditures. This is a valid diagnos-tic measure for our purposes: first, because COGS does not varyin kind for differences in distributor compensation decisions orother underlying parametric levels in our model; and second,because NMOs generally make very low or no expenditures onother marketing-mix activities, like advertising.
using original data collected from a sample of net-work marketing firms to calibrate the parameters ofthe model.
3. Empirical analysis and model insights
Because of the complexity of our model, closed-form analytic solutions cannot be derived. Realism indepicting the factors in a network marketing systemis necessary, however, to adequately analyze theincentives for the different types of distributor activi-ties. We use a numerical analysis to show theseincentives, but go a step beyond a general numericalanalysis to use data from an original survey ofnetwork marketing firms to calibrate the model pa-rameters. This gives us some confidence that thenumerical scenarios we are investigating are repre-sentative of real network marketing firms’ and dis-tributors’ experiences. Our empirical analysis lets usexamine how changes in the compensation plan, orinvestments in sales-producing or recruitment-en-hancing assets, influence the activities of our focaldistributor as well as the overall growth and prof-itability of the network marketing firm.
Below, we first discuss the data and present sum-mary statistics. We then summarize the process ofinitial model parametrization and the development ofa baseline scenario. Following this is a full numericalanalysis of the model around the baseline. Finally,we discuss general insights emerging from the analy-sis regarding incentives, growth, and profitability ina network with a unilevel compensation plan.
3.1. The data
The data were collected through a survey sent tothe presidents of 150 NMOs. 12 Presidents wereencouraged to complete the survey, but if they couldnot, they were asked to pass the survey on to another
Ž .executive a sales manager, for example . Of allsurveys returned, seven could not be delivered to theaddress on our mailing list, and three were returnedby companies that no longer operate as network
12 We thank Corey Augenstein, editor of Downline News, forsharing his mailing list with us.

( )A.T. Coughlan, K. Graysonr Intern. J. of Research in Marketing 15 1998 401–426 409
Table 1Overview of survey respondents
Average Maximum Minimum
Current size of network 40,000 300,000 250
Annual revenues US$31,600,000 US$360,000,000 US$150,000
Years in business 6 18 1
% of business outside the U.S. 12% 93% 0%
marketers. After two mailings to every address onthe list, a total of 32 viable surveys were completedand returned, constituting a response rate of 23%.We found no systematic lack of response to anyparticular question on the survey. 13
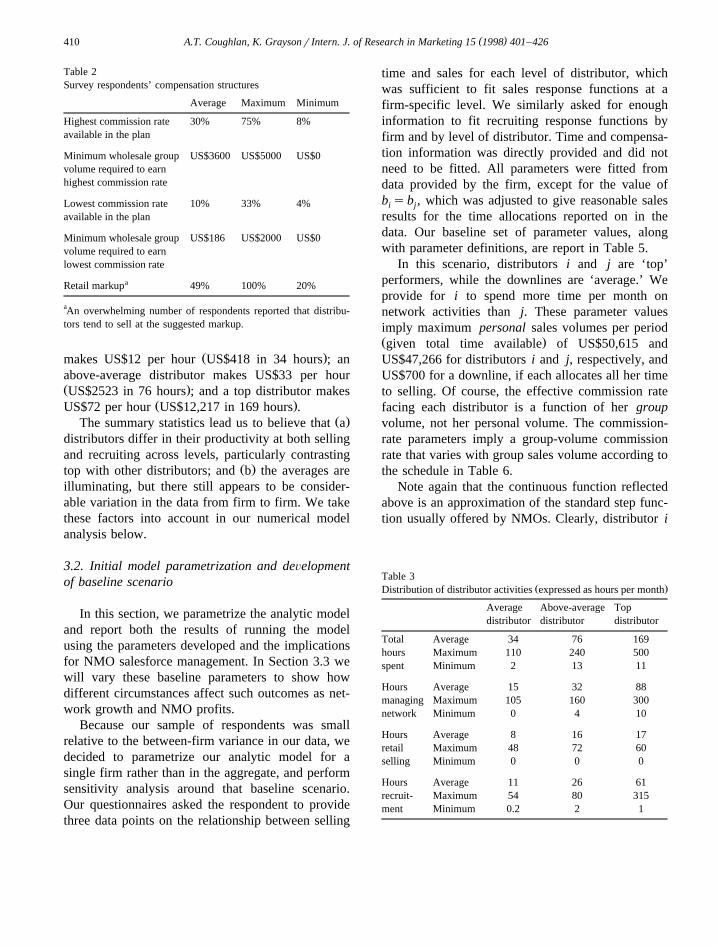
Tables 1 and 2 outline the characteristics of therespondent pool. Respondents’ average network sizeat the time of the survey was 40,000, and averageannual revenues were US$31.6 million. However,the range figures indicate considerable variancearound these averages. In addition, the average com-mission rates seem to accurately reflect the generalindustry trends.
We also collected information on how respon-dents believed distributors split their time amongproductive activities. 14 Because NMO presidentstypically were distributors themselves in the past, wefelt comfortable with their responses. These data arepresented in Table 3, expressed in hours per month,for three different ability levels of distributor: aver-age, above average, and top. 15 The data show that
13 The discussion here follows the ‘1993 Multi-Level MarketingŽExecutives Industry Survey Summary Report’ Coughlan and
.Grayson, 1993 .14 We asked about time spent not only on retail selling and
Žrecruitment, but also on network management holding rallies for.downline distributors, training, etc. . Because we focus in this
model on selling and recruiting specifically, we omit the networkmanagement function from our model.
15 In our numerical analysis below, we depict distributors i andj as top distributors, and all downlines as aÕerage distributors.Respondents said that on average, 21% of their distributors wereabove average performers, while 71% were average performersand 8% were top performers. A discriminant analysis of our datarevealed significant differences between top and other distributors,but not between average and above average distributors. Modelingtop and average distributors therefore appears to adequately repre-sent the diversity among distributors of different levels.
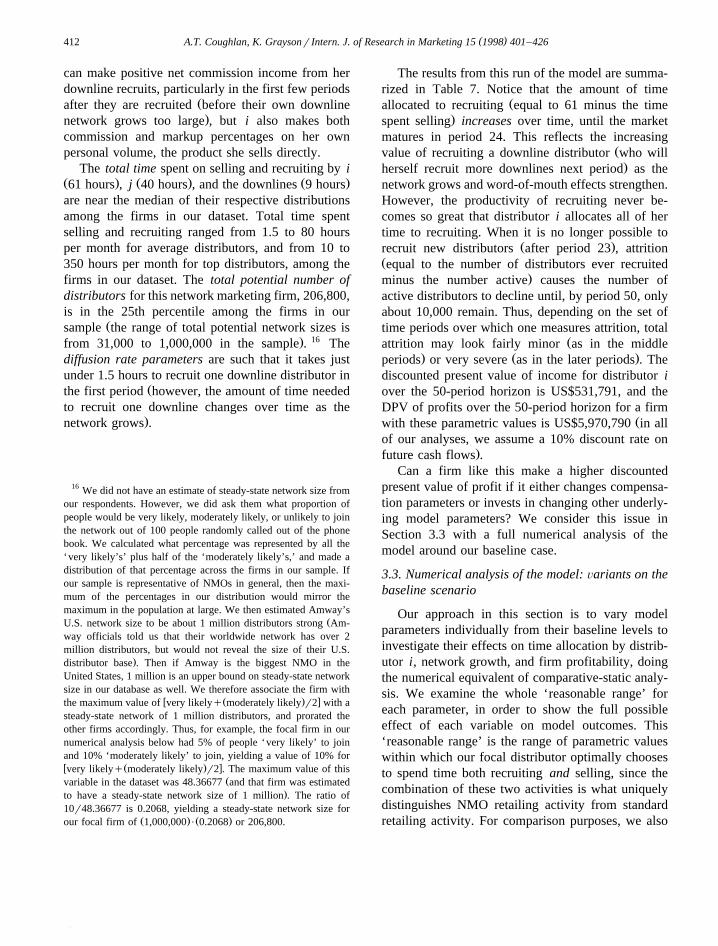
an above-average distributor spends slightly moreŽ .than twice 2.24 times the total time that average
distributors do on network marketing, and top dis-Ž .tributors spend slightly more than twice 2.22 times
the total time that above average distributors do. Thiscontradicts a common stereotype of the top distribu-tor as a ‘freeloader’ on the rest of the network whodoes no work but makes large amounts of money.Further, on a percentage basis, of the total time spent
Žselling and recruiting omitting network management.time , average distributors spend 45% on recruiting;
above average distributors spend 59% on recruiting;and top distributors spend 74% on recruiting. Thus,the differences in productivity of different levels ofdistributors come both from differences in total timespent and from differences in the allocation of thattime between selling and recruiting.
How productive are distributors with the timethey spend in network marketing? Table 4, alongwith Table 3, summarizes the evidence from oursample. It takes an average distributor 5.5 hours to
Žrecruit a downline 11 hours to recruit two distribu-.tors ; an above average distributor recruits a down-
Žline in 5.2 hours 26 hours to recruit five distribu-.tors ; and a top distributor recruits a downline in a
Žconsiderably lower 3.8 hours 61 hours to recruit 16.downlines . Selling productivity varies by distributor
level as well. Tables 3 and 4 shows that averagedistributors sell, on average, US$34 of merchandiseŽ . Žwholesale value per hour 8 hours to sell US$275
.of merchandise ; above average distributors sellŽUS$53 of merchandise per hour 16 hours to sell
.US$855 of merchandise ; and top distributors sellŽUS$295 of merchandise per hour 17 hours to sell
.US$5008 of merchandise . For these productivitylevels, Tables 3 and 4 also show the compensationthat distributors receive. An average distributor
( )A.T. Coughlan, K. Graysonr Intern. J. of Research in Marketing 15 1998 401–426410
Table 2Survey respondents’ compensation structures
Average Maximum Minimum
Highest commission rate 30% 75% 8%available in the plan
Minimum wholesale group US$3600 US$5000 US$0volume required to earnhighest commission rate
Lowest commission rate 10% 33% 4%available in the plan
Minimum wholesale group US$186 US$2000 US$0volume required to earnlowest commission rate
aRetail markup 49% 100% 20%
aAn overwhelming number of respondents reported that distribu-tors tend to sell at the suggested markup.
Ž .makes US$12 per hour US$418 in 34 hours ; anabove-average distributor makes US$33 per hourŽ .US$2523 in 76 hours ; and a top distributor makes
Ž .US$72 per hour US$12,217 in 169 hours .Ž .The summary statistics lead us to believe that a
distributors differ in their productivity at both sellingand recruiting across levels, particularly contrasting
Ž .top with other distributors; and b the averages areilluminating, but there still appears to be consider-able variation in the data from firm to firm. We takethese factors into account in our numerical modelanalysis below.
3.2. Initial model parametrization and deÕelopmentof baseline scenario
In this section, we parametrize the analytic modeland report both the results of running the modelusing the parameters developed and the implicationsfor NMO salesforce management. In Section 3.3 wewill vary these baseline parameters to show howdifferent circumstances affect such outcomes as net-work growth and NMO profits.
Because our sample of respondents was smallrelative to the between-firm variance in our data, wedecided to parametrize our analytic model for asingle firm rather than in the aggregate, and performsensitivity analysis around that baseline scenario.Our questionnaires asked the respondent to providethree data points on the relationship between selling
time and sales for each level of distributor, whichwas sufficient to fit sales response functions at afirm-specific level. We similarly asked for enoughinformation to fit recruiting response functions byfirm and by level of distributor. Time and compensa-tion information was directly provided and did notneed to be fitted. All parameters were fitted fromdata provided by the firm, except for the value ofb sb , which was adjusted to give reasonable salesi j
results for the time allocations reported on in thedata. Our baseline set of parameter values, alongwith parameter definitions, are report in Table 5.
In this scenario, distributors i and j are ‘top’performers, while the downlines are ‘average.’ Weprovide for i to spend more time per month onnetwork activities than j. These parameter valuesimply maximum personal sales volumes per periodŽ .given total time available of US$50,615 andUS$47,266 for distributors i and j, respectively, andUS$700 for a downline, if each allocates all her timeto selling. Of course, the effective commission ratefacing each distributor is a function of her groupvolume, not her personal volume. The commission-rate parameters imply a group-volume commissionrate that varies with group sales volume according tothe schedule in Table 6.
Note again that the continuous function reflectedabove is an approximation of the standard step func-tion usually offered by NMOs. Clearly, distributor i
Table 3Ž .Distribution of distributor activities expressed as hours per month
Average Above-average Topdistributor distributor distributor
Total Average 34 76 169hours Maximum 110 240 500spent Minimum 2 13 11
Hours Average 15 32 88managing Maximum 105 160 300network Minimum 0 4 10
Hours Average 8 16 17retail Maximum 48 72 60selling Minimum 0 0 0
Hours Average 11 26 61recruit- Maximum 54 80 315ment Minimum 0.2 2 1

( )A.T. Coughlan, K. Graysonr Intern. J. of Research in Marketing 15 1998 401–426 411
Table 4Productivity of distributor activities
Average Above-average Topdistributor distributor distributor
Number of new recruits per month Average 2 5 16Maximum 15 20 100Minimum 0 0.5 0
Ž .Income per month in dollars Average 418 2523 12,217Maximum 1100 12,500 63,000Minimum 24 500 1000
Ž .Value of product sold wholesale dollars Average 275 855 5008Maximum 1000 3000 40,000Minimum 0 0 0
Table 5Model parameters and their definitions
Total time parameters Recruiting parameters Sales response Commission andfunction parameters markup parameters
T s61 qs206,800 a sa s280 g s0.59i 0 i 0 j 1y6T s40 p sp s3.27923P10 a sa s10.9576 g s0.00223494j i j i j 2
y6T s9 p s1.45743P10 b sb s8 Cs0.325d d i jy6k sk s3.15642P10 a s140i j 0d
y4k s2.42194P10 a s12.6269d d
as0.9 b s56.6904d
Commission and markup parameters: g sshape parameter in commission rate function. Higher g implies that commission rises faster2 2
with increases in sales performance. g sasymptotic maximum commission rate that can be earned on sales, as sales volume grows very1Ž .large. Csaverage markup in cents per dollar of sales that a distributor gets by virtue of buying at wholesale and selling at retail.
Recruiting parameters: qscumulative number of distributors ever recruited, beyond which no new recruiting can occur in future periods.Referred to as ‘network potential.’ p , p , p scoefficient of ‘innovation’ for i, j, and downlines, respectively: as parameter is higher,i j d
recruiting time is more productive in recruiting new distributors. k , k , k scoefficient of ‘imitation’ for i, j, and downlines, respectively:i j d
as parameter is higher, word-of-mouth effects are stronger at attracting new distributors to the network. as fraction of downline distributorsŽ .retained in the network from the previous period. Thus, 1ya is the attrition fraction.
Ž .Total time parameters: T , T , T s total time in hours available per period for both selling and recruiting activities for i, j, and downlines,i j d
respectively.Sales response function parameters: a , a ; a , a ; a , a scomponents of asymptotic maximum sales of i, j, and downlines,0 i i 0 j j 0d d
w Ž .xrespectively. E.g., as distributor i’s selling time approaches infinity, sales approach a qexp a for i. b , b , b sshape parameter in0 i i i j dŽ .s-shaped sales response function, for i, j, and downlines, respectively. As parameter increases, marginal sales productivity falls, orequivalently, more selling effort is necessary to reach the same personal sales level.
Table 6Group-volume commission rate and group sales volumes
Group sales volume Commission rate Group sales volume Commission rate
0 0 3500 58.98%500 39.70% 4000 58.9923%1000 52.69% 4500 58.9975%1500 56.94% 5000 58.9992%2000 58.32% 5500 58.9997%2500 58.78% 6000 58.9999%3000 58.93% 6300q 59%
( )A.T. Coughlan, K. Graysonr Intern. J. of Research in Marketing 15 1998 401–426412
can make positive net commission income from herdownline recruits, particularly in the first few periods
Žafter they are recruited before their own downline.network grows too large , but i also makes both
commission and markup percentages on her ownpersonal volume, the product she sells directly.
The total time spent on selling and recruiting by iŽ . Ž . Ž .61 hours , j 40 hours , and the downlines 9 hoursare near the median of their respective distributionsamong the firms in our dataset. Total time spentselling and recruiting ranged from 1.5 to 80 hoursper month for average distributors, and from 10 to350 hours per month for top distributors, among thefirms in our dataset. The total potential number ofdistributors for this network marketing firm, 206,800,is in the 25th percentile among the firms in our
Žsample the range of total potential network sizes is. 16from 31,000 to 1,000,000 in the sample . The
diffusion rate parameters are such that it takes justunder 1.5 hours to recruit one downline distributor in
Žthe first period however, the amount of time neededto recruit one downline changes over time as the
.network grows .
16 We did not have an estimate of steady-state network size fromour respondents. However, we did ask them what proportion ofpeople would be very likely, moderately likely, or unlikely to jointhe network out of 100 people randomly called out of the phonebook. We calculated what percentage was represented by all the‘very likely’s’ plus half of the ‘moderately likely’s,’ and made adistribution of that percentage across the firms in our sample. Ifour sample is representative of NMOs in general, then the maxi-mum of the percentages in our distribution would mirror themaximum in the population at large. We then estimated Amway’s
ŽU.S. network size to be about 1 million distributors strong Am-way officials told us that their worldwide network has over 2million distributors, but would not reveal the size of their U.S.
.distributor base . Then if Amway is the biggest NMO in theUnited States, 1 million is an upper bound on steady-state networksize in our database as well. We therefore associate the firm with
w Ž . xthe maximum value of very likelyq moderately likely r2 with asteady-state network of 1 million distributors, and prorated theother firms accordingly. Thus, for example, the focal firm in ournumerical analysis below had 5% of people ‘very likely’ to joinand 10% ‘moderately likely’ to join, yielding a value of 10% forw Ž . xvery likelyq moderately likely r2 . The maximum value of this
Žvariable in the dataset was 48.36677 and that firm was estimated.to have a steady-state network size of 1 million . The ratio of
10r48.36677 is 0.2068, yielding a steady-state network size forŽ . Ž .our focal firm of 1,000,000 P 0.2068 or 206,800.
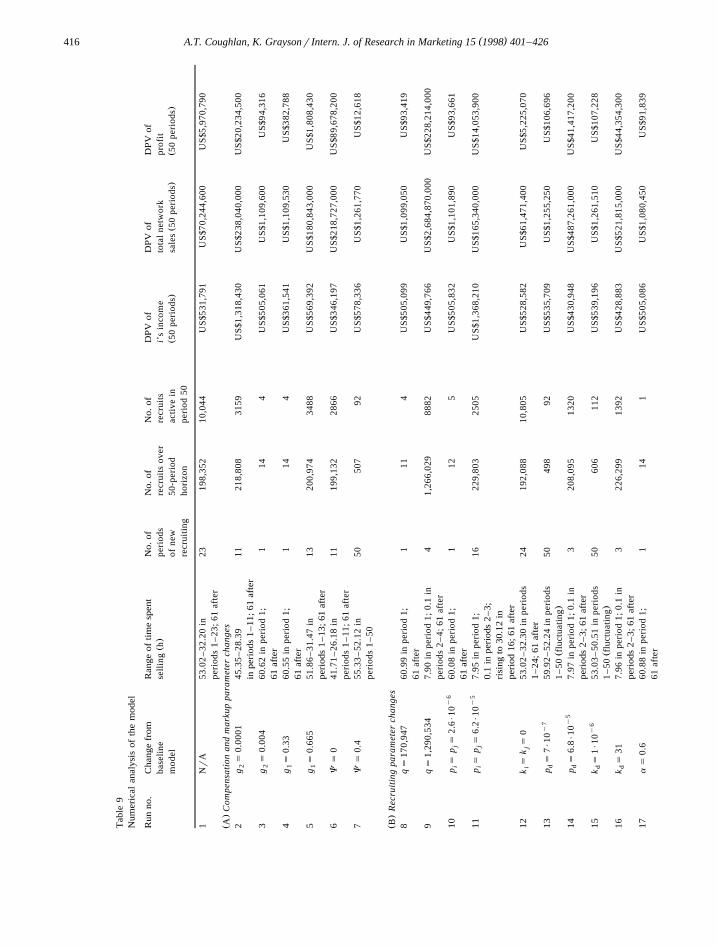
The results from this run of the model are summa-rized in Table 7. Notice that the amount of time
Žallocated to recruiting equal to 61 minus the time.spent selling increases over time, until the market
matures in period 24. This reflects the increasingŽvalue of recruiting a downline distributor who will.herself recruit more downlines next period as the
network grows and word-of-mouth effects strengthen.However, the productivity of recruiting never be-comes so great that distributor i allocates all of hertime to recruiting. When it is no longer possible to
Ž .recruit new distributors after period 23 , attritionŽequal to the number of distributors ever recruited
.minus the number active causes the number ofactive distributors to decline until, by period 50, onlyabout 10,000 remain. Thus, depending on the set oftime periods over which one measures attrition, total
Žattrition may look fairly minor as in the middle. Ž .periods or very severe as in the later periods . The
discounted present value of income for distributor iover the 50-period horizon is US$531,791, and theDPV of profits over the 50-period horizon for a firm
Žwith these parametric values is US$5,970,790 in allof our analyses, we assume a 10% discount rate on
.future cash flows .Can a firm like this make a higher discounted
present value of profit if it either changes compensa-tion parameters or invests in changing other underly-ing model parameters? We consider this issue inSection 3.3 with a full numerical analysis of themodel around our baseline case.
3.3. Numerical analysis of the model: Õariants on thebaseline scenario
Our approach in this section is to vary modelparameters individually from their baseline levels toinvestigate their effects on time allocation by distrib-utor i, network growth, and firm profitability, doingthe numerical equivalent of comparative-static analy-sis. We examine the whole ‘reasonable range’ foreach parameter, in order to show the full possibleeffect of each variable on model outcomes. This‘reasonable range’ is the range of parametric valueswithin which our focal distributor optimally choosesto spend time both recruiting and selling, since thecombination of these two activities is what uniquelydistinguishes NMO retailing activity from standardretailing activity. For comparison purposes, we also

( )A.T. Coughlan, K. Graysonr Intern. J. of Research in Marketing 15 1998 401–426 413
Table 7Results from baseline run of model
Period Time spent Distributor No. of No. of Total network Network profitselling i’s income active distributors salesŽ .h distributors ever recruited
1 53.02 US$45,716 21 21 US$91,060 US$77402 50.03 US$46,240 31 31 US$106,130 US$90213 50.48 US$46,822 40 43 US$106,047 US$90144 50.33 US$47,402 48 55 US$109,179 US$92805 50.35 US$47,941 56 67 US$111,322 US$94626 50.33 US$48,456 62 79 US$113,477 US$96467 50.32 US$48,936 68 91 US$115,336 US$98048 50.31 US$49,386 73 103 US$117,036 US$99489 50.30 US$49,804 78 115 US$118,552 US$10,07710 50.29 US$50,282 84 128 US$120,207 US$10,21811 50.28 US$50,729 88 141 US$121,718 US$10,34612 50.28 US$51,145 92 154 US$123,071 US$10,46113 50.27 US$51,532 96 167 US$124,298 US$10,56514 50.27 US$51,888 100 180 US$125,395 US$10,65915 50.26 US$54,504 191 291 US$154,521 US$13,13416 50.05 US$55,293 356 493 US$206,888 US$17,58617 49.74 US$53,413 654 862 US$298,414 US$25,36518 49.20 US$50,340 1193 1531 US$458,380 US$38,96219 48.30 US$48,385 2167 2743 US$729,484 US$62,00620 46.91 US$48,118 3927 4936 US$1,173,200 US$99,72221 44.89 US$48,125 10,640 12,827 US$2,753,190 US$234,02122 39.12 US$48,438 38,382 44,824 US$8,579,990 US$729,29923 32.20 US$45,160 172,720 198,352 US$30,230,000 US$2,569,55024 61 US$50,807 155,448 198,352 US$24,698,900 US$2,099,40025 61 US$46,810 139,903 198,352 US$109,276,000 US$9,288,500
26 Constant at 61 Rises to Declines to Constant at Declines to Declines tothrough US$52,005 in 10,046 in 198,352 US$7,935,790 US$674,542
50 period 50 period 50 in period 50 in period 50
Ž .Discounted present value of distributor i’s income over the 50-period horizon is10% sUS$531,791.Ž .Discounted present value of sales over the 50-period horizon is10% sUS$70,244,600.Ž .Discounted present value of profits over the 50-period horizon is10% sUS$5,970,790.
report on the range of parameter values found in ourŽ .data the ‘data range’ . However, because these other
parameter values may be more realistically appliedin the context of the rest of that firm’s set of values,we caution the reader against making inferencesabout other firms’ experiences based on our applica-tion of just one of their parameter values to ourbaseline scenario. Given the many model parametersand the complexity of the model, 17 it is infeasible to
17 Ž .The model is run on Mathematica. Each run 50 periods longtakes about 2 h to run on a Pentium 200 MHz computer. TheMathematica file is available from the authors on request.
sample the entire parameter space. But by startingfrom a reasonable baseline scenario, we can investi-gate a representative part of the space and drawgeneral conclusions about the effects of certain pa-rameters on network marketing outcomes. Of course,the model can also be implemented in any specificnetwork marketing company in an interactive fashionto examine that particular firm’s situation in detail.
We ran 36 scenarios beyond the baseline scenario.The runs are described in Table 8, and results fromthe runs are summarized in Table 9. We divide thescenarios into those examining the effects of changes
Ž .in a compensation and markup parametersŽ . Ž .scenarios 2 through 7 , b recruiting parameters
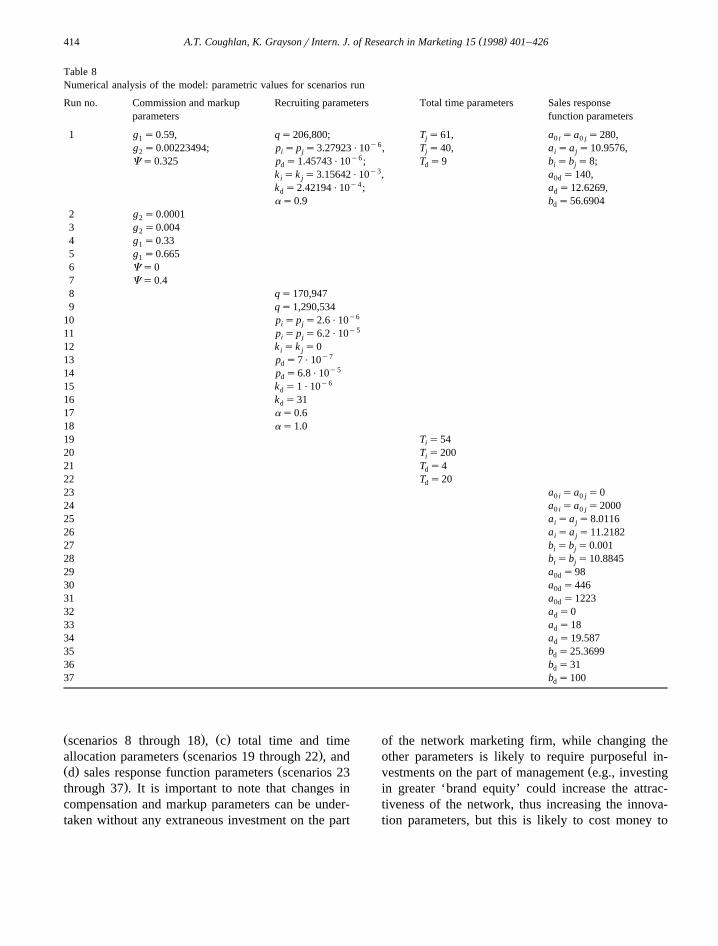
( )A.T. Coughlan, K. Graysonr Intern. J. of Research in Marketing 15 1998 401–426414
Table 8Numerical analysis of the model: parametric values for scenarios run
Run no. Commission and markup Recruiting parameters Total time parameters Sales responseparameters function parameters
1 g s0.59, qs206,800; T s61, a sa s280,1 j 0 i 0 jy6g s0.00223494; p sp s3.27923P10 , T s40, a sa s10.9576,2 i j j i j
y6Cs0.325 p s1.45743P10 ; T s9 b sb s8;d d i jy3k sk s3.15642P10 , a s140,i j 0d
y4k s2.42194P10 ; a s12.6269,d d
as0.9 b s56.6904d
2 g s0.00012
3 g s0.0042
4 g s0.331
5 g s0.6651
6 Cs07 Cs0.48 qs170,9479 qs1,290,534
y610 p sp s2.6P10i jy511 p sp s6.2P10i j
12 k sk s0i jy713 p s7P10d
y514 p s6.8P10dy615 k s1P10d
16 k s31d
17 as0.618 as1.019 T s54i
20 T s200i
21 T s4d
22 T s20d
23 a sa s00 i 0 j
24 a sa s20000 i 0 j
25 a sa s8.0116i j
26 a sa s11.2182i j
27 b sb s0.001i j
28 b sb s10.8845i j
29 a s980d
30 a s4460d
31 a s12230d
32 a s0d
33 a s18d
34 a s19.587d
35 b s25.3699d
36 b s31d
37 b s100d
Ž . Ž .scenarios 8 through 18 , c total time and timeŽ .allocation parameters scenarios 19 through 22 , and
Ž . Žd sales response function parameters scenarios 23.through 37 . It is important to note that changes in
compensation and markup parameters can be under-taken without any extraneous investment on the part
of the network marketing firm, while changing theother parameters is likely to require purposeful in-
Žvestments on the part of management e.g., investingin greater ‘brand equity’ could increase the attrac-tiveness of the network, thus increasing the innova-tion parameters, but this is likely to cost money to

( )A.T. Coughlan, K. Graysonr Intern. J. of Research in Marketing 15 1998 401–426 415
.accomplish . Thus, as we discuss the sensitivity ofthe model to these changes in parameters, we willemphasize where appropriate that investment is nec-essary and that this investment must be sufficientlyinexpensive to make the resulting parameter changeprofitable on a net basis.
3.3.1. Changes in compensation and markup param-( )eters scenarios 2 through 7
Here, we investigate the effects on network per-formance of changes in parameters g , g , and C .2 1
Recollect that their baseline values are 0.00223494,0.59, and 0.325, respectively. Summary informationon these effects is presented in section A of Table 9.Overall, the analysis shows that:1. A more concave commission rate function causes
i to spend more time selling and less recruiting,and results in lower income for i as well as lowerprofits for the NMO.
2. Increasing the maximum achievable commissioncauses i to spend more time recruiting and lessselling, resulting in a larger network and a chang-ing impact on NMO profits.
3. Increasing the markup available causes i to spendmore time selling, increasing i’s income, anddrastically reducing the NMO’s profitability.First consider changes in g , the parameter affect-2
ing the degree of concavity of the commission ratefunction. Positive values of g generate positive2
amounts of both selling and recruiting time, so wechoose g s0.0001 to represent a minimum value of2
g . Values of g greater than 0.004, by contrast,2 2
cause i to spend all her time selling. Behavior of iŽ .for g in the interval 0.0001, 0.004 lies between2
the levels of actions taken at the two boundarypoints. For comparison purposes, the values of g in2
our sample of firms range from 0.000892574 up to0.0693147, although most lie in the interval whoseboundaries we examine here. 18
18 Remember that other firms’ values of g outside the range2� 40.00223494, 0.004 do not necessarily imply that either no sellingor no recruiting takes place at these firms, since the values ofother model parameters are also obviously different in those cases.The data range of g is nevertheless indicative of the degree of2
curvature of NMO commission plans. The same comment isrelevant for all the parameter changes examined below.
Higher values of g cause any distributor’s2
group-volume commission rate to increase faster withŽgroup volume increases albeit still to the same
.asymptotic maximum of 59% . This has two effectson distributor i’s actions: first, it causes i’s ownincome to rise faster with her own group volume;and second, it causes her net commission incomeearned on downline distributors to fall, because theirincome also rises faster with group volume. The
Ž .results in Table 9 A are consistent with these twoeffects. The higher value of g in scenario 3 causes2
distributor i to spend more time selling and lessrecruiting, because of the diminished net commis-sions available on downline volumes. Distributor i’sincome also falls, again because of both lower netcommission earnings and because of the resulting
Žlower recruiting effort and smaller downline net-.work size . Because i, a key distributor in the net-
work, has less incentive to recruit, the entire networkgrows much more slowly and high values of g2
cause the NMO firm to lose the majority of itsprofits.
Ž .Scenarios 4 and 5 in Table 9 A show the effectŽof changes in g the maximum achievable commis-1
.sion rate on group volume on network activities. Forany value of g less than 33%, distributor i chooses1
to spend all her time selling. As all values of g1
greater than 0.33 generate positive amounts of bothselling and recruiting in the network, we examineg s0.665 as our maximum value—because it would1
lead to a profit margin for the NMO of just 1% atŽmaximum commission levels i.e., 100% minus
.66.5% minus 32.5%, the value of C for this firm .Again for comparison purposes, values of g gener-1
ated in our sample range from 8% up to 75%.As g increases, distributor i’s time spent selling1
decreases. This is because higher values of g cause1
net commissions on downline distributor sales to bemore attractive to distributor i. The number of dis-tributors ever recruited into the network thereforeincreases with g . The effect on profitability of1
increasing g is non-monotonic, because of multiple1
effects on the system. First, a higher g lowers the1
NMO’s own profit margin on every sale. But on theother hand, increases in g increase all distributors’1
recruiting incentives, causing the network to growmuch faster and generate significant sales increases;this has an upward effect on profitability. The com-
( )A.T. Coughlan, K. Graysonr Intern. J. of Research in Marketing 15 1998 401–426416
Tab
le9
Num
eric
alan
alys
isof
the
mod
el
Run
no.
Cha
nge
from
Ran
geof
tim
esp
ent
No.
ofN
o.of
No.
ofD
PV
ofD
PV
ofD
PV
ofŽ.
base
line
sell
ing
hpe
riod
sre
crui
tsov
erre
crui
tsi’
sin
com
eto
tal
netw
ork
prof
itŽ
.Ž
.Ž
.m
odel
ofne
w50
-per
iod
acti
vein
50pe
riod
ssa
les
50pe
riod
s50
peri
ods
recr
uiti
ngho
rizo
npe
riod
50
1N
rA
53.0
2–
32.2
0in
2319
8,35
210
,044
US
$531
,791
US
$70,
244,
600
US
$5,9
70,7
90pe
riod
s1
–23
;61
afte
rŽ
.A
Com
pens
atio
nan
dm
arku
ppa
ram
eter
chan
ges
2g
s0.
0001
45.3
5–
28.3
911
218,
808
3159
US
$1,3
18,4
30U
S$2
38,0
40,0
00U
S$2
0,23
4,50
02
inpe
riod
s1
–11
;61
afte
r3
gs
0.00
460
.62
inpe
riod
1;1
144
US
$505
,061
US
$1,1
09,6
00U
S$9
4,31
62
61af
ter
4g
s0.
3360
.55
inpe
riod
1;1
144
US
$361
,541
US
$1,1
09,5
30U
S$3
82,7
881
61af
ter
5g
s0.
665
51.8
6–
31.4
7in
1320
0,97
434
88U
S$5
69,3
92U
S$1
80,8
43,0
00U
S$1
,808
,430
1
peri
ods
1–
13;
61af
ter
6C
s0
41.7
1–
26.1
8in
1119
9,13
228
66U
S$3
46,1
97U
S$2
18,7
27,0
00U
S$8
9,67
8,20
0pe
riod
s1
–11
;61
afte
r7
Cs
0.4
55.3
3–
52.1
2in
5050
792
US
$578
,336
US
$1,2
61,7
70U
S$1
2,61
8pe
riod
s1
–50
Ž.
BR
ecru
itin
gpa
ram
eter
chan
ges
8q
s17
0,94
760
.99
inpe
riod
1;1
114
US
$505
,099
US
$1,0
99,0
50U
S$9
3,41
961
afte
r9
qs
1,29
0,53
47.
90in
peri
od1;
0.1
in4
1,26
6,02
988
82U
S$4
49,7
66U
S$2
,684
,870
,000
US
$228
,214
,000
peri
ods
2–
4;61
afte
ry
610
ps
ps
2.6P
1060
.08
inpe
riod
1;1
125
US
$505
,832
US
$1,1
01,8
90U
S$9
3,66
1i
j
61af
ter
y5
11p
sp
s6.
2P10
7.95
inpe
riod
1;16
229,
803
2505
US
$1,3
68,2
10U
S$1
65,3
40,0
00U
S$1
4,05
3,90
0i
j
0.1
inpe
riod
s2
–3;
risi
ngto
30.1
2in
peri
od16
;61
afte
r12
ks
ks
053
.02
–32
.30
inpe
riod
s24
192,
088
10,8
05U
S$5
28,5
82U
S$6
1,47
1,40
0U
S$5
,225
,070
ij
1–
24;
61af
ter
y7
13p
s7P
1059
.92
–52
.24
inpe
riod
s50
498
92U
S$5
35,7
09U
S$1
,255
,250
US
$106
,696
dŽ
.1
–50
fluc
tuat
ing
y5
14p
s6.
8P10
7.97
inpe
riod
1;0.
1in
320
8,09
513
20U
S$4
30,9
48U
S$4
87,2
61,0
00U
S$4
1,41
7,20
0d
peri
ods
2–
3;61
afte
ry
615
ks
1P10
53.0
3–
50.5
1in
peri
ods
5060
611
2U
S$5
39,1
96U
S$1
,261
,510
US
$107
,228
dŽ
.1
–50
fluc
tuat
ing
16k
s31
7.96
inpe
riod
1;0.
1in
322
6,29
913
92U
S$4
28,8
83U
S$5
21,8
15,0
00U
S$4
4,35
4,30
0d
peri
ods
2–
3;61
afte
r17
as
0.6
60.8
8in
peri
od1;
114
1U
S$5
05,0
86U
S$1
,080
,450
US
$91,
839
61af
ter

( )A.T. Coughlan, K. Graysonr Intern. J. of Research in Marketing 15 1998 401–426 417
18a
s1.
050
.97
–34
.10
inpe
riod
s12
224,
342
224,
342
US
$521
,545
US
$518
,517
,000
US
$44,
073,
900
1–
12;
61af
ter
Ž.
CT
otal
tim
epa
ram
eter
chan
ges
19T
s54
53.0
2in
peri
od1;
115
5U
S$4
97,3
34U
S$1
,103
,230
US
$93,
774
i
54af
ter
20T
s20
053
.02
–32
.43
inpe
riod
s7
223,
821
2075
US
$668
,192
US
$351
,650
,000
US
$29,
890,
300
i
1–
7;20
0af
ter
21T
s4
60.6
5in
peri
od1;
114
4U
S$5
05,0
64U
S$1
,070
,690
US
$91,
008
d
61af
ter
22T
s20
48.1
6in
peri
od1;
123
8U
S$5
04,6
32U
S$2
,958
,120
US
$251
,440
d
61af
ter
Ž.
DSa
les
resp
onse
func
tion
para
met
erch
ange
s23
as
as
053
.02
–32
.20
inpe
riod
s23
198,
352
10,0
44U
S$5
28,9
97U
S$7
0,23
8,50
0U
S$5
,970
,270
0i
0j
1–
23;
61af
ter
24a
sa
s20
0053
.02
–32
.20
inpe
riod
s23
198,
352
10,0
44U
S$5
48,9
55U
S$7
0,28
2,10
0U
S$5
,973
,980
0i
0j
1–
23;
61af
ter
25a
sa
s8.
0116
7.90
inpe
riod
1;18
233,
770
3334
US
$91,
305
US
$134
,037
,000
US
$11,
393,
200
ij
0.1
inpe
riod
s2
–7;
risi
ngto
29.5
4in
peri
od18
;61
afte
r26
as
as
11.2
182
60.9
9in
peri
od1;
114
4U
S$6
54,6
39U
S$1
,423
,420
US
$120
,991
ij
61af
ter
27b
sb
s0.
001
0.64
inpe
riod
1;0.
1in
722
9,64
320
88U
S$6
50,0
43U
S$3
58,3
40,0
00U
S$3
0,45
8,90
0i
j
peri
ods
2–
7;61
afte
r28
bs
bs
10.8
845
60.9
9in
peri
od1;
114
4U
S$4
81,8
99U
S$1
,047
,070
US
$89,
001
ij
61af
ter
29a
s98
60.9
7–
51.4
0in
peri
ods
5058
111
2U
S$5
34,5
20U
S$1
,228
,810
US
$104
,449
0dŽ
.1
–50
fluc
tuat
ing
30a
s44
641
.01
–26
.09
inpe
riod
s11
191,
513
2754
US
$507
,170
US
$338
,409
,000
US
$28,
764,
800
0d
1–
11;
61af
ter
31a
s12
2360
.96
inpe
riod
1;1
144
US
$505
,095
US
$1,2
00,9
00U
S$1
02,0
770d
61af
ter
32a
s0
53.1
7in
peri
od1;
119
8U
S$5
06,1
88U
S$1
,072
,750
US
$91,
184
d
61af
ter
33a
s18
41.4
9in
peri
od1;
127
8U
S$5
03,6
67U
S$1
4,56
4,90
0U
S$1
,238
,020
d
61af
ter
34a
s19
.587
60.9
9in
peri
od1;
114
4U
S$5
05,0
98U
S$4
2,39
0,40
0U
S$3
,603
,180
d
61af
ter
35b
s25
.369
960
.99
inpe
riod
1;1
144
US
$505
,098
US
$2,3
58,4
00U
S$2
00,4
64d
61af
ter
36b
s31
41.0
1in
peri
od1;
128
8U
S$5
05,6
43U
S$2
,244
,170
US
$190
,754
d
61af
ter
37b
s10
053
.17
inpe
riod
1;1
199
US
$506
,226
US
$1,0
73,1
20U
S$9
1,21
5d
61af
ter
( )A.T. Coughlan, K. Graysonr Intern. J. of Research in Marketing 15 1998 401–426418
parison of scenarios 1, 4, and 5 suggests that it ismost profitable to aim for an intermediate level ofg , even though this implies lower than maximum1
sales levels. Attrition takes a further toll as g1
increases: quick early network growth gives the sys-tem ample opportunity to lose distributors as timegoes on.
ŽAll values of C the wholesale-to-retail markup.on personal volume sales that generate positiveŽ .profit margins for the NMO i.e., from 0 to 0.4 also
produce both selling and recruiting behavior in theŽ .network. Scenarios 6 and 7 in Table 9 A therefore
show these two endpoints of the spectrum, with ourbase case scenario 1 using Cs0.325. Other percent-age markups found in our data range from 20% to100%.
The results show that time spent selling increaseswith C . The intuition is clear: the markup is earnedonly on personal volume sold, not on all of a distrib-utor’s group volume; thus, a higher C leads to agreater emphasis on selling over recruiting. Networkgrowth also slows as C increases, again due to theincreased personal sales incentive relative to theincentive to recruit. Increases in C also increasedistributor i’s income, and drastically reduce theNMO’s profitability. Profitability declines both be-cause per-unit profit margins to the NMO fall as C
rises, and because there are fewer distributors in thenetwork at any given point in time to sell andgenerate profits. Thus, it appears that lower values ofthe markup variable, C , are optimal from the net-work marketing firm’s point of view. 19
In sum, the above analyses show us that compen-Ž .sation changes that induce a later network matura-
Ž .tion or b greater payouts per dollar sold are ingeneral unprofitable to the network marketing firmusing a unilevel plan. It is important to preserveenough difference between an upline’s and a down-line’s commission rates, in order to preserve theincentive for the upline to recruit at all. Further,
19 Of course, this statement holds constant a distributor’s funda-mental incentive to join the network at all, as well as her totaltime allocation once she joins. If swings in C are great enough,we might see these more fundamental factors enter into play. Forthe purposes of this analysis, however, we assume that suchchanges are small enough not to have a major effect on theseactions.
attrition is greater, the faster and earlier the networkgrows; conversely, slowly-growing networks losefewer distributors on a cumulative percentage basisover the 50-period horizon.
(3.3.2. Changes in recruiting parameters scenarios 8)through 18
In these model runs, we investigate the effect ofŽ .steady-state network size q , innovation effects for i
Ž . Žand j p and p , imitation effects for i and j ki j i.and k , innovation and imitation effects for down-j
Ž .lines p and k , respectively , and attrition effectsd dŽ .a on distributor i’s time allocation, networkgrowth, and network profitability. Results of model
Ž .runs are summarized in Table 9 B . Our key findingsare:1. Time to reach all potential network recruits, a
negative correlate of profitability, is decreased forlarger steady-state network sizes, for larger inno-vation parameters for any distributors, and forlarger imitation parameters for downline distribu-tors.
2. Distributor i’s incentive to spend time recruitingincreases with increases in steady-state networksizes, with increases in its own or its downlines’innovation parameters, and with increases in therate of retention of new distributors.
3. Distributor i’s income rises and then falls withincreases in steady-state network size, and risesmonotonically with increases in the innovationparameter, and with decreases in downlines’ inno-vation or imitation parameters; but there is virtu-ally no effect on i’s income when i’s imitationparameter increases.
4. Total percentage attrition over the 50-period hori-Žzon is greater, the faster the network grows but
because of the positive profitability implicationsof quick network growth, attrition may not be asbig a problem for network marketers as has been
.previously thought .5. Profitability is positively affected by increases in
steady-state network size, increases in any of thedistributors’ innovation parameters, increases indownlines’ imitation rate parameters, and an in-crease in the rate of retention of distributors.
ŽThe steady-state size of the network parameter.q has a strong effect on distributor i’s time alloca-
tion, as can be seen by comparing scenarios 1, 8, and
( )A.T. Coughlan, K. Graysonr Intern. J. of Research in Marketing 15 1998 401–426 419
9 in Table 9. We find that, for other parameters heldat their baseline levels, a q value less than 170,947causes distributor i to allocate all her time to selling,while a level greater than 1,290,534 causes i tospend all her time recruiting. Scenarios 8 and 9 thuspresent results for these two boundary values. Forcomparison, the q values in our sample range from31,000 to 1,000,000, with a mean of 411,069 and amedian of 385,400.
The positive relationship between q and timespent recruiting reflects the greater ease of attractingnew downlines from a larger pool. Distributor i’sincome first increases, then decreases, with increasesin q, reflecting two conflicting effects: first, theincreased ability to recruit large numbers of down-lines, from all of whom i makes net commissions;and second, the quicker achievement of maximum
Žcommissions of those downlines implying lower net.commissions for i . Unambiguous, however, is the
increase in both NMO sales and profits as q in-creases: more recruiting potential naturally leads tohigher sales and profits, even though accompaniedby a greater rate of attrition over the 50-periodhorizon. Most interesting, however, is the negativerelationship between q and time to maximum cumu-lative network penetration: it takes only four periodsto exhaust network potential when q is at its maxi-mum level, while too small a value of q preventsmaximum penetration of network potential. Thisseemingly counterintuitive result is due to the greatersize of the innovation effect in the recruiting func-tion. The increase in the innovation term counterbal-ances the greater recruiting task to create the abilityto recruit large numbers of distributors relativelyquickly. However, while larger ultimate networksizes are clearly attractive to all in an NMO, the firmis likely to have to invest in marketing activitiesŽ .e.g., brand equity, product-line expansion, etc. toachieve a larger cumulative market penetration level.This is unlike the analyses above, where we contem-plate only compensation changes, which require a
Žmuch smaller investment to implement i.e., spend-.ing on internal marketing . These costs must be
subtracted from the profit gains to get a true measureof the incremental benefit of investing in largernetworks. Nevertheless, the analysis suggests that itmight be useful for the NMO to consider suchinvestments.
Scenarios 10 and 11 show how changes in theinnovation parameters for distributors i and j, p si
p , influence network activity. Values of p sp lessj i jy6 Ž .than 2.6P10 scenario 10 cause distributor i to
spend all her time selling, because the innovationeffect is so low that recruiting activity is globallymore unproductive than selling activity. Conversely,
y5 Žvalues of p sp greater than 6.2P10 scenarioi j.11 cause distributor i to spend all her time recruit-
ing. For comparison, the values of p sp in ouri j
sample range from 6.79496P10y8 up to 1.29049P
10y5.Distributor i’s income rises as p sp rises. Thei j
most noticeable effect of increasing innovation ef-fects, however, is on the time it takes for the networkto reach steady-state size: as p sp increases, thei j
Žsteady state is reached earlier and earlier and hence.cumulative attrition percentages are also greater . As
we have seen above, faster network growth is gener-ally more profitable to the firm, and that observationis borne out here. Of course, this profit increase mustbe compared with any cost of achieving a higherinnovation rate. The firm might need to make invest-ments in awareness of the network, for example, byspending money on advertising above and beyondthe distributors’ personal recruiting efforts. Only ifsuch investments cost less than the incremental profitgain are they worthwhile.
We next examine variations in k sk , the imita-i j
tion effect for distributors i and j. Only one varianton the baseline scenario is presented, where k ski j
s0. This is because the imitation effect has a verysmall influence on distributors i and j’s behaviors.For eÕery value of k sk , given the other values ini j
the model, period-one time allocation is identical tothat in the baseline scenario. Among the values ofk sk fitted for the firms in our sample, our focali j
firm’s value of 0.00315624 was the maximum, and0.0000901833 was the minimum. 20
20 Some respondents’ data actually generated negative values ofk s k . This would intuitively imply increasing returns to recruit-i j
ing time, rather than a more plausible decreasing returns situation.We suspect that these firms were facing very high growth rates intheir networks at the time, and reflected this in their data. How-ever, negative values of k s k are not reasonable for modelingi j
long-term growth of such a network, and we therefore did notinclude negative values in our sensitivity analyses.
( )A.T. Coughlan, K. Graysonr Intern. J. of Research in Marketing 15 1998 401–426420
A comparison of scenarios 1 and 12 shows onlymoderate variation in behavior due to differences ink sk . Time spent selling by distributor i is ini j
virtually the same range; maximum cumulative dis-tributor recruitment takes just one period longer thanin the base case, and attrition rates are almost identi-cal; distributor i’s income is very similar, and net-work profitability varies by less than US$800,000.Thus, it appears that investing in changes in theimitation effect carry much less ‘punch’ than wouldinvestments in the innovation effect.
We now turn from a focus on distributors i and jto a focus on their downline distributors’ recruitingparameters. Scenarios 13 and 14 show the effects ofchanges in the downlines’ innovation parameter, p .d
y7 Ž .Values of p less than 7P10 scenario 13 cause id
to spend all of her time selling, because downlinerecruiting is not productive enough; and values
y5 Ž .greater than 6.8P10 scenario 14 cause her toengage in full-time recruiting. The maximum valueof p fitted for a firm in our sample is 1.71397P10y5,d
Ž .while our baseline scenario 1 value of p isd
1.45743P10y6.As p increases in the three scenarios, the speedd
of recruiting and cumulative network growth bothincrease significantly. Intuitively, eÕery downline ismore capable of recruiting as p increases, and asd
the network grows through the recruitment of down-lines, this increased productivity exhibits itselfthroughout the whole network. The amount of timeallocated to selling by distributor i also declines asp increases. Distributor i’s income drops somewhatd
as p increases, because more successful downlinesd
increase their group-volume commission rates faster,diminishing the net commission earning opportuni-ties for distributor i. Finally, as one would expect,firm profitability increases as p rises, because thed
Žnumber of distributors is greater and hence sales.and network earnings are greater at any point in
time as p increases.d
In contrast to the effect of the imitation parameterfor upline distributors i and j, the effect of thedownline distributors’ imitation parameter, k , isd
Žquite strong shown by comparing scenarios 1, 15,.and 16 . We can once again attribute the difference
in strength of effect to the fact that changes in thisparameter apply to almost all of the distributors inthe network, not just to two. We ran the model for kd
y6 Ž . Žequal to 1P10 scenario 15 and to 31 scenario. Ž16 the baseline value in scenario 1 is 2.42194Py4 .10 . Distributor i’s time allocation does not change
for positive values of k smaller than that in scenariodŽ15 although for k s0, distributor i spends all herd
.time selling ; and for values of k greater than 31, id
spends all her time recruiting.ŽAs k increases i.e., word-of-mouth effects addd
.more recruiting power to downlines’ efforts , thenumber of periods to recruit all potential distributorsinto the network decreases, similarly to the effectthrough p . Distributor i’s income falls moderatelyd
as k increases, again because her downlines’ suc-d
cess at building their own networks diminishes netcommission income opportunities for i. And firmprofitability increases as k increases, to over US$44d
million for the higher value of k . For investments ind
either innovation effects or imitation effects fordownlines, the firm must weigh the cost versus theprofit benefits of the investments. As our profitabil-ity numbers show, part of what drives the optimalinvestment decision involves the number of distribu-tors whose performance will benefit from the invest-ment; our model shows much bigger profit gains forinvestments in downlines than for those in distribu-tors i and j, at least in part simply because there aremany more downlines in the network.
Changes in the retention rate parameter, a , alsohave a strong impact on NMO sales and profitability.
Ž .For a less than 0.6 scenario 17 , recruiting is notattractive for distributor i because too many of herrecruits drop out of the network; for all values of a
Žup to and including 1.0 no attrition at all, as in.scenario 18 , i chooses to split her time between
selling and recruiting until new recruiting opportuni-ties in the NMO have been exhausted.
Both sales and profitability increase strongly as a
increases, because new recruits have a greaterpropensity to stay with the network. Interestingly,however, distributor i’s income first increases as a
Ž .increases i.e., as the retention rate increases , butthen falls with further increases in the retention rate.This is because increases in a increase early word-of-mouth effects in recruiting. For lower levels of a ,such increases help i recruit new distributors fasterherself, increasing her net commissions on the down-line network. Past some point, however, higher net-
Ž .work retention rates i.e., higher a increase the

( )A.T. Coughlan, K. Graysonr Intern. J. of Research in Marketing 15 1998 401–426 421
amount of competition facing i to recruit new dis-tributors and thus reduce i’s ability to earn netcommissions from downlines as the network ma-tures. But as the decline in i’s income is fairly slight,the NMO is advised to take all sensible steps tomaximize retention rates in order to maximize prof-itability.
(3.3.3. Changes in total time parameters scenarios)19 through 22
The total time spent by distributors on selling andrecruiting are investigated below. Results from modelruns varying these parameters are presented in TableŽ .9 C . Our results show the following.
1. Steady-state network size is reached more quickly,and sales and profitability are higher, the moretotal time is spent by i, and for intermediatelevels of total time spent by downlines.
2. Distributor i’s income is greater, the more totaltime i spends on network marketing activities,and for intermediate levels of total time spent bydownlines.
3. Distributor i’s absolute amount of time spentselling is roughly the same for low or high totaltime spent by i. This means that as i’s total timeincreases, the incremental time is spent essentiallyentirely on recruiting.We first look at varying the total time spent by
distributor i on combined selling and recruiting ac-tivities. Scenarios 1, 19, and 20 set T to 61, 54, andi
200, respectively. For total time less than 54 hoursper month, distributor i chooses to focus solely onselling. There is a large range of total time valueswhere early time allocation by distributor i is totallyinvariant. We thus capped our investigation at 200.Reported total time spent selling and recruiting permonth for top distributors ranges from 10 hours to350 hours, with a median of 70 hours and a mean of85 hours.
Increasing the total time spent by i greatly in-creases the speed of network growth: the networkfails to mature for T s54, takes 23 periods to do soi
for T s61, and takes only seven periods to do soi
when T s200. This is largely because as T in-i i
creases, the extra total time is being spent essentiallycompletely on recruiting. Greater time spent alsonaturally translates into higher income for distributor
Ži, with decreasing returns to greater time spent over
the 50-period horizon, distributor i makes an averageof US$184.20 per hour when T s54; US$174.36i
per hour when T s61; and US$66.82 per hour wheni.T s200 . Increased total time also increases thei
sales and profitability of the network marketing firm.Thus, both the distributor and the firm are better offif the distributor spends more time in total on net-work marketing activities.
We also investigate, in scenarios 21 and 22, vari-ous total time allocations for all the downlines in thenetwork. In our sample as a whole, average distribu-tors’ total time spent on selling and recruiting rangesfrom 1.5 hours to 80 hours per month, with a medianof 10 hours per month and a mean of 20 hours per
Žmonth. We find that both ‘too lazy’ i.e., T less thand. Ž .4 and ‘too industrious’ i.e., T greater than 20d
downlines cause i to sell full-time rather than recruit:the former because downlines do not work hardenough to generate sufficient net commission incometo be of interest, and the latter because downlines areso productive that they earn as high a group com-mission rate as i does, thus depriving i of netcommission income on their group volumes. Scenar-ios 21 and 22 thus look at these two limiting valuesof T .d
Not only does i’s time spent selling first fall, thenrise again, as T increases; i’s income first rises,d
then falls, at T increases also. Cumulative networkd
growth, sales, and profitability also first rise, thenfall, as T increases, driven by the optimal timed
allocations of distributors in the network. The NMOfirm has the same incentive as i does, given thecompensation plan in place: to recruit downlineswho will work appropriately hard, but not so hard asto prevent the upline from making any net commis-sions from their sales.
3.3.4. Changes in sales response function parame-( )ters scenarios 23 through 37
In this section, we examine how changes in thesales response function parameters of distributor iand the downlines affect i’s incentives for behavior,as well as network growth and profitability. TableŽ .9 D summarizes the results of these model runs. A
summary of the results indicates the following.1. The network’s growth rate is invariant to changes
in a sa , but is faster when the values of0 i 0 j

( )A.T. Coughlan, K. Graysonr Intern. J. of Research in Marketing 15 1998 401–426422
a sa or b sb are lower. The network growsi j i j
fastest for intermediate levels of a , a , or b .0d d d
2. NMO profitability is almost invariant to changesin a sa , but increases as the values of either0 i 0 j
a sa or b sb decrease, because these causei j i j
distributor i to allocate more time to recruiting,causing the network in turn to grow more quickly.Profitability is highest for intermediate levels ofa , a , and b .0d d d
3. Distributor i’s income increases with a sa or0 i 0 j
a sa , or with decreases in b sb . Distributori j i j
i’s income increases as a falls, and is highest0d
for intermediate levels of a or b .d d
We first consider changes in the parameters ofdistributor i’s and j’s sales response function: a s0 i
a , a sa , and b sb . Changes in a sa are0 j i j i j 0 i 0 j
essentially changes in the intercept term of the salesresponse function, and as such shift distributor i’sbehavior only when they imply differences in thegroup-volume commission rate that i faces. At theother parameter levels in our baseline model, no suchdifference is implied by changing a sa ; even0 i 0 j
when a sa s0, the number of hours spent sell-0 i 0 j
ing is still the same. Our baseline model sets a s0 i
a s280. Thus, for illustrative purposes, we also0 jŽ .examine a sa s0 scenario 23 and a sa s0 i 0 j 0 i 0 j
Ž .2000 scenario 24 . For comparison, the range ofa sa in our sample is 135 to 2131.5.0 i 0 j
There is no difference among scenarios 1, 23, and24 in the time allocations of distributor i, nor in the
Žnumber of periods to network maturity 23 in all.cases . Distributor i’s income does increase with
a sa , as does profitability, but the profit gains0 i 0 jŽare relatively modest less than US$4000 from sce-.nario 23 to scenario 24 . Thus, changes in i’s and
j’s sales response function intercept do not changenetwork growth patterns and only moderately changeprofitability; unless they are very low-cost to achieve,they are probably not profitable investments to make.
Increases in a sa increase the asymptote toi j
which sales converge as selling time approaches aninfinite number of hours. We find that, for otherparameters set to their baseline levels, any value ofa sa less than 8.0116 leads distributor i to spendi j
Žall her time on recruiting because selling has such a.low productivity , and any value of a sa greateri j
than 11.2182 leads i to focus entirely on selling anddo no recruiting. We therefore present in scenarios
25 and 26 these lower- and upper-bound values ofa sa , respectively. Values of a sa in other firmsi j i j
in our sample range from 6.53621 to 12.8823.Distributor i’s income increases with a sa .i j
However, distributor i’s diminished emphasis onrecruiting causes the network to mature in size more
Žslowly the maximum cumulative number of recruitsbeing reached in period 18 when a sa s8.0116,i j
but not until period 23 when a sa s10.9576 andi j.never when a sa s11.2182 , resulting in sloweri j
sales growth and lower profitability over the 50-period horizon. Thus, if the firm makes any purpose-ful investments in a sa , they should be to keep iti j
lower, rather than to raise it, because of the adverseeffect it has on incentives to grow the networkquickly.
The parameter b sb shapes the marginal salesi j
productivity of each hour spent selling by distributori: the lower it is, the higher are sales for any givenvalue of selling time. However, there is an additionalaspect to the effect of b sb , due to the multiplica-i j
tive relationship between it and s . This is that, fori t
Õery small values of b sb , distributor i’s incomei j
essentially is invariant with respect to changes inselling time. Thus, we find that for values of b sbi j
less than 0.001, distributor i optimally allocates allof her time to recruiting; and for values of b sbi j
greater than 10.8845, i sells full-time and does norecruiting. In the values between these two bound-aries, the amount of time spent selling by i increasesas b sb increases. We thus present results fori j
Ž .b sb s0.001 scenario 27 and b sb s10.8845i j i jŽ .scenario 28 . For comparison, other firms in oursample generated b s b values ranging fromi j
Ž6.26386 to 180.284 although almost all are well.below 100 in value .
Distributor i’s income, network sales, and net-work profitability all fall as b sb rises. Increasingi j
b sb also decreases the speed of network growth,i j
and stifles it for high enough values. Low values ofb sb are thus clearly the most attractive to alli j
actors in the NMO.Turning to the parameters of the downlines’ sales
response function, three different levels of a are0d
evaluated in addition to the baseline level of 140: 98Ž . Ž . Žscenario 29 , 446 scenario 30 , and 1223 scenario.31 . For values of a less than 98, the optimal0d
allocation rule for i is to spend all of her time

( )A.T. Coughlan, K. Graysonr Intern. J. of Research in Marketing 15 1998 401–426 423
selling; the amount of selling time drops steadilyuntil a s446; then it steadily rises again until, for0d
values of a greater than 1223, all time is again0d
spent selling. For reference, our data produces valuesof a ranging from 48 up to 688.0d
Distributor i’s income falls with higher and higherlevels of a . Intuitively, more productive downlines0d
make more income and hence enjoy higher group-volume commission rates, causing i’s net commis-sion income to fall on a per-dollar basis. Eventually,this effect causes distributor i to turn away fromrecruiting and back toward personal selling. Thisreversion to personal selling caps i’s effective earn-ing potential, because she stops recruiting new down-lines who may have lower group-volume commis-sion rates than more seasoned downlines do.
The NMO’s sales and profitability move inverselyto the amount of time i spends selling, becauseintensive selling comes at the expense of recruitingand total network growth. Thus, the NMO firm’sincentives are not totally aligned with those of dis-tributor i, who prefers less productive downlines.
The parameter a plays the same role in thed
downline distributor’s sales response function as ai
plays in that of distributor i: it affects the asymptoticlevel of sales achievable as selling effort reachesvery large levels. We find that, given our baseline
Žparameter values, even reducing a to zero scenariod.32 still preserves distributor i’s incentive to both
sell and recruit, so there is no ‘corner solution’ fortime allocation at the lower end of this parameter. As
Ž .a increases from 0 to 18 scenario 33 , i spends lessd
time selling and more recruiting; as a increasesdŽ .from 18 to 19.587 scenario 34 , i spends more time
selling and less recruiting, until for a greater thand
19.587, i sells full-time. This non-monotonicity re-flects the dual incentives generated by an increase ina : on the one hand, a higher a means more produc-d d
tive downlines from whom i can make more netcommissions. On the other hand, for a ‘too high,’d
downline group commission rates rival i’s own rate,thus decreasing the potential for net commissionearnings. For comparison, we found values of a ind
our data ranging from 4.44794 up to 17.4876.An intermediate value of a , such as our baselined
Ž .value of 12.6269 scenario 1 , generates the highestincome for i, NMO sales, and NMO profitability.Such a value not only generates balanced sales and
recruiting effort initially, but also over time to bringthe network to full fruition. Too high a value of ad
may make very early recruitment desirable, butquickly negates the recruitment incentive becausedownlines themselves grow their sales and networkstoo fast to provide net commission earnings potentialto an upline distributor. As above, we see here thatthe NMO must try to balance the attractiveness ofproductive downlines against the risk that they are soproductive as to generate no income potential fortheir upline sponsor.
ŽFinally, changes in b the shape parameter of thed.downline sales response function are investigated
Ž .through a comparison of scenarios 1 b s56.6904 ,dŽ . Ž . Ž .35 b s25.3699 , 36 b s31 , and 37 b s100 .d d d
From b s25.6399 to b s31, recruiting time in thed d
first period increases, but the incentive to recruitŽ .disappears thereafter. In the range 31, 100 , early
time allocations to selling increase, until all values ofb greater than 100 produce the same time allocationd
for i. We can compare these values with those in therest of our data; the minimum value of b found isd
1.02337, and the maximum is 166.355.As in the case of changes in a , here we also seed
that both distributor i and the NMO as a wholeprosper the most with an intermediate value for b .d
Such a value generates balanced growth and contin-ued recruiting as well as selling activity in the wholenetwork. Beyond some point, increases in b fail tod
have any effect on distributor i’s time allocationsand hence on the growth and profitability of theNMO.
3.3.5. Summary of sensitiÕity analysesThe effects of changes in model parameters on
firm profitability, time to reach steady-state networksize, focal distributor i’s income, and the proportionof i’s time spent selling are summarized in Table 10.The flavor of this table is similar to that of a table ofcomparative static results in an analytic model, al-though it must of course be remembered that thistable reflects results derived using one set of parame-ters as the baseline scenario.
Profitability comparisons between one parametricchange and another must be made with the recogni-tion that these figures are gross of any marketinginvestments necessary to effect them. Changing some
Ž .parameters e.g., compensation parameters is essen-

( )A.T. Coughlan, K. Graysonr Intern. J. of Research in Marketing 15 1998 401–426424
tially costless, but other parametric changes mayonly be achievable with considerable marketing mixexpenditures. It would therefore be inappropriate tomake conclusive statements about the relative desir-ability of increasing or decreasing one parameterversus another without access to investment costdata.
Nevertheless, the sensitivity analyses presentedabove generate many useful insights for both struc-turing compensation plans for maximal networkgrowth and profitability, as well as investing in moreproductive sales and recruiting functions. We cansummarize the following insights.1. Even attrition rates as low as 10% per period, as
our baseline scenario depicts, lead to a very se-vere loss of network size over time, especiallyunder conditions of explosive early growth. Thissuggests that maturing networks need to look forcreative ‘re-launch’ strategies, such as transna-tional expansion or product-line expansion, toexpand the potential pool of recruits.
2. Nevertheless, faster network growth, ceterisparibus, is profitable from the NMO firm’s pointof view. This can help explain why network
marketing firms are always emphasizing recruit-ing, particularly early in the network’s life.
3. Holding down distributor earnings can be profit-creating, as long as it does not stifle incentiÕes towork. We cannot state conclusively where theappropriate point on this tradeoff function lies,but recognize that the tradeoff is important.
4. Achievements that seem profit-enhancing on thesurface may in fact be profit-reducing if theyhamper quick network growth. Examples includeinvestments that increase the selling productivityof distributor i and thus draw her away fromrecruiting activities. A balance must be struck thatgenerates high sales while also stimulating quicknetwork growth.
5. On the other hand, investing in high sales perfor-mance can be a profit-enhancing strategy, even ifit stifles some upline distributors’ incentives torecruit, if it affects a large enough set of downlinedistributors. That is, the positive effect on salesperformance of the downlines may actually swampany negative effect on upline recruiting behavior.
6. Significant shifts in profitability are possiblethrough changes in the compensation plan, partic-
Table 10Directional effects of parametric changes on model performance
Effect of increase in Effect on:parameter Profitability Speedrintensity of Distributor i’s income % of time i spends selling
network growth
g y y y Æ2
g Æ, then y Æ Æ y1
C y y Æ Æ
q Æ Æ Æ, then y y
p sp Æ Æ Æ yi j
k sk Æ Æ Æ n.c.i j
p Æ Æ y yd
k Æ Æ y yd
a Æ Æ Æ, then y y
T Æ Æ Æ yi
T Æ, then y Æ, then y Æ, then y yd
a sa Æ n.c. Æ n.c.0 i 0 j
a sa y y Æ Æi j
b sb y y y Æi j
a Æ, then y y, then Æ y y, then Æ0d
a Æ, then y Æ, then y Æ, then y y, then Æd
b Æ, then y Æ, then y Æ, then y y, then Æd
n.c.sno change.

( )A.T. Coughlan, K. Graysonr Intern. J. of Research in Marketing 15 1998 401–426 425
ularly through changes in g , the curvature pa-2
rameter in the commission function. OptimizingNMO compensation involves a balancing of in-creasing incentives for sales productivity againstthe threat that one’s downlines too quickly reachthe same group commission level as the upline,therefore diminishing the upline’s net earningspotential. It is generally wise not to be too ‘stingy’with distributor compensation, because it is thekey to network growth and profitability.
7. Investing in a larger steady-state network sizeincreases profitability in two ways. First, it in-creases the pool of distributors generating sales atany point in time. But second, it has positiveeffects on the innovation term of the recruitingfunction, making recruiting time more productive,ceteris paribus—so that larger steady-state net-work sizes are actually associated with fasternetwork growth, not slower.
4. Summary, conclusions, and future research di-rections
Our model shows how an NMO’s network growth,distributor performance, and network profitabilitywill be affected by differences in compensation andother underlying market factors. Although these in-sights are indeed useful for understanding the uniquechallenges of salesforce management in NMOs, theyalso have relevance for any company that compen-sates employees or customers for capitalizing ontheir social networks. For example, some companiesgive their customers referral bonuses, and manyreward salespeople for developing new business. Tothe extent that these rewarded activities reflect theproperties of a diffusion function, our model is par-ticularly useful.
In this paper, we have used the model mainly todescribe the general effects that parametric changescan have on NMO and network performance. But itcan also be used prescriptively on the individual-firmlevel to make suggestions about profitable changesin compensation plans or investments in other para-metric changes. It can also be used as a forecastingtool with appropriate calibration on historical data ornetwork analogs.
The insights derived here also have relevance forretail productivity in retail formats other than NMOs.In particular, anywhere where retail salespeople havemultiple productive tasks to do, a model of this typeis a useful tool for understanding how to manage notonly the total productivity of a retail salesperson’stime, but the allocation of that time among compet-ing activities.
There are many avenues for future research in thearea. One involves examining the other major type ofcompensation plan currently used in network market-ing: the breakaway plan. Some of its implications fordistributor behavior may be quite different than thosefound here, and a similar modeling analysis will helpnetwork marketing retailers decide which plan bestfits their market and product situations.
Expanding our empirical data collection wouldincrease our knowledge of the variation in modelparameters in the network marketing world. This canbe done through further cross-sectional studies oralternatively through a more in-depth study of onefirm and all of its distributors. If we poll all thedistributors themselves instead of using single infor-mants, we are likely to increase the reliability of thedata on sales and recruiting response.
Network marketing carries negative connotationsin many marketplaces worldwide. This is because itis often incorrectly associated with deceptive‘pyramid schemes’, which frequently result in finan-cial ruin for participants and legal action against theinstigators. In contrast, true network marketing in-volves the development of a legitimate retail sellingand distribution network that grows via social net-works. Our analysis has examined the unique mar-ketplace tensions that an NMO executive must bal-ance in order to create and manage a compensationstructure that both motivates distributors and achievesthe company’s business goals. Our work also illus-trates that the successful management of an NMOdoes not require deception or fraudulence, but in-stead requires the standard managerial concerns forsalesperson satisfaction, company growth, and netprofitability.
Acknowledgements
The authors would like to thank Sachin Gupta,Peter Sattler, attendees at the Conference on Channel

( )A.T. Coughlan, K. Graysonr Intern. J. of Research in Marketing 15 1998 401–426426
Productivity in Mons, Belgium in 1996, seminarparticipants at Tel Aviv University and Yale Univer-sity, two anonymous reviewers, and Alain Bultez forhelpful comments and suggestions. Any errors oromissions remain the responsibility of the authors.
References
Anderson, E., 1985. The salesperson as outside agent or em-ployee: a transaction cost analysis. Marketing Science 4, 234–254.
Bass, F.M., 1969. A new product growth model for consumerdurables. Management Science 15, 215–227.
Biggart, N.W., 1989. Charismatic Capitalism. Univ. of ChicagoPress, Chicago.
Brodie, S., 1995. Sales force turnover in direct selling organisa-tions in the United Kingdom and France. Unpublished Mas-ters’ Dissertation, University of Keele, Staffordshire, UK.
Churchill, G.A., Ford, N.M., Walker Jr., O.C., 1985. Sales ForceManagement: Planning, Implementation, and Control, 2nd edn.Richard D. Irwin, Homewood, IL.
Coughlan, A.T., 1993. Salesforce compensation: a review ofŽ .MSrOR advances. In: Eliashberg, J., Lilien, G.L., Eds. ,
Handbook in Operations Research and Management Science,Vol. 5, Marketing. Elsevier, Amsterdam, Chapter 13.
Coughlan, A.T., Grayson, K., 1993. 1993 Multi-level marketingexecutives industry survey summary report. Unpublished re-port, Northwestern University, Evanston.
Coughlan, A.T., Sen, S.K., 1989. Salesforce compensation: The-ory and managerial implications. Marketing Science 8, 324–342.
Crosby, L.A., Stephens, N., 1987. Effects of relationship market-ing on satisfaction, retention, and prices in the life insuranceindustry. Journal of Marketing 24, 404–411.
Crosby, L.A., Evans, K.R., Cowles, D., 1990. Relationship qualityin services selling: an interpersonal influence perspective.Journal of Marketing 54, 68–81.
Direct Selling AssociationrUSA, 1995. 1995 Industry-WideGrowth and Outlook Survey. Direct Selling Association,Washington, DC.
Direct Selling AssociationrUK, 1996. The Direct Selling of Con-sumer Goods in the United Kingdom, 1996 Survey. DSArUK,London, UK.
Frenzen, J.K., Davis, H.L., 1990. Purchasing behavior in imbed-ded markets. Journal of Consumer Research 17, 1–12.
Grayson, K., 1996. Examining the embedded markets of networkŽ .marketing organizations. In: Iacobucci, D. Ed. , Networks in
Marketing. Sage, Thousand Oaks, CA, pp. 325–341.Hanssens, D.M., Parsons, L.J., 1993. Econometric and time-series
Ž .market response models. In: Eliashberg, J., Lilien, G.L. Eds. ,Handbook in Operations Research and Management Science,Vol. 5, Marketing. Elsevier, Amsterdam, Chapter 9.
Lal, R., Staelin, R., 1986. Salesforce compensation plans inenvironments with asymmetric information. Marketing Sci-ence 5, 179–198.
Weiss, A.M., Anderson, E., 1992. Converting from independent toemployee salesforces: the role of perceived switching costs.Journal of Marketing Research 29, 101–115.