Network-Level Pavement Management in New York State: A...
9
TRANSPORTATION RESEARCH RECORD 1344 57 Network-Level Pavement Management in New York State: A Goal-Oriented Approach DONALD N. GEOFFROY AND JOHN J. SHUFON The New York State Department of Transportation practices pavement management at two distinct levels: network, which deals with program development, and project, which addresses treatment selection. This two-tiered approach works well in New York, where decisions on project and treatment selection are made in 11 regional offices given policy guidance from the main office in Albany. The department's network-level pavement man- agement system is described. The system is goal-driven and is designed to operate in a decentralized decision-making environ- ment. Each step in the network level process is discussed-from needs estimating through goal setting and performance monitor- ing . In addition, an improved pavement condition survey meth- odology is introduced. The survey involves the use of photo- graphic scales of pavement condition and the collection of specific distress symptoms called dominant distresses. Pavement man- agement systems must be tailored to the organizational structure of the implementing agency. Although the decision-making pro- cesses of pavement management systems are generally not trans- portable, the principles of a goal-oriented approach to managing pavements are, and they should be considered by highway agen- cies that are developing a network-level pavement management system . The highway network in New York State is aging. More than a third of the 15,000-centerline-mi state highway system was constructed during the Interstate "big build" era, and many facilities are simultaneously reaching the end of their service lives. This problem has been exacerbated throughout the years by budget cutbacks for labor-intensive, low-profile preventive maintenance activities such as crack sealing and drainage- ditch cleaning. The challenge facing the New York State Department of Transportation (NYSDOT) is to repair the thousands of miles of highways concurrently falling into poor condition while properly maintaining the rest of the network to avert a future infrastructure crisis. All this must be accom- plished in an environment of fiscal austerity. Recognizing the need for better information and a system- atic process to help department management make judicious decisions on funding levels, project priorities, and pavement repair strategies and timing, Commissioner Franklin E. White in July 1987 appointed a pavement management steering com- mittee. The committee was charged with recommending the appropriate direction for the department to follow in approaching the long-term goal of a comprehensive, department-wide system for managing the condition and use- Pavement Management Section , Office of Operations, New York State Department of Transportation, Building 7A, Room 501A, Al- bany, N.Y. 12232. fulness of, and expenditures for, the pavement structures of the state highway system. In January 1989 the steering committee released a com- prehensive plan that provided the course of action necessary to achieve the commissioner's strategic goal. The plan, which consists of 23 recommendations, addresses all aspects of man- aging pavements from planning through design and construc- tion. Central to its theme is the clear distinction between network- and project-level pavement management and the data requirements associated with each. The purpose of this paper is to review the progress made in implementing a network-level pavement management system (PMS) in New York State. The paper will introduce a newly developed net- work pavement condition survey and demonstrate how the condition data feed the department's goal-oriented capital programming. For the sake of completeness, the department's project-level PMS will also be briefly outlined. ORGANIZATIONAL STRUCTURE OF NYSDOT It is well documented that to be successful, a PMS must be tailored to the organizational structure, culture, and decision- making process of the implementing agency (1-5). Pavement management systems are generally not transportable: what works for one agency may not work for another. To under- stand network-level pavement management in New York State, one must understand how the department is organized and how decisions are made in developing a program of pavement projects. NYSDOT is a large organization responsible for managing a complex highway system that accommodates more than 50 billion vehicle-mi of travel a year. The department consists of a central (or main) office and 11 regional offices dispersed throughout the state. The main office is divided into functional divisions (e.g., Planning, Design, Technical Services, High- way Maintenance, etc.), each headed by a division director who reports directly to executive management. The main of- fice is responsible for developing policy, establishing goals, allocating funds to the regions, and monitoring regional ac- complishments. In addition, the main office is responsible for preparing the department's annual budget and selling the budget to oversight organizations such as the governor's budget di- vision and the legislature. The budgeting process in New York State is complex. Funding is provided to the department in two separate allocations: (a) operating funds, which finance salaries, equipment, and some materials for pavement repairs
Transcript of Network-Level Pavement Management in New York State: A...

TRANSPORTATION RESEARCH RECORD 1344 57
Network-Level Pavement Management in New York State: A Goal-Oriented Approach
DONALD N. GEOFFROY AND JOHN J. SHUFON
The New York State Department of Transportation practices pavement management at two distinct levels: network, which deals with program development, and project, which addresses treatment selection. This two-tiered approach works well in New York, where decisions on project and treatment selection are made in 11 regional offices given policy guidance from the main office in Albany. The department's network-level pavement management system is described. The system is goal-driven and is designed to operate in a decentralized decision-making environment. Each step in the network level process is discussed-from needs estimating through goal setting and performance monitoring. In addition, an improved pavement condition survey methodology is introduced. The survey involves the use of photographic scales of pavement condition and the collection of specific distress symptoms called dominant distresses. Pavement management systems must be tailored to the organizational structure of the implementing agency. Although the decision-making processes of pavement management systems are generally not transportable, the principles of a goal-oriented approach to managing pavements are, and they should be considered by highway agencies that are developing a network-level pavement management system.
The highway network in New York State is aging. More than a third of the 15,000-centerline-mi state highway system was constructed during the Interstate "big build" era, and many facilities are simultaneously reaching the end of their service lives. This problem has been exacerbated throughout the years by budget cutbacks for labor-intensive, low-profile preventive maintenance activities such as crack sealing and drainageditch cleaning. The challenge facing the New York State Department of Transportation (NYSDOT) is to repair the thousands of miles of highways concurrently falling into poor condition while properly maintaining the rest of the network to avert a future infrastructure crisis. All this must be accomplished in an environment of fiscal austerity.
Recognizing the need for better information and a systematic process to help department management make judicious decisions on funding levels, project priorities, and pavement repair strategies and timing, Commissioner Franklin E. White in July 1987 appointed a pavement management steering committee. The committee was charged with recommending the appropriate direction for the department to follow in approaching the long-term goal of a comprehensive, department-wide system for managing the condition and use-
Pavement Management Section, Office of Operations, New York State Department of Transportation, Building 7A, Room 501A, Albany, N.Y. 12232.
fulness of, and expenditures for, the pavement structures of the state highway system.
In January 1989 the steering committee released a comprehensive plan that provided the course of action necessary to achieve the commissioner's strategic goal. The plan, which consists of 23 recommendations, addresses all aspects of managing pavements from planning through design and construction . Central to its theme is the clear distinction between network- and project-level pavement management and the data requirements associated with each. The purpose of this paper is to review the progress made in implementing a network-level pavement management system (PMS) in New York State. The paper will introduce a newly developed network pavement condition survey and demonstrate how the condition data feed the department's goal-oriented capital programming. For the sake of completeness, the department's project-level PMS will also be briefly outlined.
ORGANIZATIONAL STRUCTURE OF NYSDOT
It is well documented that to be successful, a PMS must be tailored to the organizational structure, culture, and decisionmaking process of the implementing agency (1-5). Pavement management systems are generally not transportable: what works for one agency may not work for another. To understand network-level pavement management in New York State, one must understand how the department is organized and how decisions are made in developing a program of pavement projects.
NYSDOT is a large organization responsible for managing a complex highway system that accommodates more than 50 billion vehicle-mi of travel a year. The department consists of a central (or main) office and 11 regional offices dispersed throughout the state. The main office is divided into functional divisions (e.g., Planning, Design, Technical Services, Highway Maintenance, etc.), each headed by a division director who reports directly to executive management. The main office is responsible for developing policy, establishing goals, allocating funds to the regions, and monitoring regional accomplishments. In addition, the main office is responsible for preparing the department's annual budget and selling the budget to oversight organizations such as the governor's budget division and the legislature. The budgeting process in New York State is complex. Funding is provided to the department in two separate allocations: (a) operating funds, which finance salaries, equipment, and some materials for pavement repairs

58
to be done by agency forces, and (b) a capital allocation, which funds work to be done through competitively bid contracts. Resources are allocated to each region in the same manner.
The organizational structure of each regional office parallels that of the main office. Regional group directors report to the regional director (RD) and receive program guidance from both the RD and the main office division director of the functional area. The regions are responsible for developing a 5-year program of capital and maintenance projects for pavements and bridges; preparing plans, specifications, and estimates; and supervising the construction and maintenance of their highway systems.
Everyday pavement maintenance activities are performed by highway maintenance personnel in 65 field offices called residencies, each headed by a licensed professional engineer. Residency boundaries are generally coterminous with county lines. The resident engineers (REs), who report to the regional group director for highway maintenance, serve as the department's first-line pavement managers. Their intimate knowledge of the highway systems under their auspices is invaluable to developing a program of pavement projects. The underlying precept of the department's network-level PMS is that massive amounts of data would need to be collected in order to replicate the firsthand knowledge of the RE. This is particularly true in New York State, where pavement age, traffic loadings, climate, soils, and terrain vary considerably among regions and sometimes even between adjacent residencies. Coupling the RE's highway system experience with technical tools at the network level is a major strength of the department's PMS. An overview of the system is presented.
OVERVIEW OF NETWORK-LEVEL SYSTEM
Pavement management at the network level deals with summary information about the entire highway network. As such, it involves policy and programming decisions frequently made by upper management (6). Figure 1 presents a flowchart of the NYSDOT network-level PMS. The system is goal-driven and is designed to operate in a decentralized decision-making environment where choices on which pavement sections to treat and when and how to treat them are made in the regions given policy and technical guidance from the main office. Data from the annual network pavement condition survey are used to monitor the general health of the highway network, to estima,te regional needs, to set goals, and to be input to the fund allocation process. Working within its allocation and given its pavement goal, each regional office develops a comprehensive 5-year program of pavement projects that integrates the spectrum of treatments from preventive maintenance through major rehabilitation.
Project lists and summary information are submitted to the main office, where the program is reviewed to ensure compliance with the pavement goals. Once approved, implementation begins for the first-year element of the program. The network survey data are used to measure the impact of program implementation on condition and to provide feedback for setting the next year's goals. It is important to understand that the output of the NYSDOT network-level system is a program of pavement projects with an estimate of project
NO
TRANSPORTATION RESEARCH RECORD 1344
NETWORK SURVEV
NEEDS ESTIMATING
(Tl'IEATMENT'S ANOCOST'S)
AU.OCATIONS
PROGRAM REVIEW
PROCESS
PROGRAM IMPLEMENTATION
PROJECT
L.EVa. PROCESS
FIGURE 1 NYSDOT network-level pavement management process.
scope and cost. Details about designing the specific engineering treatment based on least life-cycle costs are addressed as part of the project-level PMS. The rest of this paper describes each of the process boxes shown in Figure 1.
Network Pavement Condition Survey
Accurate and current pavement condition data are vital to sound pavement management. The amount and type of data collected depend primarily on the intended uses of the data in the management process. Pavement condition is often assessed by analyzing data on pavement distresses, roughness, structural adequacy, and friction. Clearly, collecting and processing these data for each highway link every year would be ideal. This is not possible, however, on large highway systems such as New York's without a very large expenditure of funds. Given the decentralized approach to managing pavements in New York, which builds on the firsthand knowledge and experience of the REs, the data-collection requirements for network-level activities are significantly less than many of the more traditional pavement management systems. Very
Geoffroy and Shufon
detailed data are collected only after a pavement section has been programmed in order to select the appropriate treatment. This two-tiered approach leads to efficient data collecting, processing, and reporting.
Since 1981, NYSDOT has used a moving-vehicle windshield survey to assess the pavement condition of the network. Data are collected by crews from the 11 regional offices trained to use NYSDOT's pavement condition survey methodology. The rating procedure involves carefully developed photographic scales in which photographs show the condition of pavements at various stages of deterioration rather than specific distresses. This procedure was designed to permit rapid and repeatable estimates of overall condition at a low cost. The development and use of photographic scales by NYSDOT has been well documented over the years (7-9).
In 1990, the network survey method was enhanced and implemented. The survey was modified to enable each highway section to be classified into one of five general treatment categories:
• Do nothing, • Preventive maintenance, • Corrective maintenance, •Rehabilitation, and • Major rehabilitation.
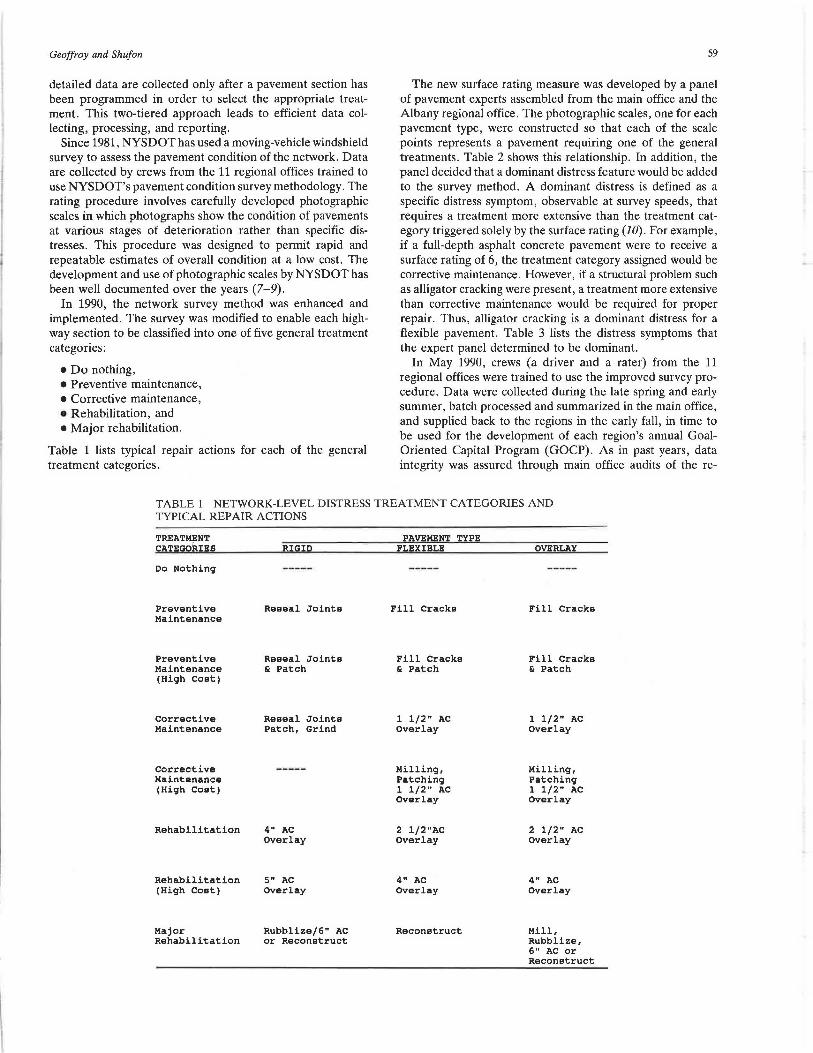
Table 1 lists typical repair actions for each of the general treatment categories.
59
The new surface rating measure was developed by a panel of pavement experts assembled from the main office and the Albany regional office. The photographic scales, one for each pavement type, were constructed so that each of the scale points represents a pavement requiring one of the general treatments. Table 2 shows this relationship. In addition, the panel decided that a dominant distress feature would be added to the survey method. A dominant distress is defined as a specific distress symptom, observable at survey speeds, that requires a treatment more extensive than the treatment category triggered solely by the surface rating (10). For example, if a full-depth asphalt concrete pavement were to receive a surface rating of 6, the treatment category assigned would be corrective maintenance. However, if a structural problem such as alligator cracking were present, a treatment more extensive than corrective maintenance would be required for proper repair. Thus, alligator cracking is a dominant distress for a flexible pavement. Table 3 lists the distress symptoms that the expert panel determined to be dominant.
In May 1990, crews (a driver and a rater) from the 11 regional offices were trained to use the improved survey procedure. Data were collected during the late spring and early summer, batch processed and summarized in the main office, and supplied back to the regions in the early fall, in time to be used for the development of each region's annual GoalOriented Capital Program (GOCP). As in past years, data integrity was assured through main office audits of the re-
TABLE 1 NETWORK-LEVEL DISTRESS TREATMENT CATEGORIES AND TYPICAL REP AIR ACTIONS
TREATMENT CATEGORIES
Do Nothing
Preventive Maintenance
Preventive Maintenance (High Cost)
Corrective Maintenance
Corrective Maintenance (High Cost)
Rehabilitation
Rehabilitation (High Cost)
Major Rehabilitation
RI GIP
Reseal Joints
Reseal Joints & Patch
Reseal Joints Patch, Grind
4" AC Overlay
5" AC Overlay
Rubblize/6" AC or Reconstruct
PAYEMENT TYPE FLEXIBLE
Fill Cracks
Fill Cracks & Patch
1 1/2" AC Overlay
Milling, Patching 1 1/2" AC Overlay
2 l/2"AC Overlay
4" AC Overlay
Reconstruct
OVEBLAY
Fill Cracks
Fill Cracks & Patch
1 1/2" AC Overlay
Milling, Patching 1 1/2" AC Overlay
2 1/2" AC Overlay
4" AC Overlay
Mill, Rubblize, 6" AC or Reconstruct

60
TABLE 2 SURFACE RATING SCALE
scale Point
10
9
8
7
6
5
4
J
2
l
Surface Diatrea• Freauency
Surf ace Di•treea Severity
Nona None (Recently Con•tructed or Rehabilitated)
None
Infrequent
Infrequent to occasional
Occasional to Frequent
Frequent
Frequent
Very Frequent
None
Very Sliqht
Sliqht
Moderate
Moderate to Severe
Severe
Very Severe
Very Frequent Very Severe (Travel Difficult)
Very Frequent Very Severe (Facility Impassable)
TRANSPORTATION RESEARCH RECORD 1344
Treatment Category
Do Nothinq
Do Nothinq
Preventive Maint.
Preventive Maint. (hiqh coat)
Corrective Maint.
Rehabilitation
Rehabilitation (hiqh cost)
Major Rehabilitation
Major Rehabilitation
Major Rehabilitation
gional ratings. This process-called shadow scoring-showed the regional teams rated the roads consistent with the way they were trained and, most important, consistent among themselves (JJ). Total cost for the field element of the survey was approximately $100,000, which included fringe benefits and travel.
estimates of pavement needs, the following tasks have been accomplished:
Needs Estimating
Needs estimates are an important product of a PMS. They are used in reporting to the legislature and to help the regions shape their programs of pavement projects. To achieve better
• Treatment matrices that link the condition information to the treatment categories were developed and computerized. Table 4 shows a matrix for overlaid pavement structures; the codes for the table follow.
Dominant Distresses Code
Alligator cracking, isolated A; Alligator cracking, general A. Widening dropoff W No dominant distress N Not applicable NA
TABLE 3 DOMINANT DISTRESSES FOR NEW YORK STATE PAVEMENTS
piatraas Payement Type Freauency Mea@ure I
Faultinq Riqid Present or Absent
Spallinq (joint or Riqid Isolated or General mid-slab)
Alliqator Crackinq Flexible or Isolated or General Overlaid
Widening Dropof f Overlaid Present or Absent
1 "Isolated" is defined as the distress symptom exists on lees than 20% of the pavement section.

Geoffroy and Shufon 61
TABLE 4 NETWORK TREATMENT MATRIX FOR OVERLAID PAVEMENTS
Surface Rating
10
9
8
7
6
5
4
1-3
pominant Di1trn11/1
NA
NA
NA
N or w A;
A,
N
A;
W or A1
W and (A; or A1
)
N or A;
W or A1
W and (A; or A1 )
N or A;
w or A1
W and (A; or A1 )
N to All
• The average contract costs for each of the treatments given in Table 1 were obtained from the department's Bid Analysis Management System and determined for each region and throughout the state. Costs were further stratified by lane configuration for three scenarios: pavement repair only (which is just the cost to restore the pavement), pavement plus roadside appurtenances (which includes pavement, shoulder, and guide rail repair), and the repair of all deficiencies at the candidate project site (which is the total contract cost). Table 5 shows a matrix for the total contract cost scenario.
• Computer software was developed that links the cost data to the treatment matrices. Needs estimates are now available on a statewide basis and by region, county, route, residency, or any other variable in the Sufficiency System, which is the mainframe data base that stores the department's inventory and pavement condition information.
Table 6 summarizes the results of the needs estimating process for the entire New York State highway system.
Goal Setting
Goal setting is at the heart of the department's capital program development process. Goals are used to underscore priorities, guiding the regions into developing pavement programs consistent with policies established by executive management. The goal-setting process at the statewide level starts with consideration of
• Department mission, • State transportation requirements, • Anticipated resource levels, and
Treatment Strategy
Do Nothing
Do Nothing
PM
PM PM (High Cost) Corrective Maintenance
Corrective Maintenance Corrective Maintenance
(High Cost) Rehabilitation
Rehabilitation
Rehabilitation Rehabilitation (High Cost)
Rehabilitation (High Cost)
Rehabilitation (High Cost)
Major Rehabilitation
Major Rehabilitation
Major Rehabilitation
• Existing and historical condition of the transportation system and past funding levels in support of each element of the system.
Staff from the department's Office of Planning and Program Management annually evaluate these considerations and develop tentative statewide goals for pavement and bridge condition, safety, and capacity for review by executive management. On the basis of this review, executive management establishes the statewide program emphasis, sets statewide goals, and provides each region with their tentative requirements (12). Because a goal must be realistic and achievable, each region has the opportunity to negotiate with executive management before the final goal statement is adopted.
Pavement goals are supplied to the regions during the early fall for use in updating the 5-year GOCP. The goal instruction package consists of a goal statement, measures of performance, and project selection criteria. Typically, the pavement goal focuses on reducing the lane miles of pavement rated poor (surface rating of 5 or less) and fair (surface rating of 6) during the annual pavement condition survey. In 1991 the regional goal statements were expanded to include a measure to ensure that priority be given to high-volume facilities.
Allocations
For goal-driven systems to be successful, resource allocations must be linked to program objectives. Historically in New York State, the allocation of pavement moneys to each region has been based on many factors, including demographics, mileage, system usage, and, to a lesser extent, pavement condition. Over the past few years, however, the allocation formulas have been revised to include an expanded pavement

62 TRANSPORTATION RESEARCH RECORD 1344
TABLE 5 STATEWIDE COST ESTIMATES FOR TOTAL CONTRACT COST
---------Lane Configuration1---------
Tr••ta•pt Strat1qy tp 6p 2U iU 6U
RESEAL JOINTS $ 15 $ 18 $ 15 $ 20 $ 21
RES JNTS, PATCH SPALLS 16 20 16 21 23
RES JNTS, PAT SPALLS, GRIND 38 42 38 43 45
4" ACC OVRLY, 3" SHLDRS 268 249 300 256 241
5" ACC OVRLY, 3" SHLDRS 304 285 335 291 277
9" PCCP RECONSTRUCTION 1456 1424 1496 1429 1407
FILL CRACKS 7 9 7 10 11
FILL CRKS, PATCH PVMT 17 19 17 20 21
1.5" ACC ARMOR COAT & SHLDRS 85 75 99 77 69
1.5" OVRLY, SHLDRS, MILLING 110 99 123 101 93
2. 5" ACC OVRLY & SHLDRS 128 112 148 115 103
4" ACC OVRLY & 3" SHLDRS 234 210 266 213 196
RUBBLIZE, 6" OVRLY, 3" SHLDRS 532 508 563 511 494
10.5" ACCP RECONSTRUCTION $693 $669 $725 $673 $655
NOTE: Costs are given in thousands of dollars per lane mile.
lA "D" denotes a divided highway, a "U" denotes an undivided highway.
condition element that specifically addresses lane mileage of pavements rated poor and fair. Furthermore, the staff responsible for setting goals is assigned to the same functional section as the staff responsible for overseeing the allocation activity. This organization fosters the linkage between goals and the resources required by the regions to meet these goals.
Regional Development of Integrated Program
Developing a balanced program of capital and maintenance projects is the responsibility of the regional offices. Each re-
gion has established a regional program committee, chaired by the regional director, consisting of senior managers from each of the functional groups including Planning and Program Management, Design, Maintenance, and Traffic Engineering and Safety. The committee receives input from many sources beginning with the resident engineers. The REs submit lists of highway sections that are candidates for repair by either agency or contract forces. The criteria used to select candidate project sites include pavement condition ratings, technical guidelines on project selection, and the intimate knowledge and experience of the REs with their highway systems. Cri-
TABLE6 SUMMARY OF 1990 PAVEMENT CONDITION SURVEY STATEWIDE NEEDS
ESTIMATED TOTAL REPAIR COSTS ($000'e) TOTAL
TREATMENT TOTAL % OF TOTAL PVMT PVMT & CONTRACT CATEGORY LANE MILES LANE MILES OHLX PYRH· COST
DO NOTHING 2,769 7 .5% 0 0 0
PREVENTIVE MAINTENANCE 15, 201 41.3% 100,073 100,073 169,543
CORRECTIVE MAINTENANCE 7,839 21.3% 369,923 470,840 718,369
REHABILITATION 10,664 29.0% 1,034,417 1,487,114 2,242,533
MAJOR REHABILITATION 332 0.9% 125,140 193,238 285,736
TOTAL 36, 805 100.0% $1,629 , 553 $2,251.265 s'.l , 416,101
Geoffroy and Shufon
teria used by the REs to recommend who will do the work (i.e., agency or contract forces) include the scope of the repair action required, resources available for repair by agency forces, and logistics such as distance of the candidate project sites from the residency offices.
Safety considerations also play an important role in project site selection and priority action. For example, the department has recently implemented a program called SAFEp A VE, which requires the identification and evaluation of pavement sections that are candidates for a single-course (1 Y2-in.) overlay with higher-than-average wet-weather accident rates. If the analysis shows that an overlay will reduce accident rates, these sections receive priority for treatment.
Other sources for candidate projects include considerations particular to each region, such as improvements to corridors of statewide significance, economic development, and citizen complaints.
The number of candidate projects resulting from this process always exceeds the resources available. The department's Infrastructure Needs Assessment Model (INAM) is used to assist the regional program committee in determining the program of projects that best achieves the pavement goal given the resources available. This model calculates the cost of a user-specified pavement program and predicts the impact of the proposed program on network condition (13). Use of the model is an iterative process. Alternative treatment strategies are tested and the results presented to the committee. The program of projects that meets the pavement goals and best satisfies all other considerations is selected and submitted to the main office for approval.
The NYSDOT approach to program development allows the regions considerable flexibility in determining which pavement sections will be treated-as long as the pavement goals are achieved. Technical tools are used throughout the process to assist in developing a program but do not replace the collective expertise and experience of the department's regional engineering managers.
Program Review Process
This activitiy involves the main office review of the regional update of the 5-year program. All programs (pavement , bridges, safety, and capacity) are reviewed each year to en ure their compliance with the program emphasis and goals establi hed by executive management. The program descriptive materials prepared by the region · con ist of project lists the rationale used and any trade-offs made in arriving at program choices, and summary statistics hawing planned accompli hmeots along with forecasts of conditi n at the end of the program life.
Each program i compared to preestablished program evaluation criteria. The evaluation is performed by staff-level representatives from several functional groups within the main office. During this phase, the regions are kept informed of any concerns-in particular, shortcomings in goal attainment. On the basis of these concern , the programs may be revi ed by the regions and resubmitted or the regions may choose not to revise the programs to reflect the concerns rai ed during the staff review. Each regional director is then invited to make a formal presentation (and defen e) of the proposed program before a special committee consisting of executive manage-
63
mcnt and chaired by the commissioner of transportation. Any unre olved concerns raised during the staff review must be addressed by the RD at this time. The presentation results in program approval or in conditional approval, which means that while the committee is in substantial agreement with the proposal , some minor issues still require di cussion and resolution. After negotiations, final approval is obtained and the first-year element of the 5-year program can begin.
The pavement management function in the main office plays an important role in the review of the regional pavement programs. An analysi is conducted to determine if the programs ubmitted by the region reflect a proper integration of maintenance and capital actions . In addition, !NAM runs are reviewed and other analyses conducted to determine if program implementation would result in goal attainment. Figure 2 shows an example chart ubmitted by each region. Data from this chart are used to compute paving and treatment cycles and to asses · th balance of capital and mainte.nance improvement. It should be noted that the categories of work Ii ted on this chart are directly related to the general treatment categories output from the network pavement condition survey. Figure 3, prepared by the main office review team, illustrates how the pro1 o ed programs are evaluated against the network survey results. The left portion of the table summarizes the network survey result for each region· the right portion shows the project mix and cost of the proposed program. The purpose of the table i to determine whether the propo ed project mix is consil>tent with the urvey result . For example, a program would not be approved if only 10 percent of tbe total lane miles programmed involved prevenrive maintenance treatments while the network survey indicated 40 percent of a region's lane miles were candidates for preventive maintenance.
It should be recognized that, though the review process i comprehensive the merits of individual pavement project are not as e sed. The NYSDOT network-level PMS gives the regions flexibility in project selection but demands accountability in meeting program objectives.
Program Implementation
Program implementation involve all the steps leading to the rehabilitation of a pavement section programmed for work. These activitie -in particular, the selection of alternative treatment and maintenance ·trategies project design, and construction- are addressed as part of the department's project-level pavement management process.
Network-Level Performance Monitoring
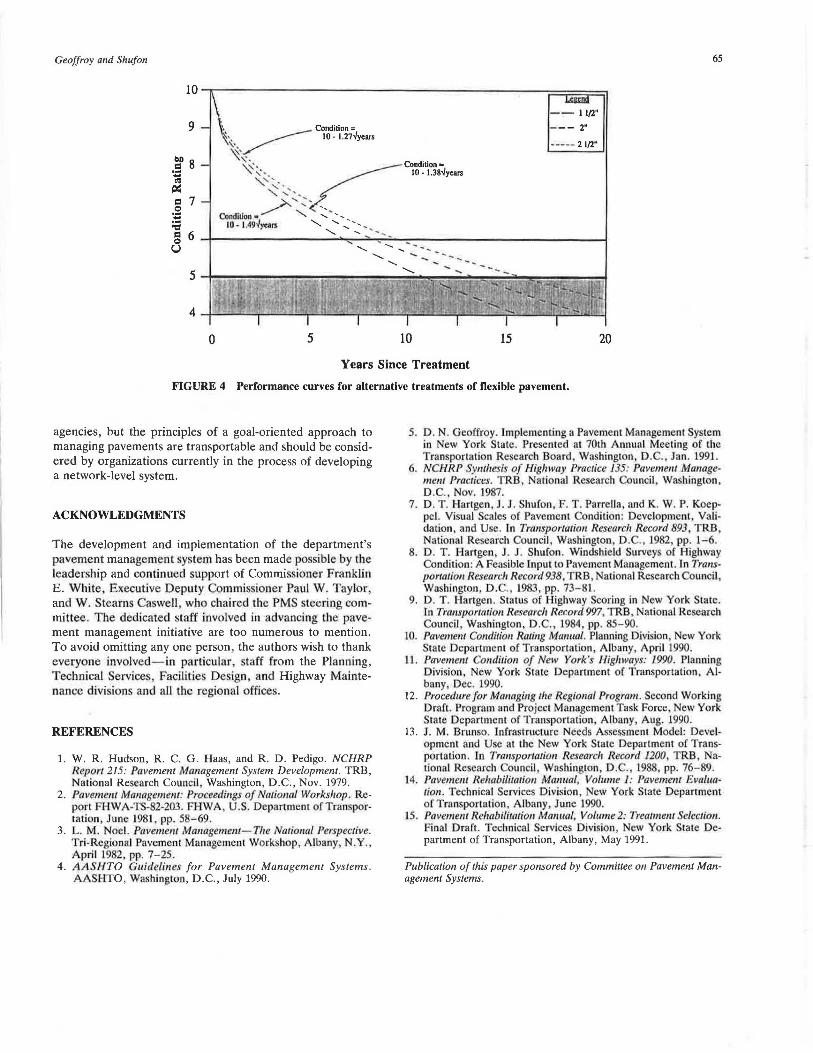
Performance monitoring is an essential element of any goaloriented management system. The NYSDOT network-level PMS relies on the results of the annual pavement condition survey to evaluate the effectiveness of program implementation and to provide feedback for setting the next year' goals. From a pavement management per pective performance monit ring al o involves the evaluation of the effectiv.ene s of pavement repair trategies and the generation of performance curve ·. The department is developing performance curves for each of the network treatment categories

64 TRANSPORTATION RESEARCH RECORD 1344
SFY 92/93 SFY 93/94 SFY 94/95 SFY 95/96 SFY 96/97 5-Year Total
Lane- Lane- Lane- Lane- Lane- Lane-Treatment Category Miles $ M Miles $ M Miles $ M Miles $ M Miles $ M Miles $ M
A. PREVENTIVE MAINTENANCE (PAVING)
Single-Course overlay by State Forces From Operating Allocation From Capital Allocation
Single-Course Dverlay by Contract
TOTA! PM (PAVING) ACTIONS
B. CAPITAL PAVEMENT PROGRAM
R&F (includes all multi-course overlays) Other Rehab Strategies (includes recent
full-depth recycling, CPR, etc.)
TOTA! REHABILITATION ACTIONS
c. Oll!ER PM (NON-PAVING)
Crack/Joint Sealing/Filling by State Forces Crack/Joint Sealing/Filling by Contract Chip Seal and Slurry Seal
TOTA! PM (NON-PAVING) ACTIONS
TOTAL PAVING (PM & CAPITAL): A+ B
FIGURE 2 Regional reporting of 5-year integrated pavement program.
by region , pavement type, and condition rating before treatment. Figure 4 shows example performance curves for 1%-, 2- and 2\12-in. resurfacing of a full-depth asphalt pavement in the department's Hornell region. Equations for each of these curve wa developed and the area under the curves determined to identify the treatment that provides the most condition years of service at the least cost. The results of these activities will furnish valuable input to regional program development-to the forecasting capability of the Infrastructure Needs Assessment Model, in particular.
PROJECT-LEVEL PAVEMENT MANAGEMENT
A project-level PMS addrns es the technical aspects of selecting the engineering treatment or eries of treatment to be applied to a pavement section programmed for repair. Over the past year the NYSDOT ha made great progre s in implementing a project-level PMS. New technical tools have been developed and exi ting methodologies integrated into a systematic proces for treatment election. Specific ac-
complisbment include the development of a detailed pavement evaluation methodology (14) the development of treatment selection guidelines based on life-cycle cost con iderations (15), and the preparation of engineering in tructions to guide designers in selecting appropriate treatments . Full- cale implementation of the project-level system is scheduled for early 1992.
CONCLUSIONS
A pavement management y tern must be tailored to the organizational structure and deci ion-making processes of the implementing agency. The New York State network-level PMS was de igned to operate in a decentralized decision-making environment where choices on project selection are made by experienced engineers in regional offices. The sy tern is goaldriven and although it allows flexibility in individual project election, it require accountability in overall program de
velopment. The author acknowledge that the ystem described in thi paper may not be appropriate for all highway
1991 Proposed Sufficiency 5-Year Survey Program
Treatment Lane- 7. of Lane- % of % LM Treated Programmed Category Miles System Miles Program To LM Needs ( $ millions)
Do Nothing
Preventive Maintenance
Preventive Maintenance (Paving)
Rehabilitation
Major Rehabilitation
Totals
FIGURE 3 GOCP review comparison table.
Geoffroy and Shufon
9
~8 ~ ~ Cl 7
.5? -:a g 6 u
0 5
65
--1112"
--- 2"
----- 2112·
10 15 20
Years Since Treatment
FIGURE 4 Performance curves for alternative treatments of flexible pavement.
agencies, but the principles of a goal-oriented approach to managing pavements are transportable and should be considered by organizations currently in the process of developing a network-level system.
ACKNOWLEDGMENTS
The development and implementation of the department's pavement management system has been made possible by the leadership and continued support of Commi sioner Franklin E. White, Executive Deputy Commissioner Paul W. Taylor, and W. Stearns Caswell , who chaired the PMS steeri ng committee. The dedicated staff involved in advancing the pavement management initiative are too numerous to mention. To avoid omitting any one person, the authors wish to thank everyone involved- in particular, taff from the Planning, Technical Services, Facilitie Design and Highway Maintenance divisions and all the regional offices.
REFERENCES
1. W. R. Hudson, R. C. G. Haas, and R . D. Pedigo. NCHRP Report 215: Pavement Management System Development. TRB, National Research Council Washington, D.C., Nov. 1979.
2. Paveme11t Manage11u:m: Proceedings of Na1io11al Works/lop . Report FHWA-TS-82-203. FHWA, U.S. Department of Tran portation, June 1981 , pp. 58-69.
3. L. M. Noel. Paveme111 Management-The National Perspective. Tri-Regional Pavement Management Workshop, Albuny N.Y . , April 1982, pp. 7- 25.
4. AASHTO G11ideli11e for Pavement Management Systems . AASHTO, Washington, D.C., July 1990.
5. D . N. Geoffroy. Implementing a Pavement Management Sy tern in New York State . Presented at 70lh Annual Meeting of the Transportation Research Board Washington , D.C., Jan. 1991.
6. NCHRP Syntllesis of Higliway Practice 135: Pavement Ma11agemem Practices. TRB, National Research Council Wahington , D .C., Nov . 1987.
7. D . T. Hartgen, J. J . hufon,F. T . Parre lla, and K. W. P. Koeppel. Visual Sca.les of Pavement Condition: Development, Validation , and Use. ln Tra1111porta1io11 Research Record 893, TRB, National Research Council, Wa hington, D .. , 1982, pp. 1-6.
8. D. T. Hartgen, J . J . Shufon . Wind hield Survey of Highway Condition: A Fea Ible Input to Pavement Management. In Transportation Rese"'ch Record 938, TRB, National Re earch Council, Washington D . . 1983, pp. 73-8L.
9. D. T. Hangen . Status of Highway Scoring in New York Stare. Tn Tro11spor1mio11 Researdr Record 997, TRB, National Re earch Council , Washington, D.C. , 1984, pp. 85- 90.
10. Pavement Condition Rating Manual. Planning Division, New York State Department of Transportation, Albany April 1990.
11 . Pavement Condition of New York's Highways: 1990. Planning Division, New York State Depanment of Transportation, A lbany, Dec. 1990.
12. Procedure for Managing tile Regional Program. Second Working Draft. Program and Project Management Task Force, New York State Department of Transportation, Albany Aug. 1990.
13. J . M. Brunso. Infrastructure Needs Asses ment Model: Development and U eat the New York State Department of Trans· portation. la Tm11sponatio1i Research Record 1200, T RB , National Research Council, Wa hington, D.C., 1988, pp. 76- 89.
14. Pavement Rehabilitation Manual, Volume I : Pavement Evalua· 1io11. Technical Services Division, New York State Department of Transportation, A lbany, June 1990.
15. Pavemem Refrabilitation Manual, Volwne 2: Trea1111e111 Selection. Final Draft. Technical ervices Division , New York State De· partment of Transportation, Albany, May 1991.
Publication of this paper sponsored by Committee on Pavement Management Systems.