Network Externalities and the Structure of Terror...
34
Network Externalities and the Structure of Terror Networks Walter Enders * , Paan Jindapon † Department of Economics, Finance and Legal Studies The University of Alabama Tuscaloosa, AL 35487-0224 October 27, 2009 * Phone: (205) 348-8972, Fax: (205) 348-0590, Email: [email protected] † Phone: (205) 348-7841, Fax: (205) 348-0590, Email: [email protected] 1
Transcript of Network Externalities and the Structure of Terror...

Network Externalities and the Structure of
Terror Networks
Walter Enders∗, Paan Jindapon†
Department of Economics, Finance and Legal Studies
The University of Alabama
Tuscaloosa, AL 35487-0224
October 27, 2009
∗Phone: (205) 348-8972, Fax: (205) 348-0590, Email: [email protected]†Phone: (205) 348-7841, Fax: (205) 348-0590, Email: [email protected]
1
Abstract
We analyze the optimal network structure of two types of terrorist organizations. In
the centralized network, the leadership selects the level of individual effort and the level of
group connectivity so as to maximize the expected net welfare of the organizations
membership. Leaders in loosely-connected networks will also seek to balance the trade-off
between security and communications. However, with decentralized decision making, the
individual nodes may not make optimal decisions from the group’s perspective. As a
consequence, the decentralized decision making process is suboptimal from the overall
perspective of the network. In particular, the leadership in a centralized network is able to
coordinate the activities of all network members and to take advantage of important
network externalities.
Keywords: Terrorist cells, Network structure, Network externalities,
Counterterrorism, Security versus connectivity
2
It is now clear that terrorist network structures evolve in response to the political and
economic circumstances in which they operate. In the past, terrorist organizations involved
individuals belonging to a clearly identified organizational structure with a well-defined
chain of command. The decision-making structure was typically hierarchical in that the
leadership participated in the planning, and oftentimes in the execution, of specific attacks.
For example, Andreas Baader and Ulrike Meinhof, founders of the Red Army Faction, were
arrested and each given three life sentences for their participation in activities such as bank
robbery and arson. Ahmed Sa’dat, Secretary General of the PFLP, was arrested by the
Palestinian Authority in 2002 for his suspected involvement in the assassination of Israeli
Minister Rehavam Zeevi. In contrast, the so-called “New Terrorism” involves individuals
who act in concert through loosely knit organizational structures. The literature provides
several reasons for this change in organizational structure of terrorist groups. Arquilla,
Ronfeldt, and Zanini (1999) argue that the information revolution has allowed both
businesses and terrorist organizations to adopt “flatter” structures such that the chain of
command is not completely top-down. Their view is that loosely-knit networks are more
flexible and responsive than hierarchies in reacting to new circumstances and in using new
information to improve decision making. Enders and Su (2007) emphasize the changes in
counterterrorism that have occurred since 9/11. They point out that key provisions of the
USA Patriot Act (HR 3162) grant the government new powers to monitor terrorists’
communication links and to track the international flow of funds used to finance terrorist
activities. Passed only six weeks after 9/11, the act increased the government’s ability to
(i) seize voice-mail messages; (ii) intercept wire, oral, and electronic communications of
3

suspected terrorists; and (iii) gather intelligence on suspected terrorists with less
congressional oversight. As the leadership seeks to balance overall security against
effectiveness, such changes are expected to alter the organization’s structure towards being
more secretive. Loosely-knit networks are more secure against monitoring and infiltration
than are fully-connected networks. In a slightly different vein, Baccara and Bar-Isaac
(2009) show that a group will respond to harsh interrogation methods by becoming more
secretive and more hierarchical. The basic idea is that the hierarchical structure protects
the leadership.
The purpose of this paper is to analyze some of the important differences between the
hierarchical and new terrorist network structures. Our focus is on the fact that hierarchical
structures have the ability to coordinate the activities of all network members and to take
advantage of important network externalities. In contrast, flat networks necessitate
decentralized decision making such that the individual nodes may make decisions that do
not perfectly align with the overall interests of the terrorist group.1
Evidence of two-stage decision making within the al Qaeda network is revealed in the
July 9, 2005 letter from al-Zawahiri to al-Zarqawi.2 The following excerpts reveal how the
leadership was trying to exert some control over the behavior of al-Zarqawi. Al-Zawahiri
indicates that the organization is fighting a “media war” and that al-Zarqawi’s brutality is
detrimental to al Qaeda:
“Among the things which the feelings of the Muslim populace who love and
support you will never find palatable - also- are the scenes of slaughtering the
hostages.”
4
“Therefore, I stress again to you and to all your brothers the need to direct the
political action equally with the military action, by the alliance, cooperation
and gathering of all leaders of opinion and influence in the Iraqi arena. I can’t
define for you a specific means of action. You are more knowledgeable about
the field conditions.”
Notice that al-Zawahiri delegates responsibility in that he leaves the “specific means
of action” up to al-Zarqawi. Perhaps most interesting is the fact that al-Zarqawi planned
the November 9, 2005 bombings of three hotels located in Amman Jordan. As reported by
the BBC (2005), the attacks were responsible for 60 deaths and nearly 100 injuries. Most
of the carnage occurred at the Radisson SAS hotel which was hosting a wedding party
attended by approximately 900 Muslims. The Jordanian response included street
demonstrations protesting and chanting “Burn in hell, Abu Musab al-Zarqawi.”
The example shows the obvious point that the outcomes of flat networks can be
suboptimal if the separate decision makers have conflicting objectives. However, our aim is
to show that the presence of network externalities means that decentralized decisions can
be suboptimal even if the individual decision makers have the same preferences. We do this
in a model that recognizes three important features of any terrorist organization. Whereas
gang members and individuals belonging to organized crime syndicates are primarily
motivated by financial interests, terrorists are not generally deemed to be motivated by
wage income. Hence, instead of modeling individuals as being pure income maximizers, in
our model, members of a terrorist organization have a political and/or religious objective
underlying their actions. Specifically, we assume that group members are not altruistic
5
insofar as each member’s utility depends on his/her own level of effort and that of other
group members devoted to the group’s cause. The second key feature of a terrorist network
appearing in our model is that, unlike many social networks, there is an important tradeoff
between connectivity and security. Although highly connected networks are best able to
conduct logistically sophisticated attacks, they can be quite vulnerable to government
infiltration. Thus, as argued in Enders and Su (2007), terrorist groups will become flatter
as the costs of connectivity rise. The third important feature of a terrorist organization is
the presence of network externalities. The source of these network effects is the additional
benefit that the organization derives because individuals are able to interact with each
other and coordinate their activities. Although two individuals acting alone can cause great
harm, the two acting in concert can inflict even greater damage. The types of logistically
complex actions illustrated by the coordinated Kenya-Tanzania embassy bombings, 9/11,
the London and Madrid train bombings, and the November 2008 strikes at Mumbai are
testimony to the enhanced effects of synchronized behavior. The compound nature of the
attacks served notice that the group is well-organized, serious in its resolve and global in
reach. Hence, the desire for security can be costly in that there may be unexploited
network effects that limit the total output of the organization. The hierarchical network
structures are better able to internalize the this externality than are flat structures.
In the next section of the paper, we define some key terms and set out the basic
model. The third section analyzes the problem of centrally planned networks. The network
planner coordinates the effort levels of the individual members with the optimal level of
network connectivity. The fourth section considers decision making in a decentralized
6

network. One interesting feature of this variant of the model is that the connectivity of the
network affects the utility optimizing level of effort chosen by the individual group
members. A simple description of the model is developed below. Conclusions and policy
recommendations are contained in the final section.
Regular Networks
Definitions
Figure 1 displays five different graphs pertaining to the structure of a potential terrorist
network. Each individual terrorist (or terrorist cell) within the organization is represented
by a point called a node. The lines connecting the nodes (called links or edges) represent
direct communication ties between the individuals. The first graph in the figure is
disconnected in that some of the individuals have no way to communicate with the others.
Since the subgroups must act independently, many would refrain from actually calling such
a configuration a network. At the other extreme, the fifth graph represents a complete or
all-channel network in that every individual is directly linked to every other individual. In
the intermediate cases, each individual in linked to some (but not all) of the others in the
network. Even if two nodes are not directly linked to each other, the individuals can
communicate indirectly through the use of multiple links. For our purposes, the important
point is that the information flow through a network is an increasing function of its
density.3
Figure 1: Regular Networks (n, r)
7

More generally, let the set of terrorist nodes be N = {1, . . . , n}. These nodes form a
network g = [gij] where i, j ∈ N and gij = gji. For i 6= j, gij = 1 if there is a link between
nodes i and j, and 0 otherwise. Let gii = 0. If gij = 1 for all i, j ∈ N and i 6= j, we say that
network g is complete. The neighborhood of i is the set of all nodes directly linked to node
i. As such, it is possible to view the individuals in the neighborhood of i as the cellmates of
i. Mathematically, we denote the neighborhood of i as the set Ni and the number of nodes
in Ni (often called the degree of node i) as ηi. Formally, we let ηi = r for all i ∈ N , and
define the network g to be regular of degree r. Notice that all of the graphs shown in
Figure 1 are examples of regular networks (n, r) with n = 6. In graph theory, it is known
that, for integers r and n with 0 ≤ r ≤ n, there exists a network that is regular of degree r
if and only if at least one of r and n is even.
Terrorists and effort levels
A key aspect of our model is that individuals receive utility from their membership in the
terrorist organization. To be specific, we assume that the individual gains utility by
working for the organization and that the more node i is capable of producing, the greater
is i’s utility. In order to capture the public good aspect of a network, we use the type of
production, or payoff, function developed in Bramoulle and Kranton (2007). Let
e = (e1, . . . , en) be an effort profile of all terrorists in the network, where ei ∈ [0, +∞). The
utility of node i has the form
ui = q(vi)− cei (1)
8
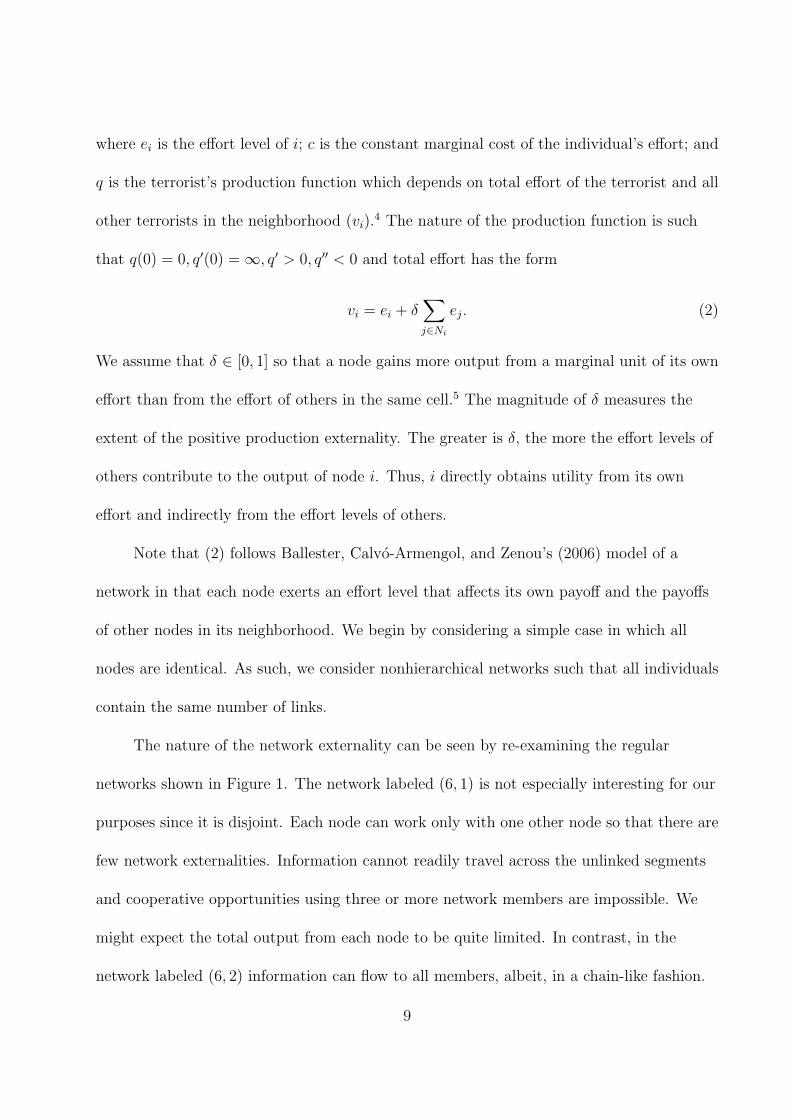
where ei is the effort level of i; c is the constant marginal cost of the individual’s effort; and
q is the terrorist’s production function which depends on total effort of the terrorist and all
other terrorists in the neighborhood (vi).4 The nature of the production function is such
that q(0) = 0, q′(0) = ∞, q′ > 0, q′′ < 0 and total effort has the form
vi = ei + δ∑j∈Ni
ej. (2)
We assume that δ ∈ [0, 1] so that a node gains more output from a marginal unit of its own
effort than from the effort of others in the same cell.5 The magnitude of δ measures the
extent of the positive production externality. The greater is δ, the more the effort levels of
others contribute to the output of node i. Thus, i directly obtains utility from its own
effort and indirectly from the effort levels of others.
Note that (2) follows Ballester, Calvo-Armengol, and Zenou’s (2006) model of a
network in that each node exerts an effort level that affects its own payoff and the payoffs
of other nodes in its neighborhood. We begin by considering a simple case in which all
nodes are identical. As such, we consider nonhierarchical networks such that all individuals
contain the same number of links.
The nature of the network externality can be seen by re-examining the regular
networks shown in Figure 1. The network labeled (6, 1) is not especially interesting for our
purposes since it is disjoint. Each node can work only with one other node so that there are
few network externalities. Information cannot readily travel across the unlinked segments
and cooperative opportunities using three or more network members are impossible. We
might expect the total output from each node to be quite limited. In contrast, in the
network labeled (6, 2) information can flow to all members, albeit, in a chain-like fashion.
9
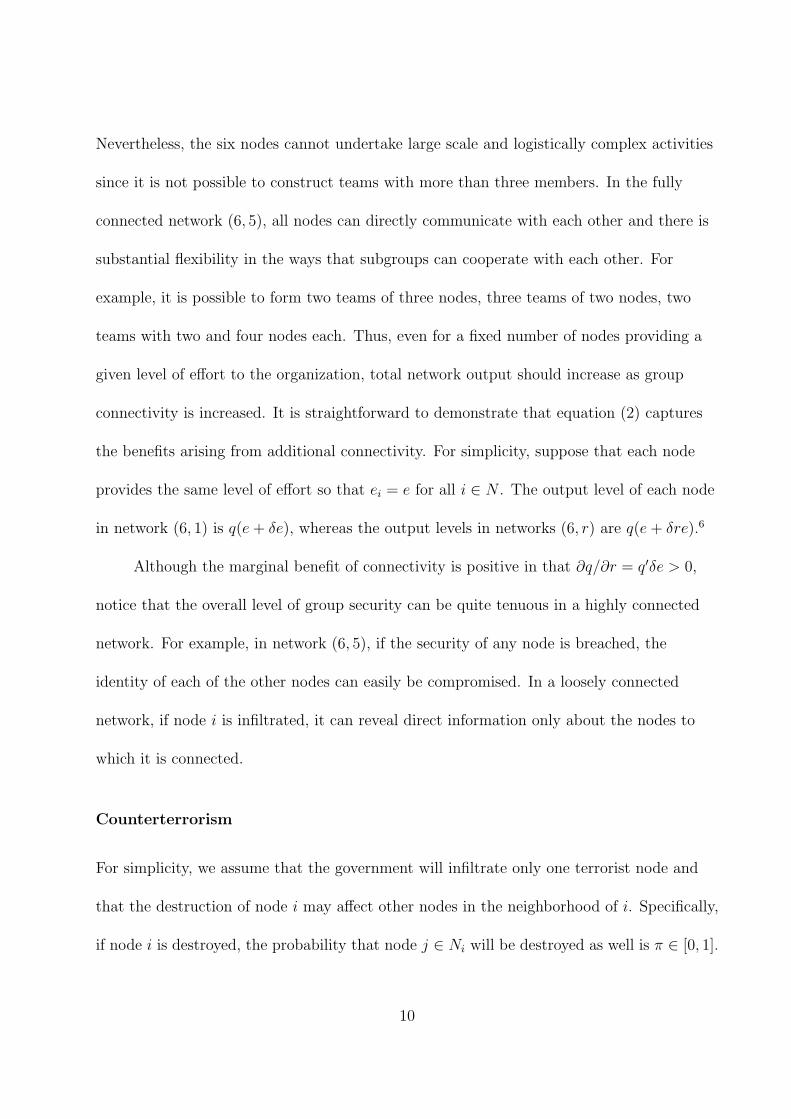
Nevertheless, the six nodes cannot undertake large scale and logistically complex activities
since it is not possible to construct teams with more than three members. In the fully
connected network (6, 5), all nodes can directly communicate with each other and there is
substantial flexibility in the ways that subgroups can cooperate with each other. For
example, it is possible to form two teams of three nodes, three teams of two nodes, two
teams with two and four nodes each. Thus, even for a fixed number of nodes providing a
given level of effort to the organization, total network output should increase as group
connectivity is increased. It is straightforward to demonstrate that equation (2) captures
the benefits arising from additional connectivity. For simplicity, suppose that each node
provides the same level of effort so that ei = e for all i ∈ N . The output level of each node
in network (6, 1) is q(e + δe), whereas the output levels in networks (6, r) are q(e + δre).6
Although the marginal benefit of connectivity is positive in that ∂q/∂r = q′δe > 0,
notice that the overall level of group security can be quite tenuous in a highly connected
network. For example, in network (6, 5), if the security of any node is breached, the
identity of each of the other nodes can easily be compromised. In a loosely connected
network, if node i is infiltrated, it can reveal direct information only about the nodes to
which it is connected.
Counterterrorism
For simplicity, we assume that the government will infiltrate only one terrorist node and
that the destruction of node i may affect other nodes in the neighborhood of i. Specifically,
if node i is destroyed, the probability that node j ∈ Ni will be destroyed as well is π ∈ [0, 1].
10
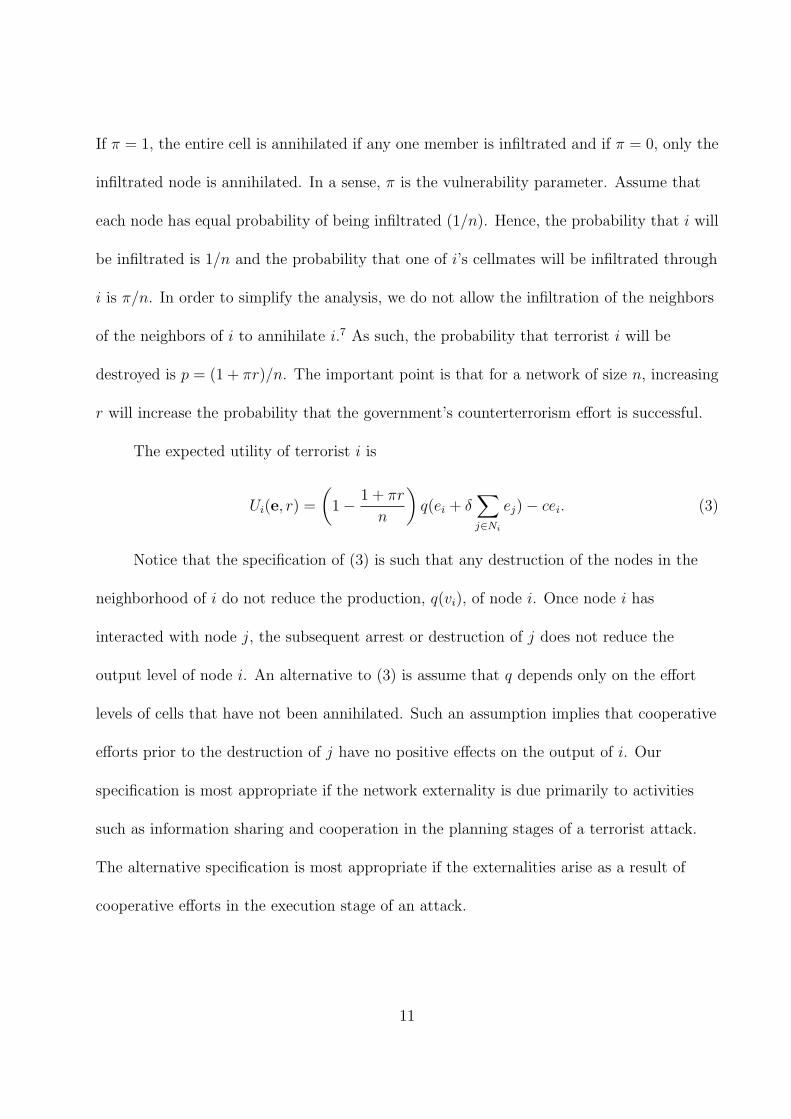
If π = 1, the entire cell is annihilated if any one member is infiltrated and if π = 0, only the
infiltrated node is annihilated. In a sense, π is the vulnerability parameter. Assume that
each node has equal probability of being infiltrated (1/n). Hence, the probability that i will
be infiltrated is 1/n and the probability that one of i’s cellmates will be infiltrated through
i is π/n. In order to simplify the analysis, we do not allow the infiltration of the neighbors
of the neighbors of i to annihilate i.7 As such, the probability that terrorist i will be
destroyed is p = (1 + πr)/n. The important point is that for a network of size n, increasing
r will increase the probability that the government’s counterterrorism effort is successful.
The expected utility of terrorist i is
Ui(e, r) =
(1− 1 + πr
n
)q(ei + δ
∑j∈Ni
ej)− cei. (3)
Notice that the specification of (3) is such that any destruction of the nodes in the
neighborhood of i do not reduce the production, q(vi), of node i. Once node i has
interacted with node j, the subsequent arrest or destruction of j does not reduce the
output level of node i. An alternative to (3) is assume that q depends only on the effort
levels of cells that have not been annihilated. Such an assumption implies that cooperative
efforts prior to the destruction of j have no positive effects on the output of i. Our
specification is most appropriate if the network externality is due primarily to activities
such as information sharing and cooperation in the planning stages of a terrorist attack.
The alternative specification is most appropriate if the externalities arise as a result of
cooperative efforts in the execution stage of an attack.
11

The expected value of total terrorism welfare can be written as
W (e, r) =
(1− 1 + πr
n
) ∑i∈N
q(ei + δ∑j∈Ni
ej)− c∑i∈N
ei. (4)
In our framework, there are three different types of counterterrorism policies that
alter the values of c, π, and δ. The marginal cost of effort, c, represents the perceived
opportunity cost of devoting effort to terrorist activities. As detailed in Enders and Sandler
(2006), the household production function (HPF) approach to terrorism indicates that an
increase in the relative price of terrorist activities will induce rational terrorists to
substitute into relatively less expensive nonterrorist activities. Certainly, policies that
restrict (allow) individuals to address their grievances through legal political channels can
be viewed as a decrease (increase) in c. Similarly, policies that raise the overall cost of
engaging in terrorist activities represent an increase in c. For example, international
cooperation regarding money laundering has enhanced the government’s ability to limit the
flow of funds intended to finance terrorist activities. Also, INTERPOL maintains a number
of databases including a list of stolen motor vehicles, lost and stolen travel documents,
DNA profiles, and photographs/fingerprint records of wanted persons. All of the data bases
are linked by the MIND/FIND internet technology such that they are instantly available to
all participants at border crossings and ports of entry. Sandler, Arce and Enders (2009)
report that INTERPOL was involved with 74 and 104 terrorist-related arrests in 2006 and
2007, respectively.
Enhanced intelligence policies can be directed at increasing π, the probability of
destroying nodes connected to the infiltrated node. We would expect π to increase in
response to those aspects of the Patriot Act directly targeting terrorists’ communications
12

links. Counterterrorism policies that influence the terrorists’ benefits from cooperation
alter the value of δ. For example, policies making it more difficult to conduct logistically
complex actions would reduce the benefits from interconnected tactics. Simple tactics, such
as the placement of bombs in railroad stations, do not require as much connectivity as
another 9/11-type event or the construction of a WMD.
Centrally planned networks
The network planner’s problem
In a centrally planned network, the network planner simultaneously chooses ei and r. Since
nodes are identical and q is concave, all of the individual effort levels will be identical
(ei = e for all i) so that the optimization problem can be written as
maxr,e
W =
(1− 1 + πr
n
)nq[(1 + δr)e]− nce. (5)
The two first-order conditions are
Wr = −πq[(1 + δr)e] +
(1− 1 + πr
n
)nq′[(1 + δr)e]δe = 0, (6)
We =
(1− 1 + πr
n
)nq′[(1 + δr)e](1 + δr)− nc = 0. (7)
Since we cannot find analytic solutions without positing explicit functional forms, we
use the implicit function theorem to determine how changes in c, δ and π will affect the
optimal levels of e and r, denoted by e∗ and r∗, respectively. Totally differentiating (6) and
(7), we obtain
13

Wrr Wre
Wer Wee
dr
de
=
Wrc Wrπ Wrδ
Wec Weπ Weδ
dc
dπ
dδ
(8)
where Wij denotes the partial derivative of Wi with respect to variable j. The second order
conditions for an interior solution require Wrr < 0,Wee < 0, and ∆ = WrrWee −W 2re > 0.
Notice that the signs of Wrr and Wee are both negative and the sign of Wre = Wer is
ambiguous. Specifically,
Wrr = −2πq′[(1 + δr)e]δe +
(1− 1 + πr
n
)nq′′[(1 + δr)e]δ2e2 < 0, (9)
Wee =
(1− 1 + πr
n
)nq′′[(1 + δr)e](1 + δr)2 < 0, (10)
Wre = −πq′[(1+ δr)e](1+ δr)+
(1− 1 + πr
n
)nδ[q′′[(1+ δr)e](1+ δr)e+ q′[(1+ δr)e]]. (11)
Although the sign of Wre is ambiguous, there are some special cases in which it is
clearly negative. For example, if the production function is such that q(x) = ln(x), then
Wre = −π/e < 0. Similarly, if the network effects can be ignored (so that δ is very close to
zero), the sign of Wre is also negative. In the limit, for δ = 0, we find that
Wre = −πq′((1 + r)e) < 0. However, it is also possible that Wre is positive. An interesting
special case occurs if the production function has the form q(x) = xα where 0 < α < 1. In
this circumstance we find Wre = 0. In general, the condition for Wre > 0 is
−q′′[(1 + δr)e]
q′[(1 + δr)e]<
1
(1 + δr)e− π
(n− 1− πr)δe(12)
14

which is true when the concavity of q, i.e., −q′′/q′, is not too large. In the analysis below,
we assume that Wre ≥ 0. This is equivalent to assuming that increased effort levels increase
the marginal product of connectivity. Nevertheless, this condition is overly strong to
contain most of our comparative statics results. The necessary condition for us to sign
most of our comparative statistic results is for ∆ = WrrWee −W 2re > 0.
Comparative statics
The effects of c: To find the effects on a change in c on the levels of effort and connectivity,
first differentiate Wrand We with respect to c in order to obtain
Wrc = 0, (13)
Wec = −n < 0. (14)
Now, if we solve (8) for the changes in r∗ and e∗ resulting from a change in c, we find
∂r∗
∂c= −WrcWee −WecWre
WrrWee −W 2re
≤ 0, (15)
∂e∗
∂c= −WrrWec −WrcWre
WrrWee −W 2re
≤ 0. (16)
Hence, any counterterrorism policy that increases the marginal cost of effort, c, will
lead to a reduction in the optimal level of effort and a reduction in the connectivity of the
network. Clearly, as the marginal cost of effort rises, it will be optimal to devote less effort
to the network. Moreover, assuming that (12) holds (so that Wre > 0), the decline in effort
means a complementary decline in r as well. Thus, policies that increase c will lead to a
reduction in total terrorism welfare because individuals devote less effort to the
15

organization and because the lower level of effort leads to a reduction in the level of
connectivity.
The effects of π: The effects of a change in the vulnerability parameter (π) can be
obtained by partially differentiating (6) and (7) with respect to π. Specifically,
Wrπ = −q[(1 + δr)e]− rq′[(1 + δr)e]δe < 0, (17)
Weπ = −rq′[(1 + δr)e](1 + δr) < 0. (18)
Solving (8) for the changes in r∗ and e∗ resulting from a change in π, we find
∂r∗
∂π= −WrπWee −WeπWre
WrrWee −W 2re
≤ 0, (19)
∂e∗
∂π= −WrrWeπ −WrπWre
WrrWee −W 2re
≤ 0. (20)
As the network becomes less secure, the optimal strategy for the network planner
entails reducing the level of connectivity. This is the point made by Enders and Su (2007).
Moreover, as connectivity declines, the optimal level of effort declines as well.
The effects of δ: There is no simple relationship between changes in δ and changes in
the levels of network connectivity and effort. Partially differentiating (6) with respect to δ,
we obtain
Wrδ = −πq′[(1 + δr)e]re +
(1− 1 + πr
n
)n[q′′[(1 + δr)e]rδe2 + q′[(1 + δr)e]e]. (21)
The value of (21) is positive when
−q′′[(1 + δr)e]
q′[(1 + δr)e]<
1
δe
[n− 1− 2πr
r(n− 1− πr)
]. (22)
Partially differentiating (7) with respect to δ, also yields an ambiguous expression.
Consider
16

Weδ =
(1− 1 + πr
n
)nr[q′′[(1 + δr)e](1 + δr)e + q′[(1 + δr)e]]. (23)
Note that (23) is equal to zero when q(x) = ln(x), and (23) is positive when
−q′′[(1 + δr)e]
q′[(1 + δr)e]<
1
(1 + δr)e. (24)
Therefore, if (22) and (24) hold so that Wrδ,Weδ > 0, we have
∂r∗
∂δ= −WrδWee −WeδWre
WrrWee −W 2re
≥ 0, (25)
∂e∗
∂δ= −WrrWeδ −WrδWre
WrrWee −W 2re
≥ 0. (26)
Thus, the greater the importance of network externality, the greater the levels of
connectivity and effort. All of these work together to make for a high-effort, tightly
connected network. Clearly, policies that reduce the spillover effect will reduce the damage
level from this type of organization.
An example
In order to get a sense of the change in the optimal network structure due to the three
counterterrorism policies, we consider the specific case wherein the production function has
the specific form q(x) = xα for 0 < α < 1. The use of this functional form allows us to
obtain analytic solutions for the optimal levels of effort and connectivity. As such, it
becomes straightforward to provide a simulation exercise showing how the optimal solutions
of the network planner respond to counterterrorism policies. Specifically, we assume that
the network planner chooses r and e to solve the following optimization problem
17

maxr,e
W =
(1− 1 + πr
n
)neα(1 + δr)α − nce. (27)
Let r∗(π, δ, c) and e∗(π, δ, c) denote the optimal solutions for r∗and e∗ as functions of
the parameters π, δ, and c. Also let W (r∗, e∗) denote the value of the total expected welfare
of the network. The solid lines in Figure 2-4 show how these three functions respond to
changes in the policy parameters. In constructing these figures, we assumed that α = 0.5
and n = 25.8 As a practical matter, the level of connectivity must be such that r∗ takes on
an integer such that 0 < r∗ < n. In our simulation, if the solution for r∗ turned out to be
greater than n− 1, we set r∗ = n− 1 and reoptimized over e. Similarly, if the solution for
r∗ turned out to be negative, we set r∗ = 0 and reoptimized over e.
Figure 2: The Effects of Changes in c
Figure 3: The Effects of Changes in π
Figure 4: The Effects of Changes in δ
In Figure 2, we set the values of π = 0.5 and δ = 0.5 to show how e∗, r∗, and
W (r∗, e∗) respond to changes in c. Clearly, as indicated by (16), the optimal level of effort
steadily declines as c increases from one to three as shown in Panel 1. Since Wrc = 0 and,
in this special case, Wec = 0, the overall effect of a change of c on r∗, indicated by (15), is
zero as shown in Panel 2. Nevertheless, as shown in Panel 3, network welfare declines as a
result of the decreased level of effort.
In constructing Figure 3, we set the values of c = 2 and δ = 0.5. As indicated by
equation (20), the optimal level of effort shown in Panel 1 steadily declines as π increases
18
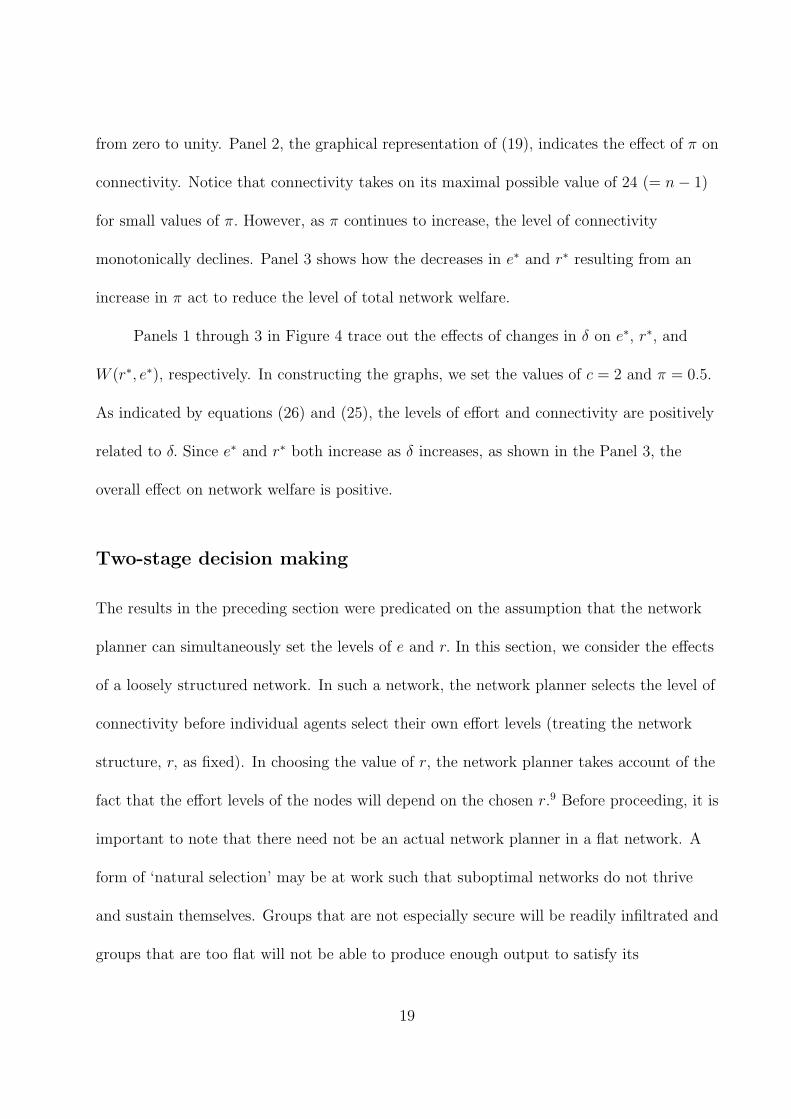
from zero to unity. Panel 2, the graphical representation of (19), indicates the effect of π on
connectivity. Notice that connectivity takes on its maximal possible value of 24 (= n− 1)
for small values of π. However, as π continues to increase, the level of connectivity
monotonically declines. Panel 3 shows how the decreases in e∗ and r∗ resulting from an
increase in π act to reduce the level of total network welfare.
Panels 1 through 3 in Figure 4 trace out the effects of changes in δ on e∗, r∗, and
W (r∗, e∗), respectively. In constructing the graphs, we set the values of c = 2 and π = 0.5.
As indicated by equations (26) and (25), the levels of effort and connectivity are positively
related to δ. Since e∗ and r∗ both increase as δ increases, as shown in the Panel 3, the
overall effect on network welfare is positive.
Two-stage decision making
The results in the preceding section were predicated on the assumption that the network
planner can simultaneously set the levels of e and r. In this section, we consider the effects
of a loosely structured network. In such a network, the network planner selects the level of
connectivity before individual agents select their own effort levels (treating the network
structure, r, as fixed). In choosing the value of r, the network planner takes account of the
fact that the effort levels of the nodes will depend on the chosen r.9 Before proceeding, it is
important to note that there need not be an actual network planner in a flat network. A
form of ‘natural selection’ may be at work such that suboptimal networks do not thrive
and sustain themselves. Groups that are not especially secure will be readily infiltrated and
groups that are too flat will not be able to produce enough output to satisfy its
19

membership and to attract new members.
The optimal level of effort
Given r chosen by the network planner, terrorist i’s optimization problem is
maxei
Ui =
(1− 1 + πr
n
)q(ei + δ
∑j∈Ni
ej)− cei. (28)
The first order condition can be written as10
(1− 1 + πr
n
)q′(ei + δ
∑j∈Ni
ej)− c = 0. (29)
We focus our analysis on an equilibrium in which each node makes the Cournot conjecture.
Since each node is identical and faces the same optimization problem, we can let e denote
the common effort level of each node. As such, (29) becomes
(1− 1 + πr
n
)q′[(1 + δr)e] = c. (30)
An analytic solution to (30) is not possible without a specific production function.
Nevertheless, it is possible to compare e to e∗, the level that a network planner would
choose. For the time being, suppose that r is given. At e∗, (7) can be written as
(1− 1 + πr
n
)q′[(1 + δr)e∗] =
c
1 + δr. (31)
Now compare (31) to (30). Of course, if δ = 0,the two equations are identical.
However, if δ > 0,the concavity of q necessitates that e∗ > e. As such, for any r , a network
planner would choose a higher level of effort than the level selected by the individual nodes.
At first, the result that the effort level selected by the individual nodes is below the
network optimum seems surprising given that the terrorists receive utility from belonging
20

to the organization. However, since each receives utility from the others’ efforts, high effort
levels from the others in the cell allow the individual to curtail his/her own effort level.
Suppose, for the time being, that the value of r and the overall size of the network, n,
are fixed. It should be clear that the envelope theorem guarantees that any policy that acts
to increase c, increase π, or decrease δ will decrease the terrorist’s expected utility. Also,
from (30), for a given value of r, an increase in c, π, and/or δ will lead to a decrease e since
the function q is concave. Any reduction in e reduces the overall level of benefit, q, of the
organization.
The optimal level of connectivity
The results in the preceding section were predicated on the assumption that the level of r
is invariant to counterterrorism policies. However, rational terrorists will alter the level of
connectivity in response to counterterrorism policies. Moreover, as can be seen from (30),
changes in r will have consequences for the level of effort of the individual nodes. The
function e(r; c, π, δ) shows how this value responds to the chosen r, given c, π, and δ. As
such, the network planner’s maximization problem is
maxr
W =
(1− 1 + πr
n
)nq[(1 + δr)e]− nce. (32)
Notice that the planner’s objective is perfectly aligned with those of individuals. Hence, we
rule out the type of behavior exhibited by al-Zarqawi. After all, it is straightforward to
show that the network will be inefficient if the different decisionmakers have different
objective functions. In our model, any differences in the effort and connectivity levels for
the two types of networks is due solely to the nature of the decision making process.
21

The first-order condition in the first stage can be written as
Wr = −πq[(1 + δr)e] +
(1− 1 + πr
n
)nq′[(1 + δr)e][δe + (1 + δr)er]− ncer = 0. (33)
Substituting (30) in (33) yields
Wr = −πq[(1 + δr)e] + ncδ(e + rer) = 0. (34)
Let r denote the solution to the network planner’s problem. Signing the responses of
r to changes in π, δ, and c is much more difficult than that for the centrally planned
network. Since the point of the paper is to illustrate the differences between the two types
of networks, we return to the example used in the previous section (i.e., so that α = 0.5
and n = 25). The dashed lines in Figures 2-4 denote the responses of r, e, and W to
counterterrorism efforts. The dashed lines in Panels 1 and 2 of Figure 3 indicate that effort
turns out to be increasing in π whereas connectivity is decreasing in π. The network
planner sees the increase in π as a threat to security and acts to decrease connectivity.
Individuals are also threatened by the increase in π, and as indicated in Section 2, for a
given value of r reduce effort (recall that for a given value of r, effort is decreasing in π).
However, given that the planner decreases r, the individual nodes are induced to devote
more overall effort to the organization. As shown in Panel 3, the net effect of the changes
in r and e must be to reduce overall network welfare.
Before proceeding, be aware that the welfare of the network with two-stage decision
making cannot exceed that of the centrally planned network. Obviously, the planner
capable of selecting both e and r can always mimic the solution of the two-stage decision
maker. Since, the reverse is not true, the maximized value of W will never exceed expected
22

welfare in the centrally planned network, W (e∗, r∗).
Conclusions
We analyzed the optimal network structure of two different types of terrorist organizations.
In the centralized network, the leadership selects the level of individual effort and the level
of group connectivity so as to maximize the expected net welfare of the organization’s
membership. In highly connected networks, information can readily flow from one member
to another and the group can perform logistically complex actions. However, connectivity
acts to compromise security so that the optimal level of connectivity will depend on the
behavior of the counterterrorism authority. Leaders in loosely-connected networks will also
seek to balance the trade-off between security and communication. However, with
decentralized decision making, the individual nodes may not make optimal decisions from
the group’s perspective. In particular, the leadership in a centralized network is able to
coordinate the activities of all network members and to take advantage of important
network externalities. In comparing the two forms, the centralized network is likely to:
• produce more overall output. The level of individual effort and the level of group
connectivity will he higher in the centralized network than in the decentralized
network.
• respond more strongly to counterterrorism efforts. As illustrated in the simulation
shown in Figures 2-4, the overall responses of the decentralized network to
counterterrorism efforts are small. The centralized leader alters effort levels and
network structure in response to changes in c, π and δ. However, in loosely structured
23

networks, the two decision makers do not coordinate their actions in that there is less
overall responsiveness of the group to changes in the economic and political
environment.
• act in a more conventional way to changing circumstances. We find more sign
ambiguity in our comparative statics for the decentralized network than for the
centralized network. This is a result of the nature of the two-stage decision making
process in decentralized networks. Notice that in Panel 1 of Figure 3, an increase in π
actually increases the effort levels of individuals in the loosely structured network. As
infiltration becomes more successful (i.e., as π increases), the connectivity in the
decentralized network declines. However, individuals take this as an incentive to
increase their effort. In the centralized network, both effort and connectivity decline
as π increases.
In an earlier version of this paper we showed that these results are not specific to the
assumption that the network is regular or to the assumption that all individuals are alike.
There are some important implications of these findings. Obviously, it is important for the
counterterrorism authorities to know the type of network they are dealing with. The
optimal counterterrorism policies depend on the structure of the terrorist organization.
Policies that may be effective in hierarchical networks may be relatively ineffective in flat
networks. In our numerical example, terrorism output in flat networks is quite responsive
to changes in c but is almost invariant to changes in π. In contrast, both policies are
effective in hierarchical networks. Nevertheless, policy makers need to be aware that their
counterterrorism efforts will induce substitutions across attack modes. Efforts that reduce
24

the connectivity of al Qaeda will also induce a substitution from sophisticated attack
modes into simple, yet deadly, bombings, armed attacks, and hostage takings.
Although it is tempting to treat the comparative static exercises in Sections 3 and 4
as being descriptive of the nature of counterterrorism policies, in our view this may not be
entirely appropriate. As al Qaeda has become more loosely connected, we believe that
there has been a switch from a relatively centralized decision making process toward a
more decentralized process. As such, the appropriate comparative static results of
counterterrorism policies are not likely to be those shown by either the solid or the dashed
lines in Figures 2-4. The implication is that increases in π, for example, have caused a
reduction of effort and connectivity because (i) connectivity and effort are negatively
related to π for a given planner and (ii) the planning process has become less centralized.
In addition to using measures that decrease δ and increase π and c, it is important to
recognize that loosely-structured networks are composed of multiple decision makers. As
illustrated by al-Zawahiri’s letter to al-Zarqawi, treating al Qaeda as a unified whole can be
a mistake. Cronin (2006) makes the point:
“It is possible that bin Laden and his lieutenants have attempted to cobble
together such disparate entities (or those entities have opportunistically
attached themselves to al-Qaida) that they have stretched beyond the point at
which their interests can be represented in this movement. ... The key is to
emphasize the differences with al-Qaida’s agenda and to drive a wedge between
the movement and its recent adherents.”
25

Cronin’s point is relevant in circumstances in which the multiplicity of decision
makers do not share the same objective function. Yet, even if they have identical
preferences, our model shows that different decision makers may not be able to internalize
important network externalities. As such, it makes sense for the counterterrorism
authorities to enhance the devolution of al Qaeda’s network structure. Given the group’s
size, exploiting fissures between the different decision makers will only make it more
difficult for it to engage in logistically complex actions and to capture network externalities.
26

Notes
1. Siqueira and Sandler (forthcoming) consider the optimal delegation problem for the
leadership when there are several groups. Feinstein and Kaplan (2010 [this issue])
consider a model of a strategic terror organization that plans attacks over multiple
periods to maximize its growth.
2. The Arabic letter and an English translation were released on October 11, 2005 by
the Director of National Intelligence. The text uses the English translation available
at http://www.dni.gov/press releases/20051011 release.htm
3. The density of a network can be defined as the number of actual links divided by the
maximum number of all possible links.
4. In our model, terrorist nodes do not choose their own levels of connectivity. Instead,
there exists a network planner who makes this decision.
5. Note that individuals are not altruistic in the sense that they derive utility from
others’ consumption or output levels. Instead, our model is designed to capture a
positive externality from others’ efforts that spill over into the individual’s production
level. The spill-over effect, measured by δ, is assumed to be less than unity.
6. Of course, there is a potential inefficiency in a highly connected network because of
congestion effects. We assume ∂q∂r
> 0 so that the connectivity benefits exceed the
congestion costs. No planner would choose a level of connectivity such that ∂q∂r
< 0.
7. Such an assumption is most plausible if it takes time to annihilate cells. An
27

alternative assumption is to allow a successful infiltration of node j to compromise j,
all nodes connected to j, and with some probability less than unity, the cells
connected to this latter set of cells. In this scenario, the infiltration of j could
annihilate i even though i and j are not connected. However, nothing of substance
would be changed as long as π < 1.
8. The general shapes of the functions shown in the figure are not altered by variations
in α and n. A RATS program that can calculate values of e∗(π, δ, c), r∗(π, δ, c), and
W (r∗, e∗) for alternative values of α and n is available from the authors.
9. Of course, it would be possible to allow effort levels to be set prior to the level of
connectivity. However, it hardly seems likely that individuals join the network and
then the network planner chooses the level of connectivity.
10. We assume that node i treats the values of ej as being fixed.
28

References
Arquilla, John, David Ronfeldt, and Michele Zanini. 1999. Networks, netwar, and
information-age terrorism. In Countering the new terrorism, edited by Ian Lesser,
Bruce Hoffman, Arquilla, John, David Ronfeldt, and Michele Zanini, 39-84. Santa
Monica, CA: RAND.
Baccara, Mariagiovanna, and Heski Bar-Isaac. 2009. Interrogation methods and terror
networks. In Mathematical methods in counterterrorism, edited by Nasrullah Memon,
Jonathan D. Farley, David L. Hicks, and Torben Rosenorn, 271-290. New York, NY:
Springer.
Ballester, Coralio, Antoni Calvo-Armengol, and Yves Zenou. 2006. Who’s who in
networks. Wanted: The key player. Econometrica 74 (5): 1403-1417.
Bramoulle, Yann, and Rachel Kranton. 2007. Public goods in networks. Journal of
Economic Theory 135 (1): 478-494.
British Broadcasting Company. 2005. Jordan ‘not afraid’ after bombs.
http://news.bbc.co.uk/2/hi/middle east/4426458.stm. (accessed May 1, 2009).
Cronin, Audrey. 2006. How al-Qaida ends: The decline and demise of terrorist groups.
International Security 31 (1): 7-48.
Enders, Walter, and Todd Sandler. 2006. The political economy of terrorism. Cambridge,
England: Cambridge University Press.
29

Enders, Walter, and Xuejuan Su. 2007. Rational terrorists and optimal network
structure. Journal of Conflict Resolution 51 (1): 33-57.
Feinstein, Jonathan S., and Edward H. Kaplan. 2010. Analysis of a strategic terror
organization: Attacks, evolution, and counter-terrorism response. Journal of Conflict
Resolution 54 (): this issue.
Letter from al-Zawahiri to al-Zarqawi. English translation available at
http://www.dni.gov/press releases/20051011 release.htm. (accessed May 1, 2009).
Sandler, Todd, Dann Arce, and Walter Enders. 2009. An evaluation of INTERPOL’s
counterterrorism linkages and technology. mimeo. University of Texas at Dallas
working paper.
Siqueira, Kevin, and Todd Sandler. Forthcoming. Terrorist networks, support, and
delegation. Public Choice.
30

���� �������������� � ���������� � � ����������� � � ������ � � �������Figure 1: Regular Networks (n, r)
31

Figure 4: The Ef f ects of Changes in c
e
r
W(e,r)
Values of c
Panel 1: Effects on e
1.0 1.5 2.0 2.5 3.0
0.0
0.2
0.4
0.6
0.8
1.0
Panel 2: Effects on r
1.0 1.5 2.0 2.5 3.0
2.5
5.0
7.5
10.0
12.5
15.0
Panel 3: Effects on W(e,r)
1.0 1.5 2.0 2.5 3.0
0.1
0.2
0.3
0.4
0.5
0.6
0.7
0.8
0.9
1.0
Figure 2: The Effects of Changes in c
32

Figure 2: The Effects of Changes in pi
e
r
W(e,r)
Values of pi
Panel 1: Effects on e
0.0 0.2 0.4 0.6 0.8 1.0
0.0
0.1
0.2
0.3
0.4
0.5
0.6
0.7
0.8
Panel 2: Effects on r
0.0 0.2 0.4 0.6 0.8 1.0
0
5
10
15
20
25
Panel 3: Effects on W(e,r)
0.0 0.2 0.4 0.6 0.8 1.0
0.00
0.25
0.50
0.75
1.00
1.25
1.50
Figure 3: The Effects of Changes in π
33

Figure 3: The Ef f ects of Changes in delta
e
r
W(e,r)
Values of delta
Panel 1: Effects on e
0.0 0.2 0.4 0.6 0.8 1.0
0.00
0.05
0.10
0.15
0.20
0.25
0.30
0.35
0.40
0.45
Panel 2: Effects on r
0.0 0.2 0.4 0.6 0.8 1.0
0
2
4
6
8
10
12
14
16
Panel 3: Effects on W(e,r)
0.0 0.2 0.4 0.6 0.8 1.0
0.1
0.2
0.3
0.4
0.5
0.6
0.7
0.8
0.9
Figure 4: The Effects of Changes in δ
34