Network-based microsynteny analysis identifies major ...
10
Network-based microsynteny analysis identifies major differences and genomic outliers in mammalian and angiosperm genomes Tao Zhao a and M. Eric Schranz a,1 a Biosystematics Group, Wageningen University & Research, 6708PB Wageningen, The Netherlands Edited by Scott V. Edwards, Harvard University, Cambridge, MA, and approved December 19, 2018 (received for review February 1, 2018) A comprehensive analysis of relative gene order, or microsynteny, can provide valuable information for understanding the evolu- tionary history of genes and genomes, and ultimately traits and species, across broad phylogenetic groups and divergence times. We have used our network-based phylogenomic synteny analysis pipeline to first analyze the overall patterns and major differences between 87 mammalian and 107 angiosperm genomes. These two important groups have both evolved and radiated over the last ∼170 MYR. Secondly, we identified the genomic outliers or “rebel genes” within each clade. We theorize that rebel genes potentially have influenced trait and lineage evolution. Microsynteny net- works use genes as nodes and syntenic relationships between genes as edges. Networks were decomposed into clusters using the Infomap algorithm, followed by phylogenomic copy-number profiling of each cluster. The differences in syntenic properties of all annotated gene families, including BUSCO genes, between the two clades are striking: most genes are single copy and syntenic across mammalian genomes, whereas most genes are multicopy and/or have lineage-specific distributions for angiosperms. We propose microsynteny scores as an alternative and complementary metric to BUSCO for assessing genome assemblies. We further found that the rebel genes are different between the two groups: lineage-specific gene transpositions are unusual in mammals, whereas single-copy highly syntenic genes are rare for flowering plants. We illustrate several examples of mammalian transposi- tions, such as brain-development genes in primates, and syntenic conservation across angiosperms, such as single-copy genes re- lated to photosynthesis. Future experimental work can test if these are indeed rebels with a cause. synteny networks | genome evolution | phylogenomic synteny profiling | mammals | angiosperms T he patterns and differences of gene and genome duplication, gene loss, gene transpositions, and chromosomal rearrange- ments can inform how genes and gene families have evolved to regulate and generate (and potentially constrain) the amazing biological diversity on Earth today. The wealth of fully se- quenced genomes of species across the phylogeny of mammals and angiosperms provides an excellent opportunity for compar- ative studies of evolutionary innovations underlying phenotypic adaptations (1). Phylogenetic profiling studies typically analyze the presence or absence of particular genes or gene families during the evolution of a lineage. For example, recent studies have investigated when particular gene families first evolved (2, 3) or have identified the loss of specific genes associated with a particular function (4–6). Less attention has been devoted to understanding changes in local gene position (genomic micro- collinearity or microsynteny) in a phylogenetic context. Synteny can be defined as evolutionarily conserved relationships between genomic regions. Synteny information provides a valuable framework for the inference of shared ancestry of genes, such as for assigning gene orthology relationships, particularly for large multi- gene families where phylogenetic methods may be nonconclusive (7–9). Finally, synteny data can speed the transfer of knowledge from model to nonmodel organisms. While the basic characteristics of gene and genome organi- zation and evolution are similar across eukaryote lineages, there are also significant differences that are not fully characterized or understood. The length and complexity of genes and promoters, the types of gene families (shared or lineage specific), transposon density, higher-order chromatin domains, and the organization of chromosomes differ significantly between plants, animals, and other eukaryotes (10–13). It is known that genome organization and gene collinearity is substantially more conserved in mam- mals than plants (11), and thus identifying syntenic orthologs across mammals is more feasible and straightforward than in angiosperms. However, a comprehensive, comparative, and an- alytical analysis of microsynteny of all coding genes across these two groups has not yet been established. It is an opportune moment to do so due to the rapid increase in available com- pleted genomes for these two groups. One major characteristic of flowering plant genomes is the prevalent signature of shared and/or lineage-specific whole Significance Studying the organization of genes within genomes across broad evolutionary timescales can advance our understanding of the evolution of traits and clades. We have used a network approach to investigate genome dynamics of mammals and angiosperms. In general, genome organization and gene microcollinearity is much more conserved in mammals than in flowering plants. We then identified the genomic outliers or “rebel genes,” within each clade. Genes that have moved are unusual for mammals, whereas highly conserved single-copy genes are exceptional for plants. How conservation and changes in synteny or fundamental differences in genome organization have contributed to the evolution of lineages could be a new scientific frontier. Author contributions: M.E.S. designed research; T.Z. performed research; T.Z. and M.E.S. analyzed data; and T.Z. and M.E.S. wrote the paper. The authors declare no conflict of interest. This article is a PNAS Direct Submission. This open access article is distributed under Creative Commons Attribution-NonCommercial- NoDerivatives License 4.0 (CC BY-NC-ND). Data deposition: Datasets used in this study are available at DataVerse: (https://dataverse. harvard.edu/dataset.xhtml?persistentId=doi:10.7910/DVN/BDMA7A). This includes pro- tein sequences of all annotated coding genes in FASTA format and corresponding BED/GFF files indicating gene positions of all mammal and angiosperm reference genomes, as well as the entire microsynteny network database, subset of all BUSCO genes, and cor- responding clustering results. The scripts for synteny network preparation (pairwise com- parison, synteny block detection, and data integration), network clustering and statistics, and phylogenomic profiling are available at Github (https://github.com/zhaotao1987/ SynNet-Pipeline). 1 To whom correspondence should be addressed. Email: [email protected]. This article contains supporting information online at www.pnas.org/lookup/suppl/doi:10. 1073/pnas.1801757116/-/DCSupplemental. Published online January 23, 2019. www.pnas.org/cgi/doi/10.1073/pnas.1801757116 PNAS | February 5, 2019 | vol. 116 | no. 6 | 2165–2174 EVOLUTION Downloaded by guest on December 2, 2021
Transcript of Network-based microsynteny analysis identifies major ...

Network-based microsynteny analysis identifies majordifferences and genomic outliers in mammalian andangiosperm genomesTao Zhaoa and M. Eric Schranza,1
aBiosystematics Group, Wageningen University & Research, 6708PB Wageningen, The Netherlands
Edited by Scott V. Edwards, Harvard University, Cambridge, MA, and approved December 19, 2018 (received for review February 1, 2018)
A comprehensive analysis of relative gene order, or microsynteny,can provide valuable information for understanding the evolu-tionary history of genes and genomes, and ultimately traits andspecies, across broad phylogenetic groups and divergence times.We have used our network-based phylogenomic synteny analysispipeline to first analyze the overall patterns and major differencesbetween 87 mammalian and 107 angiosperm genomes. These twoimportant groups have both evolved and radiated over the last∼170 MYR. Secondly, we identified the genomic outliers or “rebelgenes”within each clade. We theorize that rebel genes potentiallyhave influenced trait and lineage evolution. Microsynteny net-works use genes as nodes and syntenic relationships betweengenes as edges. Networks were decomposed into clusters usingthe Infomap algorithm, followed by phylogenomic copy-numberprofiling of each cluster. The differences in syntenic properties ofall annotated gene families, including BUSCO genes, between thetwo clades are striking: most genes are single copy and syntenicacross mammalian genomes, whereas most genes are multicopyand/or have lineage-specific distributions for angiosperms. Wepropose microsynteny scores as an alternative and complementarymetric to BUSCO for assessing genome assemblies. We furtherfound that the rebel genes are different between the two groups:lineage-specific gene transpositions are unusual in mammals,whereas single-copy highly syntenic genes are rare for floweringplants. We illustrate several examples of mammalian transposi-tions, such as brain-development genes in primates, and syntenicconservation across angiosperms, such as single-copy genes re-lated to photosynthesis. Future experimental work can test ifthese are indeed rebels with a cause.
synteny networks | genome evolution | phylogenomic synteny profiling |mammals | angiosperms
The patterns and differences of gene and genome duplication,gene loss, gene transpositions, and chromosomal rearrange-
ments can inform how genes and gene families have evolved toregulate and generate (and potentially constrain) the amazingbiological diversity on Earth today. The wealth of fully se-quenced genomes of species across the phylogeny of mammalsand angiosperms provides an excellent opportunity for compar-ative studies of evolutionary innovations underlying phenotypicadaptations (1). Phylogenetic profiling studies typically analyzethe presence or absence of particular genes or gene familiesduring the evolution of a lineage. For example, recent studieshave investigated when particular gene families first evolved (2,3) or have identified the loss of specific genes associated with aparticular function (4–6). Less attention has been devoted tounderstanding changes in local gene position (genomic micro-collinearity or microsynteny) in a phylogenetic context.Synteny can be defined as evolutionarily conserved relationships
between genomic regions. Synteny information provides a valuableframework for the inference of shared ancestry of genes, such as forassigning gene orthology relationships, particularly for large multi-gene families where phylogenetic methods may be nonconclusive
(7–9). Finally, synteny data can speed the transfer of knowledgefrom model to nonmodel organisms.While the basic characteristics of gene and genome organi-
zation and evolution are similar across eukaryote lineages, thereare also significant differences that are not fully characterized orunderstood. The length and complexity of genes and promoters,the types of gene families (shared or lineage specific), transposondensity, higher-order chromatin domains, and the organizationof chromosomes differ significantly between plants, animals, andother eukaryotes (10–13). It is known that genome organizationand gene collinearity is substantially more conserved in mam-mals than plants (11), and thus identifying syntenic orthologsacross mammals is more feasible and straightforward than inangiosperms. However, a comprehensive, comparative, and an-alytical analysis of microsynteny of all coding genes across thesetwo groups has not yet been established. It is an opportunemoment to do so due to the rapid increase in available com-pleted genomes for these two groups.One major characteristic of flowering plant genomes is the
prevalent signature of shared and/or lineage-specific whole
Significance
Studying the organization of genes within genomes acrossbroad evolutionary timescales can advance our understandingof the evolution of traits and clades. We have used a networkapproach to investigate genome dynamics of mammals andangiosperms. In general, genome organization and genemicrocollinearity is much more conserved in mammals than inflowering plants. We then identified the genomic outliers or“rebel genes,” within each clade. Genes that have moved areunusual for mammals, whereas highly conserved single-copygenes are exceptional for plants. How conservation and changesin synteny or fundamental differences in genome organizationhave contributed to the evolution of lineages could be a newscientific frontier.
Author contributions: M.E.S. designed research; T.Z. performed research; T.Z. and M.E.S.analyzed data; and T.Z. and M.E.S. wrote the paper.
The authors declare no conflict of interest.
This article is a PNAS Direct Submission.
This open access article is distributed under Creative Commons Attribution-NonCommercial-NoDerivatives License 4.0 (CC BY-NC-ND).
Data deposition: Datasets used in this study are available at DataVerse: (https://dataverse.harvard.edu/dataset.xhtml?persistentId=doi:10.7910/DVN/BDMA7A). This includes pro-tein sequences of all annotated coding genes in FASTA format and correspondingBED/GFF files indicating gene positions of all mammal and angiosperm reference genomes, aswell as the entire microsynteny network database, subset of all BUSCO genes, and cor-responding clustering results. The scripts for synteny network preparation (pairwise com-parison, synteny block detection, and data integration), network clustering and statistics,and phylogenomic profiling are available at Github (https://github.com/zhaotao1987/SynNet-Pipeline).1To whom correspondence should be addressed. Email: [email protected].
This article contains supporting information online at www.pnas.org/lookup/suppl/doi:10.1073/pnas.1801757116/-/DCSupplemental.
Published online January 23, 2019.
www.pnas.org/cgi/doi/10.1073/pnas.1801757116 PNAS | February 5, 2019 | vol. 116 | no. 6 | 2165–2174
EVOLU
TION
Dow
nloa
ded
by g
uest
on
Dec
embe
r 2,
202
1
genome duplications (WGDs) (14–19). In contrast, the genomesof mammals show evidence of only two shared and very oldrounds of WGD, often referred to as “2R” (20–22). The varia-tion in genomic organization between lineages is partially due todifferences in fundamental molecular processes such as DNArepair and recombination, but also likely reflect the historicalbiology of groups (such as mode of reproduction, generationtimes, and relative population sizes). Differences in gene familyand genome dynamics have significant effects on our ability todetect and analyze synteny.While the number of reference genomes is growing exponen-
tially, a major challenge is how to detect, represent, and visualizesynteny relations across broad phylogenetic context. To remedythis, we have developed a network-based approach based on thek-clique percolation method to organize and display local syn-teny (23) and applied it to understand the evolution of the entireMADS-box transcription factor family across 51 plant genomesas a proof of principle of the method (24). Such a networkmethod is well suited for analyzing large complex datasets (25,26) and is complementary to phylogenetic reconstruction meth-
ods that assume hierarchical bifurcating branching processes(27). Thus, independent and/or reciprocal changes in local genesynteny can be detected and assessed by analyzing networkclusters in a phylogenetic context (i.e., phylogenetic profiling ofsynteny clusters, what we call “phylogenomic synteny profiling”).The aim of this study is to investigate and compare the dy-
namics and properties of the entire synteny networks of all an-notated genes for mammals and angiosperms. The goal then is toidentify patterns of genome evolution that could provide insightsinto how genome dynamics have potentially contributed to traitevolution. To do so, we performed n2 times (n stands for thenumber of species used) comparisons of all annotated genes,followed by nðn+ 1Þ=2 times synteny block detection usingMCScanX (28) (Fig. 1A). All synteny blocks were integrated intoone database. Syntenic genes derived from all inter- and intraspecies comparisons are interconnected into network clusters(Fig. 1B). The entire network database contains phylogenomicsynteny trajectories of all of the annotated genes, which can befurther utilized for specific purposes such as evaluating ge-nome quality, characterizing relative syntenic strength, querying
Fig. 1. Principles and applications of network-based microsynteny analysis. (A) For the genomes of n species, n2 pairwise reciprocal all-vs.-all comparisons ofall annotated genes are performed. Gene similarity relationships and relative gene positions are then used for collinearity/microsynteny block detection foreach comparison (i.e., at least five syntenic anchor genes in a window of 20 genes). Syntenic anchor pairs were illustrated as colored boxes, black empty boxesrepresent nonsyntenic genes. All inter- and intraspecies blocks are extracted. Related blocks centered on a target locus (microsynteny block families) aretraditionally organized into parallel coordinate plots. (B) Alternatively, we connect syntenic genes into clusters where nodes are genes and edges betweenthe nodes means “syntenic”; cluster sizes depend on the number of related microsynteny blocks. (C) Network metrics and tools can then be utilized for anumber of novel applications. For example, assessing overall genome quality that can be complementary to BUSCO. Principles of genome and gene familyevolutionary dynamics across species can be inferred from network parameters such as clustering coefficients. Microsynteny network of multigene familiescan be decomposed using clustering algorithms. The clusters can then be analyzed by phylogenetic context (phylogenomic synteny profiling) to analyze genecopy number, long-term synteny conservation, and detection of lineage-specific changes in a syntenic context (i.e., gene transpositions).
2166 | www.pnas.org/cgi/doi/10.1073/pnas.1801757116 Zhao and Schranz
Dow
nloa
ded
by g
uest
on
Dec
embe
r 2,
202
1

particular gene families of interest, and phylogenomic syntenyprofiling (Fig. 1C). Synteny scores could be used as an alternativeand complementary metric to other typical genome qualitychecks such as N50 values or the Benchmarking UniversalSingle-Copy Orthologs (BUSCO). Here we used Infomap as thenetwork clustering method. Testing with various bench-markinginput networks has shown Infomap to have excellent overallperformance (29, 30). Infomap also scales better than the k-cliquepercolation method that we used in our previous study (24).The clusters produced are nonoverlapping. Furthermore, thenumber of clusters and cluster membership are determined by thealgorithm, thus making results more comparable between differ-ent networks and independent from subjective user bias.
We analyzed the syntenic properties of 87 mammalian and107 plant genomes (Fig. 2) which represent the main phyloge-netic clades for both groups (17, 31–33). There are differences inthe overall quality and completeness of the genome assembliesused, but this was a factor we wanted to analyze and assess in aphylogenetic context using synteny analysis. For mammals, thespecies used covered the three main clades of Afrotheria,Euarchontoglires, and Laurasiatheria, as well as basal groups likeOrnithorhynchus anatinus (platypus). For angiosperms, the spe-cies also cover three main groups of monocots, superasterids,and rosids, as well as basal groups such as Amborella trichopoda(Fig. 2). Some clades are more heavily represented than otherssuch as primates (human relatives) and crucifers (Arabidopsis
Fig. 2. Phylogenetic relationships of mammalian and angiosperm genomes analyzed. (A) Mammal genomes used (tree in red), highlighting the three mainplacental clades of Laurasiatherias (light-gray shading), Euarchontoglires (light-orange shading), and Afrotheria (light-blue shading). (B) Angiosperm ge-nomes used (tree in blue), highlighting the three main clades of rosids (light-red shading), superasterids (light-purple shading), and monocots (light-greenshading). The tree and clade shading is maintained in the latter figures. Mammal images courtesy of Tracey Saxby, Diana Kleine, Kim Kraeer, Lucy Van Essen-Fishman, Kate Moore, and Dieter Tracey, Integration and Application Network, University of Maryland Center for Environmental Science (ian.umces.edu/imagelibrary/).
Zhao and Schranz PNAS | February 5, 2019 | vol. 116 | no. 6 | 2167
EVOLU
TION
Dow
nloa
ded
by g
uest
on
Dec
embe
r 2,
202
1
relatives) due to research sampling biases. Mammalian and an-giosperm linages have both evolved and radiated over the last∼170 MYR (17, 31–33) and have extremely rich research com-munities and a wealth of genomic resources, thus making such acomparative study of synteny of broad interest. Furthermore, wespecifically identify unique sets of outliers between the twoclades. In mammals, lineage-specific transpositions of genes areuncommon, whereas highly conserved syntenic single-copy genesare unusual in angiosperms. Being a “rebel gene” may be a sig-nature of important or unique biological influence. The testingof this hypothesis could shed light on how genome dynamics maydrive trait and lineage evolution.
Results and DiscussionMajor Differences in Genomic Architecture Between Mammalian andAngiosperm Genomes Revealed by Pairwise Phylogenomic MicrosyntenyAnalysis. Sequenced mammalian and angiosperm genomes werepublished at various qualities, as indicated by number of scaf-folds, N50, and BUSCO (Dataset S1). Many are neither perfectlyassembled nor annotated, with some poorly assembled genomescontaining thousands of relatively small scaffolds. Since syntenydetection based on genome annotations are subject to possibleconfounding factors, we tested 20 different settings, combiningnumber of top hits for each gene (-b), and parameters ofMCScanX (-m: MAX_GAPS, -s: MACH_SIZE) (SI Appendix,Fig. S1). Compared with angiosperms, we found mammals to beless sensitive to -m and -b, which indicates greater genomecontinuity and less impact of gene duplicates. The results showthat under the same settings of -s and -m, increasing -b generallyincreases the pairwise syntenic percentages (except for mam-
mals, under b15s3m25 and b20s3m25, compared with b5s3m25and b10s3m25) (SI Appendix, Fig. S1 A and B). But this alsoleads to a decrease in the overall quality of detected syntenicblocks as reflected by the lower average clustering coefficients(SI Appendix, Fig. S1 C and D). Compared with angiospermgenomes, a lower -b for mammals generally increases the num-ber of nodes while at the same time increasing the clusteringcoefficients. Mammalian genomes are also less sensitive to -m underthe same -s (SI Appendix, Fig. S1C). Considering block quality andoverall coverage, we used the setting of b5s5m15 for mammal ge-nomes and b5m25s5 for angiosperm genomes for all subsequentsynteny network analysis.To assess the overall impact of phylogenetic distance, genome
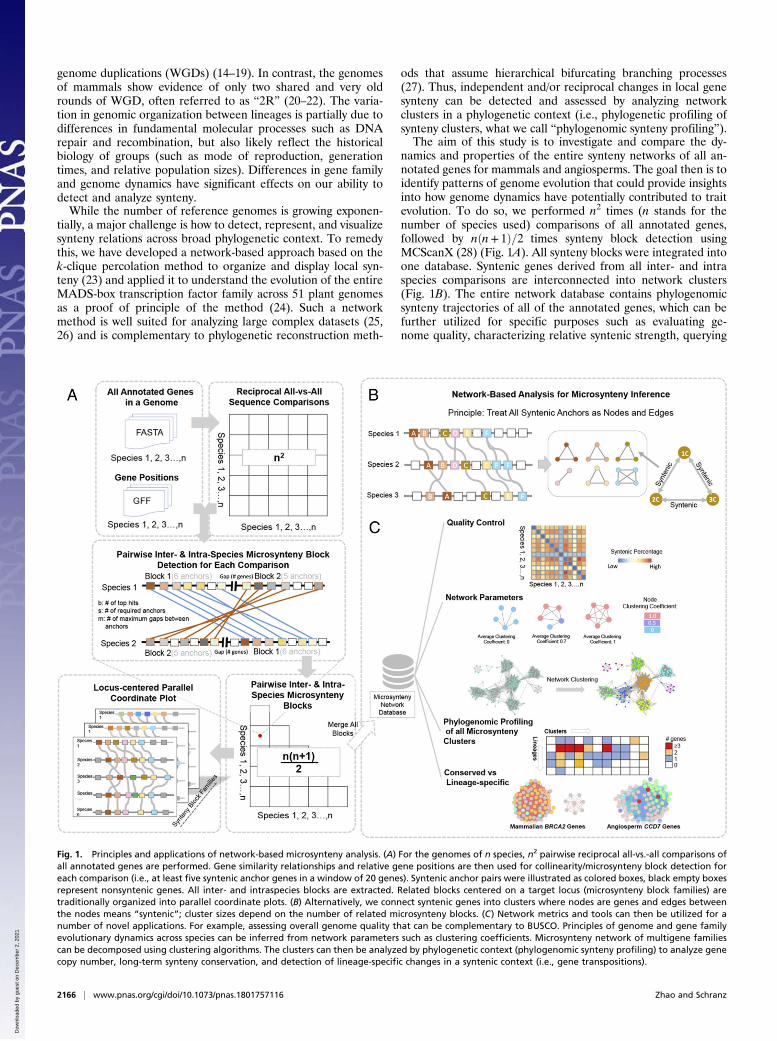
assembly quality and genome complexity, we summarized syn-tenic percentage (syntenic gene pairs plus collinear tandemgenes relative to total number of annotated genes) for all pair-wise comparisons of all annotated genes (3,828 times for mam-mals and 5,778 times for angiosperms) into color-scaled matrixes(Fig. 3) organized using the same species phylogenetic order asin Fig. 2.The diagonals of the matrixes represent self- vs. self-comparisons
and indicate the number of paralog/ohnolog pairs, that are in-dicative of recent and/or ancient WGDs (Fig. 3). The lighterorange and blue rows with fewer syntenic links could reflect keybiological or genomic differences but is much more likely to bedue to poor-quality genome assemblies that we used. Identifiedpoor-quality mammalian genomes include O. anatinus (platy-pus), Galeopterus variegatus (Sunda flying lemur), Carlito syrichta(Philippine tarsier), Manis javanica (Sunda pangolin), and Tur-siops truncates (bottlenose dolphin) (Fig. 3A), and poor-quality
Fig. 3. Pairwise collinearity/microsynteny comparisons of mammalian and angiosperm genomes. (A) Pairwise microsynteny comparisons across mammalgenomes. (B) Pairwise microsynteny comparisons across angiosperm genomes. The color scale indicates the syntenic percentage. Species are arrangedaccording to the consensus phylogeny (Fig. 2). Overall, average microsynteny is much higher across mammals than plants. Also, the detected syntenic per-centage does not show a strong phylogenetic signal. For example, contrasts are not higher for intra-Chiroptera (bats) or intra-Bovidae (cattle) than for distantpairwise contrasts. However, it is slightly higher for intraprimate contrasts, whereas, there is a much stronger phylogenetic signal seen for plant genomes suchas intra-Brassicaceae or intra-Poaceae (grasses) contrasts than for interfamilial contrasts. The method also allows for easy detection of low-quality genomes.The diagonal for both plots represents intragenome comparisons which can detect potential recent and ancient WGDs. Note, that almost all plant genomeshave higher intragenome microsyntenic pair scores than all mammal intragenome comparisons.
2168 | www.pnas.org/cgi/doi/10.1073/pnas.1801757116 Zhao and Schranz
Dow
nloa
ded
by g
uest
on
Dec
embe
r 2,
202
1

angiosperm genomes include Humulus lupulus (hop), Raphanusraphanistrum (wild radish), Triticum urartu (red wild einkornwheat), Aegilops tauschii (Tausch’s goatgrass), and Lemna minor(common duckweed) (Fig. 3B). For such species, better-qualitygenome assemblies/annotations than the ones we used (DatasetS1) hopefully will soon be available and thus improve the levelsof synteny detected.The matrices are based on all possible pairwise comparisons
between genomes without correcting for phylogenetic distance.This was done to assess the effect of phylogenetic relationshipson our results and to visualize overall differences in genomedynamics of mammals vs. angiosperms. As shown in the matrices,mammalian genomes overall are highly syntenic regardless ofphylogenetic distance (Fig. 3A and Dataset S1) and groups withmany completed genomes (such as bovines or bats) are not moreobviously interconnected to one another. However, there is aslight increase in signal for primates (Fig. 3A). Whereas plantgenomes show a stronger phylogenetic signal (e.g., grasses vs.grasses and crucifers vs. crucifers), the impact of recent WGD(e.g., Brassica napus) and more variability overall (due toassemblies/annotations from different research groups, differentqualities, and multiple independent WGDs) (Fig. 3B). Almost allplant genomes have higher intragenome syntenic pair scores thanall mammal intragenome comparisons due to the impact ofancient polyploidy.To further illustrate the utility of our computed synteny scores
for assessing genome quality, we compared it to more commonlyused genome metrics and characteristics. Specifically, we plottedthe average syntenic percentage against N50, genome size,number of scaffolds, and BUSCO (SI Appendix, Fig. S2). Wefound syntenic percentage was positively correlated to N50 andBUSCO and negatively correlated with genome size and thenumber of scaffolds (SI Appendix, Fig. S2). Mammalian genomeshave significantly higher R-squared values (0.68) betweenBUSCO and syntenic percentage than that of the angiospermgenomes (0.35) (SI Appendix, Fig. S2). Synteny scores can thusprovide alternative and complementary data for measuring andassessing genome quality, particularly for angiopsperms.
Distinct Network Properties of Phylogenomic Mammalian and AngiospermMicrosynteny Networks. The entire microsynteny networks arecomposed of all syntenic genes identified within all of the syn-tenic blocks. Specifically, there are 1,473,389 nodes (genes) and50,396,484 edges (syntenic connections between genes) formammals and 2,221,461 nodes and 47,737,321 edges for angio-sperms, respectively (Fig. 4A). The average degree and clusteringcoefficient of the networks are significantly higher for mam-mals than that for angiosperms (mean node degree 68.4 formammals compared with 43.0 for angiosperms; P < 2.2e-16Mann–Whitney U test; mean clustering coefficient 0.88 formammals compared with 0.65 for angiosperms; P < 2.2e-16Mann–Whitney U test).Fig. 4B shows the proportional degree distribution for the
entire networks for mammals and angiosperms. The metrics forthe two kingdoms are significantly different, but both distribu-tions are clearly nonlinear (the scales of the axes are loga-rithmic), which would be the shape of scale-free networks if thedistributions were governed by a power law (34). Specifically, formammals a prominent peak occurs around node degree 50–100,where the corresponding cumulative fraction of nodes peaksrapidly from less than 0.2 to nearly 1 (especially around nodedegree 70–80 which represents the number of high-qualitymammalian genomes). Such a curve indicates that most nodeshave the same number of links and thus are very well inter-connected (e.g., single-copy genes that are syntenic across allmammalian genomes). Comparatively, for angiosperms there aremore nodes of lower node degree (over 25% for nodes with nodedegree less than 10). There are no major peaks observed; however,
the distribution slightly bends from degree 10–30. Thus, there aremany smaller nodes involving fewer taxa (e.g., extensive synteny isdetected only across genomes from the same plant family).The entire synteny networks of mammals and angiosperms were
clustered into over 25,000 and 111,000 nonoverlapping clusters,respectively (Fig. 4A). We further summarized and compared theclustering results for mammals and angiosperms in terms ofcluster-size distributions, corresponding clustering coefficients,and number of species included per cluster (Fig. 4 C and D).Overall, sizes of synteny clusters from mammal and angiospermnetworks vary greatly from a minimum size of two up to thousandsof nodes (Fig. 4C). This reflects the differences and dynamics ofsynteny conservation patterns among different genes and genefamilies. For example, clusters with bigger sizes could be genesmaintained from several rounds of whole genome duplicationevents and/or tandem-duplicated arrays such as Hox genes, zincfinger proteins, and olfactory receptor genes in mammals andlectin receptor kinase genes and cytochrome P450 genes in an-giosperms (Dataset S2). In contrast, small clusters could be
Fig. 4. Network statistics for mammal (red) and angiosperm (blue) micro-synteny networks. (A) Number of total nodes, edges, and clusters. Note,compared with mammals, flowering plants have ∼1.5 times total nodes,fewer (0.94) total edges, and ∼4.5 times total number of clusters. Mammalmean node degree and clustering coefficient are significantly higher thanthat for flowering plants (***P < 2.2e-16). (B) Node degree distribution andcorresponding cumulative percentage. The majority of mammal nodes peakaround the degree 70–80. The scales of the axes are logarithmic. (C) Clustersize distribution by Infomap algorithm. Microsynteny cluster sizes vary fromtwo to several thousand. (D) Corresponding clustering coefficient (median)and number of species (median) under certain sizes.
Zhao and Schranz PNAS | February 5, 2019 | vol. 116 | no. 6 | 2169
EVOLU
TION
Dow
nloa
ded
by g
uest
on
Dec
embe
r 2,
202
1

lineage-specific transpositions, for which synteny is shared onlyacross a few closely related species such as transmembrane genesand keratin genes in mammals and F-box genes and NB-LRRgenes in plants (Dataset S2).Specifically, for mammals the cluster size distribution implies a
strong correlation with its degree distribution, with the highestconcentration of single-copy gene clusters around node size 70–100 (Fig. 4C). To the right, there is a second modest peak ofduplicated (ohnolog) genes due to the ancient 2R WGD events(Fig. 4C). These peaks can be further understood by analyzingthe corresponding average clustering coefficient and number ofspecies relative to cluster size (Fig. 4D). We observe that the firstpeak is accompanied by a steady increasing trend of the clus-tering coefficient and the number of species involved (Fig. 4D).On the far left there is the rather modest proportion of lineage-specific genes, involving fewer species. Larger multigene familiesare found to the right where the number of species involved staysfairly constant but a general decrease in clustering coefficient isobserved (Fig. 4D).In contrast, angiosperm genomes show a very large proportion
of lineage-specific clusters on the far left (Fig. 4C). For example,there are around 49,000 two-node clusters, accounting for ∼4.4%of the total nodes. Clusters with sizes ∼10–30, are mostly lineagespecific as indicated by increased clustering coefficient (Fig. 4D).The size range reflects the number of species and gene copieswithin particular phylogenetic groups such as Fabaceae, Brassi-caceae, and Poaceae. Next, a rather broad peak of gene clustersis observed that are conserved across many lineages (Fig. 4C) ofgenes that are single copy in some lineages and in two/morecopies in other lineages due to WGD. Also, there is a largerproportion of large multigene families seen to the far right.
Phylogenomic Synteny Profiling of All Gene Families Based onMicrosynteny Networks Identifies Different Patterns of Conservationand Divergence. To classify conserved vs. specific genomic contexts,we profiled the patterns of gene copy number (0, 1, 2, and ≥3)across lineages and species of all of the clusters of mammals andangiosperms (Fig. 5 A and B). Blue columns indicate conserved
single-copy syntenic clusters, orange columns indicate retainedduplicate-copy clusters (i.e., conserved ohnologs from WGD),and the red columns signify conserved clusters with more thantwo copies (Fig. 5 A and B). Nearly empty rows of the less-syntenic species are consistent with the pairwise matrix in Fig.3, very likely due to poor genome quality (SI Appendix, Fig. S2and Dataset S1).For mammals, a very large proportion (∼66%) of all clusters
are largely syntenic and single copy (Fig. 5A) across all specieswith high-quality genomes. A smaller proportion of clusters(∼3.2%) are conserved and syntenic for duplicates derived fromthe 2R events or larger conserved multigene families (colored inred), for example gene clusters like the well-known Hox-geneclusters. We also detected lineage-specific clusters (∼23%) formammalian clades with multiple species represented such asprimates (including human, chimpanzee, macaque, and monkey),Rodentia (including hamster, mouse, and rat), Chiroptera (includingbats and flying foxes), Felidae (including tiger, cheetah, and thehouse cat), Camelidae (including camels and alpaca), and Bovidae(including yak, cow, sheep, and goat) (Fig. 5A). These lineage-specific transpositions in mammals are the genomic outliers.In contrast, for angiosperms only ∼8.7% of clusters are syn-
tenically conserved between eudicot and monocot species (Fig.5B). Strikingly, the remaining clusters are mostly lineage-specificclusters that appear as discrete columns (Fig. 5B). This indicatesthat angiosperm genomes are highly fractionated and reshuffled,with abundant examples of specific clusters for particular phy-logenetic lineages/plant families, such as Amaranthaceae (in-cluding quinoa, spinach, beet, and grain amaranth), Brassicaceae(including Arabidopsis, cabbage, and radish), Poaceae (includingwheat, barley, rice, and maize), Fabaceae (including soybean,mung bean, red clover, and medicago), Rosaceae (includingapple, peach, pear, and strawberry), and Solanaceae (includingtomato, potato, pepper, petunia, and tobacco) (Fig. 5B). Suchspecific clusters were caused by transpositions and/or fraction-ation after WGD, which leads to changes/movements of genomiccontext. Results also highlight species with more gene copies percluster (e.g., orange/red rows), likely due to recent WGD events
Fig. 5. Phylogenomic synteny profiling of mammal and angiosperm genomes. (A) Phylogenomic synteny profiling (copy-number profiling of microsyntenyclusters across a phylogeny) of all mammalian clusters (size ≥ 3). Groups of lineage-specific clusters are boxed and labeled. (B) Phylogenomic synteny profilingof all angiosperm clusters (size ≥ 3). Groups of lineage-specific clusters are boxed and labeled. Black arrows mark nearly empty rows which indicate a poorgenome quality. Overall, mammals have mostly syntenic (conserved) and single-copy genes, whereas angiosperms have many multicopy and/or lineage-specific microsynteny clusters.
2170 | www.pnas.org/cgi/doi/10.1073/pnas.1801757116 Zhao and Schranz
Dow
nloa
ded
by g
uest
on
Dec
embe
r 2,
202
1
such as forGlycine max, B. napus, and Populus trichocarpa (Fig. 5B).Thus, we observe a dramatically different pattern of genomic out-liers in angiosperms than in mammals. It is the single-copy highlysyntenic genes that represent the gene rebels in flowering plants.In our earlier proof-of-principle publication, we analyzed the
plant MADS-box gene family for angiosperms (24). The home-odomain family is a large multigene family in both plants andanimals, playing critical roles in development, including the well-known Hox-gene clusters in animals. As a comparative exampleof an entire gene family for both mammals and plants, we givethe complete homeodomain (35, 36) gene families for bothlineages (SI Appendix, Fig. S3). We clearly show and verify thatthe mammalian Hox genes appear as interconnected syntenysuperclusters and also find synteny connections to the ParaHoxgenes, consistent with the numerous previous reports (37–39) (SIAppendix, Fig. S3). In contrast, for plants we did not find anyprominent tandem origin of homeobox clades but did identifyseveral examples of WGD-derived gene expansions and family-specific transpositions (SI Appendix, Fig. S3).
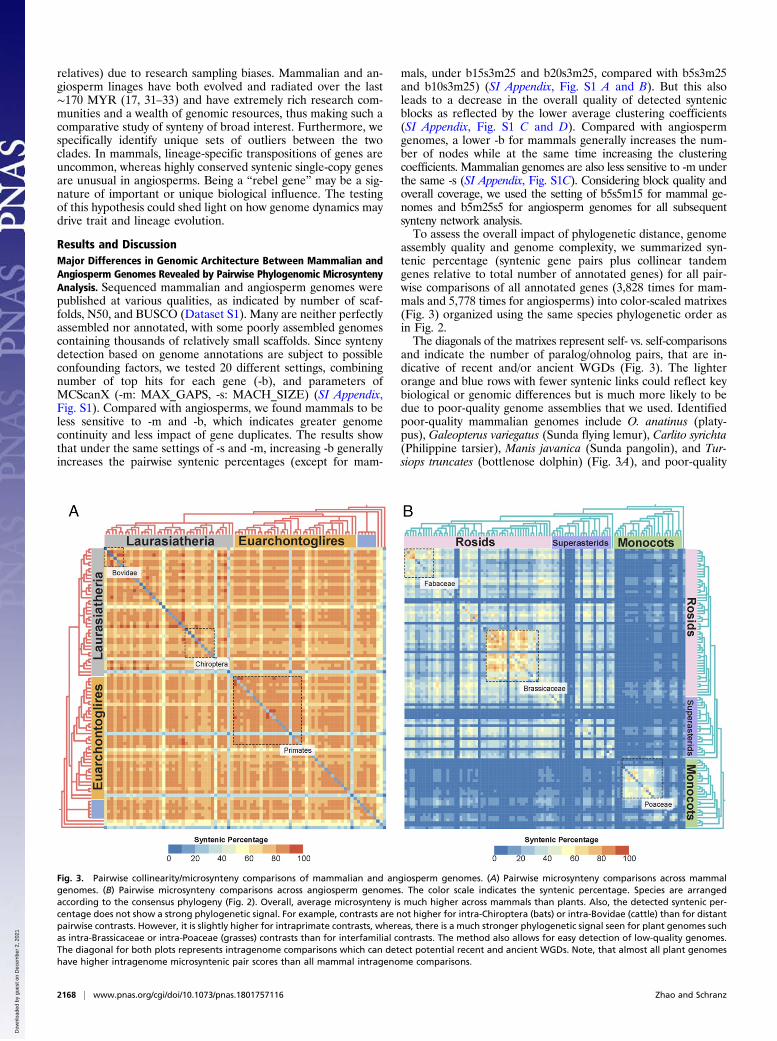
Syntenic Properties of Mammal and Angiosperm BUSCO Genes.BUSCO genes are near-universal single-copy orthologs fromOrthoDB (https://www.orthodb.org/), which are used to assessgenome qualities and also as candidates for large-scale phylo-genetic studies (40). Thus, investigating their positional historycan provide complementary data for evolutionary studies. Weidentified candidate orthologous genes of 4,104 (mammalia_odb9)and 1,440 (embryophyta_odb9) benchmarking BUSCOs (genefamilies) for mammals and angiosperms from our dataset (Data-set S3). Although many BUSCO families are conserved as single-copy number and syntenic across species, we find many examplesof both copy-number variation and of changes in genomic contextacross the phylogenies (i.e., multiple synteny clusters).We use the number of synteny clusters to overall characterize
synteny properties of BUSCOs. For example, if a BUSCO familyis syntenic across all species, it would belong to only one syntenycluster. Overall 87.5% of mammal BUSCO families belong toonly one synteny cluster and 11.8% of mammal BUSCO familieshave two clusters (Fig. 6A, Left and Dataset S4). Comparatively,only 11.9% of the plant BUSCO families have only a single
synteny cluster. A total of 20.6% plant BUSCOs have two clus-ters, 19.5% plant BUSCOs have three clusters, and 21% plantBUSCOs have over five clusters (here no restriction to clustersizes, minimum two nodes) (Fig. 6B, Left and Dataset S4).Changes in genomic context of benchmarking genes can provideimportant new complementary information for researchers usingBUSCO genes to assess genome quality and for evolutionarystudies. In particular, rebel genes could be particularly infor-mative. Namely, two or more synteny clusters in mammals areless common whereas single-copy synteny clusters are unusualfor angiosperms.We highlight several examples of rebel genes that potentially
have contributed to trait and lineage evolution. For mammals,we show lineage-specific gene transpositions (two synteny clusterBUSCO) with important functions. A gene that is transposed toa new genomic context could easily lead to new mechanisms ofgene molecular evolution and/or regulation. For example, wefound BREAST CANCER 2 (BRCA2) and Transformation/Transcription Domain Associated Protein (TRRAP) genes formlineage-specific clusters for Chiroptera species (including all ninebat genomes used in this study: Myotis brandtii, M. davidii, M.lucifugus, Miniopterus natalensis, Eptesicus fuscus, Hipposiderosarmiger, Rhinolophus sinicus, Pteropus alecto, and P. vampyrus)[Fig. 6A, Right, cluster 4171(BRCA2) and cluster 4120 (TRRAP)in Dataset S4]. Both of the genes are known oncogenes also withroles in normal development (41–45). Zhang et al. (46) hy-pothesized that the evolution of flight in bats is linked to changesin metabolic capacity which would also require changes to DNArepair and DNA checkpoint genes, such as BRCA2 which theyreported to be positive selection. Interestingly, TRRAP alsolinks to the DNA repair pathway (45, 47). Such lineage-specifictranspositions of key genes like BRCA2 and TRRAP potentiallyhave facilitated the adaptive evolution of flight in bats.We also found primate-specific clusters, including MPHOSPH10
(CT90) andCENPJ (CPAP) [Fig. 6A,Right, cluster 4097 (MPHOSPH10)and cluster 4104 (CENPJ) in Dataset S4]. MPHOSPH10 is anM-phase phosphoprotein 1 that localizes to the nucleolus and hasbeen associated with the progression of some cancers (48). CENPJ(centromere protein J) is needed for normal spindle morphology
Fig. 6. Overall microsynteny conservation and examples of mammal and plant BUSCO genes. (A) Bar plot shows overall percentage of mammal BUSCOs thatbelong to certain number of synteny clusters. Most mammal BUSCO genes belong to only one synteny cluster. Examples of mammal BUSCO families whichhave two clusters are highlighted, including the oncogenes BRCA2 and TRRAPP (Chiroptera specific), MPHOSPH10 and CENPJ are associated with cell-divisionsand possibly brain development (primate specific), and the peptide hormone angiotensin AGT and MRPL19 (Bovidae specific). (B) Bar plot shows overallpercentage of plant BUSCOs that have certain number of synteny clusters. Examples are highlighted of BUSCO gene families that belong to one syntenycluster, which are involved in hormone signaling (CCD7 and SNX1) and photosynthesis (VTE1, CHLG, ObgC, and PNSL4). Node colors indicate lineages whichare consistent with Fig. 3. Nodes for Vitis vinifera (basal rosids), Nelumbo (basal eudicots), and Amborella (basal angiosperm) are labeled red. Node labels areletter-coded species names which can be found in Dataset S1.
Zhao and Schranz PNAS | February 5, 2019 | vol. 116 | no. 6 | 2171
EVOLU
TION
Dow
nloa
ded
by g
uest
on
Dec
embe
r 2,
202
1

and it is involved in microtubule disassembly at the centrosome.Interestingly, changes in brain organization and brain size havebeen linked to changes in cell numbers and divisions, includingspecifically linked to CENPJ (49, 50). Primates have relativelylarger brains compared with other mammals (51, 52). Note, twogenes flanking CENPJ (namely RNF17 and ATP12A) arecotransposed in primates [cluster 16942 (RNF17) and cluster14351 (ATP12A) in Dataset S2]. The unique genomic context ofprimate genes potentially facilitated new and/or altered regulatorypatterns and gene functions.As a third set of mammalian rebel genes, we show Bovidae-
specific clusters for AGT (also known as ANHU; SERPINA8;hFLT1) and MRPL19 genes [Fig. 6A, cluster 4162 (AGT) andcluster 4159 (MRPL19) in Dataset S4]. AGT encodes the peptidehormone angiotensin that helps maintain blood pressure, bodyfluids, and electrolyte homeostasis (53, 54). It has been linked toboth the control of thirst and to ovulation in cattle and sheep.MRPL19 encodes a component of the mitochondrial large ri-bosomal subunit (mt-LSU) and is tightly linked to another genethat is also transposed (Dataset S4), GCFC2/C2orf3, that hasrecently been reported to be involved in intron splicing (55). TheMRPL19-C2orf3 gene pair is associated with dyslexia in humans(56, 57). How and if the transposition of angiotensin anddyslexia-related genes have affected bovines is unknown, buthopefully our results will generate hypotheses to be tested.While changes in synteny patterns such as lineage-specific
transpositions are the exception in animals, conserved syntenyof single-copy genes are the rebel genes in flowering plants.For plant BUSCO gene families, we observed only 11.8% ofangiosperm-wide conserved synteny clusters, for example, clus-ters for CCD7 (cluster 280) andSNX1 (cluster 27) genes (Fig. 6Band Dataset S4). CCD7 (or MAX3) is required for the bio-synthesis of strigolactones which are phytohormones synthesizedfrom carotenoids and stimulate branching in plants and thegrowth of symbiotic arbuscular mycorrhizal fungi in the soil (58,59). SNX1 (SORTING NEXIN 1) plays a role in vesicular pro-tein sorting and acts at the crossroads between the secretory andendocytic pathways. Arabidopsis thaliana SNX1 is involved in theauxin pathway by transporting PIN2 (60, 61).GO enrichment analysis of the single-copy conserved syntenic
BUSCO genes identified chloroplast-related genes as the mostsignificantly enriched GO term (SI Appendix, Fig. S4), for ex-ample, VTE1 (cluster 329), CHLG (cluster 23), ObgC (cluster233), and PNSL4 (cluster 256) genes (Fig. 6B and Dataset S4).VTE1 involved in the synthesis of both tocopherols and toco-trienols (vitamin E), which protect photosynthetic complexesfrom oxidative stress (62, 63). CHLG encodes a protein involvedin one of the final steps in the biosynthesis of chlorophyll a (64).ObgC is the plant homolog of the bacterial Obg gene and en-codes a GTP-binding protein involved in membrane biogenesisand protein synthesis in the chloroplast. ObgC is localized inchloroplast and is essential for early embryo development. Dis-ruption in this locus results in embryonic lethality (65, 66).PNSL4 encodes a subunit of the chloroplast NAD(P)H dehydro-genase (NDH) complex which mediates photosystem I (PSI) cyclicand chlororespiratory electron transport in higher plants (67).That chloroplast and photosynthesis-related genes are highlyconserved across angiosperms highlights just how important thisplant-specific organelle is for the success of plants, and suggestsnew possibilities to study links between plastid function andphotosynthesis to conserved patterns of gene regulation (such ascircadian regulation).Previous work has shown how both gene positional conserva-
tion and dynamism can directly affect the evolution and devel-opment of individuals, species, and/or lineages. Phylogeneticprofiling of genomic data has identified patterns of loss thatcorrelate with phenotypic changes. For example, gene losses inbats were associated with shifts in diet (4) and gene losses in
plants were associated with the loss of interactions with benefi-cial fungi (mycorrhizae) and/or bacteria (such as Rhizobia) (5, 6,68). Nearly everyone appreciates and understands how rapidchanges in genomic context of particular genes (such as bychromosomal breaks) can directly lead to many cancers (69–71).At the other extreme, the relative gene order and function ofHox genes is highly conserved across most animals and embryodevelopment. There is also an increased appreciation of genomicchanges that are unique to a species, such as for humans, thathave affected our evolutionary trajectory (72).Our analysis detected long-term conservation and lineage-
specific changes in relative genomic context of genes acrossbroad phylogenetic groups. How conservation and changes insynteny or fundamental differences in genome organization havecontributed to the evolution of lineages could be a scientific fron-tier. For example, our results could be integrated with approachesexamining evolutionary changes in the three-dimensional genomicenvironment, patterns of histone modifications throughout thenucleus, and transcriptional regulation (73, 74). We specificallyhighlighted rebel lineage-specific gene transpositions in mammalsand conserved syntenic single-copy genes in angiosperms. Examplesin this study are just the tip of the iceberg. Much remains to beexplored. This study provides a foundation for future investigationsof, for example, other phylogenetic groups, deeper evolutionarytimescales, and to test if rebel genes do in fact have a cause.
MethodsGenome Resources. All reference genomes were downloaded from publicrepositories, including NCBI, Ensembl, CoGe, and Phytozome (Dataset S1). Foreach genome, we downloaded FASTA format files containing protein se-quences of all predicted gene models and the genome annotation files (GFF/BED) containing the positions of all of the genes. We modified all peptidesequence files and genome annotation GFF/BED files with correspondingspecies abbreviation identifiers. An in-house script was used for batchdownloading genomes and modifying gene names. We analyzed 87 mam-malian genomes, presented according to the consensus species tree adoptedfrom NCBI taxonomy (Fig. 2 and Dataset S1) which included 1 Prototheria(O. anatinus), 1 Metatheria (Sarcophilus harrisii), 1 Xenarthra (Dasypus novem-cinctus), 6 Afrotheria, 38 Euarchontoglires, and 40 Laurasiatheria species.For angiosperms, we analyzed 107 genomes, including 1 Amborellaceae(A. trichopoda), 26 monocots (including 14 Poaceae), 80 eudicots [including 1Proteales (Nelumbo nucifera), 23 superasterids (asterids and caryophyllales),and 56 rosids] (Fig. 2 and Dataset S1).
BUSCO completeness of each genome was performed using BUSCO v3.0(40). Each genome containing all protein sequences was searched againstplant (embryophyta_odb9, 1440 BUSCOs) or mammalian (mammalia_odb9,4404 BUSCOs) reference databases.
Pairwise Comparison, Synteny Block Detection, and Network Construction.DIAMOND (75) was used to perform all inter- and intrapairwise all-vs.-allprotein similarity searches (default parameters). In total, 7,569 and 11,449whole genome comparisons (focused on protein-coding regions) were per-formed for 87 mammal genomes and 107 plant genomes. MCScanX (28) wasused for pairwise synteny block detection, which is 3,828 times for mammalsand 5,778 times for plants. We changed three main parameters: number oftop homologous pairs for the input (-b: 5, 10, 15, and 20), number of maxgene gaps (-m: 15, 25, and 35), and number of minimum matched syntenicanchors (-s: 3, 5, and 7), and performed microsynteny block detection under20 different parameter settings, to check the impact to outputting syntenyblocks. For each parameter, we also supplemented tandem duplicated genesthat have been originally collapsed for the sake of microsynteny detection(28). This was performed by the script of “detect_collinear_tandem_arrays”of the MCScanX toolkit.
Each pairwise syntenic percentage was calculated using the number ofsyntenic pairs plus the number of collinear tandem genes relative to thenumber of all annotated genes.Wemerged syntenic gene pairs from all inter-and intraspecies synteny blocks into one two-columned tabular-format file,which can serve as an undirected synteny network/graph and be furtheranalyzed or visualized in various tools [such as “igraph” (R package), Cyto-scape, and Gephi, etc.]. In this synteny network, nodes are genes, edgesstand for syntenic relationships between nodes, and edge lengths in this
2172 | www.pnas.org/cgi/doi/10.1073/pnas.1801757116 Zhao and Schranz
Dow
nloa
ded
by g
uest
on
Dec
embe
r 2,
202
1

study have no meaning (unweighted). Further details can be referred to inGithub tutorial (https://github.com/zhaotao1987/SynNet-Pipeline).
We summarized pairwise syntenic percentages under different settings formammalian genomes and angiosperm genomes (SI Appendix, Fig. S1 A andB, respectively). Also, we compared the total number of nodes against av-erage clustering coefficient of the microsynteny network under each of theparameter settings (SI Appendix, Fig. S1 C and D).
Network Statistics. Network statistical analysis was carried out in the R en-vironment (www.r-project.org), using the R package “igraph” (76). Weperformed the analysis of the networks of mammal genomes and angio-sperm genomes separately. The entire network must first be simplified toreduce duplicated edges (same syntenic pair may be derived from multipledetections), followed by the calculation of clustering coefficient, and nodedegree of each node.
Network Clustering and Copy-Number Profiling of All Clusters. We used theInfomap method integrated in igraph to split the entire network, consistingof millions of nodes, into clusters (77). Clustering results were determined by
topological edge connections; edges were unweighted and undirected. Allmicrosynteny clusters were decomposed into numbers of involved syntenicgene copies in each genome. Dissimilarity index of all clusters was calculatedusing the “Jaccard” method of the vegan package (78), then hierarchicallyclustered by “ward.D,” and visualized by “pheatmap.” We illustrate all ofthe clusters of mammals and angiosperm, respectively, with cluster sizeover 2.
GO Functional Enrichment. GO analysis was performed for highly syntenicplant BUSCO genes. We regarded microsynteny clusters containing genesfrom 70+ of the 107 plant genomes in a single cluster as highly syntenicmicrosynteny clusters. Representative Arabidopsis genes from these clusterswere used to identify enriched GO terms using agriGO (bioinfo.cau.edu.cn/agriGO/) (79).
ACKNOWLEDGMENTS. We thank Kitty Vijverberg, Klaas Bouwmeester,three anonymous reviewers, and the editor for constructive suggestionsand ideas for improving the manuscript. T.Z. was supported by the ChinaScholarship Council (201306300016).
1. O’Brien SJ, et al. (1999) The promise of comparative genomics in mammals. Science286:458–462, 479–481.
2. Pellegrini M, Marcotte EM, Thompson MJ, Eisenberg D, Yeates TO (1999) Assigningprotein functions by comparative genome analysis: Protein phylogenetic profiles. ProcNatl Acad Sci USA 96:4285–4288.
3. Domazet-Lo�so T, Tautz D (2010) Phylostratigraphic tracking of cancer genes suggestsa link to the emergence of multicellularity in metazoa. BMC Biol 8:66.
4. Sharma V, et al. (2018) A genomics approach reveals insights into the importance ofgene losses for mammalian adaptations. Nat Commun 9:1215.
5. Delaux P-M, et al. (2014) Comparative phylogenomics uncovers the impact of sym-biotic associations on host genome evolution. PLoS Genet 10:e1004487.
6. van Velzen R, et al. (2018) Comparative genomics of the nonlegume Parasponia re-veals insights into evolution of nitrogen-fixing rhizobium symbioses. Proc Natl AcadSci USA 115:E4700–E4709.
7. Dewey CN (2011) Positional orthology: Putting genomic evolutionary relationshipsinto context. Brief Bioinform 12:401–412.
8. Koonin EV (2005) Orthologs, paralogs, and evolutionary genomics. Annu Rev Genet39:309–338.
9. Gabaldón T, Koonin EV (2013) Functional and evolutionary implications of gene or-thology. Nat Rev Genet 14:360–366.
10. Law JA, Jacobsen SE (2010) Establishing, maintaining and modifying DNA methyl-ation patterns in plants and animals. Nat Rev Genet 11:204–220.
11. Murat F, Van de Peer Y, Salse J (2012) Decoding plant and animal genome plasticityfrom differential paleo-evolutionary patterns and processes. Genome Biol Evol 4:917–928.
12. Gladyshev EA, Arkhipova IR (2007) Telomere-associated endonuclease-deficientPenelope-like retroelements in diverse eukaryotes. Proc Natl Acad Sci USA 104:9352–9357.
13. Feng S, Jacobsen SE, Reik W (2010) Epigenetic reprogramming in plant and animaldevelopment. Science 330:622–627.
14. Adams KL, Wendel JF (2005) Polyploidy and genome evolution in plants. Curr OpinPlant Biol 8:135–141.
15. Soltis PS, Marchant DB, Van de Peer Y, Soltis DE (2015) Polyploidy and genomeevolution in plants. Curr Opin Genet Dev 35:119–125.
16. Barker MS, Arrigo N, Baniaga AE, Li Z, Levin DA (2016) On the relative abundance ofautopolyploids and allopolyploids. New Phytol 210:391–398.
17. Jiao Y, et al. (2011) Ancestral polyploidy in seed plants and angiosperms. Nature 473:97–100.
18. Cui L, et al. (2006) Widespread genome duplications throughout the history offlowering plants. Genome Res 16:738–749.
19. Jiao Y, et al. (2012) A genome triplication associated with early diversification of thecore eudicots. Genome Biol 13:R3.
20. Hokamp K, McLysaght A, Wolfe KH (2003) The 2R hypothesis and the human genomesequence. Genome Evolution (Springer, New York), pp 95–110.
21. Panopoulou G, Poustka AJ (2005) Timing and mechanism of ancient vertebrate ge-nome duplications–The adventure of a hypothesis. Trends Genet 21:559–567.
22. Steinke D, Hoegg S, Brinkmann H, Meyer A (2006) Three rounds (1R/2R/3R) of genomeduplications and the evolution of the glycolytic pathway in vertebrates. BMC Biol 4:16.
23. Zhao T, Schranz ME (2017) Network approaches for plant phylogenomic syntenyanalysis. Curr Opin Plant Biol 36:129–134.
24. Zhao T, et al. (2017) Phylogenomic synteny network analysis of MADS-box tran-scription factor genes reveals lineage-specific transpositions, ancient tandem dupli-cations, and deep positional conservation. Plant Cell 29:1278–1292.
25. Barabási A-L, Oltvai ZN (2004) Network biology: Understanding the cell’s functionalorganization. Nat Rev Genet 5:101–113.
26. Chasman D, Fotuhi Siahpirani A, Roy S (2016) Network-based approaches for analysisof complex biological systems. Curr Opin Biotechnol 39:157–166.
27. Carvalho DS, Schnable JC, Almeida AMR (2018) Integrating phylogenetic and networkapproaches to study gene family evolution: The case of the AGAMOUS family of floralgenes. Evol Bioinform Online 14:1176934318764683.
28. Wang Y, et al. (2012) MCScanX: A toolkit for detection and evolutionary analysis ofgene synteny and collinearity. Nucleic Acids Res 40:e49.
29. Lancichinetti A, Fortunato S (2009) Community detection algorithms: A comparativeanalysis. Phys Rev E Stat Nonlin Soft Matter Phys 80:056117.
30. Puxeddu MG, et al. (2017) Community detection: Comparison among clustering al-gorithms and application to EEG-based brain networks. Conf Proc IEEE Eng Med BiolSoc 2017:3965–3968.
31. Cifelli RL, Davis BM (2003) Paleontology. Marsupial origins. Science 302:1899–1900.32. Bininda-Emonds OR, et al. (2007) The delayed rise of present-day mammals. Nature
446:507–512.33. Magallón S, Gómez-Acevedo S, Sánchez-Reyes LL, Hernández-Hernández T (2015) A
metacalibrated time-tree documents the early rise of flowering plant phylogeneticdiversity. New Phytol 207:437–453.
34. Barabási A-L, Albert R (1999) Emergence of scaling in random networks. Science 286:509–512.
35. Krumlauf R (1994) Hox genes in vertebrate development. Cell 78:191–201.36. Schena M, Davis RW (1992) HD-Zip proteins: Members of an Arabidopsis homeo-
domain protein superfamily. Proc Natl Acad Sci USA 89:3894–3898.37. Lemons D, McGinnis W (2006) Genomic evolution of Hox gene clusters. Science 313:
1918–1922.38. Ferrier DE, Holland PW (2001) Ancient origin of the Hox gene cluster. Nat Rev Genet
2:33–38.39. Brooke NM, Garcia-Fernàndez J, Holland PW (1998) The ParaHox gene cluster is an
evolutionary sister of the Hox gene cluster. Nature 392:920–922.40. Simão FA, Waterhouse RM, Ioannidis P, Kriventseva EV, Zdobnov EM (2015) BUSCO:
Assessing genome assembly and annotation completeness with single-copy orthologs.Bioinformatics 31:3210–3212.
41. Wooster R, et al. (1995) Identification of the breast cancer susceptibility gene BRCA2.Nature 378:789–792.
42. King M-C, Marks JH, Mandell JB; New York Breast Cancer Study Group (2003) Breastand ovarian cancer risks due to inherited mutations in BRCA1 and BRCA2. Science 302:643–646.
43. Howlett NG, et al. (2002) Biallelic inactivation of BRCA2 in Fanconi anemia. Science297:606–609.
44. McMahon SB, Van Buskirk HA, Dugan KA, Copeland TD, Cole MD (1998) The novelATM-related protein TRRAP is an essential cofactor for the c-Myc and E2F oncopro-teins. Cell 94:363–374.
45. Murr R, et al. (2006) Histone acetylation by Trrap-Tip60 modulates loading of repairproteins and repair of DNA double-strand breaks. Nat Cell Biol 8:91–99.
46. Zhang G, et al. (2013) Comparative analysis of bat genomes provides insight into theevolution of flight and immunity. Science 339:456–460.
47. Lakin ND, Jackson SP (1999) Regulation of p53 in response to DNA damage.Oncogene 18:7644–7655.
48. Kanehira M, et al. (2007) Oncogenic role of MPHOSPH1, a cancer-testis antigen spe-cific to human bladder cancer. Cancer Res 67:3276–3285.
49. Bond J, et al. (2005) A centrosomal mechanism involving CDK5RAP2 and CENPJcontrols brain size. Nat Genet 37:353–355, and erratum (2005) 37:555.
50. Gul A, et al. (2006) A novel deletion mutation in CENPJ gene in a Pakistani family withautosomal recessive primary microcephaly. J Hum Genet 51:760–764.
51. Kudo H, Dunbar R (2001) Neocortex size and social network size in primates. AnimBehav 62:711–722.
52. Byrne RW, Corp N (2004) Neocortex size predicts deception rate in primates. Proc BiolSci 271:1693–1699.
53. Jeunemaitre X, et al. (1992) Molecular basis of human hypertension: Role of angio-tensinogen. Cell 71:169–180.
54. Zhou A, et al. (2010) A redox switch in angiotensinogen modulates angiotensin re-lease. Nature 468:108–111.
55. Yoshimoto R, Okawa K, Yoshida M, Ohno M, Kataoka N (2014) Identification of anovel component C2ORF3 in the lariat-intron complex: Lack of C2ORF3 interfereswith pre-mRNA splicing via intron turnover pathway. Genes Cells 19:78–87.
Zhao and Schranz PNAS | February 5, 2019 | vol. 116 | no. 6 | 2173
EVOLU
TION
Dow
nloa
ded
by g
uest
on
Dec
embe
r 2,
202
1
56. Eicher JD, Gruen JR (2015) Language impairment and dyslexia genes influence lan-guage skills in children with autism spectrum disorders. Autism Res 8:229–234.
57. Anthoni H, et al. (2007) A locus on 2p12 containing the co-regulated MRPL19 andC2ORF3 genes is associated to dyslexia. Hum Mol Genet 16:667–677.
58. Booker J, et al. (2004) MAX3/CCD7 is a carotenoid cleavage dioxygenase required forthe synthesis of a novel plant signaling molecule. Curr Biol 14:1232–1238.
59. Alder A, et al. (2012) The path from β-carotene to carlactone, a strigolactone-likeplant hormone. Science 335:1348–1351.
60. Jaillais Y, Fobis-Loisy I, Miège C, Rollin C, Gaude T (2006) AtSNX1 defines an endosomefor auxin-Carrier trafficking in Arabidopsis. Nature 443:106–109.
61. Kleine-Vehn J, et al. (2008) Differential degradation of PIN2 auxin efflux Car-rier by retromer-dependent vacuolar targeting. Proc Natl Acad Sci USA 105:17812–17817.
62. Porfirova S, Bergmüller E, Tropf S, Lemke R, Dörmann P (2002) Isolation of an Ara-bidopsis mutant lacking vitamin E and identification of a cyclase essential for all to-copherol biosynthesis. Proc Natl Acad Sci USA 99:12495–12500.
63. Sattler SE, Cahoon EB, Coughlan SJ, DellaPenna D (2003) Characterization of to-copherol cyclases from higher plants and cyanobacteria. Evolutionary implications fortocopherol synthesis and function. Plant Physiol 132:2184–2195.
64. Gaubier P, Wu H-J, Laudié M, Delseny M, Grellet F (1995) A chlorophyll synthetasegene from Arabidopsis thaliana. Mol Gen Genet 249:58–64.
65. Bang WY, et al. (2012) Functional characterization of ObgC in ribosome biogenesisduring chloroplast development. Plant J 71:122–134.
66. Garcia C, Khan NZ, Nannmark U, Aronsson H (2010) The chloroplast protein CPSAR1,dually localized in the stroma and the inner envelope membrane, is involved inthylakoid biogenesis. Plant J 63:73–85.
67. Peng L, Fukao Y, Fujiwara M, Takami T, Shikanai T (2009) Efficient operation ofNAD(P)H dehydrogenase requires supercomplex formation with photosystem I viaminor LHCI in Arabidopsis. Plant Cell 21:3623–3640.
68. Griesmann M, et al. (2018) Phylogenomics reveals multiple losses of nitrogen-fixingroot nodule symbiosis. Science 361:eaat1743.
69. Stephens PJ, et al. (2011) Massive genomic rearrangement acquired in a single cata-strophic event during cancer development. Cell 144:27–40.
70. Frampton GM, et al. (2013) Development and validation of a clinical cancer genomicprofiling test based onmassively parallel DNA sequencing. Nat Biotechnol 31:1023–1031.
71. Loo LW, et al. (2004) Array comparative genomic hybridization analysis of genomicalterations in breast cancer subtypes. Cancer Res 64:8541–8549.
72. O’Bleness M, Searles VB, Varki A, Gagneux P, Sikela JM (2012) Evolution of geneticand genomic features unique to the human lineage. Nat Rev Genet 13:853–866.
73. Sotelo-Silveira M, Chávez Montes RA, Sotelo-Silveira JR, Marsch-Martínez N, de Folter S(2018) Entering the next dimension: Plant genomes in 3D. Trends Plant Sci 23:598–612.
74. Yu M, Ren B (2017) The three-dimensional organization of mammalian genomes.Annu Rev Cell Dev Biol 33:265–289.
75. Buchfink B, Xie C, Huson DH (2015) Fast and sensitive protein alignment using DI-AMOND. Nat Methods 12:59–60.
76. Csardi G, Nepusz T (2006) The igraph software package for complex network re-search. Int J Complex Syst 1695:1–9.
77. Rosvall M, Bergstrom CT (2008) Maps of random walks on complex networks revealcommunity structure. Proc Natl Acad Sci USA 105:1118–1123.
78. Dixon P (2003) VEGAN, a package of R functions for community ecology. J Veg Sci 14:927–930.
79. Tian T, et al. (2017) agriGO v2.0: A GO analysis toolkit for the agricultural community,2017 update. Nucleic Acids Res 45:W122–W129.
2174 | www.pnas.org/cgi/doi/10.1073/pnas.1801757116 Zhao and Schranz
Dow
nloa
ded
by g
uest
on
Dec
embe
r 2,
202
1


![ComparativeGenomicsinPerennialRyegrass(Loliumperenne L ...downloads.hindawi.com/journals/ijpg/2011/291563.pdf · ago (MYA) [11–13]. Such gene-based microsynteny can expedite comparative](https://static.fdocuments.us/doc/165x107/5ebbde949c59a3193b5513af/comparativegenomicsinperennialryegrassloliumperenne-l-ago-mya-11a13.jpg)