Network analysis: a new approach to study endocrine disorders
15
Network analysis: a new approach to study endocrine disorders A Stevens 1,2 , C De Leonibus 1,2 , D Hanson 1,2 , A W Dowsey 1,3 , A Whatmore 1,2 , S Meyer 4 , R P Donn 5 , P Chatelain 6 , I Banerjee 1,2 , K E Cosgrove 7 , P E Clayton 1,2 and M J Dunne 7 1 Faculty of Medical and Human Sciences, Institute of Human Development, University of Manchester, Manchester, UK 2 Manchester Academic Health Science Centre, Royal Manchester Children’s Hospital, Central Manchester University Hospitals NHS Foundation Trust, 5th Floor, Oxford Road, Manchester M13 9WL, UK 3 Paediatric and Adolescent Oncology, The University of Manchester, Manchester M13 9WL, UK 4 Stem Cell and Leukaemia Proteomics Laboratory, School of Cancer and Imaging Sciences, The University of Manchester, Manchester M20 4BX, UK 5 Musculoskeletal Research Group, NIHR BRU, University of Manchester, Manchester M13 9PT, UK 6 Department Pediatrie, Ho ˆ pital Me ` re-Enfant, Universite ´ Claude Bernard, 69677 Lyon, France 7 Faculty of Life Sciences, University of Manchester, Manchester M13 9NT, UK Correspondence should be addressed to A Stevens Email adam.stevens@manchester. ac.uk Abstract Systems biology is the study of the interactions that occur between the components of individual cells – including genes, proteins, transcription factors, small molecules, and metabolites, and their relationships to complex physiological and pathological processes. The application of systems biology to medicine promises rapid advances in both our understanding of disease and the development of novel treatment options. Network biology has emerged as the primary tool for studying systems biology as it utilises the mathematical analysis of the relationships between connected objects in a biological system and allows the integration of varied ‘omic’ datasets (including genomics, metabolomics, proteomics, etc.). Analysis of network biology generates interactome models to infer and assess function; to understand mechanisms, and to prioritise candidates for further investigation. This review provides an overview of network methods used to support this research and an insight into current applications of network analysis applied to endocrinology. A wide spectrum of endocrine disorders are included ranging from congenital hyperinsulinism in infancy, through childhood developmental and growth disorders, to the development of metabolic diseases in early and late adulthood, such as obesity and obesity-related pathologies. In addition to providing a deeper understanding of diseases processes, network biology is also central to the development of personalised treatment strategies which will integrate pharmacogenomics with systems biology of the individual. Key Words " modelling " microarray " endocrine disruptors " secretion " network biology Journal of Molecular Endocrinology (2014) 52, R79–R93 Introduction Network biology has developed as a method to study the many interactions that occur in individual cells, helping to understand the complex biological processes in molecular biology and how they link to integrated biological systems (Pujol et al. 2010). The recent genome sequencing projects have provided a nearly complete list of human gene products and this has been followed by the first drafts of connectivity maps between proteins Journal of Molecular Endocrinology Review A STEVENS and others Endocrine network analysis 52 :1 R79–R93 http://jme.endocrinology-journals.org Ñ 2014 Society for Endocrinology DOI: 10.1530/JME-13-0112 Printed in Great Britain Published by Bioscientifica Ltd. Downloaded from Bioscientifica.com at 03/13/2022 02:00:13AM via free access
Transcript of Network analysis: a new approach to study endocrine disorders
JournalofMolecu
larEndocrinology
ReviewA STEVENS and others Endocrine network analysis 52 :1 R79–R93
Network analysis: a new approach tostudy endocrine disorders
A Stevens1,2, C De Leonibus1,2, D Hanson1,2, A W Dowsey1,3, A Whatmore1,2, S Meyer4,
R P Donn5, P Chatelain6, I Banerjee1,2, K E Cosgrove7, P E Clayton1,2 and M J Dunne7
1Faculty of Medical and Human Sciences, Institute of Human Development, University of Manchester,
Manchester, UK2Manchester Academic Health Science Centre, Royal Manchester Children’s Hospital, Central Manchester University
Hospitals NHS Foundation Trust, 5th Floor, Oxford Road, Manchester M13 9WL, UK3Paediatric and Adolescent Oncology, The University of Manchester, Manchester M13 9WL, UK4Stem Cell and Leukaemia Proteomics Laboratory, School of Cancer and Imaging Sciences, The University of
Manchester, Manchester M20 4BX, UK5Musculoskeletal Research Group, NIHR BRU, University of Manchester, Manchester M13 9PT, UK6Department Pediatrie, Hopital Mere-Enfant, Universite Claude Bernard, 69677 Lyon, France7Faculty of Life Sciences, University of Manchester, Manchester M13 9NT, UK
http://jme.endocrinology-journals.org � 2014 Society for EndocrinologyDOI: 10.1530/JME-13-0112 Printed in Great Britain
Published by Bioscientifica Ltd.
Downloa
Correspondence
should be addressed
to A Stevens
adam.stevens@manchester.
ac.uk
Abstract
Systems biology is the study of the interactions that occur between the components of
individual cells – including genes, proteins, transcription factors, small molecules, and
metabolites, and their relationships to complex physiological and pathological processes.
The application of systems biology to medicine promises rapid advances in both our
understanding of disease and the development of novel treatment options. Network
biology has emerged as the primary tool for studying systems biology as it utilises the
mathematical analysis of the relationships between connected objects in a biological system
and allows the integration of varied ‘omic’ datasets (including genomics, metabolomics,
proteomics, etc.). Analysis of network biology generates interactome models to infer and
assess function; to understand mechanisms, and to prioritise candidates for further
investigation. This review provides an overview of network methods used to support this
research and an insight into current applications of network analysis applied to
endocrinology. A wide spectrum of endocrine disorders are included ranging from
congenital hyperinsulinism in infancy, through childhood developmental and growth
disorders, to the development of metabolic diseases in early and late adulthood, such as
obesity and obesity-related pathologies. In addition to providing a deeper understanding of
diseases processes, network biology is also central to the development of personalised
treatment strategies which will integrate pharmacogenomics with systems biology of
the individual.
Key Words
" modelling
" microarray
" endocrine disruptors
" secretion
" network biology
ded
Journal of Molecular
Endocrinology
(2014) 52, R79–R93
Introduction
Network biology has developed as a method to study the
many interactions that occur in individual cells, helping
to understand the complex biological processes in
molecular biology and how they link to integrated
biological systems (Pujol et al. 2010). The recent genome
sequencing projects have provided a nearly complete list
of human gene products and this has been followed
by the first drafts of connectivity maps between proteins
from Bioscientifica.com at 03/13/2022 02:00:13AMvia free access
List of proteins, genes, ormetabolites from omic data sets
1
2
3
4
A ‘Omic’ data B Interactome model
C Network clusters D Network topology
Function and prioritisation
E
N k l
H
H
HB
Extracellularmatrix
Growth factors(e.g. TGFα, EGF)
Chemokines,hormones,transmitters
(e.g. interleukins,serotonin, etc.)
Survival factors(e.g. IGF1)
Cytokines(e.g. EPC)
JAKsPKA
PKC
PLC
G-protein Ras
Grb2/SOS Fyn/Shccdc42
Raf
MEK
FAKSrc
Dishevelled
GSK-3β
APC
β-catenin
β-catenin: TCF
Hedgehog
Wnt
TCF
Gli
MAPKMEKK MKK
JNKs
Jun
ERKMyc:Max
CREB
ARF
mdm2p53
Apoptosis
E2F
RbCyclD p16
p15
p27CyclECDK2
p21
CDK4
Mad:Max
Fos
AdenylatecyclaseAkkα
Akt
Pl3K
STAT3,5
Bcl-xL
Cytochrome C
Caspase 9
Caspase 8
FADDBad
Death factors(e.g. Fasl, Tnf)
Bim
Mt BaxBcl-2
IκB
NF-κB
Abnormalitysensor
Cyt
okin
e re
cept
or
FasR
RTK RTKGPCR Integrins
FrizzledP
atchedS
MO
Gene regulation
Cellproliferation
JournalofMolecu
larEndocrinology
Review A STEVENS and others Endocrine network analysis 52 :1 R80
http://jme.endocrinology-journals.org � 2014 Society for EndocrinologyDOI: 10.1530/JME-13-0112 Printed in Great Britain
Published by Bioscientifica Ltd.
Downloaded from Bioscientifica.com at 03/13/2022 02:00:13AMvia free access
JournalofMolecu
larEndocrinology
Review A STEVENS and others Endocrine network analysis 52 :1 R81
and gene expression profiles for many different tissues
(Parkinson et al. 2007). Network biology detects the
relationships between different biological components,
including genes, proteins, transcription factors, small
molecules and metabolites (Arrell & Terzic 2013, Tomar
& De 2013), and enables the physical or functional
relationships between these components to be identified
and interrogated, see Fig. 1 and Box 1. Network analysis
can therefore be used to dissect the complexities of
biological systems and provide information which is
directly relevant to understanding the pathobiology of
disorders, including the pathways of disease processes and
the prioritisation of candidate disease-causing genes. The
aim of this review is to explain how the analysis of
biological networks can be carried out and to illustrate
how systems biology is impacting on our understanding of
diseases, with a particular focus on endocrine conditions
which by their very nature are complex and impact upon
many organs systems.
Network analysis
How do we visualise biological network models?
The commonest representations of biological networks are
‘ball and stick’ diagrams. The ‘balls’ represent proteins or
genes and the ‘sticks’ represent the known interactions.
These can be directed, with an arrow representing ‘action’
or ‘flow’ of information, or they can be undirected, where
connections represent direct associations. Biological net-
works are ‘graphs of connected nodes’, where nodes
represent biological components, which are connected
through edges to show their inter-relationships, from the
physical or functional associations to metabolic pathways
and regulatory interactions (Arrell & Terzic 2013, Tomar &
De 2013; Fig. 1). Several models have been used for
network analysis, from ‘Power Graphs’ and the ‘Infor-
mation Flow Model’, to ‘Boolean’ and ‘Bayesian’ networks
(Missiuro et al. 2009, Pujol et al. 2010, Youngs et al. 2013).
In Bayesian networks, the nodes represent biological
variables and directed edges represent causality through
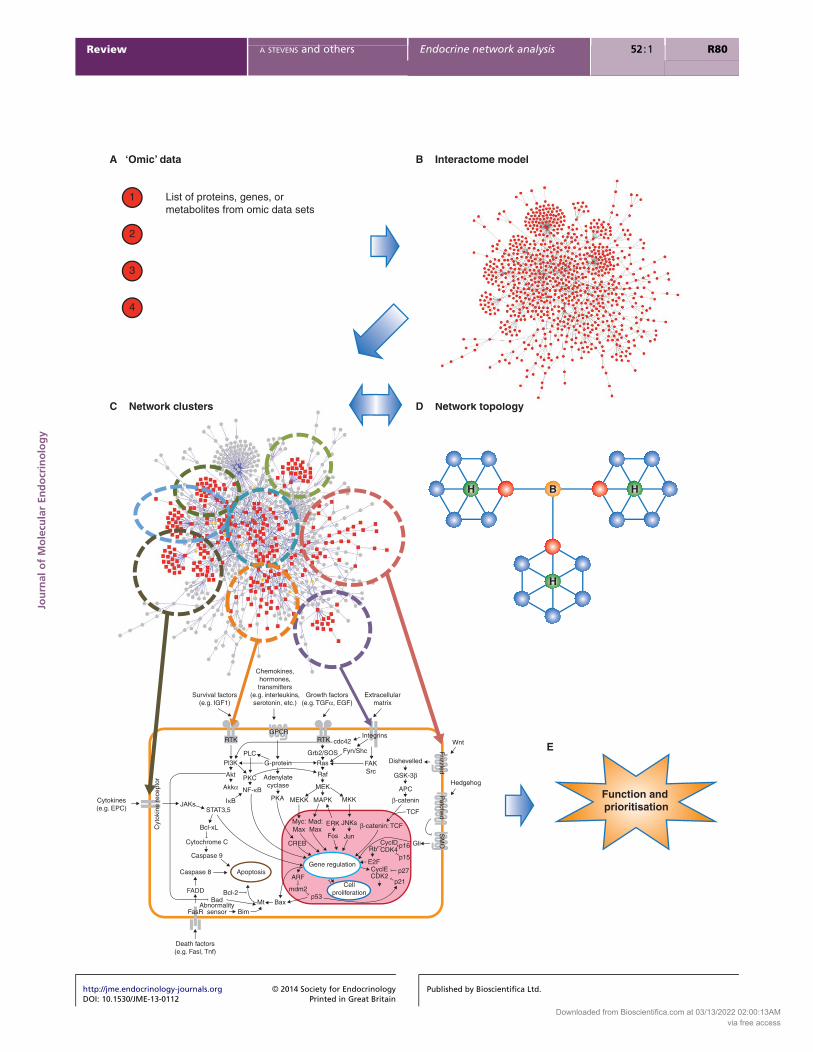
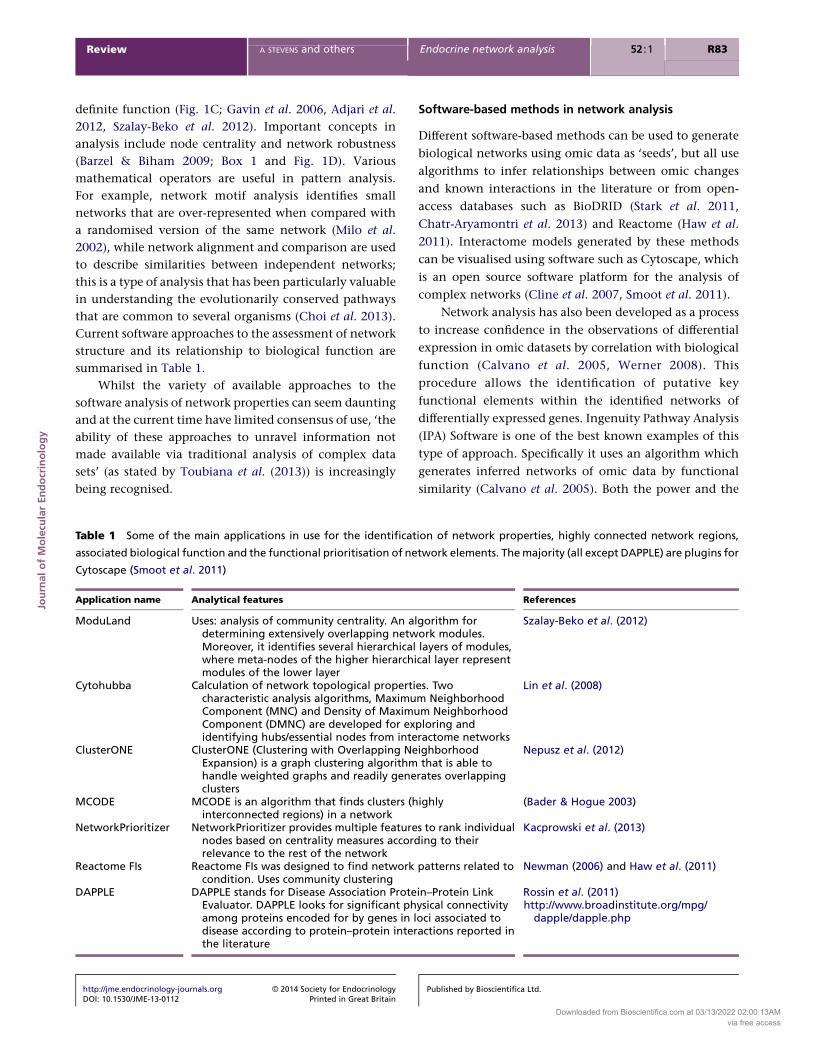
Figure 1
Analysis of biological networks. Biological networks can be inferred using
(A) ‘omic’ datasets as ‘seeds’ by mapping the data to models of all known
protein–protein or –genetic interactions and generating an interactome
model, (B). The interactome model represents the whole set of known
direct and indirect interactions involved with biological topic being
studied. By identifying network clusters (C) and measuring network
http://jme.endocrinology-journals.org � 2014 Society for EndocrinologyDOI: 10.1530/JME-13-0112 Printed in Great Britain
conditional probabilities between them. Specifically, they
have been used in several fields of systems biology, such as
cellular networks inference, pathway modelling, quality
assessment of protein–protein interactions and functional
annotation of proteins and gene expression analysis (Pujol
et al. 2010).
Commercially available software for the analysis of
gene networks are available (Thomas & Bonchev 2010)
and specialise in the ‘pattern recognition’ of genes
clustering within the networks derived from either a
previously defined pathway ‘cannon’ (e.g. Kyoto encyclo-
pedia of genes and genomes (KEGG) database, http://
www.genome.jp/kegg/) or from a process of network
inference algorithmically determined using known bio-
logical function (Calvano et al. 2005). Most scientists
in the life sciences define network analysis based on
commercial software of this type, i.e. one in which con-
nections are primarily based on text-mining algorithms.
These types of software are designed to be easy to use,
provide further quality control of data and have had
a major impact on the way in which systems biology
analysis is integrated with omic analysis. However,
there are advantages to more advanced statistical/
computational approaches for generating and analysing
networks, primarily around using network properties to
prioritise genes for further analysis – these will be covered
in more detail in the section ‘Computational analysis of
molecular interaction networks’.
Analysis of omic datasets: towards integrated analysis
To analyse omic data, two or more contrasting groups are
normally compared, such as a ‘treated vs control’ or
‘received dose vs therapeutic response’. A major issue in
the analysis of omic datasets with hundreds or thousands
of variables is that the number of comparisons is so large
that it is likely that the total number of false positives
becomes unfavourably high. This phenomenon is moder-
ated by the application of a false discovery rate correction
to the statistical test, for example Benjamini–Hochberg
correction (Benjamini & Hochberg 1995). However,
topology (D), function in the cell system can be inferred and further
investigated (E). The same approached can also be used for the
prioritisation of omic data for further investigation (E). (D) ‘Hubs’ are
designated ‘H’ and represent highly connected proteins/genes, and
‘bottlenecks’ are designated ‘B’ and represent positions within network
with limited connection between clusters.
Published by Bioscientifica Ltd.
Downloaded from Bioscientifica.com at 03/13/2022 02:00:13AMvia free access
Box 1 Definitions of technical terminology in network biology.
Bottleneck: corresponds to a network position which limits the performance or the capacity of the system. A network centralitymeasure representing positions with many ‘shortest paths’ travelling through.
Cluster modularity: distinct grouping of protein:protein or protein:gene interactions within a network.
Hub: a highly connected node within a network.
Interactome: biological network representing a whole set of direct or indirect interactions related to specific biological function.
Network analysis: relationship of the structural properties of a biological network to function.
Network biology: biology as related to interactions between multiple genes and/or proteins.
Network robustness: a mathematical description of how the integrity of a network responds to the random removal of singlenodes.
Node: a protein or gene positioned within a network.
Node centrality: refers to the ‘central’ positioning of nodes in a network. Central nodes have more ties to the network anddetermine flow between other nodes.
Seed: known genes used to generate an interactome model from all known protein–protein and –genetic interactions.
Systems biology: integration of complex data about the interactions in biological systems from diverse experimental sourcesusing interdisciplinary tools.
JournalofMolecu
larEndocrinology
Review A STEVENS and others Endocrine network analysis 52 :1 R82
common false discovery rate correction methods assume
that comparisons are independent, which is often not the
case. Increasingly, extra confidence in the analysis of omic
data sets can be provided by observing whether identified
changes coalesce into clusters within biological networks
(D’Eustachio 2011, Haw et al. 2011). These two approaches
are not mutually exclusive and are increasingly modelled
together to allow interpretation of different types of
omic datasets.
Biological networks can be inferred using omic
datasets by mapping the data to models of all known
protein–protein or –genetic interactions and generating
a much larger model of the interactome (Stark et al. 2011,
Ngounou Wetie et al. 2013; Fig. 1). An interactome
represents the whole set of direct and indirect molecular
interactions involved with the phenomenon being
studied (Fig. 1). The interactome model therefore
combines data from different omics datasets/databases to
generate network cluster maps correlating with the
organisation and priority of processes that provide a
particular function(s). These models also allow multi-
variate analysis of the data with consequent gains in
statistical certainty (Choi & Pavelka 2011).
The availability of whole genome transcript data has
also aided the development of novel approaches to analyse
this type of data. For example, it is now possible to
incorporate the influence of upstream regulators such
as transcription factors and miRNA into modelling of
available data. These strategies, in turn, may assist and
http://jme.endocrinology-journals.org � 2014 Society for EndocrinologyDOI: 10.1530/JME-13-0112 Printed in Great Britain
strengthen putative mechanisms of disease (Medan et al.
2012). It is also possible to fully integrate genetic and
transcriptomic analyses by the generation of expression
quantitative trait loci (eQTL). An eQTL is a genomic locus
that regulates transcription and is defined by mapping
methods that examine the linkage between variation in
expression and genetic polymorphisms (Kulp & Jagalur
2006, Villa-Vialaneix et al. 2013).
Computational analysis of molecular interaction
networks
The study of biological networks has increased exponen-
tially over the past 10 years and has been paralleled with
the increase in collection and statistical analysis of
network-indexed data. Statistical methods to examine
the relationship between the properties of biological
networks and function have also been developed and
research in this area is ongoing (Choi & Pavelka 2011).
There are now several analytic methods that are com-
monly used for relating the structure/topology of biologi-
cal networks to the functional properties of cells and
systems (Toubiana et al. 2013). It is well recognised that
most biological functions are closed systems at low
entropy states and can be resolved to a set of ordered
processes. Cluster modularity aims to define this order
with the recognition that sub-networks of interconnected
nodes might represent molecules which are functionally
linked and work in a coordinated manner to achieve a
Published by Bioscientifica Ltd.
Downloaded from Bioscientifica.com at 03/13/2022 02:00:13AMvia free access
JournalofMolecu
larEndocrinology
Review A STEVENS and others Endocrine network analysis 52 :1 R83
definite function (Fig. 1C; Gavin et al. 2006, Adjari et al.
2012, Szalay-Beko et al. 2012). Important concepts in
analysis include node centrality and network robustness
(Barzel & Biham 2009; Box 1 and Fig. 1D). Various
mathematical operators are useful in pattern analysis.
For example, network motif analysis identifies small
networks that are over-represented when compared with
a randomised version of the same network (Milo et al.
2002), while network alignment and comparison are used
to describe similarities between independent networks;
this is a type of analysis that has been particularly valuable
in understanding the evolutionarily conserved pathways
that are common to several organisms (Choi et al. 2013).
Current software approaches to the assessment of network
structure and its relationship to biological function are
summarised in Table 1.
Whilst the variety of available approaches to the
software analysis of network properties can seem daunting
and at the current time have limited consensus of use, ‘the
ability of these approaches to unravel information not
made available via traditional analysis of complex data
sets’ (as stated by Toubiana et al. (2013)) is increasingly
being recognised.
Table 1 Some of the main applications in use for the identificat
associated biological function and the functional prioritisation of ne
Cytoscape (Smoot et al. 2011)
Application name Analytical features
ModuLand Uses: analysis of community centrality. An aldetermining extensively overlapping netwMoreover, it identifies several hierarchicalwhere meta-nodes of the higher hierarchimodules of the lower layer
Cytohubba Calculation of network topological properticharacteristic analysis algorithms, MaximuComponent (MNC) and Density of MaximuComponent (DMNC) are developed for exidentifying hubs/essential nodes from inte
ClusterONE ClusterONE (Clustering with Overlapping NeExpansion) is a graph clustering algorithmhandle weighted graphs and readily geneclusters
MCODE MCODE is an algorithm that finds clusters (hinterconnected regions) in a network
NetworkPrioritizer NetworkPrioritizer provides multiple featurenodes based on centrality measures accordrelevance to the rest of the network
Reactome FIs Reactome FIs was designed to find networkcondition. Uses community clustering
DAPPLE DAPPLE stands for Disease Association ProteEvaluator. DAPPLE looks for significant phamong proteins encoded for by genes in ldisease according to protein–protein interthe literature
http://jme.endocrinology-journals.org � 2014 Society for EndocrinologyDOI: 10.1530/JME-13-0112 Printed in Great Britain
Software-based methods in network analysis
Different software-based methods can be used to generate
biological networks using omic data as ‘seeds’, but all use
algorithms to infer relationships between omic changes
and known interactions in the literature or from open-
access databases such as BioDRID (Stark et al. 2011,
Chatr-Aryamontri et al. 2013) and Reactome (Haw et al.
2011). Interactome models generated by these methods
can be visualised using software such as Cytoscape, which
is an open source software platform for the analysis of
complex networks (Cline et al. 2007, Smoot et al. 2011).
Network analysis has also been developed as a process
to increase confidence in the observations of differential
expression in omic datasets by correlation with biological
function (Calvano et al. 2005, Werner 2008). This
procedure allows the identification of putative key
functional elements within the identified networks of
differentially expressed genes. Ingenuity Pathway Analysis
(IPA) Software is one of the best known examples of this
type of approach. Specifically it uses an algorithm which
generates inferred networks of omic data by functional
similarity (Calvano et al. 2005). Both the power and the
ion of network properties, highly connected network regions,
twork elements. The majority (all except DAPPLE) are plugins for
References
gorithm forork modules.layers of modules,cal layer represent
Szalay-Beko et al. (2012)
es. Twom Neighborhoodm Neighborhood
ploring andractome networks
Lin et al. (2008)
ighborhoodthat is able to
rates overlapping
Nepusz et al. (2012)
ighly (Bader & Hogue 2003)
s to rank individualing to their
Kacprowski et al. (2013)
patterns related to Newman (2006) and Haw et al. (2011)
in–Protein Linkysical connectivityoci associated toactions reported in
Rossin et al. (2011)http://www.broadinstitute.org/mpg/
dapple/dapple.php
Published by Bioscientifica Ltd.
Downloaded from Bioscientifica.com at 03/13/2022 02:00:13AMvia free access
JournalofMolecu
larEndocrinology
Review A STEVENS and others Endocrine network analysis 52 :1 R84
weakness of this approach are that it is based on
‘mining’ an extensively annotated literature database;
this allows highly specific associations to be made but
these are only as good as the current database used
(Khatri et al. 2012). Literature databases have extensive
coverage of biological function but can still suffer from
distortions in that some interactions may be over- or
under-represented (Khatri et al. 2012). Interactome mod-
elling generated from the databases of known protein:
protein and protein:genetic interactions such as BioGRID
(Chatr-Aryamontri et al. 2013) suffers from this issue to a
lesser extent but requires the more mathematical
approaches described in this section to provide functional
interpretation.
Analysis of network structure can also be determined
by the Cytoscape Software platform, which can be used to
provide topological analysis. Topology, a branch of
mathematics studying shapes and spaces, is utilised in
network analysis to describe network properties such as
connectivity, which is an inherent network property
involving hubs and bottlenecks (Fig. 1D and Box 1; Lin
et al. 2008). Using this approach, the top 10–20% of
protein–protein interaction network nodes can be ranked
for both connectivity and bottleneck scores and then used
to generate a minimal essential network (Sun & Zhao
2010, Stevens et al. 2013d). A minimal essential network
represents the most functionally relevant element of an
interactome model and therefore is used to assess
biological function (Stevens et al. 2013a,b,d).
Disease networks
During the last decade, much effort has been spent in
generating a list of disease–gene associations, and explain-
ing how genetic disorders and the corresponding disease–
genes might be related (Goh et al. 2007, Goh & Choi 2012).
However, this process has significant challenges. For
instance, diseases can arise from mutations in more than
a single gene (locus heterogeneity) and different
mutations in the same gene may cause different pheno-
types and genetic disorders (allelic heterogeneity) (Goh
et al. 2007). In order to advance this area, the ‘human
diseasome’ has been generated using network biology,
which brings together combined datasets of all known
disease–gene associations. This has been created on the
basis that there is a cohesive relationship between disease-
causing genes and their products, and developed on a
conceptual framework which systematically links all
recorded genetic disorders (the human disease phenome)
with the complete list of known disease-causing genes (the
http://jme.endocrinology-journals.org � 2014 Society for EndocrinologyDOI: 10.1530/JME-13-0112 Printed in Great Britain
human disease genome) (Janjic & Przulj 2012). Through
the network-based model for the human diseasome, it has
been shown that genes that contribute to a common
disorder exhibit an increased propensity for their products
to co-interact through protein–protein interactions; have
a tendency to be co-expressed in specific tissues and share
common cellular and functional characteristics, as anno-
tated in gene ontology (Pujol et al. 2010, Gene Ontology
Consortium 2013).
Disease networks have been created also for orphan
diseases that have special consideration as they have a low
rate of prevalence. Network relationships based on shared
genes or shared functional features have been derived and
used to construct the orphan disease-causing mutant gene
interactome (Zhang et al. 2011). Interestingly, Zhang
et al. (2011) found that in contrast to the common
disease-causing mutant genes that are predominantly
non-essential, orphan disease-causing mutant genes are
largely essential and are ubiquitously expressed. However,
the authors also found that the connectivity of gene-based
and other feature-based orphan disease networks is largely
different, suggesting that the relationships between
diseases cannot be fully captured by the gene-based
network alone. As network analysis is evolving through
the addition of information to databases, these
approaches are nevertheless likely to provide important
added value for improved diagnosis, prevention, and
discovery of novel therapeutic strategies for orphan
diseases.
Disease-focused networks are needed to ensure the
validation of multiple biological markers and the under-
standing of pathophysiology of many diseases (Vlahou
2013). Several examples of disease-focused networks are
now emerging, especially in the area of cancer research
where numerous cancer cluster gene networks have been
described in different types of tumours, including color-
ectal, ovarian and breast cancers (Bravata et al. 2013,
Kumar et al. 2013b, Yamaga et al. 2013, Zhang et al. 2013).
Network analysis is also leading to promising advances in
other fields, including neurological diseases (Parkinson’s
and Alzheimer’s diseases (Balthazar et al. 2013, Lones et al.
2013, Strafella 2013)) and neuropsychiatric disorders
(Kasparek et al. 2013); diseases of the immune system
(Ivanov & Anderson 2013) including autoimmune or
haematologic diseases (Mani et al. 2008, Kumar et al.
2013a); the pathogenesis of coronary heart diseases (Huan
et al. 2013), fatty liver diseases (Sookoian & Pirola 2013)
and endocrine/metabolic conditions, which will be
covered in more detail in the following sections.
Published by Bioscientifica Ltd.
Downloaded from Bioscientifica.com at 03/13/2022 02:00:13AMvia free access
JournalofMolecu
larEndocrinology
Review A STEVENS and others Endocrine network analysis 52 :1 R85
Network pharmacology
An improved knowledge of the complex nature of diseases
is also beginning to impact upon drug development and to
the therapeutic management of diseases (Murthy et al.
2013). Whilst most prescribed drugs interact with specific
cellular targets, in vivo they modify cellular systems
through interactions with multiple proteins rather than
single entities. Computational modelling of these
interactions is now possible and has facilitated a shift
towards network-centric strategies in new drug design
(Nacher & Schwartz 2008). As a consequence, a novel
concept has now emerged in drug discovery for improving
treatment responsiveness termed ‘polypharmacology’
(Barabasi et al. 2011) and has been implicated in the
design of novel anticancer drugs (Tang & Aittokallio 2013)
and antimicrobial agents (Rohde et al. 2012).
Analysis of network biology is also helping to under-
stand how the multifaceted interactions between drugs
and their cellular targets contribute to efficacy and adverse
reactions/side effects. Network pharmacology therefore
provides a framework for analysing the actions of drugs on
systems, for identifying targets which will modulate
disease phenotypes, and for developing therapies that
are less vulnerable to drug resistance and side effects
(Takarabe et al. 2011). Another major area of research in
drug discovery is predictive toxicology. Network biology
can identify putative secondary targets for a given
compound or explore potential downstream effects for
blocking or enhancing the actions of key nodes.
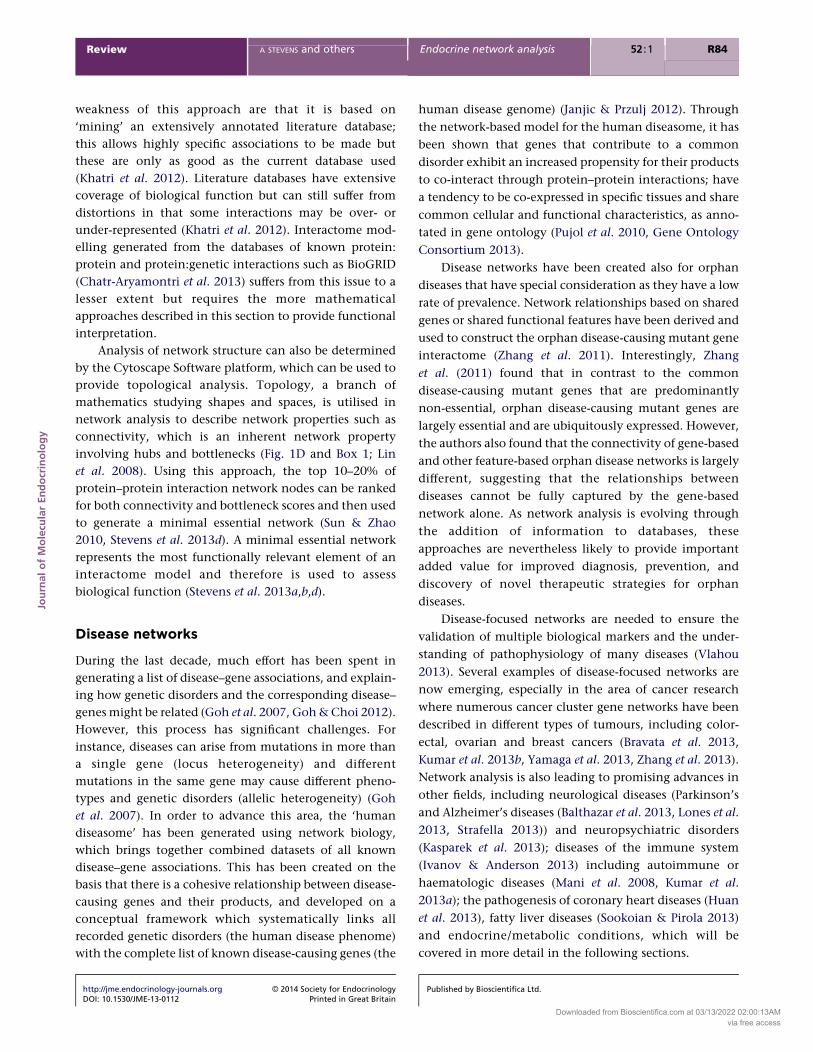
Networks analysis of endocrine diseases
In this section, we summarise disease areas in endocrine
sciences, which are engaging network analysis to better
understand the pathogenesis of disease and the respon-
siveness of patients to therapy (Fig. 2). In many cases, the
• Childhood development• Short stature and growth disorders
• Congenital hyperinsulinism
Childhood
Network analysis in end
Infancy
Figure 2
Network analysis of endocrine diseases. The use of network analysis
approaches in a wide spectrum of endocrine conditions in a different set
http://jme.endocrinology-journals.org � 2014 Society for EndocrinologyDOI: 10.1530/JME-13-0112 Printed in Great Britain
introduction of network analysis to endocrine disorders
has come about, because candidate gene approaches
to pathogenesis are limited, the phenotype of a particular
disease in individuals may be variable and because natural
history of a condition is often not inferred from traditional
investigations.
Congenital hyperinsulinism in infancy
Congenital hyperinsulinism (CHI) is a rare disease due to
dysregulated, excess insulin secretion from pancreatic
b-cells, which manifests as profound hypoglycaemia (De
Leon & Stanley 2007, Banerjee et al. 2013). CHI is the
commonest cause of persistent hypoglycaemia in infancy.
In contrast to other causes of hypoglycaemia such as
infection and hypopituitarism, hypoglycaemia in CHI is
unpredictable and severe with a significant adverse impact
on future neurodevelopment (Senniappan et al. 2012). The
condition usually manifests not only in the neonatal
period but also later in childhood with milder forms in
children who may be able to maintain normoglycaemia
on oral feeds. The phenotype of CHI is heterogeneous,
with wide variability not only with respect to time of
presentation but also the probability of spontaneous
resolution vs long-term persistence of disease. Transient
CHI resolves spontaneously within weeks to months of
diagnosis and accounts for w50% of all patients (Arnoux
et al. 2011). Little is known about the cause(s) of
hypersecretion of insulin in these patients or the
mechanisms responsible for the resolution of symptoms.
In contrast to transient disease, the pathophysiology of
persistent CHI is far more widely described. So far,
mutations in nine genes – GLUD1, SLC16A1, HADH,
UCP2, KCNJ11, ABCC8, HNF1A, GCK and HNF4A, are
known to associate with persistent CHI, but these only
help to understand the process of disease mechanisms in
Time
Adulthood
• Obesity• Atherosclerosis• Type 2 diabetes• Drug-induced insulin resistance• Diabetic kidney disease
ocrinology
of age-related groups: from infancy, through childhood to early and
late adulthood.
Published by Bioscientifica Ltd.
Downloaded from Bioscientifica.com at 03/13/2022 02:00:13AMvia free access
JournalofMolecu
larEndocrinology
Review A STEVENS and others Endocrine network analysis 52 :1 R86
w50% of patients (Banerjee et al. 2011, 2013, Senniappan
et al. 2012). In our studies, computational biology of
disease-causing genes has recently been used to seed an
interaction network model. Genes integral or tightly
connected to the network have been found and represent
new candidates for understanding the exact aetiology of
this disorder across the spectrum of severities (Stevens
et al. 2013b).
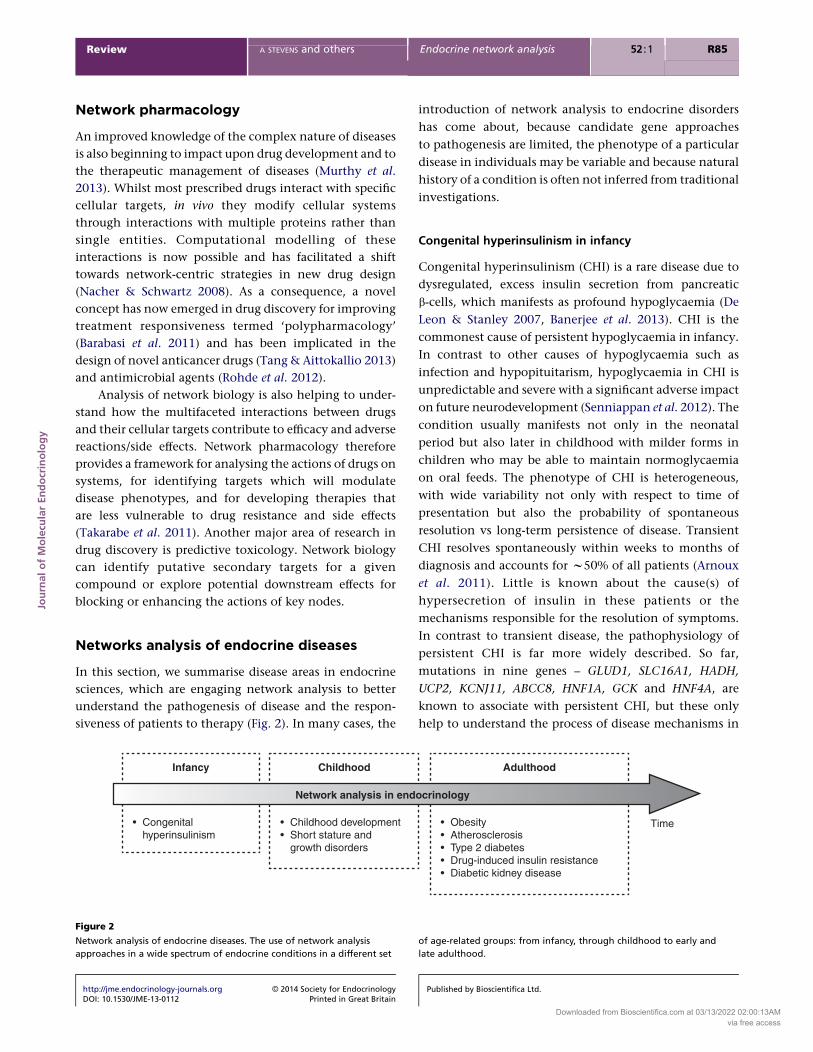
From the CHI interactome model, cluster analysis of
the components of the associated pathways can be carried
out (Newman 2006). This analytical approach allows the
identification and prioritisation of genes/proteins that are
related to mechanisms of disease and may therefore act as
biomarkers of CHI for the purposes of diagnosis and
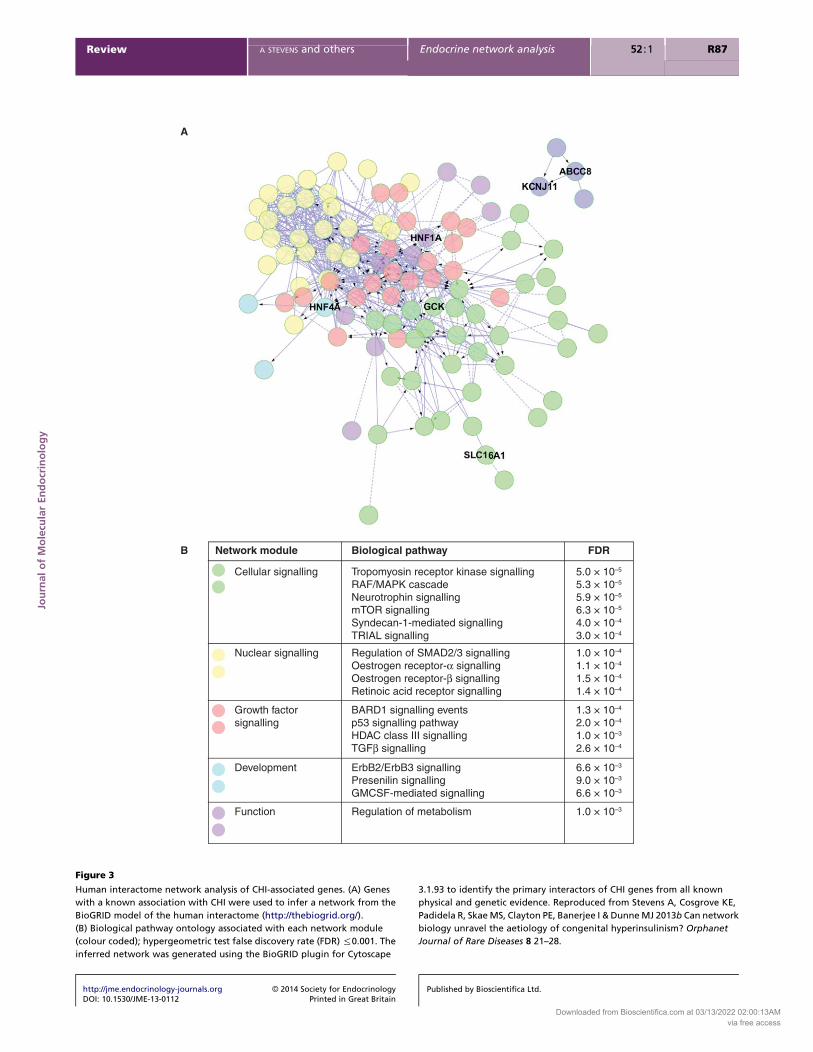
disease management (Stevens et al. 2013b; Fig. 3).
The largest cluster identified in the CHI interactome
model was associated with cellular signalling with
‘tropomyosin receptor kinase signalling’ as the most
significantly related pathway (PZ5.0!10K5). Tropomyo-
sin is an integral component of actin filaments within the
cytoskeleton. The insulin receptor has been shown to have
actions on the structural architecture of the cell (Kadowaki
et al. 1985) and polymorphism within regulatory regions
of the tropomyosin gene has been associated with
cytoskeleton-mediated insulin signalling (Savill et al.
2010). The second largest cluster found in the CHI
interactome model was associated with nuclear signalling
and the most significantly related pathway was ‘regulation
of SMAD2/3 signalling’. SMAD2 has been shown to be
associated with the development of pancreatic islets (Goto
et al. 2007). These observations derived from the network
analysis of the CHI interactome model provide prioritisa-
tion of network elements for further research.
Human growth and short stature in childhood
Network analysis has been used to demonstrate that the
pattern of human growth can be linked to changes in the
expression of sets of genes within evolutionarily con-
served growth pathways (including WNT, TGFB, VEGF
and the NOTCH signalling pathways) and that this occurs
in a tissue-independent manner (Stevens et al. 2013d). This
phenomenon has also been shown to occur in rodent
models (Finkielstein et al. 2009); however, the pattern of
human growth and development is distinct from that of
other mammals (Bogin 1999, Thompson & Nelson 2011),
and is characterised by rapid but decelerating growth in
infancy, an extended childhood phase of slow growth and
a pubertal growth spurt before final height is reached,
termed the infancy–childhood–puberty growth model
http://jme.endocrinology-journals.org � 2014 Society for EndocrinologyDOI: 10.1530/JME-13-0112 Printed in Great Britain
(Karlberg et al. 2003). Despite extensive experience over
the past 25 years in the clinical management of growth
failure in growth disorders, including growth hormone
deficiency (GHD) and Turner syndrome (TS), predicting
treatment efficacy in individual children remains a
significant challenge as both age and stage of childhood
development are now known to be important predictors of
the outcome of treatments (Ranke et al. 1999, Ranke et al.
2000, Ranke & Lindberg 2011, Patel & Clayton 2012,
Ranke 2013).
The possibility of stratifying patients based on genetic
variation of response to GH therapy led to the develop-
ment of the PREDICT study, the aim of which was to assess
the genomic profiles of GHD and TS children in response to
GH therapy by the analysis of both genetic and transcrip-
tomic data (Clayton et al. 2013, Stevens et al. 2013a).
Integrating gene expression and genetic data has provided
mechanistic insight into growth response and helped to
support the identification of genes with predictive value of
growth response. Insulin-like growth factor 1 (IGF1)
production over the first month of treatment (Stevens
et al. 2013a) and first-year growth responses to recombi-
nant human GH (r-hGH) therapy (Clayton et al. 2013) have
both been studied using this approach and several growth-
related pathways involved in response to GH therapy have
been identified beyond the traditional GH and IGF1
signalling pathways. These included the MAPK pathway,
a pathway well known to be involved in growth (Yamauchi
et al. 1997, Hanson et al. 2012) but considered to have a less
prominent role than the GH pathway. In the MAPK
pathway, multiple single nucleotide polymorphisms
(SNPs) in genes associated with response to GH therapy
were located in both GHD and TS and these genes were
shown to be located in network clusters that also contained
gene expression changes associated with response to GH
therapy. A network analysis using prioritisation by the
connectivity of gene expression associated with the
carriage of CDK4 alleles linked to IGF1 change over
the first month of GH treatment also highlighted the
role of the MAPK pathway’s response in GHD children
(Stevens et al. 2013a). From these models, proof of
principal has been established, that it is possible to identify
genetic biomarkers of growth response which could have
important predictive potential.
Obesity and adipose tissue
Adipose tissue is a host to a number of complex regulatory
networks, involving growth, metabolism and intracellular
signalling pathways. Several systems-led investigations
Published by Bioscientifica Ltd.
Downloaded from Bioscientifica.com at 03/13/2022 02:00:13AMvia free access
Network module Biological pathway FDR
Tropomyosin receptor kinase signallingRAF/MAPK cascadeNeurotrophin signallingmTOR signallingSyndecan-1-mediated signallingTRIAL signalling
ErbB2/ErbB3 signallingPresenilin signallingGMCSF-mediated signalling
Regulation of metabolism
BARD1 signalling eventsp53 signalling pathwayHDAC class III signallingTGFβ signalling
Regulation of SMAD2/3 signallingOestrogen receptor-α signallingOestrogen receptor-β signallingRetinoic acid receptor signalling
5.0 × 10⁻⁵
5.3 × 10⁻⁵
5.9 × 10⁻⁵
6.3 × 10⁻⁵
4.0 × 10⁻⁴
3.0 × 10⁻⁴
6.6 × 10⁻³
9.0 × 10⁻³
6.6 × 10⁻³
1.0 × 10⁻³
1.3 × 10⁻⁴
2.0 × 10⁻⁴
1.0 × 10⁻³
2.6 × 10⁻⁴
1.0 × 10⁻⁴
1.1 × 10⁻⁴
1.5 × 10⁻⁴
1.4 × 10⁻⁴
A
B
Cellular signalling
Nuclear signalling
Growth factor signalling
Development
Function
Figure 3
Human interactome network analysis of CHI-associated genes. (A) Genes
with a known association with CHI were used to infer a network from the
BioGRID model of the human interactome (http://thebiogrid.org/).
(B) Biological pathway ontology associated with each network module
(colour coded); hypergeometric test false discovery rate (FDR) %0.001. The
inferred network was generated using the BioGRID plugin for Cytoscape
3.1.93 to identify the primary interactors of CHI genes from all known
physical and genetic evidence. Reproduced from Stevens A, Cosgrove KE,
Padidela R, Skae MS, Clayton PE, Banerjee I & Dunne MJ 2013b Can network
biology unravel the aetiology of congenital hyperinsulinism? Orphanet
Journal of Rare Diseases 8 21–28.
JournalofMolecu
larEndocrinology
Review A STEVENS and others Endocrine network analysis 52 :1 R87
http://jme.endocrinology-journals.org � 2014 Society for EndocrinologyDOI: 10.1530/JME-13-0112 Printed in Great Britain
Published by Bioscientifica Ltd.
Downloaded from Bioscientifica.com at 03/13/2022 02:00:13AMvia free access
JournalofMolecu
larEndocrinology
Review A STEVENS and others Endocrine network analysis 52 :1 R88
have been performed to assess regulatory networks within
adipose cells. Specific lipid metabolism networks have also
been discovered, which have environmental and genetic
influences and form a highly regulated and integrated
homeostatic network primarily designed to maintain
energy homeostasis and tissue growth/expansion (Sethi
& Vidal-Puig, 2007). These pathways are relevant to
obesity and obesity-associated metabolic dysregulation as
adipose tissue plasticity and expandability play an
important role in energy homeostasis in health and
disease. Metabolomics has been applied to the study of
lipid molecules including free fatty acids and phospholi-
pids (Han & Gross 2003). This lipidomic approach has
been used to investigate the metabolic regulation of
adipocytes in obesity in order to further understand the
cascade of events progressing from adipocyte expansion to
immune cell recruitment and initiation of inflammation
(Kamei et al. 2006). Lipidomics utilising network analysis
has identified metabolic biomarkers for the response of
adipose tissue to treatment. A study on the use of
rosiglitazone on lipid metabolism in diabetic mice recently
suggested that increased de novo synthesis of the fatty acid
palmitoleate may have relevance as a biomarker (Watkins
et al. 2002). Palmitoleate has been shown to be synthesised
during lipogenesis and its production correlates with
improved insulin sensitivity (Cao et al. 2008). In humans,
the proportion of palmitoleate was increased in obese but
otherwise healthy individuals, suggesting that the pro-
duction of this fatty acid could reflect an adaptive measure
to restore insulin sensitivity. Surprisingly, palmitoleic acid
production was not increased in morbidly obese subjects
(Pietilainen et al. 2011). As obesity has a direct association
with systemic inflammation and the secondary develop-
ment of diseases including atherosclerosis, obesity-related
insulin resistance and type 2 diabetes, network analysis has
also been used to explore functional connectivity between
adipocytes and other metabolic tissues; see sections below.
Obesity and atherosclerosis
Obesity status is often associated with hypercholesterolae-
mia that leads in turn to an increased risk of atherosclerosis
and cardiovascular diseases (Goldstein & Brown 2001). One
of the first key events in the development of atherosclerotic
plaque is the uptake of oxidised LDLs by macrophages,
which leads to local inflammatory reactions and to the
formation of lipid-loaded macrophages, termed ‘foam
cells’. LXRa, is a ligand-dependent nuclear receptor that
regulates cholesterol homeostasis and reverses cholesterol
transport; therefore, it represents an important drug target.
http://jme.endocrinology-journals.org � 2014 Society for EndocrinologyDOI: 10.1530/JME-13-0112 Printed in Great Britain
A recent study has used integrative genomic analysis to
understand LXRa-dependent functional characteristics
and transcriptional regulation pathways (Feldmann et al.
2013). Several SNPs within LXRa-dependent binding sites
were found to have differentially expressed target genes
involved in the biological processes linked to inflam-
mation, cell growth and apoptosis. To analyse the role of
LXRa modulation in atherosclerosis and related diseases, a
human macrophage and foam cell network model was used
to investigate the actions of a synthetic LXR agonist –
T0901317, which has a potential atheroprotective role. By
using transcriptional network analysis, highly integrated
LXRa ligand-dependent transcriptional clusters were
detected which contribute to the reversal of cholesterol
efflux and the dampening of inflammation processes in the
foam cells (Feldmann et al. 2013). An important impli-
cation of these data is that network analysis in this field is
helping the understanding of molecular mechanisms
governing atherogenesis, which has relevance to thera-
peutic strategies to prevent atherosclerosis.
Obesity and type 2 diabetes mellitus
Current studies based on integrating genotypic data have
shown that complex traits such as obesity are modulated
by compound networks based on multiple genetic loci and
environmental factors. Obesity is also well known to be
a chronic tissue inflammation contributing to insulin
resistance and secondly to the development of pancreatic
b-cell failure and type 2 diabetes mellitus (T2DM). In the
USA, the current obesity epidemic is running in parallel
with a T2DM epidemic and the underlying pathophysiol-
ogies are closely linked (Osborn & Olefsky 2012). Several
mechanisms proposed to induce b-cell failure have been
detected, involved in endoplasmic reticulum stress,
oxidative stress, lipotoxicity and glucotoxicity which are
mostly mediated by tissue inflammation (Hotamisligil &
Erbay 2008, Santiago & Potashkin 2013). A genetics and
systems-based approach to the identification of suscep-
tibility loci in obesity-induced diabetes in mice has
recently been added to our understanding of the complex
genetic interactions contributing to this condition
(Davis et al. 2012). In this study, loci contributing to
diabetes-related traits were identified, and candidate genes
for variations in gene expression were prioritised.
Co-expression networks for mice at different ages and
clinical traits were then generated and several modules
found to be tightly associated with obesity-induced
diabetes (Davis et al. 2012). In a separate study, gene and
protein interactome models were generated from gene
Published by Bioscientifica Ltd.
Downloaded from Bioscientifica.com at 03/13/2022 02:00:13AMvia free access
JournalofMolecu
larEndocrinology
Review A STEVENS and others Endocrine network analysis 52 :1 R89
expression and metabolic profiling data in obese mice.
Network analysis of these models was used to identify
differentially activated sub-networks that demonstrated
immune system gene networks and inflammatory
biomarkers were upregulated in the adipose tissue and
that this preceded insulin resistance therefore revealing
key links between nutrition and genetic factors (Mori
et al. 2010).
The recent introduction of genome wide association
studies has also led to the identification of several SNPs
associated with diseases, including T2DM. Network
analysis has now been used to integrate SNPs known to
be associated with T2DM with eQTL and this has led to the
discovery of several novel candidate genes for T2DM,
involved in the regulation and metabolism of insulin,
glucose and lipids (Kang et al. 2012). Biological network
analysis in humans has also revealed an association
between T2DM and Parkinson’s disease through a network
model which places insulin resistance and inflammation
central to defects in insulin secretion and defective
glucose sensing and impaired insulin signalling, leading
to cognitive decline and neurodegeneration (Santiago &
Potashkin 2013).
Development of drug-induced insulin resistance: network
analysis example of glucocorticoid and GH therapies
The development of insulin resistance and T2DM is not
only related to obesity, but can also be iatrogenic. Fleuren
et al. (2013) have recently reported on the use of gene
networks to identify which genes may play a role in the
development of insulin resistance induced by glucocorti-
coids and identified several candidates, including
phosphoenolpyruvate carboxykinase and glucose-6-phos-
phatase. Treatment with r-hGH can present short-term
complications including insulin sensitivity which we have
studied in pre-pubertal children with GHD. By network
analysis clusters of genes have been identified that
underlie metabolic and growth responses to GH and are
associated with adipocyte differentiation and cell cycle
regulation pathways (Stevens et al. 2013c). These
approaches can also be applied to a variety of drug-
induced disease networks and may help to identify
candidate genetic markers for predicting response to
treatment and the development of side effects.
Diabetic kidney disease
Diabetic kidney disease (DKD) is a microvascular compli-
cation of diabetes mellitus and is usually accompanied by
http://jme.endocrinology-journals.org � 2014 Society for EndocrinologyDOI: 10.1530/JME-13-0112 Printed in Great Britain
a progressive loss of kidney function. It has been shown
that genetic variations and environmental factors are
strongly linked to DKD susceptibility and to the pro-
gression of kidney dysfunction (Komorowsky et al. 2012,
Bhalla et al. 2013). The improvement of standardised high-
throughput technologies of tissue sampling combined
with network analysis of tissues from patients with DKD
has now led to a far better understanding of the
pathophysiology of DKD. Using human renal biopsies,
transcriptomics in tubulo-interstitial compartments has
recently been combined with hypothesis-driven network
pathway analysis to document the involvement of several
genes related to inflammation in progressive DKD
(Komorowsky et al. 2012). Transcriptional network
analysis combined with promoter modelling approaches
has also been used to identify a specific NF-kB module in
the pathogenesis of DKD, effectively segregating pro-
gressive forms of DKD from mild diabetic nephropathy
and control subjects (Schmid et al. 2006). Other
mechanisms have also been shown to be involved in
human DKD, including specific gene expression patterns
pointing at pathways involving hypoxic gene regulation,
vascular plasticity and JAK/STAT signalling (Lindenmeyer
et al. 2007, Berthier et al. 2009).
Conclusions
We have an unprecedented capacity to generate datasets
that can document the detailed and complex interactions
that take place within a cell. These are being mapped in
incredible detail through a combination of technological
advancements in experimental techniques, including the
ready availability of second- and third-generation sequen-
cing platforms; associated methods (such as RNA-seq and
ChIP-seq); other high-throughput ‘omics methods, includ-
ing quantitative proteomics, interactomics and miRNAo-
mics/MIRomics (Szabo et al. 2013) and the application of
computational biology to analyse, visualise and model the
systems data. Epigenomics, the whole genome study of
DNA methylation and histone markers as indicators of
transcriptional activity, is also amenable to network
analysis, but this has not yet been implemented in an
endocrine context. By contrast epigenomic/network
biology integration has made important advances to the
area of cancer biology (Huang et al. 2013).
These technologies promise rapid advances both in
the scale at which biological research is performed and in
the scope of the questions that can be tackled. However,
they also offer new challenges, owing to the volume of
data generated. In the last few years, a new situation has
Published by Bioscientifica Ltd.
Downloaded from Bioscientifica.com at 03/13/2022 02:00:13AMvia free access
JournalofMolecu
larEndocrinology
Review A STEVENS and others Endocrine network analysis 52 :1 R90
arisen in biology, whereby, in many cases, the rate-
limiting step has shifted from data generation to data
analysis. Compounding this problem is the fact that many
researchers with traditional experimental training lack
the computational skills that ‘big data’ projects require.
For this reason, the full potential of these new tech-
nologies remains to be fully realised. In this review, we
have provided examples of network analysis in endo-
crinology. Current technology and new approaches to the
analysis of omic data can now be combined and network
biology can be used to reveal cohesiveness and order from
a broad array of datasets representing all aspects of cell
function enabling systematic prioritisation and interpre-
tation of the underlying biology of a network. The systems
biology approach will undoubtedly enhance understand-
ing of the normal physiology and pathophysiology of
different diseases. Interactome modelling of pharmacoge-
nomic responses to therapy will also identify putative new
drug targets and possible drug-induced side effects, leading
to the introduction of new or repositioned therapeutic
agents in clinical practice.
Declaration of interest
The authors declare that there is no conflict of interest that could be
perceived as prejudicing the impartiality of the review reported.
Funding
A S was supported by Merck Serono S.A. (Geneva, Switzerland). C L was
supported by the University of Manchester and a European Society for
Paediatric Endocrinology (ESPE) Research Fellowship, sponsored by Novo
Nordisk A/S.
References
Adjari RA, Sendina-Nadal I, Papo D, Zanin M, Buldu JM, del Pozo F &
Boccaletti S 2012 Topological measure locating the effective crossover
between segregation and integration in a modular network. Physical
Review Letters 108 228701. (doi:10.1103/PhysRevLett.108.228701)
Arnoux JB, Verkarre V, Saint-Martin C, Montravers F, Brassier A,
Valayannopoulos V, Brunelle F, Fournet JC, Robert JJ, Aigrain Y et al.
2011 Congenital hyperinsulinism: current trends in diagnosis and
therapy. Orphanet Journal of Rare Diseases 6 63–66. (doi:10.1186/1750-
1172-6-63)
Arrell DK & Terzic A 2013 Interpreting networks in systems biology. Clinical
Pharmacology and Therapeutics 93 389–392. (doi:10.1038/clpt.2013.28)
Bader GD & Hogue CW 2003 An automated method for finding molecular
complexes in large protein interaction networks. BMC Bioinformatics 4
2. (doi:10.1186/1471-2105-4-2)
Balthazar ML, Pereira FR, Lopes TM, da Silva EL, Coan AC, Campos BM,
Duncan NW, Stella F, Northoff G, Damasceno BP et al. 2013
Neuropsychiatric symptoms in Alzheimer’s disease are related to
functional connectivity alterations in the salience network. Human
Brain Mapping [in press]. (doi:10.1002/hbm.22248)
http://jme.endocrinology-journals.org � 2014 Society for EndocrinologyDOI: 10.1530/JME-13-0112 Printed in Great Britain
Banerjee I, Skae M, Flanagan SE, Rigby L, Patel L, Didi M, Blair J, Ehtisham S,
Ellard S, Cosgrove KE et al. 2011 The contribution of rapid KATP
channel gene mutation analysis to the clinical management of children
with congenital hyperinsulinism. European Journal of Endocrinology 164
733–740. (doi:10.1530/EJE-10-1136)
Banerjee I, Avatapalle B, Padidela R, Stevens A, Cosgrove K, Clayton P &
Dunne M 2013 Integrating genetic and imaging investigations into
the clinical management of congenital hyperinsulinism. Clinical
Endocrinology 78 803–813. (doi:10.1111/cen.12153)
Barabasi AL, Gulbahce N & Loscalzo J 2011 Network medicine: a network-
based approach to human disease. Nature Reviews Genetics 12 56–68.
Barzel B & Biham O 2009 Quantifying the connectivity of a network: the
network correlation function method. Physical Review. E, Statistical,
Nonlinear, and Soft Matter Physics 80 046104. (doi:10.1103/PhysRevE.80.
046104)
Benjamini Y & Hochberg Y 1995 Controlling the false discovery rate: a
practical and powerful approach to multiple testing. Journal of the Royal
Statistical Society, Series B 57 289–300.
Berthier CC, Zhang H, Schin M, Henger A, Nelson RG, Yee B, Boucherot A,
Neusser MA, Cohen CD, Carter-Su C et al. 2009 Enhanced expression of
janus kinase–signal transducer and activator of transcription pathway
members in human diabetic nephropathy. Diabetes 58 469–477.
(doi:10.2337/db08-1328)
Bhalla V, Velez MG & Chertow GM 2013 A transcriptional blueprint for
human and murine diabetic kidney disease. Diabetes 62 31–33.
(doi:10.2337/db12-1121)
Bogin B 1999 Evolutionary perspective on human growth. Annual
Review of Anthropology 28 109–153. (doi:10.1146/annurev.anthro.28.
1.109)
Bravata V, Cammarata FP, Forte GI & Minafra L 2013 “Omics” of
HER2-positive breast cancer. OMICS17 119–129. (doi:10.1089/omi.2012.
0099)
Calvano SE, Xiao W, Richards DR, Felciano RM, Baker HV, Cho RJ, Chen RO,
Brownstein BH, Cobb JP, Tschoeke SK et al. 2005 A network-based
analysis of systemic inflammation in humans. Nature 437 1032–1037.
(doi:10.1038/nature03985)
Cao H, Gerhold K, Mayers JR, Wiest MM, Watkins SM & Hotamisligil GS
2008 Identification of a lipokine, a lipid hormone linking adipose
tissue to systemic metabolism. Cell 134 933–944. (doi:10.1016/j.cell.
2008.07.048)
Chatr-Aryamontri A, Breitkreutz BJ, Heinicke S, Boucher L, Winter A,
Stark C, Nixon J, Ramage L, Kolas N, O’Donnell L et al. 2013 The
BioGRID interaction database: 2013 update. Nucleic Acids Research 41
D816–D823. (doi:10.1093/nar/gks1158)
Choi H & Pavelka N 2011 When one and one gives more than two:
challenges and opportunities of integrative omics. Frontiers in Genetics 2
105. (doi:10.3389/fgene.2011.00018)
Choi J, Kim K, Song M & Lee D 2013 Generation and application of drug
indication inference models using typed network motif comparison
analysis. BMC Medical Informatics and Decision Making 13 (Suppl 1)
S2–S13. (doi:10.1186/1472-6947-13-S1-S2)
Clayton P, Chatelain P, Tato L, Yoo HW, Ambler GR, Belgorosky A,
Quinteiro S, Deal C, Stevens A, Raelson J et al. 2013 A pharmacoge-
nomic approach to the treatment of children with GH deficiency or
Turner syndrome. European Journal of Endocrinology 169 277–289.
(doi:10.1530/EJE-13-0069)
Cline MS, Smoot M, Cerami E, Kuchinsky A, Landys N, Workman C,
Christmas R, Avila-Campilo I, Creech M, Gross B et al. 2007 Integration
of biological networks and gene expression data using Cytoscape.
Nature Protocols 2 2366–2382. (doi:10.1038/nprot.2007.324)
Davis RC, van Nas A, Castellani LW, Zhao Y, Zhou Z, Wen P, Yu S, Qi H,
Rosales M, Schadt EE et al. 2012 Systems genetics of susceptibility to
obesity-induced diabetes in mice. Physiological Genomics 44 1–13.
(doi:10.1152/physiolgenomics.00003.2011)
De Leon DD & Stanley CA 2007 Mechanisms of disease: advances in
diagnosis and treatment of hyperinsulinism in neonates. Nature Clinical
Published by Bioscientifica Ltd.
Downloaded from Bioscientifica.com at 03/13/2022 02:00:13AMvia free access

JournalofMolecu
larEndocrinology
Review A STEVENS and others Endocrine network analysis 52 :1 R91
Practice. Endocrinology & Metabolism 3 57–68. (doi:10.1038/
ncpendmet0368)
D’Eustachio P 2011 Reactome knowledgebase of human biological
pathways and processes. Methods in Molecular Biology 694 49–61.
(doi:10.1007/978-1-60761-977-2_4)
Feldmann R, Fischer C, Kodelja V, Behrens S, Haas S, Vingron M,
Timmermann B, Geikowski A & Sauer S 2013 Genome-wide analysis of
LXRa activation reveals new transcriptional networks in human
atherosclerotic foam cells. Nucleic Acids Research 41 3518–3531.
(doi:10.1093/nar/gkt034)
Finkielstein GP, Forcinito P, Lui JC, Barnes KM, Marino R, Makaroun S,
Nguyen V, Lazarus JE, Nilsson O & Baron J 2009 An extensive genetic
program occurring during postnatal growth in multiple tissues.
Endocrinology 150 1791–1800. (doi:10.1210/en.2008-0868)
Fleuren WW, Toonen EJ, Verhoeven S, Frijters R, Hulsen T, Rullmann T,
van Schaik R, de Vlieg J & Alkema W 2013 Identification of new
biomarker candidates for glucocorticoid induced insulin resistance
using literature mining. BioData Mining 6 2–6. (doi:10.1186/1756-
0381-6-2)
Gavin AC, Aloy P, Grandi P, Krause R, Boesche M, Marzioch M, Rau C,
Jensen LJ, Bastuck S, Dumpelfeld B et al. 2006 Proteome survey reveals
modularity of the yeast cell machinery. Nature 440 631–636.
(doi:10.1038/nature04532)
Gene Ontology Consortium 2013 Gene ontology annotations and resources.
Nucleic Acids Research 41 D530–D535. (doi:10.1093/nar/gks1050)
Goh KI & Choi IG 2012 Exploring the human diseasome: the human
disease network. Briefings in Functional Genomics 11 533–542.
(doi:10.1093/bfgp/els032)
Goh KI, Cusick ME, Valle D, Childs B, Vidal M & Barabasi AL 2007 The
human disease network. PNAS 104 8685–8690. (doi:10.1073/pnas.
0701361104)
Goldstein JL & Brown MS 2001 Molecular medicine. The cholesterol
quartet. Science 292 1310–1312. (doi:10.1126/science.1061815)
Goto Y, Nomura M, Tanaka K, Kondo A, Morinaga H, Okabe T, Yanase T,
Nawata H, Takayanagi R & Li E 2007 Genetic interactions between
activin type IIB receptor and Smad2 genes in asymmetrical patterning
of the thoracic organs and the development of pancreas islets.
Developmental Dynamics 236 2865–2874. (doi:10.1002/dvdy.21303)
Han X & Gross RW 2003 Global analyses of cellular lipidomes directly from
crude extracts of biological samples by ESI mass spectrometry: a bridge
to lipidomics. Journal of Lipid Research 44 1071–1079.
Hanson D, Murray PG, Coulson T, Sud A, Omokanye A, Stratta E, Sakhinia F,
Bonshek C, Wilson LC, Wakeling E et al. 2012 Mutations in CUL7,
OBSL1 and CCDC8 in 3-M syndrome lead to disordered growth factor
signalling. Journal of Molecular Endocrinology 49 267–275. (doi:10.1530/
JME-12-0034)
Haw R, Hermjakob H, D’Eustachio P & Stein L 2011 Reactome pathway
analysis to enrich biological discovery in proteomics datasets.
Proteomics 11 3598–3613. (doi:10.1002/pmic.201100066)
Hotamisligil GS & Erbay E 2008 Nutrient sensing and inflammation in
metabolic diseases. Nature Reviews. Immunology 8 923–934.
(doi:10.1038/nri2449)
Huan T, Zhang B, Wang Z, Joehanes R, Zhu J, Johnson AD, Ying S,
Munson PJ, Raghavachari N, Wang R et al. 2013 A systems biology
framework identifies molecular underpinnings of coronary heart
disease. Arteriosclerosis, Thrombosis, and Vascular Biology 33 1427–1434.
(doi:10.1161/ATVBAHA.112.300112)
Huang SS, Clarke DC, Gosline SJ, Labadorf A, Chouinard CR, Gordon W,
Lauffenburger DA & Fraenkel E 2013 Linking proteomic and
transcriptional data through the interactome and epigenome reveals a
map of oncogene-induced signaling. PLoS Computational Biology 9
e1002887. (doi:10.1371/journal.pcbi.1002887)
Ivanov P & Anderson P 2013 Post-transcriptional regulatory networks in
immunity. Immunological Reviews 253 253–272. (doi:10.1111/imr.
12051)
http://jme.endocrinology-journals.org � 2014 Society for EndocrinologyDOI: 10.1530/JME-13-0112 Printed in Great Britain
Janjic V & Przulj N 2012 Biological function through network topology:
a survey of the human diseasome. Briefings in Functional Genomics 11
522–532. (doi:10.1093/bfgp/els037)
Kacprowski T, Doncheva NT & Albrecht M 2013 NetworkPrioritizer:
a versatile tool for network-based prioritization of candidate disease
genes or other molecules. Bioinformatics 29 1471–1473. (doi:10.1093/
bioinformatics/btt164)
Kadowaki T, Fujita-Yamaguchi Y, Nishida E, Takaku F, Akiyama T,
Kathuria S, Akanuma Y & Kasuga M 1985 Phosphorylation of tubulin
and microtubule-associated proteins by the purified insulin receptor
kinase. Journal of Biological Chemistry 260 4016–4020.
Kamei N, Tobe K, Suzuki R, Ohsugi M, Watanabe T, Kubota N,
Ohtsuka-Kowatari N, Kumagai K, Sakamoto K, Kobayashi M et al. 2006
Overexpression of monocyte chemoattractant protein-1 in adipose
tissues causes macrophage recruitment and insulin resistance. Journal of
Biological Chemistry 281 26602–26614. (doi:10.1074/jbc.M601284200)
Kang HP, Yang X, Chen R, Zhang B, Corona E, Schadt EE & Butte AJ 2012
Integration of disease-specific single nucleotide polymorphisms,
expression quantitative trait loci and coexpression networks reveal
novel candidate genes for type 2 diabetes. Diabetologia 55 2205–2213.
(doi:10.1007/s00125-012-2568-3)
Karlberg J, Kwan CW, Gelander L & Bertsson-Wikland K 2003 Pubertal
growth assessment. Hormone Research 60 27–35. (doi:10.1159/
000071223)
Kasparek T, Prikryl R, Rehulova J, Marecek R, Mikl M, Prikrylova H, Vanicek
J & Ceskova E 2013 Brain functional connectivity of male patients in
remission after the first episode of schizophrenia. Human Brain Mapping
34 726–737.
Khatri P, Sirota M & Butte AJ 2012 Ten years of pathway analysis: current
approaches and outstanding challenges. PLoS Computational Biology 8
e1002375. (doi:10.1371/journal.pcbi.1002375)
Komorowsky CV, Brosius FC III, Pennathur S & Kretzler M 2012
Perspectives on systems biology applications in diabetic kidney disease.
Journal of Cardiovascular Translational Research 5 491–508. (doi:10.1007/
s12265-012-9382-7)
Kulp DC & Jagalur M 2006 Causal inference of regulator–target pairs by
gene mapping of expression phenotypes. BMC Genomics 7 125. (doi:10.
1186/1471-2164-7-125)
Kumar A, Cocco E, Atzori L, Marrosu MG & Pieroni E 2013a Structural and
dynamical insights on HLA–DR2 complexes that confer susceptibility
to multiple sclerosis in sardinia: a molecular dynamics simulation
study. PLoS ONE 8 e59711. (doi:10.1371/journal.pone.0059711)
Kumar G, Breen EJ & Ranganathan S 2013b Identification of ovarian cancer
associated genes using an integrated approach in a Boolean framework.
BMC Systems Biology 7 12–17. (doi:10.1186/1752-0509-7-12)
Lin CY, Chin CH, Wu HH, Chen SH, Ho CW & Ko MT 2008 Hubba: hub
objects analyzer – a framework of interactome hubs identification for
network biology. Nucleic Acids Research 36 W438–W443. (doi:10.1093/
nar/gkn257)
Lindenmeyer MT, Kretzler M, Boucherot A, Berra S, Yasuda Y, Henger A,
Eichinger F, Gaiser S, Schmid H, Rastaldi MP et al. 2007 Interstitial
vascular rarefaction and reduced VEGF-A expression in human diabetic
nephropathy. Journal of the American Society of Nephrology 18
1765–1776. (doi:10.1681/ASN.2006121304)
Lones MA, Smith SL, Tyrrell AM, Alty JE & Jamieson DR 2013
Characterising neurological time series data using biologically
motivated networks of coupled discrete maps. Bio Systems 112 94–101.
(doi:10.1016/j.biosystems.2013.03.009)
Mani KM, Lefebvre C, Wang K, Lim WK, Basso K, Dalla-Favera R &
Califano A 2008 A systems biology approach to prediction of oncogenes
and molecular perturbation targets in B-cell lymphomas. Molecular
Systems Biology 4 169. (doi:10.1038/msb.2008.2)
Medan D, Luanpitpong S, Azad N, Wang L, Jiang BH, Davis ME, Barnett JB,
Guo L & Rojanasakul Y 2012 Multifunctional role of Bcl-2 in malignant
transformation and tumorigenesis of Cr(VI)-transformed lung cells.
PLoS ONE 7 e37045. (doi:10.1371/journal.pone.0037045)
Published by Bioscientifica Ltd.
Downloaded from Bioscientifica.com at 03/13/2022 02:00:13AMvia free access
JournalofMolecu
larEndocrinology
Review A STEVENS and others Endocrine network analysis 52 :1 R92
Milo R, Shen-Orr S, Itzkovitz S, Kashtan N, Chklovskii D & Alon U 2002
Network motifs: simple building blocks of complex networks. Science
298 824–827. (doi:10.1126/science.298.5594.824)
Missiuro PV, Liu K, Zou L, Ross BC, Zhao G, Liu JS & Ge H 2009 Information
flow analysis of interactome networks. PLoS Computational Biology 5
e1000350. (doi:10.1371/journal.pcbi.1000350)
Mori MA, Liu M, Bezy O, Almind K, Shapiro H, Kasif S & Kahn CR 2010
A systems biology approach identifies inflammatory abnormalities
between mouse strains prior to development of metabolic disease.
Diabetes 59 2960–2971. (doi:10.2337/db10-0367)
Murthy D, Attri KS & Gokhale RS 2013 Network, nodes and nexus: systems
approach to multitarget therapeutics. Current Opinion in Biotechnology
[in press]. (doi:10.1016/j.copbio.2013.02.009)
Nacher JC & Schwartz JM 2008 A global view of drug–therapy interactions.
BMC Pharmacology 8 5–8. (doi:10.1186/1471-2210-8-5)
Nepusz T, Yu H & Paccanaro A 2012 Detecting overlapping protein
complexes in protein–protein interaction networks. Nature Methods 9
471–472. (doi:10.1038/nmeth.1938)
Newman ME 2006 Modularity and community structure in networks.
PNAS 103 8577–8582. (doi:10.1073/pnas.0601602103)
Ngounou Wetie AG, Sokolowska I, Woods AG, Roy U, Deinhardt K &
Darie CC 2013 Protein–protein interactions: switch from classical
methods to proteomics and bioinformatics-based approaches.
Cellular and Molecular Life Sciences [in press].
Osborn O & Olefsky JM 2012 The cellular and signaling networks linking
the immune system and metabolism in disease. Nature Medicine 18
363–374. (doi:10.1038/nm.2627)
Parkinson H, Kapushesky M, Shojatalab M, Abeygunawardena N, Coulson
R, Farne A, Holloway E, Kolesnykov N, Lilja P, Lukk M et al. 2007 Array
express – a public database of microarray experiments and gene
expression profiles. Nucleic Acids Research 35 D747–D750. (doi:10.1093/
nar/gkl995)
Patel L & Clayton PE 2012 Predicting response to growth hormone
treatment. Indian Journal of Pediatrics 79 229–237.
Pietilainen KH, Rog T, Seppanen-Laakso T, Virtue S, Gopalacharyulu P,
Tang J, Rodriguez-Cuenca S, Maciejewski A, Naukkarinen J, Ruskeepaa
AL et al. 2011 Association of lipidome remodeling in the adipocyte
membrane with acquired obesity in humans. PLoS Biology 9 e1000623.
(doi:10.1371/journal.pbio.1000623)
Pujol A, Mosca R, Farres J & Aloy P 2010 Unveiling the role of network and
systems biology in drug discovery. Trends in Pharmacological Sciences 31
115–123. (doi:10.1016/j.tips.2009.11.006)
Ranke MB 2013 Treatment of children and adolescents with idiopathic
short stature. Nature Reviews Endocrinology 9 325–334.
Ranke MB & Lindberg A 2011 The basis for optimising growth with
growth hormone usage in children with idiopathic short stature:
analysis of data from KIGS (Pfizer International Growth Study
Database). Hormone Research in Paediatrics 76 (Suppl 3) 48–50.
(doi:10.1159/000330160)
Ranke MB, Lindberg A, Chatelain P, Wilton P, Cutfield W, Bertsson-
Wikland K & Price DA 1999 Derivation and validation of a
mathematical model for predicting the response to exogenous
recombinant human growth hormone (GH) in prepubertal children
with idiopathic GH deficiency. KIGS International Board. Kabi
Pharmacia International Growth Study. Journal of Clinical Endocrinology
and Metabolism 84 1174–1183.
Ranke MB, Lindberg A, Chatelain P, Wilton P, Cutfield W, Bertsson-
Wikland K & Price DA 2000 Prediction of long-term response to
recombinant human growth hormone in Turner syndrome: develop-
ment and validation of mathematical models. KIGS International
Board. Kabi International Growth Study. Journal of Clinical Endo-
crinology and Metabolism 85 4212–4218.
Rohde KH, Veiga DF, Caldwell S, Balazsi G & Russell DG 2012 Linking the
transcriptional profiles and the physiological states of Mycobacterium
tuberculosis during an extended intracellular infection. PLoS Pathogens 8
e1002769. (doi:10.1371/journal.ppat.1002769)
http://jme.endocrinology-journals.org � 2014 Society for EndocrinologyDOI: 10.1530/JME-13-0112 Printed in Great Britain
Rossin EJ, Lage K, Raychaudhuri S, Xavier RJ, Tatar D, Benita Y, Cotsapas C
& Daly MJ 2011 Proteins encoded in genomic regions associated with
immune-mediated disease physically interact and suggest underlying
biology. PLoS Genetics 7 e1001273. (doi:10.1371/journal.pgen.
1001273)
Santiago JA & Potashkin JA 2013 Shared dysregulated pathways lead to
Parkinson’s disease and diabetes. Trends in Molecular Medicine 19
176–186. (doi:10.1016/j.molmed.2013.01.002)
Savill SA, Leitch HF, Daly AK, Harvey JN & Thomas TH 2010 Polymorph-
isms in the tropomyosin TPM1 short isoform promoter alter gene
expression and are associated with increased risk of metabolic
syndrome. American Journal of Hypertension 23 399–404. (doi:10.1038/
ajh.2009.278)
Schmid H, Boucherot A, Yasuda Y, Henger A, Brunner B, Eichinger F,
Nitsche A, Kiss E, Bleich M, Grone HJ et al. 2006 Modular activation of
nuclear factor-kB transcriptional programs in human diabetic
nephropathy. Diabetes 55 2993–3003. (doi:10.2337/db06-0477)
Senniappan S, Shanti B, James C & Hussain K 2012 Hyperinsulinaemic
hypoglycaemia: genetic mechanisms, diagnosis and management.
Journal of Inherited Metabolic Disease 35 589–601. (doi:10.1007/
s10545-011-9441-2)
Sethi JK & Vidal-Puig AJ 2007 Thematic review series: adipocyte biology.
Adipose tissue function and plasticity orchestrate nutritional adap-
tation. Journal of Lipid Research 48 1253–1262.
Smoot ME, Ono K, Ruscheinski J, Wang PL & Ideker T 2011 Cytoscape 2.8:
new features for data integration and network visualization.
Bioinformatics 27 431–432. (doi:10.1093/bioinformatics/btq675)
Sookoian S & Pirola CJ 2013 Systems biology elucidates common
pathogenic mechanisms between nonalcoholic and alcoholic-fatty
liver disease. PLoS ONE 8 e58895. (doi:10.1371/journal.pone.0058895)
Stark C, Breitkreutz BJ, Chatr-Aryamontri A, Boucher L, Oughtred R,
Livstone MS, Nixon J, Van Auken K, Wang X, Shi X et al. 2011 The
BioGRID interaction database: 2011 update. Nucleic Acids Research 2011
D698–D704. (doi:10.1093/nar/gkq1116)
Stevens A, Clayton P, Tato L, Yoo HW, Rodriguez-Arnao MD, Skorodok J,
Ambler GR, Zignani M, Zieschang J, Della CG et al. 2013a Pharmaco-
genomics of insulin-like growth factor-I generation during GH
treatment in children with GH deficiency or Turner syndrome.
Pharmacogenomics Journal [in press]. (doi:10.1038/tpj.2013.14)
Stevens A, Cosgrove KE, Padidela R, Skae MS, Clayton PE, Banerjee I &
Dunne MJ 2013b Can network biology unravel the aetiology of
congenital hyperinsulinism? Orphanet Journal of Rare Diseases 8 21–28.
(doi:10.1186/1750-1172-8-21)
Stevens A, De Leonibus C, Destenaves B, Rodrguez-Arnao MD, Ambler GR,
Raelson J, Chatelain P & Clayton P 2013c Gene expression networks
associated with changes in serum insulin, insulin-like growth factor-I,
and growth in growth hormone (GH)-treated children with GH
deficiency. Endocrine Reviews 34 FP20–FP26.
Stevens A, Hanson D, Whatmore A, Destenaves B, Chatelain P & Clayton P
2013d Human growth is associated with distinct patterns of gene
expression in evolutionarily conserved networks. BMC Genomics 14
547. (doi:10.1186/1471-2164-14-547)
Strafella AP 2013 Anatomical and functional connectivity as a tool to study
brain networks in Parkinson’s disease. Movement Disorders 28 411–412.
(doi:10.1002/mds.25320)
Sun J & Zhao Z 2010 A comparative study of cancer proteins in the human
protein–protein interaction network. BMC Genomics 11 (Suppl 3) S5.
(doi:10.1186/1471-2164-11-S3-S5)
Szabo PM, Butz H, Igaz P, Racz K, Hunyady L & Patocs A 2013 Minireview:
MIRomics in endocrinology: a novel approach for modeling endocrine
diseases. Molecular Endocrinology 27 573–585. (doi:10.1210/me.2012-
1220)
Szalay-Beko M, Palotai R, Szappanos B, Kovacs IA, Papp B & Csermely P
2012 ModuLand plug-in for Cytoscape: determination of hierarchical
layers of overlapping network modules and community centrality.
Bioinformatics 28 2202–2204. (doi:10.1093/bioinformatics/bts352)
Published by Bioscientifica Ltd.
Downloaded from Bioscientifica.com at 03/13/2022 02:00:13AMvia free access

JournalofMolecu
larEndocrinology
Review A STEVENS and others Endocrine network analysis 52 :1 R93
Takarabe M, Shigemizu D, Kotera M, Goto S & Kanehisa M 2011 Network-
based analysis and characterization of adverse drug–drug interactions.
Journal of Chemical Information and Modeling 51 2977–2985.
(doi:10.1021/ci200367w)
Tang J & Aittokallio T 2013 Network pharmacology strategies toward
multi-target anticancer therapies: from computational models to
experimental design principles. Current Pharmaceutical Design [in press].
Thomas S & Bonchev D 2010 A survey of current software for network
analysis in molecular biology. Human Genomics 4 353–360.
(doi:10.1186/1479-7364-4-5-353)
Thompson JL & Nelson AJ 2011 Middle childhood and modern human
origins. Human Nature 22 249–280. (doi:10.1007/s12110-011-9119-3)
Tomar N & De RK 2013 Comparing methods for metabolic network
analysis and an application to metabolic engineering. Gene 521 1–14.
(doi:10.1016/j.gene.2013.03.017)
Toubiana D, Fernie AR, Nikoloski Z & Fait A 2013 Network analysis:
tackling complex data to study plant metabolism. Trends in
Biotechnology 31 29–36. (doi:10.1016/j.tibtech.2012.10.011)
Villa-Vialaneix N, Liaubet L, Laurent T, Cherel P, Gamot A & Sancristobal
M 2013 The structure of a gene co-expression network reveals biological
functions underlying eQTLs. PLoS ONE 8 e60045. (doi:10.1371/journal.
pone.0060045)
Vlahou A 2013 Network views for personalized medicine. Proteomics.
Clinical Applications 7 (5–6) 384–387. (doi:10.1002/prca.201200121)
Watkins SM, Reifsnyder PR, Pan HJ, German JB & Leiter EH 2002 Lipid
metabolome-wide effects of the PPARg agonist rosiglitazone.
http://jme.endocrinology-journals.org � 2014 Society for EndocrinologyDOI: 10.1530/JME-13-0112 Printed in Great Britain
Journal of Lipid Research 43 1809–1817. (doi:10.1194/jlr.M200169-
JLR200)
Werner T 2008 Bioinformatics applications for pathway analysis of
microarray data. Current Opinion in Biotechnology 19 50–54.
(doi:10.1016/j.copbio.2007.11.005)
Yamaga R, Ikeda K, Horie-Inoue K, Ouchi Y, Suzuki Y & Inoue S 2013 RNA
sequencing of MCF-7 breast cancer cells identifies novel estrogen-
responsive genes with functional estrogen receptor-binding sites in the
vicinity of their transcription start sites. Hormones & Cancer 4 222–232.
(doi:10.1007/s12672-013-0140-3)
Yamauchi T, Ueki K, Tobe K, Tamemoto H, Sekine N, Wada M, Honjo M,
Takahashi M, Takahashi T, Hirai H et al. 1997 Tyrosine phosphorylation
of the EGF receptor by the kinase Jak2 is induced by growth hormone.
Nature 390 91–96. (doi:10.1038/36369)
Youngs N, Penfold-Brown D, Drew K, Shasha D & Bonneau R 2013
Parametric Bayesian priors and better choice of negative examples
improve protein function prediction. Bioinformatics 29 1190–1198.
(doi:10.1093/bioinformatics/btt110)
Zhang M, Zhu C, Jacomy A, Lu LJ & Jegga AG 2011 The orphan disease
networks. American Journal of Human Genetics 88 755–766.
(doi:10.1016/j.ajhg.2011.05.006)
Zhang J, Ni S, Xiang Y, Parvin JD, Yang Y, Zhou Y & Huang K 2013
Gene co-expression analysis predicts genetic aberration loci
associated with colon cancer metastasis. International Journal of
Computational Biology and Drug Design 6 60–71. (doi:10.1504/IJCBDD.
2013.052202)
Received in final form 19 August 2013Accepted 1 October 2013Accepted Preprint published online 1 October 2013
Published by Bioscientifica Ltd.
Downloaded from Bioscientifica.com at 03/13/2022 02:00:13AMvia free access