Netflix, Inc.
34
UNITED STATES SECURITIES AND EXCHANGE COMMISSION Washington, D.C. 20549 FORM 10-Q (Mark One) x QUARTERLY REPORT PURSUANT TO SECTION 13 OR 15(d) OF THE SECURITIES EXCHANGE ACT OF 1934 For the quarterly period ended March 31, 2018 OR o TRANSITION REPORT PURSUANT TO SECTION 13 OR 15(d) OF THE SECURITIES EXCHANGE ACT OF 1934 For the transition period from to Commission File Number: 001-35727 Netflix, Inc. (Exact name of Registrant as specified in its charter) Delaware 77-0467272 (State or other jurisdiction of incorporation or organization) (I.R.S. Employer Identification Number) 100 Winchester Circle, Los Gatos, California 95032 (Address and zip code of principal executive offices) (408) 540-3700 (Registrant’s telephone number, including area code) Indicate by check mark whether the registrant (1) has filed all reports required to be filed by Section 13 or 15(d) of the Securities Exchange Act of 1934 during the preceding 12 months (or for such shorter period that the registrant was required to file such reports) and (2) has been subject to such filing requirements for the past 90 days. Yes x No o Indicate by check mark whether the registrant has submitted electronically and posted on its corporate Web site, if any, every Interactive Data File required to be submitted and posted pursuant to Rule 405 of Regulation S-T (§232.405 of this chapter) during the preceding 12 months (or for such shorter period that the registrant was required to submit and post such files). Yes x No o Indicate by check mark whether the registrant is a large accelerated filer, an accelerated filer, a non-accelerated filer, a smaller reporting company, or an emerging growth company. See definitions of “large accelerated filer,” “accelerated filer,” “smaller reporting company,” and “emerging growth company” in Rule 12b-2 of the Exchange Act. Large accelerated filer x Accelerated filer o Non-accelerated filer o (Do not check if a smaller reporting company) Smaller reporting company o Emerging growth company o If an emerging growth company, indicate by check mark if the registrant has elected not to use the extended transition period for complying with any new or revised financial accounting standards provided pursuant to Section 13(a) of the Exchange Act. o Indicate by check mark whether the registrant is a shell company (as defined by Rule 12b-2 of the Exchange Act). Yes o No x As of March 31, 2018 , there were 434,657,303 shares of the registrant’s common stock, par value $0.001, outstanding.
Transcript of Netflix, Inc.

UNITED STATESSECURITIES AND EXCHANGE COMMISSION
Washington, D.C. 20549
FORM 10-Q
(Mark One)xx QUARTERLY REPORT PURSUANT TO SECTION 13 OR 15(d) OF THE SECURITIES EXCHANGE ACT OF
1934
For the quarterly period ended March 31, 2018
OR
o TRANSITION REPORT PURSUANT TO SECTION 13 OR 15(d) OF THE SECURITIES EXCHANGE ACT OF1934
For the transition period from to
Commission File Number: 001-35727
Netflix, Inc.(Exact name of Registrant as specified in its charter)
Delaware 77-0467272
(State or other jurisdiction ofincorporation or organization)
(I.R.S. EmployerIdentification Number)
100 Winchester Circle, Los Gatos, California 95032(Address and zip code of principal executive offices)
(408) 540-3700(Registrant’s telephone number, including area code)
Indicate by check mark whether the registrant (1) has filed all reports required to be filed by Section 13 or 15(d) of the Securities Exchange Act of 1934
during the preceding 12 months (or for such shorter period that the registrant was required to file such reports) and (2) has been subject to such filing requirementsfor the past 90 days. Yes xx No o
Indicate by check mark whether the registrant has submitted electronically and posted on its corporate Web site, if any, every Interactive Data File requiredto be submitted and posted pursuant to Rule 405 of Regulation S-T (§232.405 of this chapter) during the preceding 12 months (or for such shorter period that theregistrant was required to submit and post such files). Yes xx No o
Indicate by check mark whether the registrant is a large accelerated filer, an accelerated filer, a non-accelerated filer, a smaller reporting company, or anemerging growth company. See definitions of “large accelerated filer,” “accelerated filer,” “smaller reporting company,” and “emerging growth company” in Rule12b-2 of the Exchange Act.
Large accelerated filer x Accelerated filer o
Non-accelerated filer o (Do not check if a smaller reporting company) Smaller reporting company o
Emerging growth company o
If an emerging growth company, indicate by check mark if the registrant has elected not to use the extended transition period for complying with any new orrevised financial accounting standards provided pursuant to Section 13(a) of the Exchange Act. o
Indicate by check mark whether the registrant is a shell company (as defined by Rule 12b-2 of the Exchange Act). Yes o No xx
As of March 31, 2018 , there were 434,657,303 shares of the registrant’s common stock, par value $0.001, outstanding.

Table of Contents
Page
Part I. Financial Information Item 1. Consolidated Financial Statements Consolidated Statements of Operations 3 Consolidated Statements of Comprehensive Income 4 Consolidated Statements of Cash Flows 5 Consolidated Balance Sheets 6 Notes to Consolidated Financial Statements 7Item 2. Management’s Discussion and Analysis of Financial Condition and Results of Operations 17Item 3. Quantitative and Qualitative Disclosures About Market Risk 28Item 4. Controls and Procedures 28 Part II. Other Information Item 1. Legal Proceedings 28Item 1A. Risk Factors 29Item 6. Exhibits 29Signatures 30Exhibit Index 31
2

Table of Contents
NETFLIX, INC.
Consolidated Statements of Operations(unaudited)
(in thousands, except per share data)
Three Months Ended
March 31,
2018 March 31,
2017Revenues $ 3,700,856 $ 2,636,635
Cost of revenues 2,196,075 1,657,024Marketing 479,222 271,270Technology and development 300,730 257,108General and administrative 278,251 194,291
Operating income 446,578 256,942Other income (expense):
Interest expense (81,219) (46,742)Interest and other income (expense) (65,743) 13,592
Income before income taxes 299,616 223,792Provision for income taxes 9,492 45,570Net income $ 290,124 $ 178,222Earnings per share:
Basic $ 0.67 $ 0.41Diluted $ 0.64 $ 0.40
Weighted-average common shares outstanding: Basic 434,174 430,600Diluted 450,359 445,458
See accompanying notes to the consolidated financial statements.
3

Table of Contents
NETFLIX, INC.
Consolidated Statements of Comprehensive Income(unaudited)
(in thousands)
Three Months Ended
March 31,
2018 March 31,
2017Net income $ 290,124 $ 178,222Other comprehensive income:
Foreign currency translation adjustments 24,821 2,579Change in unrealized gains on available-for-sale securities, net of tax of $0, $77, respectively — 127
Total other comprehensive income 24,821 2,706Comprehensive income $ 314,945 $ 180,928
See accompanying notes to the consolidated financial statements.
4

Table of Contents
NETFLIX, INC.
Consolidated Statements of Cash Flows(unaudited)
(in thousands)
Three Months Ended
March 31,
2018 March 31,
2017Cash flows from operating activities: Net income $ 290,124 $ 178,222Adjustments to reconcile net income to net cash used in operating activities:
Additions to streaming content assets (2,986,747) (2,348,666)Change in streaming content liabilities 378,885 366,257Amortization of streaming content assets 1,748,844 1,305,683Amortization of DVD content assets 11,134 18,598Depreciation and amortization of property, equipment and intangibles 19,041 15,049Stock-based compensation expense 68,395 44,888Other non-cash items 8,209 21,666Foreign currency remeasurement loss on long-term debt 41,080 —Deferred taxes (22,049) (26,764)Changes in operating assets and liabilities:
Other current assets (55,905) (25,402)Accounts payable 74,083 (11,000)Accrued expenses 119,049 93,542Deferred revenue 55,270 15,221Other non-current assets and liabilities 13,830 8,850
Net cash used in operating activities (236,757) (343,856)Cash flows from investing activities: Acquisition of DVD content assets (10,796) (25,372)Purchases of property and equipment (37,170) (52,523)Change in other assets (1,786) (769)Purchases of short-term investments — (57,774)Proceeds from sale of short-term investments — 55,748Proceeds from maturities of short-term investments — 5,100
Net cash used in investing activities (49,752) (75,590)Cash flows from financing activities: Proceeds from issuance of common stock 56,335 24,178Other financing activities (321) 61
Net cash provided by financing activities 56,014 24,239Effect of exchange rate changes on cash, cash equivalents, and restricted cash 7,177 5,455Net decrease in cash, cash equivalents, and restricted cash (223,318) (389,752)Cash, cash equivalents, and restricted cash at beginning of period 2,822,795 1,467,576Cash, cash equivalents, and restricted cash at end of period $ 2,599,477 $ 1,077,824Supplemental disclosure: Increase (decrease) in investing activities included in liabilities $ 3,917 $ (16,672)
See accompanying notes to the consolidated financial statements.
5

Table of Contents
NETFLIX, INC.
Consolidated Balance Sheets(in thousands, except share and par value data)
As of
March 31,
2018 December 31,
2017
(unaudited) Assets Current assets:
Cash and cash equivalents $ 2,593,666 $ 2,822,795Current content assets, net 4,626,522 4,310,934Other current assets 597,388 536,245
Total current assets 7,817,576 7,669,974Non-current content assets, net 11,314,803 10,371,055Property and equipment, net 341,932 319,404Other non-current assets 678,486 652,309
Total assets $ 20,152,797 $ 19,012,742Liabilities and Stockholders’ Equity Current liabilities:
Current content liabilities $ 4,466,081 $ 4,173,041Accounts payable 436,183 359,555Accrued expenses 429,431 315,094Deferred revenue 673,892 618,622
Total current liabilities 6,005,587 5,466,312Non-current content liabilities 3,444,476 3,329,796Long-term debt 6,542,373 6,499,432Other non-current liabilities 139,631 135,246
Total liabilities 16,132,067 15,430,786Commitments and contingencies (Note 6) Stockholders’ equity:
Common stock, $0.001 par value; 4,990,000,000 shares authorized at March 31, 2018 and December 31, 2017;434,657,303 and 433,392,686 issued and outstanding at March 31, 2018 and December 31, 2017, respectively 1,995,225 1,871,396
Accumulated other comprehensive income (loss) 4,264 (20,557)Retained earnings 2,021,241 1,731,117
Total stockholders’ equity 4,020,730 3,581,956Total liabilities and stockholders’ equity $ 20,152,797 $ 19,012,742
See accompanying notes to the consolidated financial statements.
6

Table of Contents
NETFLIX, INC.
Notes to Consolidated Financial Statements(unaudited)
1. Basis of Presentation and Summary of Significant Accounting Policies
The accompanying interim consolidated financial statements of Netflix, Inc. and its wholly owned subsidiaries (the “Company”) have been prepared inconformity with accounting principles generally accepted in the United States (“U.S.”) and are consistent in all material respects with those applied in theCompany’s Annual Report on Form 10-K, as amended by Form 10-K/A, for the year ended December 31, 2017 filed with the Securities and ExchangeCommission (the “SEC”) on February 5, 2018 . The preparation of consolidated financial statements in conformity with U.S. generally accepted accountingprinciples (“GAAP”) requires management to make estimates and judgments that affect the amounts reported in the consolidated financial statements andaccompanying notes. Significant items subject to such estimates and assumptions include the streaming content asset amortization policy and the recognition andmeasurement of income tax assets and liabilities. The Company bases its estimates on historical experience and on various other assumptions that the Companybelieves to be reasonable under the circumstances. On a regular basis, the Company evaluates the assumptions, judgments and estimates. Actual results may differfrom these estimates.
The interim financial information is unaudited, but reflects all normal recurring adjustments that are, in the opinion of management, necessary to fairlypresent the information set forth herein. The interim consolidated financial statements should be read in conjunction with the audited consolidated financialstatements and related notes included in the Company’s Annual Report on Form 10-K, as amended by Form 10-K/A, for the year ended December 31, 2017 .Interim results are not necessarily indicative of the results for a full year.
The Company has three reportable segments: Domestic streaming, International streaming and Domestic DVD, all of which derive revenue from monthlymembership fees. See Note 10 for further detail on the Company's segments.
There have been no material changes in the Company’s significant accounting policies, other than the adoption of accounting pronouncements below, ascompared to the significant accounting policies described in the Company’s Annual Report on Form 10-K for the year ended December 31, 2017 .
Recently adopted accounting pronouncements
In May 2014, the Financial Accounting Standards Board ("FASB") issued ASU 2014-09, Revenue from Contracts with Customers (Topic 606) whichamended the existing accounting standards for revenue recognition. ASU 2014-09 establishes principles for recognizing revenue upon the transfer of promisedgoods or services to customers, in an amount that reflects the expected consideration received in exchange for those goods or services. The Company adopted ASU2014-09 in the first quarter of 2018 using the modified retrospective approach. Because the Company's primary source of revenues is from monthly membershipfees which are recognized ratably over each monthly membership period, the impact on its consolidated financial statements is not material.
In November 2016, the FASB issued ASU 2016-18, Restricted Cash , which requires amounts generally described as restricted cash and restricted cashequivalents be included with cash and cash equivalents when reconciling the total beginning and ending amounts for the periods shown on the statement of cashflows. The Company adopted ASU 2016-18 in the first quarter of 2018 and the impact on its consolidated financial statements is not material as the Company'srestricted cash balances are immaterial.
In January 2018, the FASB released guidance on the accounting for tax on the global intangible low-taxed income (“GILTI”) provisions of the Tax Cuts andJobs Act (the “Act”). The GILTI provisions impose a tax on foreign income in excess of a deemed return on tangible assets of foreign corporations. In the firstquarter of 2018, the Company elected to treat any potential GILTI inclusions as a period cost.
Recently issued accounting pronouncements not yet adopted
In February 2016, the FASB issued ASU 2016-02, Leases (Topic 842) in order to increase transparency and comparability among organizations byrecognizing lease assets and lease liabilities on the balance sheet for those leases classified as operating leases under previous GAAP. ASU 2016-02 requires that alessee should recognize a liability to make lease payments (the lease liability) and a right-of-use asset representing its right to use the underlying asset for the leaseterm on the balance sheet. ASU 2016-02 is effective for fiscal years beginning after December 15, 2018 (including interim periods within those periods) using amodified retrospective approach and early adoption is permitted. The Company will adopt ASU 2016-02 in the first quarter of 2019. Although the Company is inthe process of evaluating the impact of adoption of the ASU on its consolidated financial statements, the Company currently believes the most significant changewill be related to the recognition of right-of-use assets and lease liabilities on the Company's balance sheet for real estate operating leases.
7

Table of Contents
2. Earnings Per Share
Basic earnings per share is computed using the weighted-average number of outstanding shares of common stock during the period. Diluted earnings pershare is computed using the weighted-average number of outstanding shares of common stock and, when dilutive, potential common shares outstanding during theperiod. Potential common shares consist of incremental shares issuable upon the assumed exercise of stock options. The computation of earnings per share is asfollows:
Three Months Ended
March 31,
2018 March 31,
2017 (in thousands, except per share data)Basic earnings per share:
Net income $ 290,124 $ 178,222Shares used in computation: Weighted-average common shares outstanding 434,174 430,600
Basic earnings per share $ 0.67 $ 0.41
Diluted earnings per share: Net income $ 290,124 $ 178,222Shares used in computation:
Weighted-average common shares outstanding 434,174 430,600Employee stock options 16,185 14,858
Weighted-average number of shares 450,359 445,458Diluted earnings per share $ 0.64 $ 0.40
Employee stock options with exercise prices greater than the average market price of the common stock were excluded from the diluted calculation as theirinclusion would have been anti-dilutive. These anti-dilutive stock options were immaterial for each period presented.3. Cash, Cash Equivalents and Restricted Cash
As of March 31, 2018
Cash and cash
equivalents Non-current
Assets (1) (in thousands)Cash $ 1,867,506 $ 4,531Level 1 securities:
Money market funds 726,160 1,280
As of December 31, 2017
Cash and cash
equivalents Non-current
Assets (1) (in thousands)Cash $ 2,072,296 $ 4,367Level 1 securities:
Money market funds 449,734 1,276Level 2 securities:
Time Deposits 300,765 —
(1) Restricted cash related to workers compensation deposits and letter of credit agreements. Balance as of March 31, 2018 is included in cash, cash equivalents,and restricted cash on the Consolidated Statements of Cash Flows.
There were no material gross realized gains or losses in the three months ended March 31, 2018 and 2017, respectively.
8
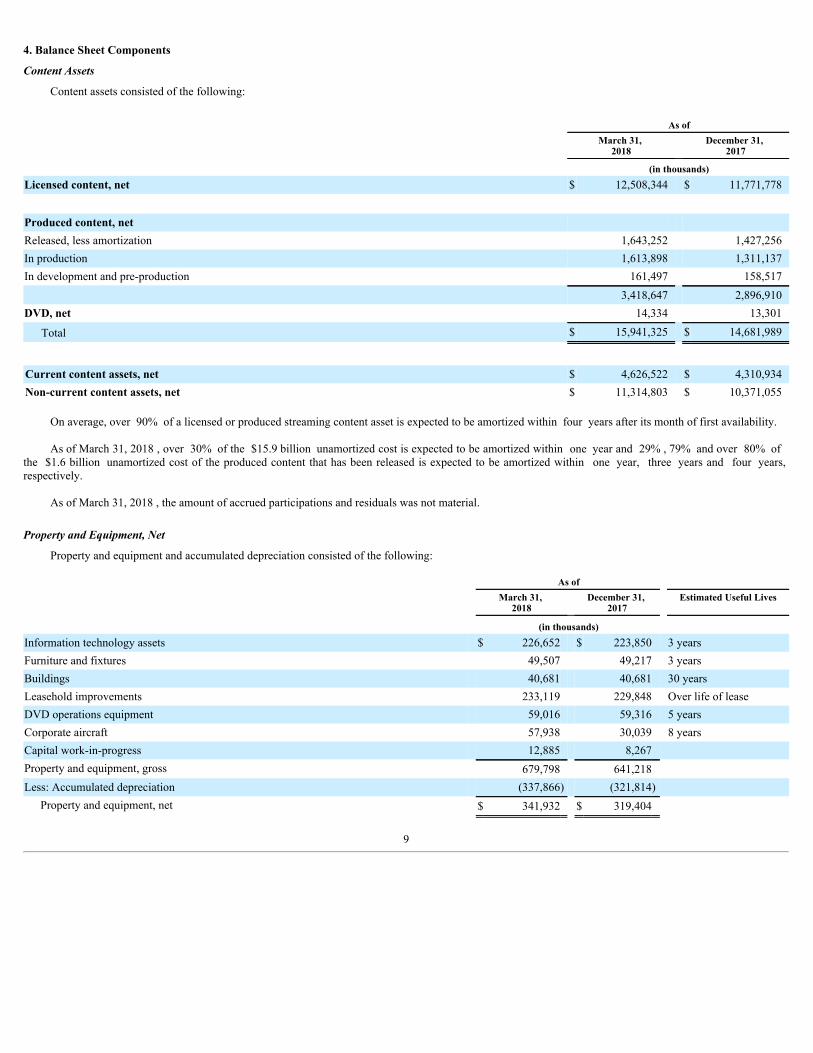
4. Balance Sheet Components
Content Assets
Content assets consisted of the following:
As of
March 31,
2018 December 31,
2017 (in thousands)Licensed content, net $ 12,508,344 $ 11,771,778
Produced content, net Released, less amortization 1,643,252 1,427,256In production 1,613,898 1,311,137In development and pre-production 161,497 158,517 3,418,647 2,896,910DVD, net 14,334 13,301
Total $ 15,941,325 $ 14,681,989
Current content assets, net $ 4,626,522 $ 4,310,934Non-current content assets, net $ 11,314,803 $ 10,371,055
On average, over 90% of a licensed or produced streaming content asset is expected to be amortized within four years after its month of first availability.
As of March 31, 2018 , over 30% of the $15.9 billion unamortized cost is expected to be amortized within one year and 29% , 79% and over 80% ofthe $1.6 billion unamortized cost of the produced content that has been released is expected to be amortized within one year, three years and four years,respectively.
As of March 31, 2018 , the amount of accrued participations and residuals was not material.
Property and Equipment, Net
Property and equipment and accumulated depreciation consisted of the following:
As of
March 31,
2018 December 31,
2017 Estimated Useful Lives
(in thousands) Information technology assets $ 226,652 $ 223,850 3 yearsFurniture and fixtures 49,507 49,217 3 yearsBuildings 40,681 40,681 30 yearsLeasehold improvements 233,119 229,848 Over life of leaseDVD operations equipment 59,016 59,316 5 yearsCorporate aircraft 57,938 30,039 8 yearsCapital work-in-progress 12,885 8,267 Property and equipment, gross 679,798 641,218 Less: Accumulated depreciation (337,866) (321,814)
Property and equipment, net $ 341,932 $ 319,404
9

Deferred Revenue
The Company’s primary source of revenues are from monthly membership fees. Members are billed in advance of the start of their monthly membership andrevenues are recognized ratably over each monthly membership period. Revenues are presented net of the taxes that are collected from members and remitted togovernmental authorities. The Company is the principal in all its relationships where partners, including consumer electronics (“CE”) manufacturers, multichannelvideo programming distributors (“MVPDs”), mobile operators and internet service providers (“ISPs”), provide access to the service as the Company retains controlover service delivery to its members. Typically, payments made to the partners, such as for marketing, are expensed, but in the case where the price that themember pays is established by the partners and there is no standalone price for the Netflix service (for instance, in a bundle), these payments are recognized as areduction of revenues.
Deferred revenue consists of membership fees billed that have not been recognized, as well as gift and other prepaid memberships that have not been fullyredeemed. As of March 31, 2018 , total deferred revenue was $673.9 million , the vast majority of which was related to membership fees billed that are expected tobe recognized as revenue within the next month. The remaining deferred revenue balance, which is related to gift cards and other prepaid memberships, will berecognized as revenue over the period of service after redemption, which is expected to occur over the next 12 months. The $55.3 million increase in deferredrevenue as compared to the year ended December 31, 2017 is a result of the increase in membership fees billed due to increased members and average monthlyrevenue per paying member.
5. Long-term Debt
As of March 31, 2018 , the Company had aggregate outstanding long-term notes of $6,542.4 million , net of $60.0 million of issuance costs, with varyingmaturities (the "Notes"). Each of the Notes were issued at par and are senior unsecured obligations of the Company. Interest is payable semi-annually at fixed rates.
The following table provides a summary of the Company's outstanding long-term debt and the fair values based on quoted market prices in less activemarkets as of March 31, 2018 and December 31, 2017 :
Level 2 Fair Value as of
Principal
Amount at Par Issuance Date Maturity Interest Payment Dates March 31, 2018 December 31, 2017
(in millions) (in millions)5.375% Senior Notes $ 500 February 2013 February 2021 February 1 and August 1 $ 519 $ 5305.750% Senior Notes 400 February 2014 March 2024 March 1 and September 1 417 4275.875% Senior Notes 800 February 2015 February 2025 April 15 and October 15 839 8565.50% Senior Notes 700 February 2015 February 2022 April 15 and October 15 727 7394.375% Senior Notes 1,000 October 2016 November 2026 May 15 and November 15 946 9833.625% Senior Notes (1) 1,602 May 2017 May 2027 May 15 and November 15 1,579 1,5754.875% Senior Notes 1,600 October 2017 April 2028 April 15 and October 15 1,539 1,571
$ 6,602
(1) Debt is denominated in euro with a €1,300 million aggregate principal amount and is remeasured into U.S. dollars at each balance sheet date.
The expected timing of principal and interest payments for these Senior Notes are as follows:
As of
March 31,
2018 December 31, 2017 (in thousands)Less than one year $ 312,828 $ 311,339Due after one year and through three years 1,130,423 627,444Due after three years and through five years 1,251,006 1,761,465Due after five years 6,384,861 6,348,580Total debt obligations $ 9,079,118 $ 9,048,828
10

Table of Contents
Each of the Notes are repayable in whole or in part upon the occurrence of a change of control, at the option of the holders, at a purchase price in cash equalto 101% of the principal plus accrued interest. The Company may redeem the Notes prior to maturity in whole or in part at an amount equal to the principal amountthereof plus accrued and unpaid interest and an applicable premium. The Notes include, among other terms and conditions, limitations on the Company's ability tocreate, incur or allow certain liens; enter into sale and lease-back transactions; create, assume, incur or guarantee additional indebtedness of certain of theCompany's subsidiaries; and consolidate or merge with, or convey, transfer or lease all or substantially all of the Company's and its subsidiaries assets, to anotherperson. As of March 31, 2018 and December 31, 2017 , the Company was in compliance with all related covenants.
Revolving Credit Facility
In July 2017, the Company entered into a $500.0 million unsecured revolving credit facility (“Revolving Credit Agreement”), with an uncommittedincremental facility to increase the amount of the revolving credit facility by up to an additional $250.0 million , subject to certain terms and conditions. Revolvingloans may be borrowed, repaid and reborrowed until July 27, 2022, at which time all amounts borrowed must be repaid. The Company may use the proceeds offuture borrowings under the Revolving Credit Agreement for working capital and general corporate purposes. As of March 31, 2018 , no amounts have beenborrowed under the Revolving Credit Agreement.
The borrowings under the Revolving Credit Agreement bear interest, at the Company’s option, of either a floating rate equal to a base rate (the “AlternateBase Rate”) or (ii) a rate equal to an adjusted London interbank offered rate (the “Adjusted LIBO Rate”), plus a margin of 0.75% . The Alternate Base Rate isdefined as the greatest of (A) the rate of interest published by the Wall Street Journal, from time to time, as the prime rate, (B) the federal funds rate, plus 0.500%and (C) the Adjusted LIBO Rate for a one-month interest period, plus 1.00% . The Adjusted LIBO Rate is defined as the London interbank offered rate for depositsin U.S. dollars, for the relevant interest period, adjusted for statutory reserve requirements, but in no event shall the Adjusted LIBO Rate be less than 0.00% perannum.
The Company is also obligated to pay a commitment fee on the undrawn amounts of the Revolving Credit Agreement at a rate of 0.10% . The RevolvingCredit Agreement requires the Company to comply with certain covenants, including covenants that limit or restrict the ability of the Company’s subsidiaries toincur debt and limit or restrict the ability of the Company and its subsidiaries to grant liens and enter into sale and leaseback transactions; and, in the case of theCompany or a guarantor, merge, consolidate, liquidate, dissolve or sell, transfer, lease or otherwise dispose of all or substantially all of the assets of the Companyand its subsidiaries, taken as a whole. As of March 31, 2018 , the Company was in compliance with all related covenants.
6. Commitments and Contingencies
Streaming Content
As of March 31, 2018 , the Company had $17.9 billion of obligations comprised of $4.5 billion included in "Current content liabilities" and $3.4 billion of"Non-current content liabilities" on the Consolidated Balance Sheets and $10.0 billion of obligations that are not reflected on the Consolidated Balance Sheets asthey did not yet meet the criteria for asset recognition.
As of December 31, 2017 , the Company had $17.7 billion of obligations comprised of $4.2 billion included in "Current content liabilities" and $3.3 billion of"Non-current content liabilities" on the Consolidated Balance Sheets and $10.2 billion of obligations that are not reflected on the Consolidated Balance Sheets asthey did not yet meet the criteria for asset recognition.
The expected timing of payments for these streaming content obligations is as follows:
As of
March 31,
2018 December 31,
2017 (in thousands)Less than one year $ 7,949,544 $ 7,446,947Due after one year and through three years 8,015,837 8,210,159Due after three years and through five years 1,849,029 1,894,001Due after five years 123,272 143,535Total streaming content obligations $ 17,937,682 $ 17,694,642
11

Table of Contents
Content obligations include amounts related to the acquisition, licensing and production of streaming content. Obligations that are in non-U.S. dollarcurrencies are translated to the U.S. dollar at period end rates. An obligation for the production of content includes non-cancelable commitments under creativetalent and employment agreements as well as other production related commitments. An obligation for the acquisition and licensing of content is incurred at thetime the Company enters into an agreement to obtain future titles. Once a title becomes available, a content liability is recorded on the Consolidated BalanceSheets. Certain agreements include the obligation to license rights for unknown future titles, the ultimate quantity and/or fees for which are not yet determinable asof the reporting date. Traditional film output deals, or certain TV series license agreements where the number of seasons to be aired is unknown, are examples ofsuch license agreements. The Company does not include any estimated obligation for these future titles beyond the known minimum amount. However, theunknown obligations are expected to be significant.
Legal Proceedings
From time to time, in the normal course of its operations, the Company is subject to litigation matters and claims, including claims relating to employeerelations, business practices and patent infringement. Litigation can be expensive and disruptive to normal business operations. Moreover, the results of complexlegal proceedings are difficult to predict and the Company's view of these matters may change in the future as the litigation and events related thereto unfold. TheCompany expenses legal fees as incurred. The Company records a provision for contingent losses when it is both probable that a liability has been incurred and theamount of the loss can be reasonably estimated. An unfavorable outcome to any legal matter, if material, could have an adverse effect on the Company's operationsor its financial position, liquidity or results of operations.
The Company is involved in litigation matters not listed herein but does not consider the matters to be material either individually or in the aggregate at thistime. The Company's view of the matters not listed may change in the future as the litigation and events related thereto unfold.
Indemnification
In the ordinary course of business, the Company has entered into contractual arrangements under which it has agreed to provide indemnification of varyingscope and terms to business partners and other parties with respect to certain matters, including, but not limited to, losses arising out of the Company’s breach ofsuch agreements and out of intellectual property infringement claims made by third parties. In these circumstances, payment may be conditional on the other partymaking a claim pursuant to the procedures specified in the particular contract.
The Company's obligations under these agreements may be limited in terms of time or amount, and in some instances, the Company may have recourseagainst third parties for certain payments. In addition, the Company has entered into indemnification agreements with its directors and certain of its officers thatwill require it, among other things, to indemnify them against certain liabilities that may arise by reason of their status or service as directors or officers. The termsof such obligations vary.
It is not possible to make a reasonable estimate of the maximum potential amount of future payments under these or similar agreements due to the conditionalnature of the Company’s obligations and the unique facts and circumstances involved in each particular agreement. No amount has been accrued in theaccompanying consolidated financial statements with respect to these indemnification obligations.
7. Stockholders’ Equity
Stock Option Plan
In June 2011, the Company adopted the 2011 Stock Plan. The 2011 Stock Plan provides for the grant of incentive stock options to employees and for thegrant of non-statutory stock options, stock appreciation rights, restricted stock and restricted stock units to employees, directors and consultants. As of March 31,2018 , 10.2 million shares were reserved for future grants under the 2011 Stock Plan.
A summary of the activities related to the Company’s stock option plans is as follows:
Options Outstanding
Shares Available for Grant
Number of Shares
Weighted- Average
Exercise Price(per share)
Weighted-AverageRemaining
Contractual Term (in years)
Aggregate Intrinsic Value (in thousands)
Balances as of December 31, 2017 10,739,915 21,647,350 $ 61.13 Granted (553,220) 553,220 252.69 Exercised — (1,264,617) 43.84
Balances as of March 31, 2018 10,186,695 20,935,953 $ 67.24 5.91 $ 4,775,786Vested and exercisable as of March 31, 2018 20,935,953 $ 67.24 5.91 $ 4,775,786
12

Table of Contents
The aggregate intrinsic value in the table above represents the total pretax intrinsic value (the difference between the Company’s closing stock price on thelast trading day of the first quarter of 2018 and the exercise price, multiplied by the number of in-the-money options) that would have been received by the optionholders had all option holders exercised their options on the last trading day of the first quarter of 2018 . This amount changes based on the fair market value of theCompany’s common stock.
A summary of the amounts related to option exercises, is as follows:
Three Months Ended
March 31,
2018 March 31,
2017 (in thousands)Total intrinsic value of options exercised $ 277,910 $ 107,097Cash received from options exercised 56,335 24,178
Stock-based CompensationStock options granted are exercisable for the full ten year contractual term regardless of employment status. The following table summarizes the assumptions
used to value option grants using the lattice-binomial model and the valuation data:
Three Months Ended
March 31,
2018 March 31,
2017Dividend yield —% —%Expected volatility 40% 37%Risk-free interest rate 2.61% 2.45%Suboptimal exercise factor 2.80 2.48Weighted-average fair value (per share) $ 123.63 $ 62.36Total stock-based compensation expense (in thousands) $ 68,395 $ 44,888Total income tax impact on provision (in thousands) $ 14,691 $ 14,701
The Company considers several factors in determining the suboptimal exercise factor, including the historical and estimated option exercise behavior.
The Company calculates expected volatility based solely on implied volatility. The Company believes that implied volatility of publicly traded options in itscommon stock is more reflective of market conditions, and given consistently high trade volumes of the options, can reasonably be expected to be a better indicatorof expected volatility than historical volatility of its common stock.
In valuing shares issued under the Company’s employee stock option plans, the Company bases the risk-free interest rate on U.S. Treasury zero-couponissues with terms similar to the contractual term of the options. The Company does not anticipate paying any cash dividends in the foreseeable future and thereforeuses an expected dividend yield of zero in the option valuation model. The Company does not use a post-vesting termination rate as options are fully vested upongrant date.
8. Accumulated Other Comprehensive Loss
The accumulated balance of other comprehensive income (loss), net of tax, for the three months ended March 31, 2018 increased $24.8 million due tocumulative translation adjustments for its non-US dollar functional currency subsidiaries.
9. Income Taxes
The effective tax rates for the three months ended March 31, 2018 and 2017 were 3% and 20% , respectively. The effective tax rates for the three monthsended March 31, 2018 differed from the Federal statutory rate primarily due to the recognition of excess tax benefits of stock-based compensation and Federal andCalifornia research and development credits (“R&D”), partially offset by state taxes, foreign taxes, non-deductible expenses, and the international provisions fromthe U.S. tax reform enacted in December 2017. The effective tax rate for the three months ended March 31, 2017 differed from the Federal statutory rate primarilydue to the recognition of excess tax benefits as a component of the provision for income taxes attributable to the adoption of ASU 2016-09 and Federal andCalifornia R&D credits offset by state taxes, foreign taxes and non-deductible expenses. The decrease in effective tax rate for the three months ended March 31,2018 as compared to the same period in 2017 was due primarily to the reduction of the U.S. corporate tax rate from 35% to 21% as a result of the U.S. tax reform
13

Table of Contents
enacted in December 2017 . For the three months ended March 31, 2018 and 2017 , the Company recognized a discrete tax benefit related to the excess tax benefitsfrom stock-based compensation of $60.7 million and $36.0 million , respectively.
In December 2017, the Tax Cuts and Jobs Act of 2017 (the “Act”) was signed into law making significant changes to the Internal Revenue Code. Changesinclude, but are not limited to, a corporate tax rate decrease from 35% to 21% effective for tax years beginning after December 31, 2017 , the transition of U.S.international taxation from a worldwide tax system to a territorial system, and a one-time transition tax on the mandatory deemed repatriation of cumulativeforeign earnings as of December 31, 2017 .
On December 22, 2017 , Staff Accounting Bulletin No. 118 (“SAB 118”) was issued to address the application of U.S. GAAP in situations when a registrantdoes not have the necessary information available, prepared, or analyzed (including computations) in reasonable detail to complete the accounting for certainincome tax effects of the Act. For the three months ended March 31, 2018 , the Company obtained additional information affecting the provisional amount initiallyrecorded for the transition tax for the three months ended December 31, 2017 . As a result, the Company recorded an immaterial adjustment to the transition tax.Additional work is still necessary for a more detailed analysis of the Company's deferred tax assets and liabilities and its historical foreign earnings as well aspotential correlative adjustments. Any subsequent adjustment to these amounts will be recorded to current tax expense in the quarter of 2018 when the analysis iscomplete.
Gross unrecognized tax benefits were $47.8 million and $42.9 million as of March 31, 2018 and December 31, 2017 , respectively. The gross unrecognizedtax benefits, if recognized by the Company, will result in a reduction of approximately $44.5 million to the provision for income taxes thereby favorably impactingthe Company’s effective tax rate. As of March 31, 2018 , gross unrecognized tax benefits of $25.4 million was classified as “Other non-current liabilities” and$22.4 million as a reduction to deferred tax assets which was classified as "Other non-current assets" in the Consolidated Balance Sheets. The Company includesinterest and penalties related to unrecognized tax benefits within the "Provision for income taxes" on the Consolidated Statements of Operations and “Other non-current liabilities” in the Consolidated Balance Sheets. Interest and penalties included in the Company’s “Provision for income taxes” were not material in any ofthe periods presented.
Deferred tax assets of $500.6 million and $478.3 million were classified as “Other non-current assets” on the Consolidated Balance Sheets as of March 31,2018 and December 31, 2017 , respectively. In evaluating its ability to realize the net deferred tax assets, the Company considered all available positive andnegative evidence, including its past operating results and the forecast of future market growth, forecasted earnings, future taxable income, and prudent andfeasible tax planning strategies. The Company has a valuation allowance of $71.0 million and $49.4 million as of March 31, 2018 and December 31, 2017 ,respectively. The valuation allowance is primarily related to certain foreign tax credit carryovers that are not likely to be recognized.
The Company files U.S. Federal, state and foreign tax returns. The Company is currently under examination by the IRS and the state of California for 2014and 2015 . The 2016 Federal tax return remains subject to examination by the IRS. The 2009 through 2016 state tax returns are subject to examination by state taxauthorities. The Company has no significant foreign jurisdiction audits underway. The years 2012 through 2017 remain subject to examination by foreign taxauthorities.
Given the potential outcome of the current examinations as well as the impact of the current examinations on the potential expiration of the statute oflimitations, it is reasonably possible that the balance of unrecognized tax benefits could significantly change within the next twelve months. At this time, anestimate of the range of reasonably possible adjustments to the balance of unrecognized tax benefits cannot be made.
10. Segment Information
The Company has three reportable segments: Domestic streaming, International streaming and Domestic DVD. Segment information is presented in the samemanner that the Company’s chief operating decision maker (“CODM”) reviews the operating results in assessing performance and allocating resources. TheCompany’s CODM reviews revenues and contribution profit (loss) for each of the reportable segments. Contribution profit (loss) is defined as revenues less cost ofrevenues and marketing expenses incurred by the segment. The Company has aggregated the results of the International operating segments into one reportablesegment because these operating segments share similar long-term economic and other qualitative characteristics.
The Domestic streaming segment derives revenues from monthly membership fees for services consisting solely of streaming content to members in theUnited States. The International streaming segment derives revenues from monthly membership fees for services consisting solely of streaming content tomembers outside of the United States. The Domestic DVD segment derives revenues from monthly membership fees for services consisting solely of DVD-by-mail. Revenues and the related payment card fees are attributed to the operating segment based on the nature of the underlying membership (streaming or DVD)and the geographic region from which the membership originates. There are no internal revenue transactions between the Company’s segments.
Amortization of streaming content assets makes up the vast majority of cost of revenues. The Company obtains multi-territory or global rights for itsstreaming content and allocates these rights between Domestic and International streaming segments based on estimated fair market value. Amortization of contentassets and other expenses associated with the acquisition, licensing, and production of streaming content for each streaming segment thus includes both expensesdirectly incurred by the segment as well as an allocation of expenses incurred for global or multi-territory rights. Other costs of revenues such as delivery costs areprimarily attributed to the operating segment based on amounts directly incurred by the segment. Marketing expenses consist primarily of advertising expenses andcertain payments made to
14

Table of Contents
marketing partners, including consumer electronics (“CE”) manufacturers, multichannel video programming distributors (“MVPDs”), mobile operators andinternet service providers (“ISPs”), which are generally included in the segment in which the expenditures are directly incurred.
The Company's long-lived tangible assets were located as follows:
As of
March 31,
2018 December 31, 2017 (in thousands)United States $ 309,050 $ 289,875International 32,882 29,529
The following table represents segment information for the three months ended March 31, 2018 :
As of/ Three Months Ended March 31, 2018
Domestic Streaming
International Streaming
Domestic DVD Consolidated
(in thousands)Total memberships at end of period (1) 56,705 68,290 3,167 Revenues $ 1,820,019 $ 1,782,086 $ 98,751 $ 3,700,856Cost of revenues 894,873 1,258,809 42,393 2,196,075Marketing 228,022 251,200 — 479,222
Contribution profit $ 697,124 $ 272,077 $ 56,358 $ 1,025,559Other operating expenses 578,981
Operating income 446,578Other income (expense) (146,962)Provision for income taxes 9,492
Net income $ 290,124
The following table represents segment information for the three months ended March 31, 2017 :
As of/ Three Months Ended March 31, 2017
Domestic Streaming
International Streaming
Domestic DVD Consolidated
(in thousands)Total memberships at end of period (1) 50,854 47,894 3,944 Revenues $ 1,470,042 $ 1,046,199 $ 120,394 $ 2,636,635Cost of revenues 749,488 847,317 60,219 1,657,024Marketing 115,038 156,232 — 271,270
Contribution profit (loss) $ 605,516 $ 42,650 $ 60,175 $ 708,341Other operating expenses 451,399
Operating income 256,942Other income (expense) (33,150)Provision for income taxes 45,570
Net income $ 178,222
15

Table of Contents
The following table represents the amortization of content assets:
Domestic
Streaming International
Streaming Domestic
DVD Consolidated (in thousands)Three months ended March 31, 2018 $ 730,272 $ 1,018,572 $ 11,134 $ 1,759,9782017 608,748 696,935 18,598 1,324,281
(1) A membership (also referred to as a subscription) is defined as the right to receive Netflix service following sign-up and a method of payment being provided.Memberships are assigned to territories based on the geographic location used at time of sign-up as determined by the Company's internal systems, which utilizeindustry standard geo-location technology. The Company offers free-trial memberships to certain new and rejoining members. Total members include those who areon a free-trial as long as a method of payment has been provided. A membership is canceled and ceases to be reflected in the above metrics as of the effectivecancellation date. Voluntary cancellations become effective at the end of the prepaid membership period, while involuntary cancellation of the service, as a result of afailed method of payment, becomes effective immediately.
16

Table of Contents
Item 2. Management’s Discussion and Analysis of Financial Condition and Results of Operations
Forward-Looking Statements
This Quarterly Report on Form 10-Q contains forward-looking statements within the meaning of the federal securities laws. These forward-lookingstatements include, but are not limited to statements regarding: our core strategy; the impact of, and the Company’s response to, new accounting standards; contentamortization; pricing changes; dividends; impact of foreign currency and exchange rate fluctuations, including on net income, revenues and average revenues perpaying member; investments in global streaming, including original content; impact of content on membership growth; cash use in connection with the acquisition,licensing and production of content; liquidity and free cash flow; unrecognized tax benefits; deferred tax assets; effective tax rate; accessing and obtainingadditional capital, including future debt financing; accounting treatment for changes related to content assets; and future contractual obligations, includingunknown streaming content obligations and timing of payments. These forward-looking statements are subject to risks and uncertainties that could cause actualresults and events to differ materially from those included in forward-looking statements. Factors that might cause or contribute to such differences include, but arenot limited to, those discussed in our Annual Report on Form 10-K, as amended by Form 10-K/A, for the year ended December 31, 2017 filed with the Securitiesand Exchange Commission (“SEC”) on February 5, 2018 , in particular the risk factors discussed under the heading “Risk Factors” in Part I, Item IA.
We assume no obligation to revise or publicly release any revision to any forward-looking statements contained in this Quarterly Report on Form 10-Q,unless required by law.
Investors and others should note that we announce material financial information to our investors using our investor relations Web site (http://ir.netflix.com),SEC filings, press releases, public conference calls and webcasts. We use these channels, as well as social media, to communicate with our members and the publicabout our company, our services and other issues. It is possible that the information we post on social media could be deemed to be material information.Therefore, we encourage investors, the media, and others interested in our company to review the information we post on the United States ("U.S.") social mediachannels listed on our investor relations Web site.
Overview
We are the world’s leading internet television network with over 125 million streaming memberships in over 190 countries enjoying more than 140 millionhours of TV shows and movies per day, including original series, documentaries and feature films. Members can watch as much as they want, anytime, anywhere,on nearly any internet-connected screen. Members can play, pause and resume watching, all without commercials or commitments. Additionally, in the U.S., ourmembers can receive DVDs delivered quickly to their homes.
We are a pioneer in the internet delivery of TV shows and movies, launching our streaming service in 2007. Since this launch, we have developed anecosystem for internet-connected screens and have added increasing amounts of content that enable consumers to enjoy TV shows and movies directly on theirinternet-connected screens. As a result of these efforts, we have experienced growing consumer acceptance of, and interest in, the delivery of TV shows andmovies directly over the internet. Historically, the first and fourth quarters (October through March) represent our greatest membership growth across ourDomestic and International streaming segments. Increasingly, our membership growth is impacted by the release of certain high-profile original content, whichmay affect historical seasonal patterns. Internationally, we expect each market to demonstrate more predictable seasonal patterns as our service offering in eachmarket becomes more established and we have a longer history to assess such patterns.
Our core strategy is to grow our streaming membership business globally within the parameters of our profit margin targets. We are continuously improvingour members' experience by expanding our streaming content with a focus on a programming mix of content that delights our members. In addition, we arecontinuously enhancing our user interface and extending our streaming service to more internet-connected screens. Our members can download a selection of titlesfor offline viewing.
17

Table of Contents
Results of Operations
The following represents our consolidated performance highlights:
As of/ Three Months Ended Change
March 31,
2018 March 31,
2017 Q1'18 vs. Q1'17
(in thousands, except revenue per membership and percentages)
Global streaming memberships at end of period 124,995 98,748 26,247 27%Global streaming average monthly revenue per paying membership $ 10.46 $ 9.14 $ 1.32 14%Revenues 3,700,856 2,636,635 1,064,221 40%Global operating income 446,578 256,942 189,636 74%Global operating margin 12.1% 9.7% 2.4% 25%Net income 290,124 178,222 111,902 63%
Consolidated revenues for the three months ended March 31, 2018 increased 40% , including an increase of 24% and 70% in revenues in the Domesticstreaming and International streaming segments, respectively as compared to the three months ended March 31, 2017 . International revenues accounted for 48% ofconsolidated revenue for the period ended March 31, 2018 as compared to 40% of consolidated revenue for the period ended March 31, 2017 . The increase inconsolidated revenues was primarily driven by the growth in the average number of paid streaming memberships globally, the majority of which was growth in ourinternational memberships. Average paid international streaming memberships accounted for 53% of total average paid streaming memberships as of March 31,2018 , as compared to 47% of total average paid streaming memberships for the same period in 2017 . In addition, the average monthly revenue per payingstreaming membership increased primarily due to price changes and plan mix.
The increase in operating income is due primarily to increased revenues partially offset by increased content expenses as we continue to acquire, license andproduce content, including more Netflix originals, as well as increased headcount costs to support continued improvements in our streaming service, ourinternational expansion, and our growing content production activities. The increase in net income was comprised of an increase in operating income, partiallyoffset by an increase in interest expense primarily due to the higher principal of senior notes outstanding and an increase in foreign exchange losses primarily dueto the remeasurement of our euro denominated senior notes.
We offer three types of streaming membership plans. Our “basic” plan includes access to standard definition quality streaming on a single screen at a time.Our “standard” plan is our most popular streaming plan and includes access to high definition quality streaming on two screens concurrently. Our “premium” planincludes access to high definition and ultra-high definition quality content on four screens concurrently. As of March 31, 2018 , pricing on our plans ranged in theU.S. from $7.99 to $13.99 per month and internationally from the U.S. dollar equivalent of approximately $4 to $21 per month. We expect that from time to timethe prices of our membership plans in each country may increase.
The following represents the key elements to our segment results of operations:
• We define contribution profit (loss) as revenues less cost of revenues and marketing expenses incurred by the segment. It represents each segment'sperformance before global corporate costs. As markets within our International streaming segment become profitable, we increasingly focus on our globaloperating margin as a measure of profitability.
• For the Domestic and International streaming segments, amortization of the streaming content assets makes up the vast majority of cost of revenues.Increasingly, we obtain multi-territory or global rights for our streaming content and allocate these rights between Domestic and International streamingsegments based on estimated fair market value. Expenses associated with the acquisition, licensing and production of streaming content, streamingdelivery costs and other operations costs make up the remainder of cost of revenues. We have built our own global content delivery network (“OpenConnect”) to help us efficiently stream a high volume of content to our members over the internet. Streaming delivery expenses, therefore, includeequipment costs related to Open Connect and all third-party costs, such as cloud computing costs, associated with delivering streaming content over theinternet. Other operations costs include customer service and payment processing fees, including those we pay to our integrated payment partners, as wellas other costs incurred in making our content available to members.
• For the Domestic and International streaming segments, marketing expenses consist primarily of advertising expenses and certain payments made to ourmarketing partners, including consumer electronics manufacturers, MVPD's, mobile operators and ISP's. Advertising expenses include promotionalactivities such as digital and television advertising. Marketing expenses are incurred by our Domestic and International streaming segments given ourfocus on building consumer awareness of the streaming offerings, and in particular our original content.
18

Table of Contents
Domestic Streaming Segment
Three months ended March 31, 2018 as compared to the three months ended March 31, 2017
As of/ Three Months Ended Change
March 31,
2018 March 31,
2017 Q1'18 vs. Q1'17
(in thousands, except revenue per membership and percentages)Memberships:
Net additions 1,955 1,423 532 37%Memberships at end of period 56,705 50,854 5,851 12%Paid memberships at end of period 55,087 49,375 5,712 12%Average monthly revenue per paying membership $ 11.25 $ 10.07 $ 1.18 12%
Contribution profit:
Revenues $ 1,820,019 $ 1,470,042 $ 349,977 24%Cost of revenues 894,873 749,488 145,385 19%Marketing 228,022 115,038 112,984 98%Contribution profit 697,124 605,516 91,608 15%Contribution margin 38% 41%
In the Domestic streaming segment, we derive revenues from monthly membership fees for services consisting solely of streaming content to our members inthe United States. The increase in our domestic streaming revenues was primarily due to the 11% growth in the average number of paid memberships, as well as a12% increase in the average monthly revenue per paying membership, resulting from our price changes and plan mix. Our standard plan continues to be the mostpopular plan choice for new memberships.
The increase in domestic streaming cost of revenues was primarily due to a $121.5 million increase in content amortization relating to our existing and newstreaming content, including more exclusive and original programming. In addition, we had a $23.9 million increase in other costs, such as payment processingfees and customer service call centers, due to our growing member base.
Domestic marketing expenses increased primarily due to increased advertising and public relations.
Our Domestic streaming segment had a contribution margin of 38% for the three months ended March 31, 2018 and decreased as compared to thecontribution margin of 41% for the three months ended March 31, 2017 as the growth in marketing spend outpaced revenue growth.
International Streaming SegmentThree months ended March 31, 2018 as compared to the three months ended March 31, 2017
As of/ Three Months Ended Change
March 31,
2018 March 31,
2017 Q1'18 vs. Q1'17
(in thousands, except revenue per membership and percentages)Memberships:
Net additions 5,458 3,529 1,929 55%Memberships at end of period 68,290 47,894 20,396 43%Paid memberships at end of period 63,815 44,988 18,827 42%Average monthly revenue per paying membership $ 9.77 $ 8.09 $ 1.68 21%
Contribution profit:
Revenues $ 1,782,086 $ 1,046,199 $ 735,887 70%Cost of revenues 1,258,809 847,317 411,492 49%Marketing 251,200 156,232 94,968 61%Contribution profit 272,077 42,650 229,427 538%Contribution margin 15% 4%
19

Table of Contents
In the International streaming segment, we derive revenues from monthly membership fees for services consisting solely of streaming content to ourmembers outside the United States. The increase in our international revenues was due to the 41% growth in the average number of paid internationalmemberships, in addition to a 21% increase in the average monthly revenue per paying membership. The increase in the average monthly revenue per payingmembership was due to price changes and plan mix coupled with favorable fluctuations in foreign exchange rates. We estimate that international revenues in thefirst quarter of 2018 would have been approximately $114.2 million lower if foreign exchange rates had remained consistent with the foreign exchange rates fromthe first quarter of 2017 . If foreign currency exchange rates fluctuate more than expected, revenues and average revenue per paying membership may differ fromour expectations.
The increase in international cost of revenues was primarily due to a $321.6 million increase in content amortization relating to our existing and newstreaming content, including more exclusive and original programming. Other costs increased $89.9 million primarily due to increases in our streaming deliveryexpenses, costs associated with our customer service call centers and payment processing fees, all driven by our growing member base.
International marketing expenses increased mainly due to increased advertising and public relations as well as increased payments to our partners.
International contribution profit for the three months ended March 31, 2018 was $272.1 million as compared to a contribution profit of $42.7 million for thethree months ended March 31, 2017 as profit growth in our more mature markets offset investments in newer markets.
Domestic DVD SegmentThree months ended March 31, 2018 as compared to the three months ended March 31, 2017
As of/ Three Months Ended Change
March 31,
2018 March 31,
2017 Q1'18 vs. Q1'17
(in thousands, except revenue per membership and percentages)Memberships:
Net losses (216) (170) (46) (27)%Memberships at end of period 3,167 3,944 (777) (20)%Paid memberships at end of period 3,138 3,867 (729) (19)%Average monthly revenue per paying membership $ 10.18 $ 10.16 $ 0.02 — %
Contribution profit:
Revenues $ 98,751 $ 120,394 $ (21,643) (18)%Cost of revenues 42,393 60,219 (17,826) (30)%Contribution profit 56,358 60,175 (3,817) (6)%Contribution margin 57% 50%
In the Domestic DVD segment, we derive revenues from our DVD-by-mail membership services. The price per plan for DVD-by-mail varies from $4.99 to$14.99 per month according to the plan chosen by the member. DVD-by-mail plans differ by the number of DVDs that a member may have out at any given point.Members electing access to high definition Blu-ray discs, in addition to standard definition DVDs, pay a surcharge ranging from $2 to $3 per month for our mostpopular plans. Cost of revenues in the Domestic DVD segment consist primarily of delivery expenses such as packaging and postage costs, content expenses, andother expenses associated with our DVD processing and customer service centers. The number of memberships to our DVD-by-mail offering is declining, and weanticipate that this decline will continue.
Our Domestic DVD segment contribution margin was 57% for the three months ended March 31, 2018 , as compared to 50% for the three months endedMarch 31, 2017 , due to the decreased DVD usage by paying members and decreased DVD content expenses.
20

Table of Contents
Consolidated Operating Expenses
Technology and DevelopmentTechnology and development expenses consist of payroll and related expenses for all technology personnel, as well as other costs incurred in making
improvements to our service offerings, including testing, maintaining and modifying our user interface, our recommendation, merchandising and streamingdelivery technology and infrastructure. Technology and development expenses also include costs associated with computer hardware and software.
Three months ended March 31, 2018 as compared to the three months ended March 31, 2017
Three Months Ended Change
March 31,
2018 March 31,
2017 Q1'18 vs. Q1'17 (in thousands, except percentages)Technology and development $ 300,730 $ 257,108 $ 43,622 17%As a percentage of revenues 8% 10%
The increase in technology and development expenses was primarily due to a $37.8 million increase in personnel-related costs, including stock-basedcompensation expense, resulting from an increase in compensation for existing employees and growth in average headcount supporting continued improvements inour streaming service and our international expansion. In addition, third party expenses, including costs associated with cloud computing, increased $3.8 million .
General and Administrative
General and administrative expenses consist of payroll and related expenses for corporate personnel, as well as for personnel that support global functionsrelated to content, marketing, public relations and operations other than customer service. General and administrative expenses also includes professional fees andother general corporate expenses.
Three months ended March 31, 2018 as compared to the three months ended March 31, 2017
Three Months Ended Change
March 31,
2018 March 31,
2017 Q1'18 vs. Q1'17 (in thousands, except percentages)General and administrative $ 278,251 $ 194,291 $ 83,960 43%As a percentage of revenues 8% 7%
General and administrative expenses increased primarily due to a $68.1 million increase in personnel-related costs, including stock-based compensationexpense, resulting from an increase in average headcount primarily to support our international and original content expansion, and an increase in compensation forexisting employees. In addition, facilities-related costs increased $5.4 million , primarily driven by costs for our expanded Los Gatos, California headquarters andnew Los Angeles, California facility. Third party expenses, including costs for contractors and consultants, also increased $5.7 million .
21

Table of Contents
Interest ExpenseInterest expense consists primarily of the interest associated with our outstanding long-term debt obligations, including the amortization of debt issuance
costs, as well as interest on our lease financing obligations.Three months ended March 31, 2018 as compared to the three months ended March 31, 2017
Three Months Ended Change
March 31,
2018 March 31,
2017 Q1'18 vs. Q1'17
(in thousands, except percentages)Interest expense $ (81,219) $ (46,742) $ 34,477 74%As a percentage of revenues (2)% (2)%
Interest expense for the three months ended March 31, 2018 consists primarily of $78.6 million of interest on our notes. The increase in interest expense forthe three months ended March 31, 2018 as compared to the three months ended March 31, 2017 is due to the increase in long-term debt.
Interest and Other Income (Expense)
Interest and other income (expense) consists primarily of foreign exchange gains and losses on foreign currency denominated balances and interest earned oncash, cash equivalents and short-term investments.
Three months ended March 31, 2018 as compared to the three months ended March 31, 2017
Three Months Ended Change
March 31,
2018 March 31,
2017 Q1'18 vs. Q1'17
(in thousands, except percentages)Interest and other income (expense) $ (65,743) $ 13,592 $ (79,335) (584)%As a percentage of revenues (2)% 0.5%
Interest and other income (expense) decreased primarily due to foreign exchange losses. In the three months ended March 31, 2018 , the foreign exchangeloss was $71.6 million as compared to an $11.3 million foreign exchange gain for the three months ended March 31, 2017. The increase in the foreign exchangeloss was primarily driven by the $41.1 million loss from the remeasurement of our €1,300.0 million Senior Notes and the remeasurement of cash and contentliability positions in currencies other than the functional currencies of our European and U.S. entities.
Provision for Income Taxes
The effective tax rates for the three months ended March 31, 2018 and 2017 were 3% and 20% , respectively. The effective tax rate for the three monthsended March 31, 2018 differed from the Federal statutory rate primarily due to the recognition of excess tax benefits of stock-based compensation and Federal andCalifornia research and development credits (“R&D”), partially offset by state taxes, foreign taxes, non-deductible expenses, and the international provisions fromthe U.S. tax reform enacted in December 2017. The effective tax rate for the three months ended March 31, 2017 differed from the Federal statutory rate primarilydue to the recognition of excess tax benefits as a component of the provision for income taxes attributable to the adoption of ASU 2016-09 and Federal andCalifornia R&D credits offset by state taxes, foreign taxes and non-deductible expenses. The decrease in our effective tax rate for the three months ended March31, 2018 , as compared to the same period in 2017 was due primarily to the reduction of the corporate tax rate from 35% to 21% as a result of the U.S. tax reformenacted in December 2017.
In December 2017, the Tax Cuts and Jobs Act of 2017 (the “Act”) was signed into law making significant changes to the Internal Revenue Code. Changesinclude, but are not limited to, a corporate tax rate decrease from 35% to 21% effective for tax years beginning after December 31, 2017 , the transition of U.Sinternational taxation from a worldwide tax system to a territorial system, and a one-time transition tax on the mandatory deemed repatriation of cumulativeforeign earnings as of December 31, 2017 .
On December 22, 2017, Staff Accounting Bulletin No. 118 ("SAB 118") was issued to address the application of U.S. GAAP in situations when a registrantdoes not have the necessary information available, prepared, or analyzed (including computations) in reasonable detail to complete the accounting for certainincome tax effects of the Act. For the quarter ended March 31, 2018, we obtained additional information affecting the provisional amount initially recorded for thetransition tax in the quarter ended December 31, 2017. As a result, we have recorded an immaterial adjustment to the transition tax. Additional work is stillnecessary for a more detailed analysis of our deferred tax assets and
22

Table of Contents
liabilities and our historical foreign earnings as well as potential correlative adjustments. Any subsequent adjustment to these amounts will be recorded to currenttax expense in the quarter of 2018 when the analysis is complete.
Liquidity and Capital Resources
As of
March 31,
2018 December 31,
2017 (in thousands)Cash, cash equivalents and restricted cash $ 2,599,477 2,822,795Long-term debt 6,542,373 6,499,432
Cash, cash equivalents and restricted cash decreased $223.3 million in the three months ended March 31, 2018 primarily due to cash used in operations.
Long-term debt, net of debt issuance costs, increased $42.9 million primarily due to the remeasurement of our euro denominated notes. The earliest maturitydate for our outstanding long-term debt is February 2021. As of March 31, 2018 , no amounts had been borrowed under the $500.0 million Revolving CreditAgreement. See Note 5 Long-term Debt in the accompanying notes to our consolidated financial statements. We anticipate financing our capital needs in the debtmarket, as our after-tax cost of debt is lower than our cost of equity. Our ability to obtain this or any additional financing that we may choose to, or need to, obtainwill depend on, among other things, our development efforts, business plans, operating performance and the condition of the capital markets at the time we seekfinancing. We may not be able to obtain such financing on terms acceptable to us or at all. If we raise additional funds through the issuance of equity or debtsecurities, those securities may have rights, preferences or privileges senior to the rights of our common stock, and our stockholders may experience dilution.
Our primary uses of cash include the acquisition, licensing and production of content, streaming delivery, marketing programs and personnel-related costs.Cash payment terms for non-original content have historically been in line with the amortization period. Investments in original content, and in particular contentthat we produce and own, require more cash upfront relative to licensed content. For example, production costs are paid as the content is created, well in advanceof when the content is available on the service and amortized. We expect to significantly increase our investments in global streaming content, particularly inoriginal content, which will impact our liquidity and result in future negative free cash flows for many years. We currently anticipate that cash flows fromoperations, available funds and access to financing sources, including our revolving credit facility, will continue to be sufficient to meet our cash needs for at leastthe next twelve months.
Free Cash Flow
We define free cash flow as cash provided by (used in) operating and investing activities excluding the non-operational cash flows from purchases, maturitiesand sales of short-term investments. We believe free cash flow is an important liquidity metric because it measures, during a given period, the amount of cashgenerated that is available to repay debt obligations, make investments and for certain other activities or the amount of cash used in operations, includinginvestments in global streaming content. Free cash flow is considered a non-GAAP financial measure and should not be considered in isolation of, or as asubstitute for, net income, operating income, cash flow used in operating activities, or any other measure of financial performance or liquidity presented inaccordance with GAAP.
In assessing liquidity in relation to our results of operations, we compare free cash flow to net income, noting that the three major recurring differences areexcess content payments over amortization, non-cash stock-based compensation expense and other working capital differences. Working capital differencesinclude deferred revenue, taxes and semi-annual interest payments on our outstanding debt. Our receivables from members generally settle quickly and deferredrevenue is a source of cash flow.
23

Table of Contents
Three months ended March 31, 2018 as compared to the three months ended March 31, 2017
Three Months Ended
March 31,
2018 March 31,
2017 (in thousands)Net cash used in operating activities $ (236,757) $ (343,856)Net cash used in investing activities (49,752) (75,590)Net cash provided by financing activities 56,014 24,239
Non-GAAP free cash flow reconciliation: Net cash used in operating activities (236,757) (343,856)Acquisition of DVD content assets (10,796) (25,372)Purchases of property and equipment (37,170) (52,523)Change in other assets (1,786) (769)Non-GAAP free cash flow $ (286,509) $ (422,520)
Net cash used in operating activities decreased $107.1 million to $236.8 million for the three months ended March 31, 2018 . The decreased use of cash wasprimarily driven by a $1,064.2 million or 40% increase in revenues partially offset by the increase in investments in streaming content that require more upfrontpayments. The payments for streaming content assets increased $625.5 million , from $1,982.4 million to $2,607.9 million , or 32% as compared to the increase inthe amortization of streaming content assets of $443.1 million , from $1,305.7 million to $1,748.8 million , or 34% . In addition, we had increased paymentsassociated with higher operating expenses, primarily related to increased headcount to support our continued improvements in our streaming service, ourinternational expansion and increased content production activities.
Net cash used in investing activities decreased $25.8 million , primarily due to a $15.4 million decrease in purchases of property and equipment for our LosGatos and Los Angeles headquarter offices and a $14.6 million decrease in the acquisition of DVD content assets.
Net cash provided by financing activities increased $31.8 million in the quarter ended March 31, 2018 , due to an increase in cash received from the issuanceof common stock.
Non-GAAP free cash flow was $576.6 million lower than net income for the three months ended March 31, 2018 primarily due to $859.0 million of cashpayments for streaming content assets over streaming amortization expense partially offset by $68.4 million of non-cash stock-based compensation expense and$214.0 million of favorable other working capital differences.
Non-GAAP free cash flow was $600.7 million lower than net income for the three months ended March 31, 2017 , primarily due to $676.7 million of cashpayments for streaming content assets over streaming amortization expense partially offset by $44.9 million of non-cash stock-based compensation expense and$31.1 million favorable other working capital differences.
24

Table of Contents
Contractual Obligations
For the purpose of this table, contractual obligations for purchases of goods or services are defined as agreements that are enforceable and legally binding andthat specify all significant terms, including: fixed or minimum quantities to be purchased; fixed, minimum or variable price provisions; and the approximate timingof the transaction. The expected timing of the payment of the obligations discussed below is estimated based on information available to us as of March 31, 2018 .Timing of payments and actual amounts paid may be different depending on the time of receipt of goods or services or changes to agreed-upon amounts for someobligations. The following table summarizes our contractual obligations as of March 31, 2018 :
Payments due by Period
Contractual obligations (in thousands): Total Less than
1 year 1-3 years 3-5 years More than
5 yearsStreaming content obligations (1) $ 17,937,682 $ 7,949,544 $ 8,015,837 $ 1,849,029 $ 123,272Debt (2) 9,079,118 312,828 1,130,423 1,251,006 6,384,861Lease obligations (3) 790,453 109,732 201,831 175,073 303,817Other purchase obligations (4) 621,881 303,561 241,441 57,100 19,779Total $ 28,429,134 $ 8,675,665 $ 9,589,532 $ 3,332,208 $ 6,831,729
(1) As of March 31, 2018 , streaming content obligations were comprised of $4.5 billion included in "Current content liabilities" and $3.4 billion of "Non-current content liabilities" on the Consolidated Balance Sheets and $10.0 billion of obligations that are not reflected on the Consolidated Balance Sheets asthey did not then meet the criteria for recognition.
Streaming content obligations increased $0.2 billion from $17.7 billion as of December 31, 2017 to $17.9 billion as of March 31, 2018 , primarily due tomulti-year commitments associated with the continued expansion of our exclusive and original programming.
Streaming content obligations include amounts related to the acquisition, licensing and production of streaming content. An obligation for the production ofcontent includes non-cancelable commitments under creative talent and employment agreements and other production related commitments. An obligationfor the acquisition and licensing of content is incurred at the time we enter into an agreement to obtain future titles. Once a title becomes available, a contentliability is recorded on the Consolidated Balance Sheets. Certain agreements include the obligation to license rights for unknown future titles, the ultimatequantity and/or fees for which are not yet determinable as of the reporting date. Traditional film output deals, or certain TV series license agreements wherethe number of seasons to be aired is unknown, are examples of these types of agreements. The contractual obligations table above does not include anyestimated obligation for the unknown future titles, payment for which could range from less than one year to more than five years. However, these unknownobligations are expected to be significant and we believe could include approximately $3 billion to $5 billion over the next three years, with the paymentsfor the vast majority of such amounts expected to occur after the next twelve months. The foregoing range is based on considerable management judgmentsand the actual amounts may differ. Once we know the title that we will receive and the license fees, we include the amount in the contractual obligationstable above.
(2) Long-term debt obligations include our Notes consisting of principal and interest payments. See Note 5 to the consolidated financial statements for furtherdetails.
(3) Lease obligations include lease financing obligations of $14.6 million related to a portion of our current Los Gatos, California headquarters for which we arethe deemed owner for accounting purposes, commitments of $503.3 million for our headquarters in Los Gatos, California, and our office space in LosAngeles, California and other commitments of $272.6 million for facilities under non-cancelable operating leases. These leases have expiration datesvarying through approximately 2028.
(4) Other purchase obligations include all other non-cancelable contractual obligations. These contracts are primarily related to streaming delivery and cloudcomputing costs, as well as other miscellaneous open purchase orders for which we have not received the related services or goods.
25

Table of Contents
As of March 31, 2018 , we had gross unrecognized tax benefits of $47.8 million which was classified in “Other non-current liabilities” and a reduction todeferred tax assets which was classified as "Other non-current assets" in the consolidated balance sheets. At this time, an estimate of the range of reasonablypossible adjustments to the balance of unrecognized tax benefits cannot be made.
Off-Balance Sheet Arrangements
We do not have transactions with unconsolidated entities, such as entities often referred to as structured finance or special purpose entities, whereby we havefinancial guarantees, subordinated retained interests, derivative instruments, or other contingent arrangements that expose us to material continuing risks,contingent liabilities, or any other obligation under a variable interest in an unconsolidated entity that provides financing, liquidity, market risk, or credit risksupport to us.
Indemnification
The information set forth under Note 6 to the consolidated financial statements under the caption “Indemnification” is incorporated herein by reference.
Critical Accounting Policies and Estimates
The preparation of consolidated financial statements in conformity with accounting principles generally accepted in the United States of America requiresmanagement to make estimates and assumptions that affect the reported amounts of assets and liabilities, disclosures of contingent assets and liabilities at the dateof the consolidated financial statements, and the reported amounts of revenues and expenses during the reported periods. The Securities and Exchange Commission("SEC") has defined a company’s critical accounting policies as the ones that are most important to the portrayal of a company’s financial condition and results ofoperations, and which require a company to make its most difficult and subjective judgments. Based on this definition, we have identified the critical accountingpolicies and judgments addressed below. We base our estimates on historical experience and on various other assumptions that we believe to be reasonable underthe circumstances. Actual results may differ from these estimates.
Streaming Content
We acquire, license and produce content, including original programing, in order to offer our members unlimited viewing of TV shows and films. Thecontent licenses are for a fixed fee and specific windows of availability. Payment terms for certain content licenses and the production of content require moreupfront cash payments relative to the amortization expense. Payments for content, including additions to streaming assets and the changes in related liabilities, areclassified within "Net cash used in operating activities" on the Consolidated Statements of Cash Flows.
For licenses, we capitalize the fee per title and record a corresponding liability at the gross amount of the liability when the license period begins, the cost ofthe title is known and the title is accepted and available for streaming. The portion available for streaming within one year is recognized as “Current content assets,net” and the remaining portion as “Non-current content assets, net” on the Consolidated Balance Sheets.
For productions, we capitalize costs associated with the production, including development cost, direct costs and production overhead. We include theseamounts in "Non-current content assets, net" on the Consolidated Balance Sheets. Participations and residuals are expensed in line with the amortization ofproduction costs.
Based on factors including historical and estimated viewing patterns, we amortize the content assets (licensed and produced) in “Cost of revenues” on theConsolidated Statements of Operations, over the shorter of each title's contractual window of availability or estimated period of use or ten years, beginning with themonth of first availability. The amortization is on an accelerated basis as we typically expect more upfront viewing, for instance due to additional merchandisingand marketing efforts. We review factors that impact the amortization of the content assets on a regular basis. Our estimates related to these factors requireconsiderable management judgment.
Our business model is subscription based as opposed to a model generating revenues at a specific title level. Therefore, content assets, both licensed andproduced, are reviewed in aggregate at the operating segment level when an event or change in circumstances indicates a change in the expected usefulness. Todate, we have not identified any such event or changes in circumstances. If such changes are identified in the future, these aggregated content assets will be statedat the lower of unamortized cost, net realizable value or fair value. In addition, unamortized costs for assets that have been, or are expected to be, abandoned arewritten off.
Income Taxes
We record a provision for income taxes for the anticipated tax consequences of our reported results of operations using the asset and liability method.Deferred income taxes are recognized by applying enacted statutory tax rates applicable to future years to differences between the financial statement carryingamounts of existing assets and liabilities and their respective tax bases as well as net operating loss and tax credit carryforwards. The effect on deferred tax assetsand liabilities of a change in tax rates is recognized in income in the period that includes the enactment date. The measurement of deferred tax assets is reduced, ifnecessary, by a valuation allowance for any tax benefits for which future realization is uncertain.
Although we believe our assumptions, judgments and estimates are reasonable, changes in tax laws or our interpretation of tax laws and
26

Table of Contents
the resolution of any tax audits could significantly impact the amounts provided for income taxes in our consolidated financial statements.
In evaluating our ability to recover our deferred tax assets, in full or in part, we consider all available positive and negative evidence, including our pastoperating results, and our forecast of future earnings, future taxable income and prudent and feasible tax planning strategies. The assumptions utilized indetermining future taxable income require significant judgment and are consistent with the plans and estimates we are using to manage the underlying businesses.Actual operating results in future years could differ from our current assumptions, judgments and estimates. However, we believe that it is more likely than not thatmost of the deferred tax assets recorded on our Consolidated Balance Sheets will ultimately be realized. We record a valuation allowance to reduce our deferred taxassets to the net amount that we believe is more likely than not to be realized. As of March 31, 2018 , the valuation allowance of $71.0 million was related toforeign tax credits that we are not expected to realize.
We did not recognize certain tax benefits from uncertain tax positions within the provision for income taxes. We may recognize a tax benefit only if it ismore likely than not the tax position will be sustained on examination by the taxing authorities, based on the technical merits of the position. The tax benefitsrecognized in the financial statements from such positions are then measured based on the largest benefit that has a greater than 50% likelihood of being realizedupon settlement. At March 31, 2018 , our estimated gross unrecognized tax benefits were $47.8 million of which $44.5 million , if recognized, would favorablyimpact our future earnings. Due to uncertainties in any tax audit outcome, our estimates of the ultimate settlement of our unrecognized tax positions may changeand the actual tax benefits may differ significantly from the estimates. See Note 9 to the consolidated financial statements for further information regarding incometaxes.
Recent Accounting Pronouncements
The information set forth under Note 1 to the consolidated financial statements under the caption “Basis of Presentation and Summary of SignificantAccounting Policies” is incorporated herein by reference.
27

Table of Contents
Item 3. Quantitative and Qualitative Disclosures About Market Risk
For financial market risks related to changes in interest rates, reference is made to Item 7A “Quantitative and Qualitative Disclosures About Market Risk”contained in Part II of our Annual Report on Form 10-K for the year ended December 31, 2017 . Our exposure to market risk has not changed significantly sinceDecember 31, 2017 .
Foreign Currency Risk
International revenues and cost of revenues account for 48% and 57% , respectively, of consolidated amounts for the three months ended March 31, 2018 .The majority of international revenues and a smaller portion of expenses are denominated in currencies other than the U.S. dollar and we therefore have foreigncurrency risk related to these currencies, which are primarily the euro, the British pound, the Canadian dollar, the Australian dollar, the Japanese yen and theBrazilian real.
Accordingly, changes in exchange rates, and in particular a weakening of foreign currencies relative to the U.S. dollar may negatively affect our revenue andcontribution profit (loss) of our International streaming segment as expressed in U.S. dollars. In the three months ended March 31, 2018 , we believe ourinternational revenues would have been approximately $114.2 million lower had foreign currency exchange rates remained consistent with those in same period of2017 .
We have also experienced and will continue to experience fluctuations in our net income as a result of gains (losses) on the settlement and the remeasurementof monetary assets and liabilities denominated in currencies that are not the functional currency. In the three months ended March 31, 2018 , we recognized a $71.6million foreign exchange loss which resulted primarily from the remeasurement of our €1,300.0 million Senior Notes and the remeasurement of cash and contentliability positions in currencies other than the functional currencies of our European and U.S. entities.
In addition, the effect of exchange rate changes on cash, cash equivalents and restricted cash in the three months ended March 31, 2018 was $7.2 million .
We do not use foreign exchange contracts or derivatives to hedge any foreign currency exposures. The volatility of exchange rates depends on many factorsthat we cannot forecast with reliable accuracy. Our continued international expansion increases our exposure to exchange rate fluctuations and as a result suchfluctuations could have a significant impact on our future results of operations.
Item 4. Controls and Procedures
Evaluation of Disclosure Controls and Procedures
Our management, with the participation of our Chief Executive Officer and Chief Financial Officer, evaluated the effectiveness of our disclosure controls andprocedures (as defined in Rules 13a-15(e) and 15d-15(e) under the Securities Exchange Act of 1934, as amended) as of the end of the period covered by thisQuarterly Report on Form 10-Q. Based on that evaluation, our Chief Executive Officer and Chief Financial Officer concluded that our disclosure controls andprocedures as of the end of the period covered by this Quarterly Report on Form 10-Q were effective in providing reasonable assurance that information requiredto be disclosed by us in reports that we file or submit under the Securities Exchange Act of 1934, as amended, is (i) recorded, processed, summarized and reportedwithin the time periods specified in the Securities and Exchange Commission’s rules and forms and (ii) accumulated and communicated to our management,including our Chief Executive Officer and Chief Financial Officer, as appropriate, to allow timely decisions regarding required disclosures.
Our management, including our Chief Executive Officer and Chief Financial Officer, does not expect that our disclosure controls and procedures or ourinternal controls will prevent all error and all fraud. A control system, no matter how well conceived and operated, can provide only reasonable, not absolute,assurance that the objectives of the control system are met. Further, the design of a control system must reflect the fact that there are resource constraints, and thebenefits of controls must be considered relative to their costs. Because of the inherent limitations in all control systems, no evaluation of controls can provideabsolute assurance that all control issues and instances of fraud, if any, within the Company have been detected.
Changes in Internal Control Over Financial Reporting
There were no changes in our internal control over financial reporting that occurred during the quarter ended March 31, 2018 , that have materially affected,or are reasonably likely to materially affect, our internal control over financial reporting.
PART II. OTHER INFORMATIONItem 1. Legal Proceedings
The information set forth under Note 6 in the notes to the consolidated financial statements under the caption “Legal Proceedings” is incorporated herein byreference.
28

Table of Contents
Item 1A. Risk Factors
There have been no material changes from the risk factors as previously disclosed under the heading “Risk Factors” in the Company’s Annual Report onForm 10-K for the year ended December 31, 2017 .
Item 6. Exhibits
(a) Exhibits:
See Exhibit Index immediately following the signature page of this Quarterly Report on Form 10-Q.
29

Table of Contents
SIGNATURESPursuant to the requirements of the Securities Exchange Act of 1934, the registrant has duly caused this report to be signed on its behalf by the undersigned
thereunto duly authorized.
NETFLIX, INC.Dated: April 18, 2018 By: /s/ REED HASTINGS
Reed HastingsChief Executive Officer
(Principal executive officer) Dated: April 18, 2018 By: /s/ DAVID WELLS
David WellsChief Financial Officer
(Principal financial and accounting officer)
30

Table of Contents
EXHIBIT INDEX
ExhibitNumber Exhibit Description Incorporated by Reference
Filed Herewith
Form File No. Exhibit Filing Date
31.1
Certification of Chief Executive Officer Pursuant to Section 302 of theSarbanes-Oxley Act of 2002 X
31.2
Certification of Chief Financial Officer Pursuant to Section 302 of theSarbanes-Oxley Act of 2002 X
32.1*
Certifications of Chief Executive Officer and Chief Financial OfficerPursuant to Section 906 of the Sarbanes-Oxley Act of 2002 X
101
The following financial information from Netflix, Inc.’s QuarterlyReport on Form 10-Q for the quarter ended March 31, 2018 filed withthe SEC on April 18, 2018, formatted in XBRL includes:(i) Consolidated Statements of Operations for the Three Months EndedMarch 31, 2018 and 2017, (ii) Consolidated Statements ofComprehensive Income for the Three Months Ended March 31, 2018and 2017 (iii) Consolidated Balance Sheets as of March 31, 2018 andDecember 31, 2017, (iv) Consolidated Statements of Cash Flows for theThree Months Ended March 31, 2018 and 2017 and (v) the Notes to theConsolidated Financial Statements. X
* These certifications are not deemed filed by the SEC and are not to be incorporated by reference in any filing we make under the Securities Act of 1933 or theSecurities Exchange Act of 1934, irrespective of any general incorporation language in any filings.
31

EXHIBIT 31.1
CERTIFICATION OF CHIEF EXECUTIVE OFFICERPURSUANT TO SECTION 302 OF THE SARBANES-OXLEY ACT OF 2002
I, Reed Hastings, certify that:
1. I have reviewed this Quarterly Report on Form 10-Q of Netflix, Inc.;
2. Based on my knowledge, this report does not contain any untrue statement of a material fact or omit to state a material fact necessary to make thestatements made, in light of the circumstances under which such statements were made, not misleading with respect to the period covered by this report;
3. Based on my knowledge, the financial statements, and other financial information included in this report, fairly present in all material respects thefinancial condition, results of operations and cash flows of the registrant as of, and for, the periods presented in this report;
4. The registrant’s other certifying officer and I are responsible for establishing and maintaining disclosure controls and procedures (as defined in ExchangeAct Rules 13a-15(e) and 15d-15(e)) and internal control over financial reporting (as defined in Exchange Act Rules 13a-15(f) and 15d-15(f)) for theregistrant and have:
a) designed such disclosure controls and procedures, or caused such disclosure controls and procedures to be designed under our supervision, toensure that material information relating to the registrant, including its consolidated subsidiaries, is made known to us by others within thoseentities, particularly during the period in which this report is being prepared;
b) designed such internal control over financial reporting, or caused such internal control over financial reporting to be designed under oursupervision, to provide reasonable assurance regarding the reliability of financial reporting and the preparation of financial statements forexternal purposes in accordance with generally accepted accounting principles;
c) evaluated the effectiveness of the registrant’s disclosure controls and procedures and presented in this report our conclusions about theeffectiveness of the disclosure controls and procedures, as of the end of the period covered by this report based on such evaluation; and
d) disclosed in this report any change in the registrant’s internal control over financial reporting that occurred during the registrant’s most recentfiscal quarter (the registrant’s fourth fiscal quarter in the case of an annual report) that has materially affected, or is reasonably likely tomaterially affect, the registrant’s internal control over financial reporting; and
5. The registrant’s other certifying officer and I have disclosed, based on our most recent evaluation of internal control over financial reporting, to theregistrant’s auditors and the audit committee of registrant’s board of directors (or persons performing the equivalent function):
a) all significant deficiencies and material weaknesses in the design or operation of internal control over financial reporting which are reasonablylikely to adversely affect the registrant’s ability to record, process, summarize and report financial information; and
b) any fraud, whether or not material, that involves management or other employees who have a significant role in the registrant’s internal controlover financial reporting.
Dated: April 18, 2018 By: /S/ REED HASTINGS
Reed Hastings Chief Executive Officer

EXHIBIT 31.2
CERTIFICATION OF CHIEF FINANCIAL OFFICERPURSUANT TO SECTION 302 OF THE SARBANES-OXLEY ACT OF 2002
I, David Wells, certify that:
1. I have reviewed this Quarterly Report on Form 10-Q of Netflix, Inc.;
2. Based on my knowledge, this report does not contain any untrue statement of a material fact or omit to state a material fact necessary to make thestatements made, in light of the circumstances under which such statements were made, not misleading with respect to the period covered by this report;
3. Based on my knowledge, the financial statements, and other financial information included in this report, fairly present in all material respects thefinancial condition, results of operations and cash flows of the registrant as of, and for, the periods presented in this report;
4. The registrant’s other certifying officer and I are responsible for establishing and maintaining disclosure controls and procedures (as defined in ExchangeAct Rules 13a-15(e) and 15d-15(e)) and internal control over financial reporting (as defined in Exchange Act Rules 13a-15(f) and 15d-15(f)) for theregistrant and have:
a) designed such disclosure controls and procedures, or caused such disclosure controls and procedures to be designed under our supervision, toensure that material information relating to the registrant, including its consolidated subsidiaries, is made known to us by others within thoseentities, particularly during the period in which this report is being prepared;
b) designed such internal control over financial reporting, or caused such internal control over financial reporting to be designed under oursupervision, to provide reasonable assurance regarding the reliability of financial reporting and the preparation of financial statements forexternal purposes in accordance with generally accepted accounting principles;
c) evaluated the effectiveness of the registrant’s disclosure controls and procedures and presented in this report our conclusions about theeffectiveness of the disclosure controls and procedures, as of the end of the period covered by this report based on such evaluation; and
d) disclosed in this report any change in the registrant’s internal control over financial reporting that occurred during the registrant’s most recentfiscal quarter (the registrant’s fourth fiscal quarter in the case of an annual report) that has materially affected, or is reasonably likely tomaterially affect, the registrant’s internal control over financial reporting; and
5. The registrant’s other certifying officer and I have disclosed, based on our most recent evaluation of internal control over financial reporting, to theregistrant’s auditors and the audit committee of registrant’s board of directors (or persons performing the equivalent function):
a) all significant deficiencies and material weaknesses in the design or operation of internal control over financial reporting which are reasonablylikely to adversely affect the registrant’s ability to record, process, summarize and report financial information; and
b) any fraud, whether or not material, that involves management or other employees who have a significant role in the registrant’s internal controlover financial reporting.
Dated: April 18, 2018 By: / S / D AVID W ELLS
David Wells Chief Financial Officer

EXHIBIT 32.1
CERTIFICATIONS OF CHIEF EXECUTIVE OFFICER AND CHIEF FINANCIAL OFFICERPURSUANT TO SECTION 906 OF THE SARBANES-OXLEY ACT OF 2002
I, Reed Hastings, certify, pursuant to 18 U.S.C. Section 1350, as adopted pursuant to Section 906 of the Sarbanes-Oxley Act of 2002, that the QuarterlyReport on Form 10-Q of Netflix, Inc. for the quarter ended March 31, 2018 fully complies with the requirements of Section 13(a) or 15(d) of the SecuritiesExchange Act of 1934 and that information contained in such report fairly presents, in all material respects, the financial condition and results of operations ofNetflix, Inc.
Dated: April 18, 2018 By: / S / R EED H ASTINGS
Reed Hastings Chief Executive Officer
I, David Wells, certify, pursuant to 18 U.S.C. Section 1350, as adopted pursuant to Section 906 of the Sarbanes-Oxley Act of 2002, that the Quarterly Reporton Form 10-Q of Netflix, Inc. for the quarter ended March 31, 2018 fully complies with the requirements of Section 13(a) or 15(d) of the Securities Exchange Actof 1934 and that information contained in such report fairly presents, in all material respects, the financial condition and results of operations of Netflix, Inc.
Dated: April 18, 2018 By: / S / D AVID W ELLS
David Wells Chief Financial Officer