NETDIVER TUTORIAL - Martignettidiver.martignetti.com/NetDiverTutorial.pdf · iv netdiver tutorial...
134
NETDIVER T UTORIAL Revision Doc-NDT-070910-02 2010 Dimensional Insight
Transcript of NETDIVER TUTORIAL - Martignettidiver.martignetti.com/NetDiverTutorial.pdf · iv netdiver tutorial...

NETDIVER TUTORIAL
Revision Doc-NDT-070910-022010
Dimensional Insight

NETDIVER TUTORIAL

NETDIVER TUTORIAL
NetDiver 6.2 Tutorial, Manual Revision Doc-NDT-070910-02.Dimensional Insight, Inc. disclaims the implied warranties of merchantability and fitness for a particular purpose and makes no express warranties except as may be stated in its written agreement with and for its customer.In no event is Dimensional Insight liable to anyone for any indirect, special, or consequential damages. The information and specifications in this manual are subject to change without notice.Copyright © Dimensional Insight, 1991-2010.Microsoft®, Windows®, and Excel® are registered trademarks of Microsoft Corporation. Adobe®, Acrobat®, and Distiller® are registered trademarks of Adobe Systems Incorporated. AIX®, AS/400®, and DB2® are registered trademarks and iSeries is a trademark of International Business Machines Corporation. Other product and company names mentioned in this manual are the service mark, trademark, or registered trademark of their respective owners.Dimensional Insight, Inc. (DII) is the owner of the Software to which this documentation applies. The Software is subject to copyrights, patents and other intellectual property rights of DII, is furnished only under a license to use it, and no ownership rights are conveyed in the Software under any circumstances. License rights are set out in written license agreements entered into by all licensees either prior to delivery of the Software or prior to first use of the Software. No use of the Software is permitted unless the user has first agreed to the terms of the license. DO NOT USE THE SOFTWARE IF YOU HAVE NOT REVIEWED AND AGREED TO THE TERMS OF THE LICENSE.Limited Warranty and Liability. THE SOFTWARE IS FURNISHED “AS IS” AND WITHOUT WARRANTY OF ANY KIND OR NATURE TO THE EXTENT PERMITTED BY APPLICABLE LAW. DII EXPRESSLY DISCLAIMS ALL WARRANTIES, EXPRESS, IMPLIED OR STATUTORY, INCLUDING THE IMPLIED WARRANTIES OF MERCHANTABILITY, FITNESS FOR PARTICULAR PURPOSE, SATISFACTORY QUALITY AND NONINFRINGEMENT, AND THEIR EQUIVALENTS UNDER ANY LAW OF ANY JURISDICTION. IF APPLICABLE LAW IMPLIES ANY WARRANTIES OR CONDITIONS WITH RESPECT TO THE SOFTWARE, ALL SUCH WARRANTIES OR CONDITIONS ARE LIMITED TO A PERIOD OF THIRTY (30) DAYS FROM THE DATE OF DELIVERY OF THE SOFTWARE TO THE LICENSEE.DII DOES NOT WARRANT THAT THE FUNCTIONS CONTAINED IN THE SOFTWARE WILL MEET YOUR REQUIREMENTS, OR THAT THE OPERATION OF THE SOFTWARE WILL BE UNINTERRUPTED OR ERROR-FREE, OR THAT DEFECTS IN THE SOFTWARE WILL BE CORRECTED. FURTHERMORE, DII DOES NOT WARRANT OR MAKE ANY REPRESENTATIONS REGARDING THE USE OR THE RESULTS OF THE USE OF THE SOFTWARE IN TERMS OF THEIR CORRECTNESS, ACCURACY, RELIABILITY, OR OTHERWISE. SHOULD THE SOFTWARE PROVE DEFECTIVE, LICENSEE (AND NOT DII, ITS DISTRIBUTORS, DEALERS OR EMPLOYEES) WILL ASSUME THE ENTIRE COST OF ALL NECESSARY SERVICING, REPAIR, OR CORRECTION.
iii

NETDIVER TUTORIAL
SOME STATES AND JURISDICTIONS DO NOT ALLOW THE EXCLUSION OF EXPRESS OR IMPLIED WARRANTIES OR CONDITIONS UNDER CERTAIN CIRCUMSTANCES, SO THE ABOVE EXCLUSIONS MAY NOT APPLY TO YOU. IF SUCH EXCLUSIONS DO NOT APPLY TO YOU, AND ONLY IN SUCH EVENT, YOUR SOLE REMEDY WILL BE, AT DII’S OPTION, REPAIR OR REPLACEMENT OF THE SOFTWARE OR A REFUND OF THE PRICE PAID BY YOU FOR THE SOFTWARE. THIS WARRANTY GIVES YOU SPECIFIC LEGAL RIGHTS. YOU MAY ALSO HAVE OTHER LEGAL RIGHTS WHICH VARY FROM STATE TO STATE AND JURISDICTION TO JURISDICTION.While efforts have been made to ensure THAT the program and its documentation are free from defects, under no circumstances and under no legal theory, whether tort, contract, or otherwise, shall DII, or its distributors, dealers or employees, be liable to you or any other person for any loss or damage sustained in connection with ANY ATTEMPT TO use the Software, including without limitation, any economic, consequential or other indirect loss or damage, even if DII has been previously advised of the possibility of such loss or damage. Some states and jurisdictions do not allow the exclusion or limitation of INCIDENTAL or consequential damages under certain circumstances, so this limitation and exclusion may not apply to you.The Software may include certain cryptographic software that may be subject to export controls under the U.S. Export Administration Act. The Software may not be exported to any country or to any foreign entity or “foreign person” to the extent prohibited under applicable U.S. government regulations. By downloading or using the Software, you are acknowledging and agreeing to the foregoing limitations on your right to export or re-export the Software, and are also representing and warranting that you are neither on any of the U.S. government’s lists of export precluded parties nor otherwise ineligible to receive software containing cryptography that is subject to export controls under the U.S. Export Administration Act.If a version of DiveLine that uses encryption is running, administrators must be aware that allowing users outside the United States to access data via certain DI-Clients qualifies as exporting encryption software (either the client executable or the Java applet sent to the browser). Export or re-export of encrypted software must be in accordance with the Export Administration Regulations. Diversion of encryption software contrary to U.S. law is prohibited.
Copyright © 2010 Dimensional Insight, Inc., 60 Mall Road, Burlington, MA 01803(http://www.dimins.com)
iv

Contents 0
Chapter 1: Introduction .......................................................... 1-1Welcome to NetDiver .............................................................................................................1-1About This Tutorial ................................................................................................................1-2
Conventions .....................................................................................................................1-2Related Documents..........................................................................................................1-3
Before You Start .....................................................................................................................1-3End-User Workstations....................................................................................................1-4
Launching NetDiver ...............................................................................................................1-4Launching NetDiver from DivePort ................................................................................1-4
My Account ...............................................................................................................1-4Click Actions .............................................................................................................1-5Application Links ......................................................................................................1-7
Launching NetDiver from a Browser ..............................................................................1-8NetDiver Logon.........................................................................................................1-8
NetDiver Window Components..............................................................................................1-9Navigating in NetDiver...........................................................................................................1-10
Logging Off .....................................................................................................................1-11Saving and Printing..........................................................................................................1-11Opening Excel Applications ............................................................................................1-11
Chapter 2: Getting Started ..................................................... 2-1Accessing DiveLine Files .......................................................................................................2-1Opening a DiveBook ..............................................................................................................2-2Opening a Model ....................................................................................................................2-8
TOC-1
NETDIVER TUTORIAL
Your First Dive .......................................................................................................................2-11Sorting Up and Focusing .................................................................................................2-12Exporting to Excel ...........................................................................................................2-14
Another Dive...........................................................................................................................2-16Sorting Down and Focusing ............................................................................................2-17Adding a Calculated Column...........................................................................................2-17Saving a Marker...............................................................................................................2-21
Diving Deeper.........................................................................................................................2-23Cascading.........................................................................................................................2-26Finding and Grouping......................................................................................................2-32
Chapter 3: Display Formats ................................................... 3-1Tabular Displays .....................................................................................................................3-1
MultiTab ..........................................................................................................................3-1CrossTab .........................................................................................................................3-5
Diving from a CrossTab ............................................................................................3-6MultiCrossTab ................................................................................................................3-10
Diving from a MultiCrossTab ...................................................................................3-11Graphic Displays.....................................................................................................................3-17
Bar Plot ............................................................................................................................3-17Cross Plot.........................................................................................................................3-25Stack Plot .........................................................................................................................3-31Scatter Plot.......................................................................................................................3-36Pie Plot.............................................................................................................................3-41
QuickViews ............................................................................................................................3-45
Chapter 4: Reports ................................................................. 4-1Creating Reports .....................................................................................................................4-1
Basic Tabular Report .......................................................................................................4-1MultiTab Report ..............................................................................................................4-5CrossTab Report ..............................................................................................................4-9
Using a Report from a DiveBook ...........................................................................................4-15Wrap-up ..................................................................................................................................4-18
TOC-2

NETDIVER TUTORIAL
Index
TOC-3

NETDIVER TUTORIAL
Chapter 1
Introduction 1Welcome to NetDiver 1The Diver Solution™ is Dimensional Insight’s (DI) suite of products that work together to provide complete data reporting and analysis, as well as data transformation, administration, and delivery. DiveLine is the server application that enables flexible, centralized administration of security and users who access company data stored in the DI spheres (Models). ProDiver is the powerful Windows-based client application that offers a broad set of analysis and reporting features. DivePort is DI’s portal platform that takes full advantage of browser and Internet technology, giving users a powerful information-delivery platform for creating customized applications. IT administrators can provide views of multiple key performance indicators, as well as complex reports and graphs, in a single, web-based point of entry.From DivePort or a browser, you can access NetDiver, a web application for your data stored in DI Models. The NetDiver client offers access to “diving” into the detail underlying indicators and reports, thus supporting additional analysis and ad hoc reporting from your web browser. NetDiver satisfies basic analytical needs, while complementing the DivePort functionality for a broader range of users. The NetDiver interface is ideal for providing off-site personnel, such as customers, suppliers, and partners, with an easy-to-use reporting analysis tool. NetDiver is a zero-footprint client option, meaning it does not require any software to be downloaded or installed on the user’s workstation. NetDiver resides on a web application server (e.g., Apache Tomcat) and acts as a bridge between a web browser (e.g., Microsoft Internet Explorer or Mozilla Firefox) on a client workstation, and the data residing in DI Models on a DiveLine server. NetDiver communicates with DiveLine using a secure connection through the web server. Licensed DI users with either a General or an Advanced level of functionality have access to NetDiver. The purpose of this tutorial is to introduce you to NetDiver’s terminology, its graphical interface, and some of its functions. Upon completion of this tutorial, you should be comfortable with the essential features of NetDiver, having had some hands-on experience. Plan on two-to-four hours to step through these lessons.
Introduction 1-1

About This Tutorial
NETDIVER TUTORIAL
About This Tutorial 1This tutorial uses sample test data included with the DI software. You need to contact your DiveLine Administrator for the location of this data set (it should be called SampleData or SampleData-DiverTutorial), the name of the DiveLine server that you will be accessing, as well as your username and password. If needed, your administrator can contact [email protected] to obtain the “Sample Data for the Diver Tutorial”. It is best to have your own copy of the tutorial SampleData, with permission to save Markers and DiveBooks, so that you do not interfere with anyone else using the NetDiver Tutorial.Your Diver or DiveLine Administrator needs to instruct you on how to launch NetDiver at your installation.This chapter, Chapter 1, Introduction, gives an overview of NetDiver as one component of The Diver Solution. Step-by-step lessons start in Chapter 2, Getting Started. Chapter 3, Display Formats continues the lessons while exploring the various display options available in NetDiver. Chapter 4, Reports explores additional diving and reporting options.If you need help using NetDiver, check with your company’s Diver Solution Administrator. Additional assistance can be requested from DI’s Technical Support by phoning (920) 436-8299 or sending E-mail to [email protected]. If you are calling from outside the United States, call +1-920-436-8299, or send E-mail to [email protected].
Conventions 1This manual employs some conventions for ease of use. There are two that you should be aware of: Action items and Notes.This manual includes instructions on how to perform specific tasks, called Actions. Action items are numbered and are designed to be followed step-by-step. Additional information is separated into paragraphs or Note sections. Notes are used to highlight significant technical points. In this tutorial, they can also be content-specific and directional, to help insure a successful lesson. A Note is indicated by the DI graphic:
For a quick run-through of the steps necessary to perform a task, follow the numbered steps. For additional information, tips, and comments, read the remaining paragraphs and Note sections.
1-2 Introduction
Before You Start
NETDIVER TUTORIAL
Related Documents 1A multi-volume set of documentation exists for The Diver Solution. The latest versions are available as PDF files on the DI website www.dimins.com. As a new NetDiver user, you may want to have access to the following documents.NetDiver User Guide - details and explains all NetDiver features and functionsDivePort User Guide - explains how to use DivePort’s features from the perspective of a Casual or General userDiver Volume I & II manuals - contain comprehensive descriptions of Diver functionality, a subset of which is available in NetDiver
Before You Start 1If you are new to NetDiver and The Diver Solution, there are a few terms that you should know:Diving - Diving is the process of using NetDiver to select and display particular portions of the data set. Diving can progress deeper and deeper into the data, creating a more detailed view of a smaller range of information. There is no limit to the number of steps in a dive.Model - The core of The Diver Solution is the multidimensional Model. The Model is built using unique patented cross-indexing technology that allows large amounts of data to be summarized, indexed, and transformed into a “free-form” multidimensional database structure that facilitates fast access from NetDiver. Models are files that store the data that NetDiver reads and displays while diving.Data Types - A Model is constructed with three types of data: Dimensions, Summaries, and Info Fields. Each Dimension represents a different way of organizing or looking at the data. Any field defined as a Dimension becomes an option for sorting or filtering, that is, a dive field. Summaries are the numerical elements in the data, while Info Fields are used to hold extra information related to Dimensions.Marker - A Marker is similar to a bookmark. It does not contain any data, only the steps taken in a dive. When saved and reopened, it allows the dive to proceed from the last saved step. All Reports are Markers.DivePlan - A DivePlan holds instructions about how the data is to be presented to the user. For example, which columns in a Model should be shown, what calculated fields are available, which data items should be presented together (Categories), and how multiple Models are combined. DiveBook - A DiveBook organizes Markers, DivePlans, and Reports for simple, easy retrieval. QuickView - A QuickView is used to filter the data presented. Several can be used to provide access to multiple Dimensions at one time, from one screen.
Introduction 1-3
Launching NetDiver
NETDIVER TUTORIAL
DimCount - The DimCount is the number of unique values for a Dimension. DimCounts can refer to the entire data set in a Model, or can be calculated relative to a particular value of one Dimension in the Model.
End-User Workstations 1For end-user workstations, NetDiver is considered a zero-footprint application. No additional software needs to be installed on the user’s machine. Each user simply needs to verify that their browser’s Internet options have JavaScript and HTTP Session Cookies enabled, as well as a trusted Security Certificate permanently saved. The latter allows the Hyper Text Transfer Protocol with Secure Socket Layering (HTTPS) to function without warnings. For more details, see the separate NetDiver User Guide or DivePort Administration manuals.NetDiver is designed for Mozilla Firefox but also runs on other browsers, e.g., Microsoft Internet Explorer. You may need to adjust the internet options on your machine, but most default setups work for NetDiver.
Launching NetDiver 1Talk to your Diver Solution Administrator to determine how to launch NetDiver on your company’s network. There are two basic ways to launch NetDiver: from DivePort or from your browser. Each is discussed here.
Launching NetDiver from DivePort 1If you use a DivePort Portal, you may have three different ways to launch NetDiver:
• the MY ACCOUNT button• a Click Action link from a Portlet• an Application link from a DiveBook
My Account 1NetDiver is easily launched from within DivePort. While in DivePort, General and Advanced level users have access to the MY ACCOUNT command button. When clicked, the first option is to Start NetDiver. The image below shows where the button is located in a DivePort Portal.
1-4 Introduction

Launching NetDiver
NETDIVER TUTORIAL
When you click Start NetDiver, a new browser window opens NetDiver without requiring the user to re-authenticate. The NetDiver window is empty. Click Open File or Open DiveBook to start diving. The image below indicates where these buttons are located.
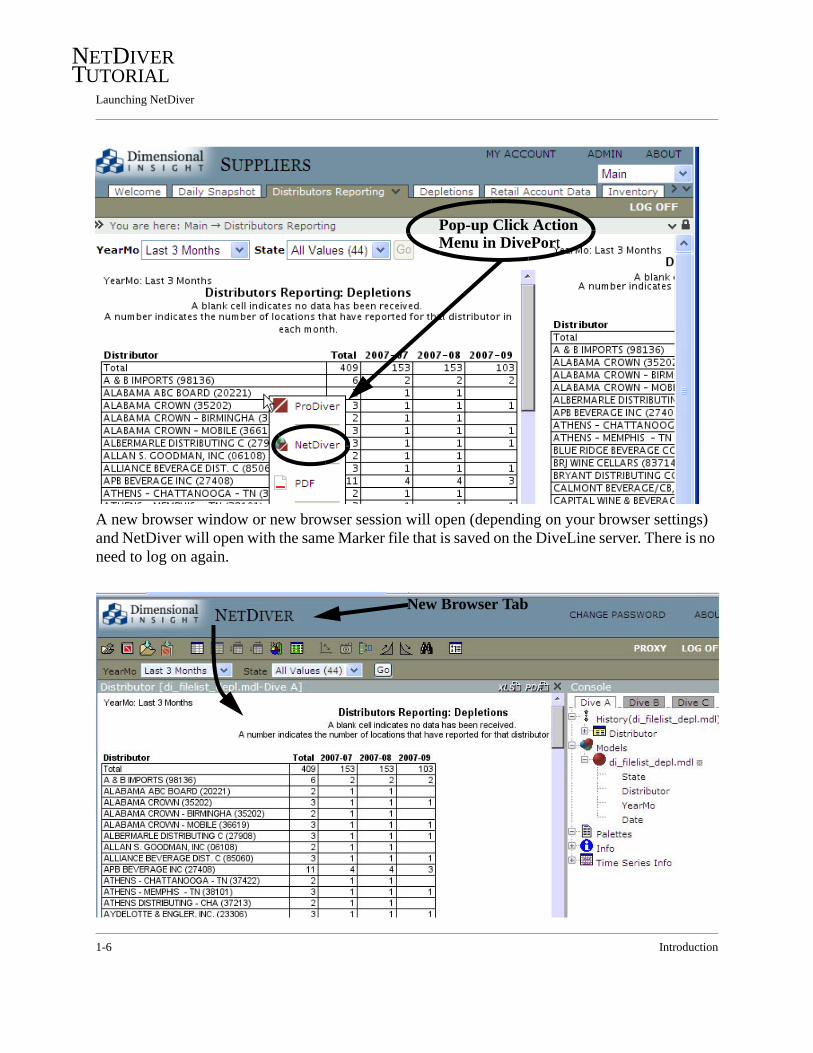
Click Actions 1While in DivePort as a General and/or Advanced user, you may also have access to NetDiver from a Click Action Menu or a Click Action Link. In this case, the Click Action is defined for a specific Portlet instance on the Page, so when NetDiver is launched, it opens to the same Marker that was displayed in the Portal. There is no need to log on again. For example, when a row in the following tabular is clicked, a pop-up menu appears that lists the possible Click Actions. You can select and click NetDiver. In the images that follow, the same report is visible in the DivePort Portal and then in the NetDiver view.
Toolbar
Introduction 1-5
Launching NetDiver
NETDIVER TUTORIAL
A new browser window or new browser session will open (depending on your browser settings) and NetDiver will open with the same Marker file that is saved on the DiveLine server. There is no need to log on again.
Pop-up Click ActionMenu in DivePort
New Browser Tab
1-6 Introduction
Launching NetDiver
NETDIVER TUTORIAL
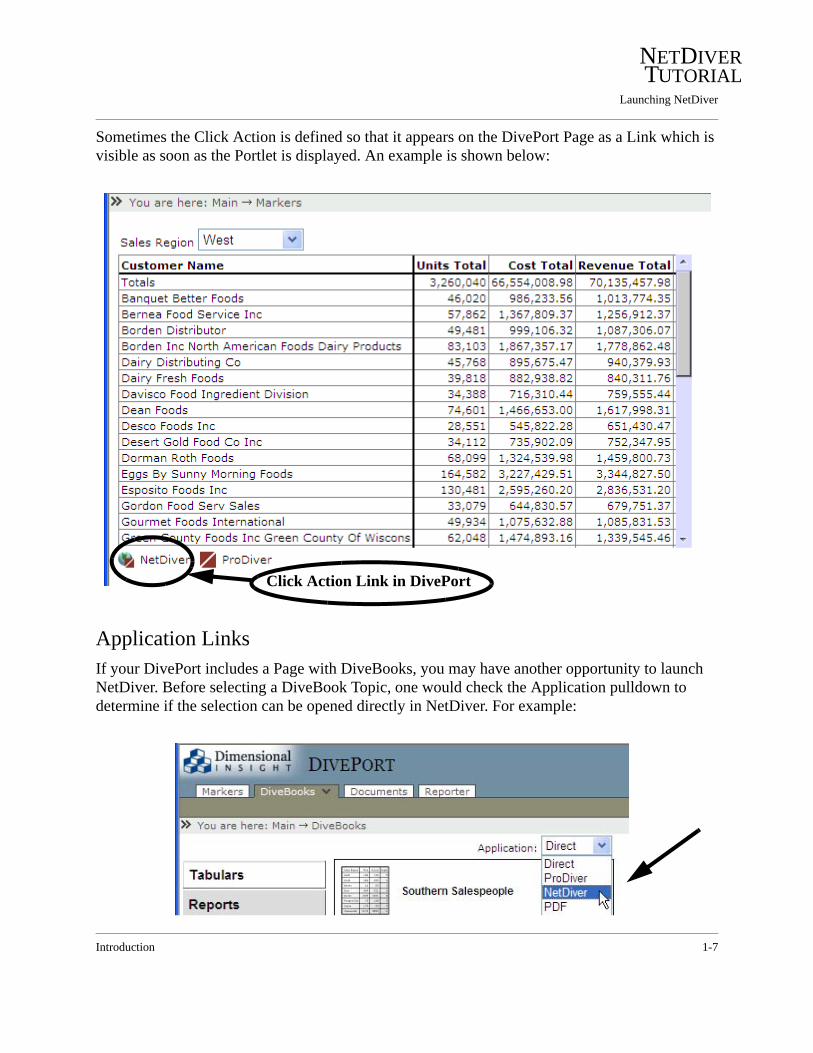
Sometimes the Click Action is defined so that it appears on the DivePort Page as a Link which is visible as soon as the Portlet is displayed. An example is shown below:
Application Links 1If your DivePort includes a Page with DiveBooks, you may have another opportunity to launch NetDiver. Before selecting a DiveBook Topic, one would check the Application pulldown to determine if the selection can be opened directly in NetDiver. For example:
Click Action Link in DivePort
Introduction 1-7
Launching NetDiver
NETDIVER TUTORIAL
Click Actions and Application Links display in DivePort appropriate to the User’s level of functionality (i.e. Casual, General or Advanced). Only General and Advanced users have access to NetDiver links. Contact your DiveLine Administrator if unsure whether you are an Advanced or General user, or if you do not see any NetDiver references in DivePort.
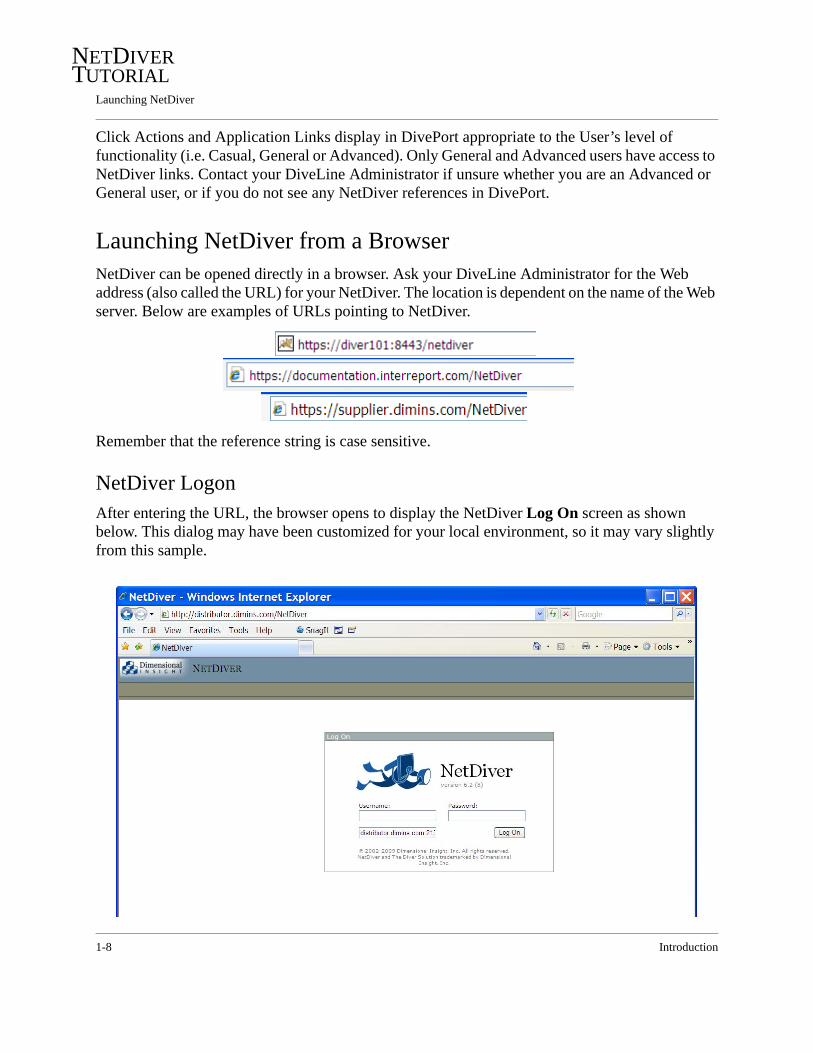
Launching NetDiver from a Browser 2NetDiver can be opened directly in a browser. Ask your DiveLine Administrator for the Web address (also called the URL) for your NetDiver. The location is dependent on the name of the Web server. Below are examples of URLs pointing to NetDiver.
Remember that the reference string is case sensitive.
NetDiver Logon 1After entering the URL, the browser opens to display the NetDiver Log On screen as shown below. This dialog may have been customized for your local environment, so it may vary slightly from this sample.
1-8 Introduction
NetDiver Window Components
NETDIVER TUTORIAL
When logging on to NetDiver directly, the Authentication process will be managed by DiveLine. To log on, enter a DiveLine username and password, enter or select a DiveLine server (if needed), then click the Log On button. Upon login, you will be presented with an Open File dialog. Select a Model or DiveBook to start diving.
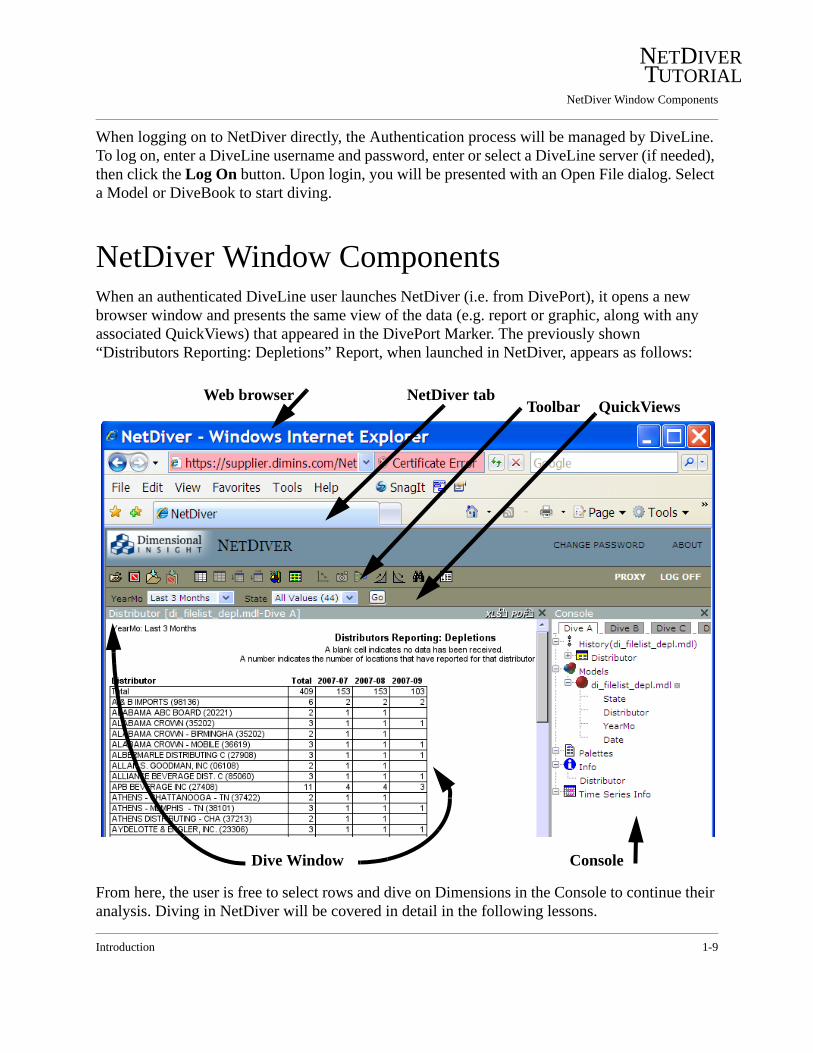
NetDiver Window Components 1When an authenticated DiveLine user launches NetDiver (i.e. from DivePort), it opens a new browser window and presents the same view of the data (e.g. report or graphic, along with any associated QuickViews) that appeared in the DivePort Marker. The previously shown “Distributors Reporting: Depletions” Report, when launched in NetDiver, appears as follows:
From here, the user is free to select rows and dive on Dimensions in the Console to continue their analysis. Diving in NetDiver will be covered in detail in the following lessons.
Web browserQuickViewsToolbar
NetDiver tab
Dive Window Console
Introduction 1-9

Navigating in NetDiver
NETDIVER TUTORIAL
Once you are logged in to NetDiver, the ABOUT button can be used to verify which version of the software you are using. For example:
Click OK to close this dialog.Depending on your DiveLine settings, you may or may not see the CHANGE PASSWORD button to the left of the ABOUT button. If so, click to access the Change your password dialog.
Navigating in NetDiver 1When you are in the NetDiver window in your browser, the mouse pointer most likely appears as an arrow.
Navigation in NetDiver is performed by a single mouse click to select data (e.g., DivePlans, Models, Dimensions, values, etc.) or functions (e.g., Open File, Open DiveBook, Switch to Report, etc.). All this is performed in the Toolbar, QuickViews, Open File dialog, DiveBook, Dive Window, or Console. Double mouse clicks are discussed in context of the lessons that follow.The browser Back button is not recommended for navigational purposes. It uses browser caching to return to a previous browser screen. Many actions in NetDiver require interaction with the server to maintain its current state or status. The Back button in the browser does not pass this interaction back to the server, so NetDiver does not have what is needed to maintain or re-establish its state.
1-10 Introduction
Navigating in NetDiver
NETDIVER TUTORIAL
Logging Off 2Once a NetDiver session is opened, it will stay connected to DiveLine until the user clicks on the LOG OFF button. However, exiting the browser without “logging off” will also disconnect DiveLine, if the browser is Internet Explorer and it is not blocking “active content”. This means that some sessions terminated by closing the browser could continue to tie up connections and the allocated memory until they time out. An optional Session Timeout may be set for your DiveLine. Check with your Diver Solution administrator.Depending on your environment, it is best practice to log off NetDiver before closing the browser.
Saving and Printing 1NetDiver has options for saving your work. You can save Markers on the server, so a dive can be reopened later. You can also save the results of a dive, that is, the data displayed in the Dive Window. The XLS button on the top right of the Dive Window lets you export the data to Excel, while the PDF button lets you export the data to Adobe Acrobat.Once the data is in Excel or Adobe Acrobat, you can use these applications to print or save a file to disk. You can also use the browser’s File > Print menu option to print the active window. Using PDF is the best choice for printing a multi-page report while preserving the format, but using XLS lets you save the data for further manipulation, as well as printing.
Opening Excel Applications 2The Microsoft default setting for Open in Excel opens the application in a new browser window. When using NetDiver, this can lead to a proliferation of browser windows. For this reason, you may prefer to open the Excel application directly rather than in a new browser window. This is accomplished by changing the Microsoft Windows Folder Options. On your machine, select Tools from any window, then Folder Options.... Select the File Types tab and then locate the Excel file type, XLS. Select it and then click the Advanced button. Uncheck the Browse in same window option. Click OK. Excel, when launched from NetDiver, will then open outside the browser.
Introduction 1-11

NETDIVER TUTORIAL
Chapter 2
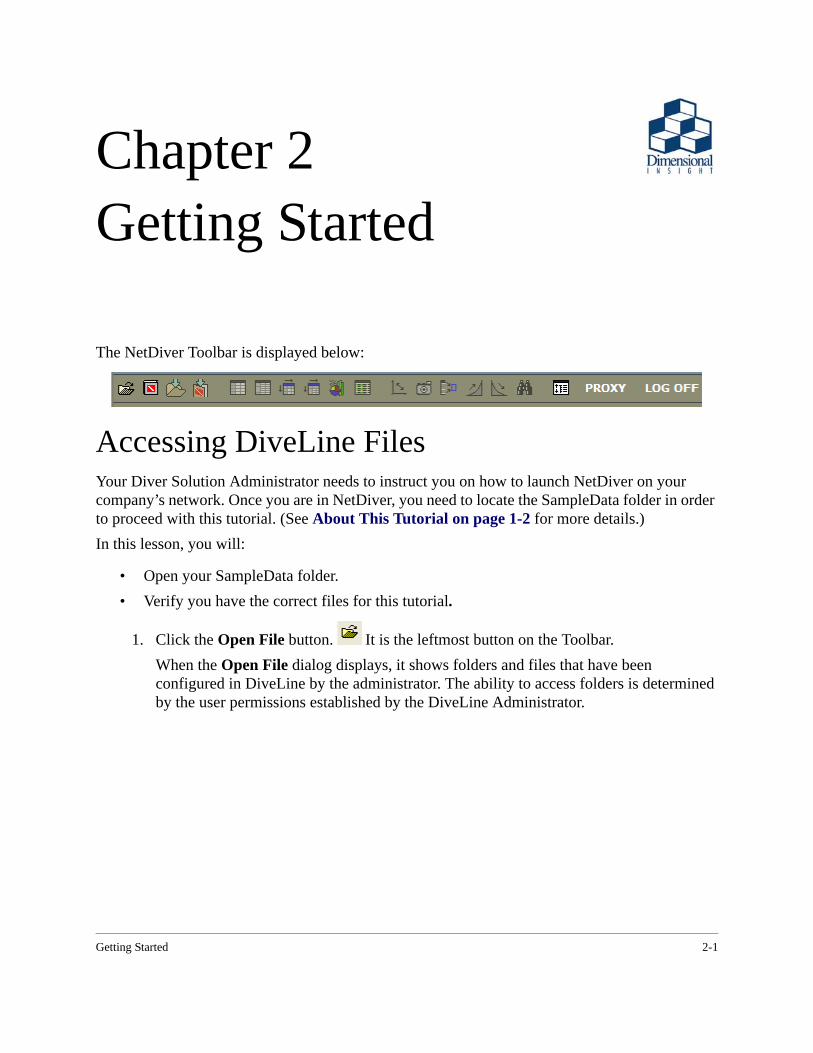
Getting Started 2The NetDiver Toolbar is displayed below:
Accessing DiveLine Files 2Your Diver Solution Administrator needs to instruct you on how to launch NetDiver on your company’s network. Once you are in NetDiver, you need to locate the SampleData folder in order to proceed with this tutorial. (See About This Tutorial on page 1-2 for more details.)In this lesson, you will:
• Open your SampleData folder. • Verify you have the correct files for this tutorial.
1. Click the Open File button. It is the leftmost button on the Toolbar.When the Open File dialog displays, it shows folders and files that have been configured in DiveLine by the administrator. The ability to access folders is determined by the user permissions established by the DiveLine Administrator.
Getting Started 2-1

Opening a DiveBook
NETDIVER TUTORIAL
2. Navigate to the SampleData folder as directed by your administrator. Use the pulldown to select directory areas; click folders to open them. The SampleData should resemble the following.
When you locate the SampleData folder, the four files in the previous image should be listed. If additional files are present, it is possible someone else has already stepped through this tutorial and saved their work. If this is the case, your experience may vary from what is presented here.Two Model files (extension .mdl), a DivePlan file (extension .dvp) and a DiveBook file (extension .dbk), are shown here. NetDiver can also access Marker files (extension .mrk) and Tunnel files (extension .tnl).
Opening a DiveBook 2Data is retrieved in NetDiver through the process of “diving”. Diving selects or finds particular portions of your data to be displayed in a presentation. Such presentations are often saved and organized into DiveBooks for easy retrieval. In this lesson, you will:
• Open a DiveBook. • See how it is organized.• View graphs and reports that are stored in the DiveBook.• Log out of NetDiver.
1. Select demo_drl.dbk by double-clicking on it in the Open File dialog.
2-2 Getting Started
Opening a DiveBook
NETDIVER TUTORIAL
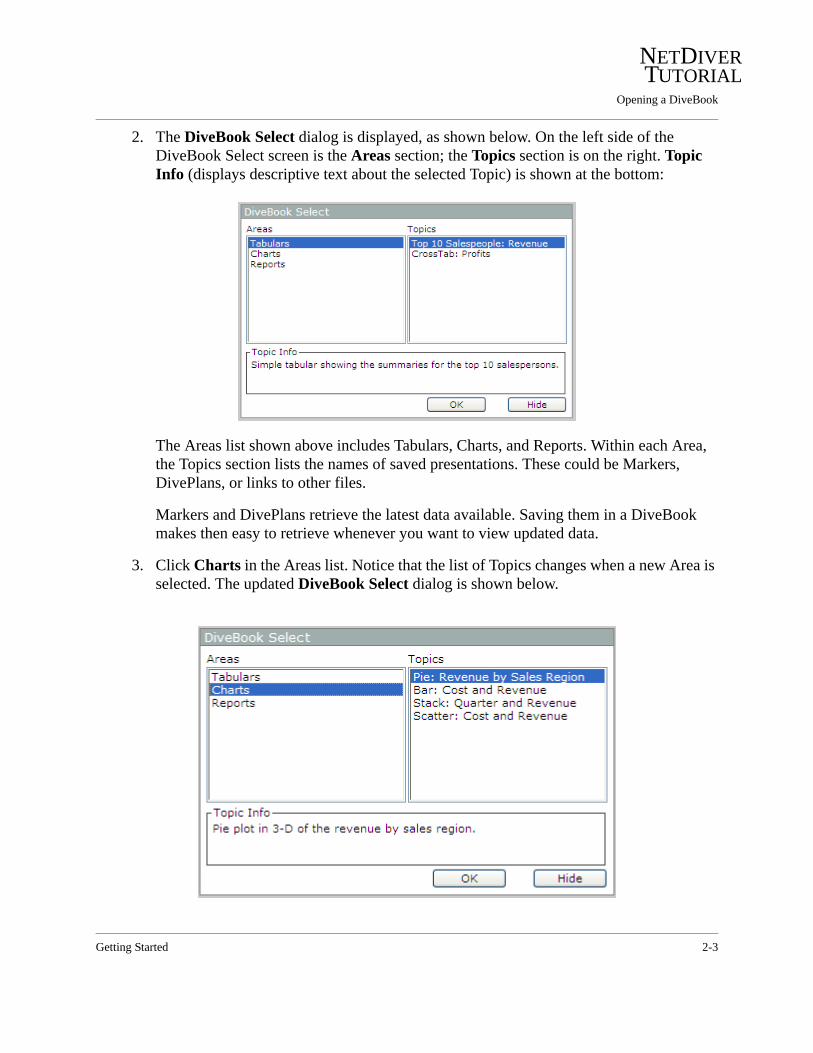
2. The DiveBook Select dialog is displayed, as shown below. On the left side of the DiveBook Select screen is the Areas section; the Topics section is on the right. Topic Info (displays descriptive text about the selected Topic) is shown at the bottom:
The Areas list shown above includes Tabulars, Charts, and Reports. Within each Area, the Topics section lists the names of saved presentations. These could be Markers, DivePlans, or links to other files.
Markers and DivePlans retrieve the latest data available. Saving them in a DiveBook makes then easy to retrieve whenever you want to view updated data.
3. Click Charts in the Areas list. Notice that the list of Topics changes when a new Area is selected. The updated DiveBook Select dialog is shown below.
Getting Started 2-3

Opening a DiveBook
NETDIVER TUTORIAL
4. Select Bar: Cost and Revenue by clicking on that Topic. Then click the OK button to open the Bar Plot graphical display. The resulting Bar Plot and Console are shown on the next pages.
How the Topic displays is a function of how it was saved, as well as your individual computer monitor. If the report does not fit into the display frame, there will be a horizontal or vertical scroll bar along the bottom or right side of the frame. The Console can be temporarily hidden to provide more display space.
2-4 Getting Started

Opening a DiveBook
NETDIVER TUTORIAL
The Bar Plot is displayed on the screen.
Getting Started 2-5

Opening a DiveBook
NETDIVER TUTORIAL
The corresponding Console is shown below.
5. To return to the DiveBook, click the DiveBook button in the Toolbar.
6. Click once on Reports in the Areas list to select it..
2-6 Getting Started

Opening a DiveBook
NETDIVER TUTORIAL
7. Select Cost of Product by Quarter in the Topics list.
8. Click the OK button. This Report shows the Total Cost broken down by Product Family and Sales Quarter. Move the scroll bars to read all data in the report.
9. Close the Dive Window by clicking the in the upper right corner.
10. Click the button in the Toolbar.
11. You will need to log on again, using your DiveLine username and password.
Getting Started 2-7

Opening a Model
NETDIVER TUTORIAL
Opening a Model 2In the previous section, you got a taste of what NetDiver can do. Let us back up a little and examine some of the underlying components. A Model in Diver is your “sea of data”. It is a multidimensional data structure optimized for rapid querying and reporting via NetDiver. In this lesson, you will:
• Open a Model by opening its DivePlan.• Open Categories.• View Dimensions within the Categories.
1. Once you have logged into NetDiver, if the Open File dialog box is not showing, click the Open File button in the Toolbar. Locate the SampleData folder on your system. The sample data should resemble the following:
This folder contains both a demo_drl.mdl file as well as a demo_drl.dvp file. When the DivePlan file is opened, the Model is also accessed, and its organization is reflected in the contents of the Console.
2. Click demo_drl.dvp.
3. When a Model has been read into NetDiver, it appears in the Console window. If the Console is not visible, click the Show the Console button in the Toolbar.
2-8 Getting Started

Opening a Model
NETDIVER TUTORIAL
The sample Model has four Categories: Orders, Customer Data, Sales Force, and Products. Categories, represented by gray folders, are used to organize related Dimensions and are defined in the DivePlan.
4. In the Console, click all of the plus signs to expand each Category. Doing so will display each Category’s Dimensions. The results are on the following page.
Model
Categories
Getting Started 2-9

Opening a Model
NETDIVER TUTORIAL
Each Dimension represents a different method of organizing and viewing the data.
As seen in the Console, the Dimensions within the Sales Force category are Salesperson and Sales Region. The Products Category also has two Dimensions: Product Family and Product Name. Each Dimension is followed by a number in parentheses. These DimCounts indicate how many values are in the Model. For example, this Model has 9 Product Families and 109 Product Names. Each Dimension is preceded by a down arrow. Each Dimension with a down arrow can be viewed by diving on it. Now it is time to dive.
Two other basic components of a Model are the Summaries, the numeric data, and the Info Fields, the additional pieces of data related to a particular Dimension value.
Model nameCategories
Dimensions
DimCounts
2-10 Getting Started

Your First Dive
NETDIVER TUTORIAL
Your First Dive 2Once you have opened a Model, you can dive into it. “Diving” is the process of using NetDiver to select a Dimension in the Model in order to retrieve details from the data. In this lesson, you will:
• Dive into the Model.• Sort and Focus on data.• Export the data to Excel.
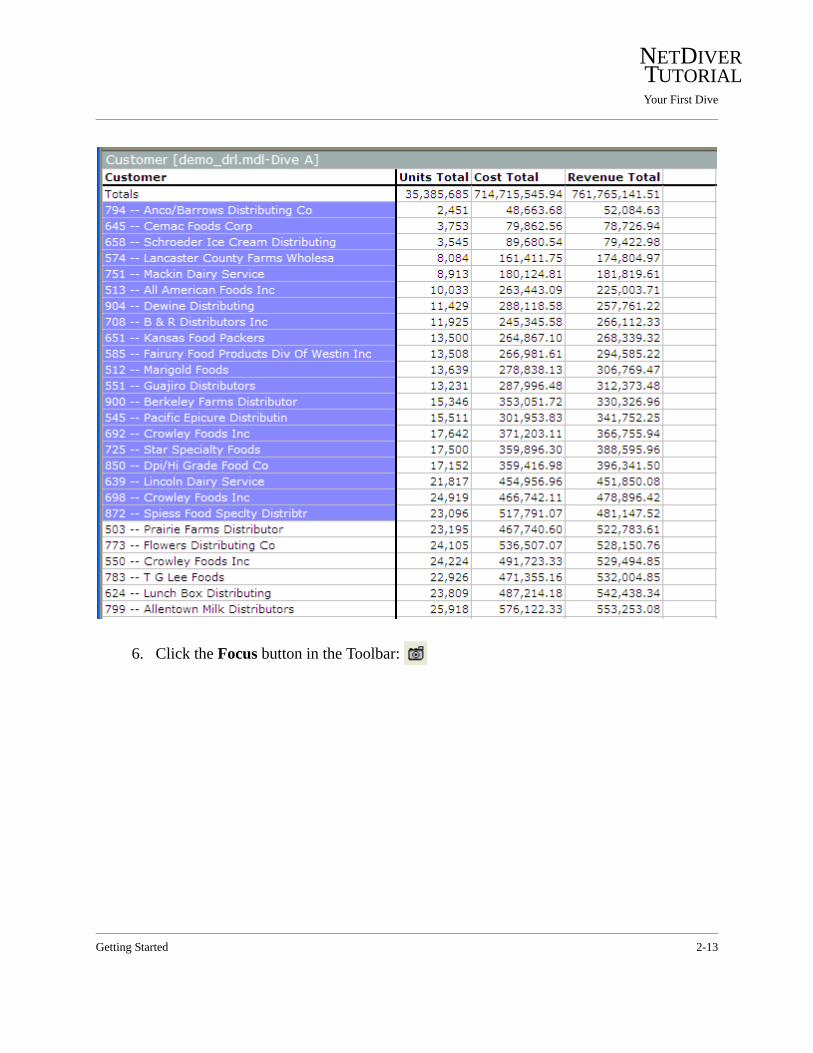
1. Click Customer in the Console (shown in the screen shot on the previous page) to dive on that Dimension. The resulting Dive Window will look similar to the following, where the Summaries defined for this Model are: Units Total, Cost Total, and Revenue Total.
Notice the scroll bar allows for viewing the rest of the rows.
Getting Started 2-11

Your First Dive
NETDIVER TUTORIAL
The Dimension selected for diving determines the breakdown of the data that will appear in the new window. The default window type for an initial dive is the Tabular display, which is similar to a spreadsheet.
Sorting Up and Focusing 2Data can be sorted up, sorted down, or focused on. Focusing allows you to display only the data you need for your analysis. For example, you can focus on the Customers that generate the least Revenue.
2. Click once on the right most column header, Revenue Total, to select it.
3. Click the Sort Up button in the Toolbar. Revenue will be sorted in ascending order.
4. Hold the Ctrl key and click once on the Revenue Total column header to deselect it.
5. Select“794 -- Anco/Barrows Distributing Co” in the Customer column. Then hold down the Shift key and click “872 -- Spiess Food Speclty Distribtr” located further down in the column. This selects the Customers whose Revenue is under 500,000 according to the current Revenue Totals. The selected rows are highlighted.
Multiple rows and/or columns can be selected via standard Windows shortcut keystrokes, and can be deselected using the Ctrl key.
2-12 Getting Started
Your First Dive
NETDIVER TUTORIAL
6. Click the Focus button in the Toolbar:
Getting Started 2-13

Your First Dive
NETDIVER TUTORIAL
The Tabular display is now limited to the Customers that were selected in step 5.
In the Dive Window, we now have a Tabular with the lowest revenue generating Customers.
Exporting to Excel 2What if you want to continue working with the current data, but in a spreadsheet?
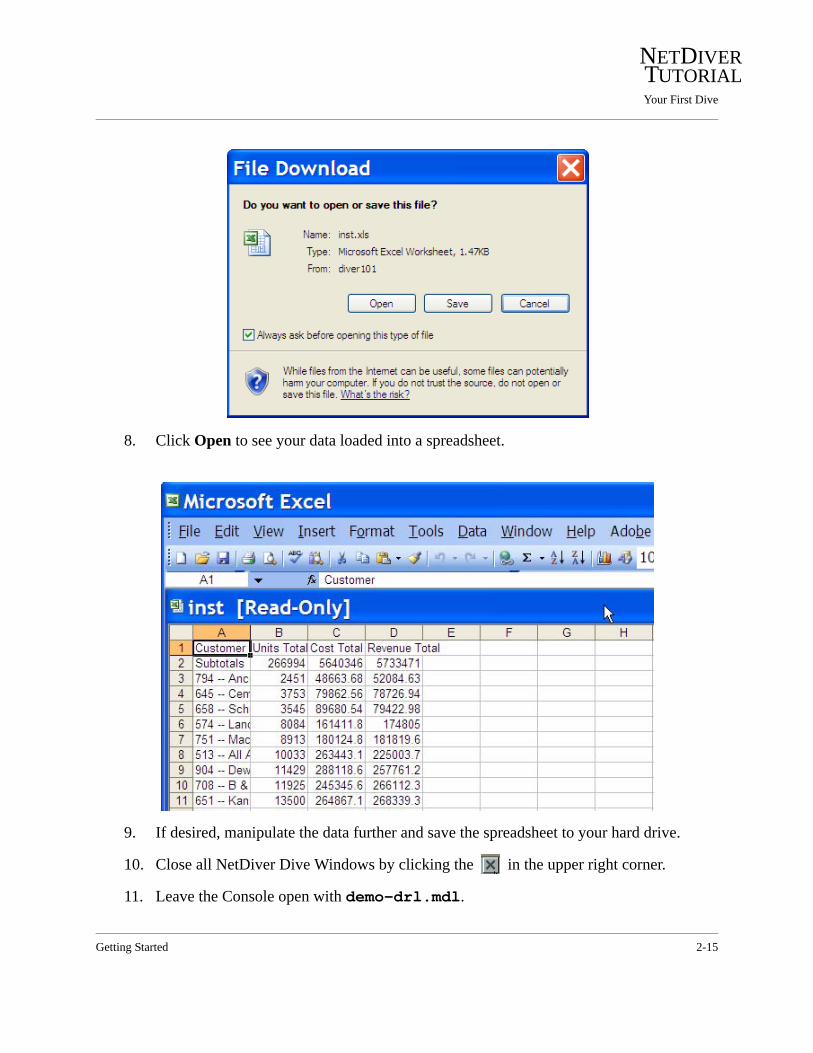
7. In the Dive Window, click the Open in Excel button at the top rightto display the File Download dialog.
2-14 Getting Started
Your First Dive
NETDIVER TUTORIAL
8. Click Open to see your data loaded into a spreadsheet.
9. If desired, manipulate the data further and save the spreadsheet to your hard drive.
10. Close all NetDiver Dive Windows by clicking the in the upper right corner.
11. Leave the Console open with demo-drl.mdl.
Getting Started 2-15
Another Dive
NETDIVER TUTORIAL
Another Dive 2Using the same Model, different details can be retrieved by diving on a different Dimension. In this lesson, you will:
• Dive into the Model.• Sort and Focus on data.• Add a calculated column.• Save a Marker.
The demo_drl.dvp should still be open.
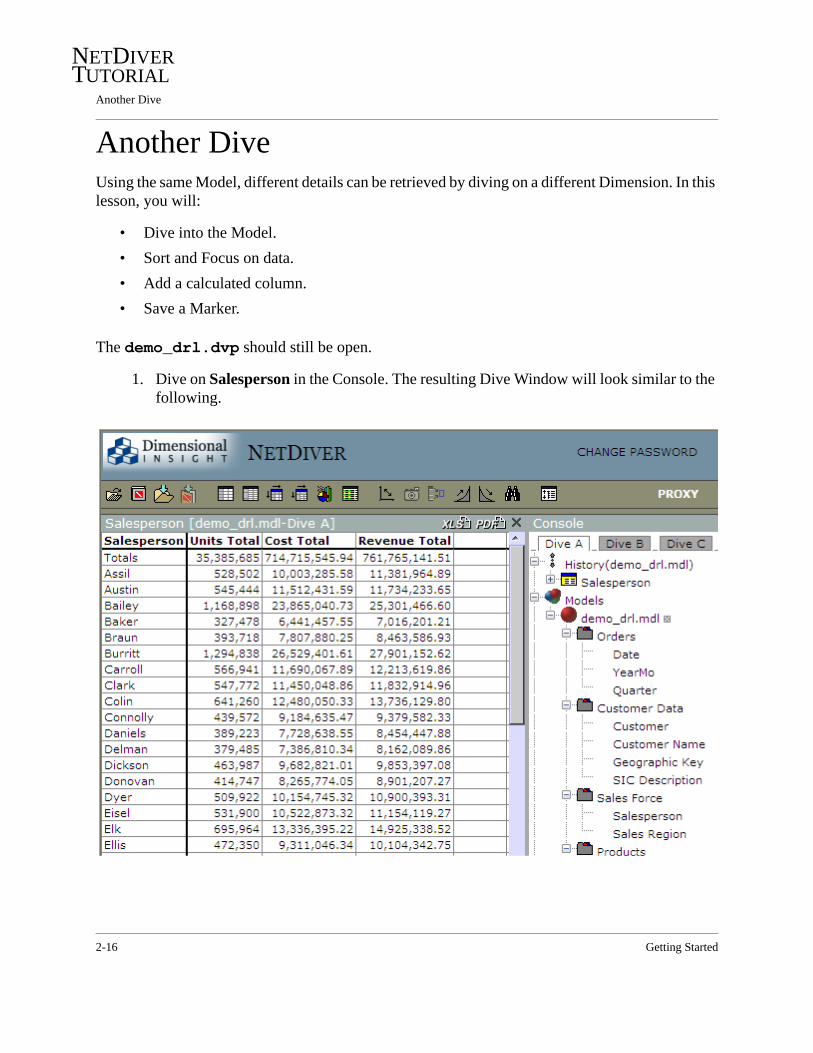
1. Dive on Salesperson in the Console. The resulting Dive Window will look similar to the following.
2-16 Getting Started
Another Dive
NETDIVER TUTORIAL
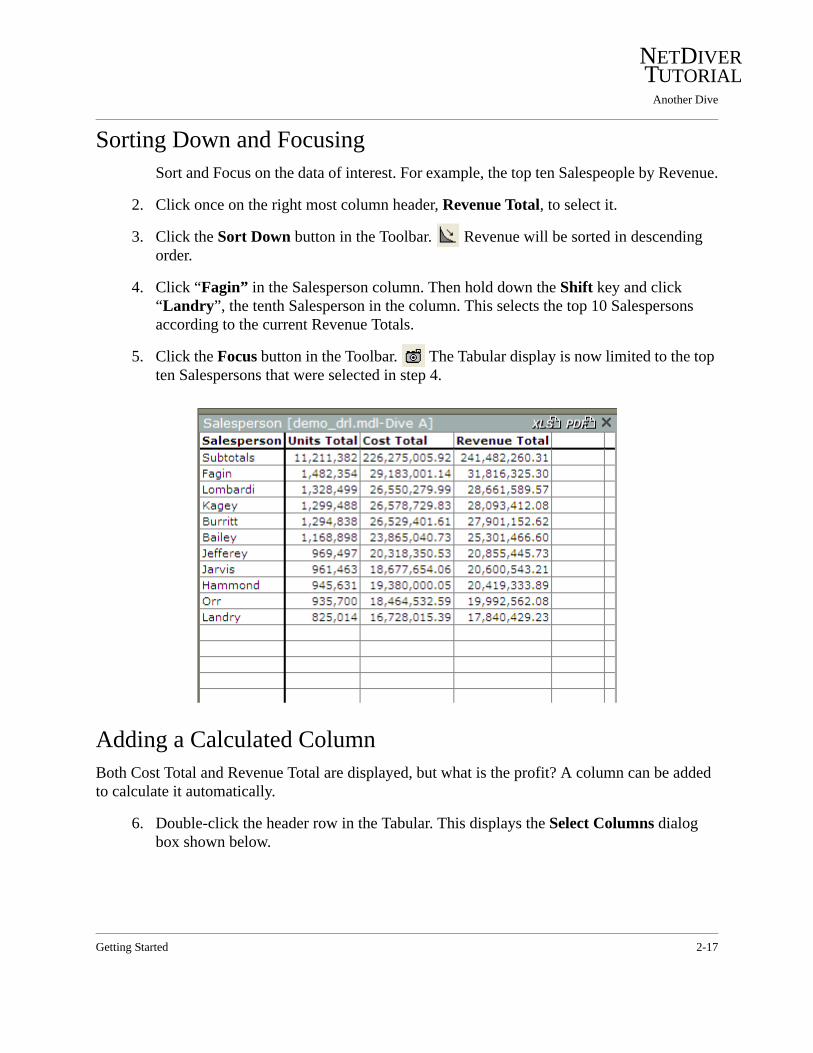
Sorting Down and Focusing 2Sort and Focus on the data of interest. For example, the top ten Salespeople by Revenue.
2. Click once on the right most column header, Revenue Total, to select it.
3. Click the Sort Down button in the Toolbar. Revenue will be sorted in descending order.
4. Click “Fagin” in the Salesperson column. Then hold down the Shift key and click “Landry”, the tenth Salesperson in the column. This selects the top 10 Salespersons according to the current Revenue Totals.
5. Click the Focus button in the Toolbar. The Tabular display is now limited to the top ten Salespersons that were selected in step 4.
Adding a Calculated Column 2Both Cost Total and Revenue Total are displayed, but what is the profit? A column can be added to calculate it automatically.
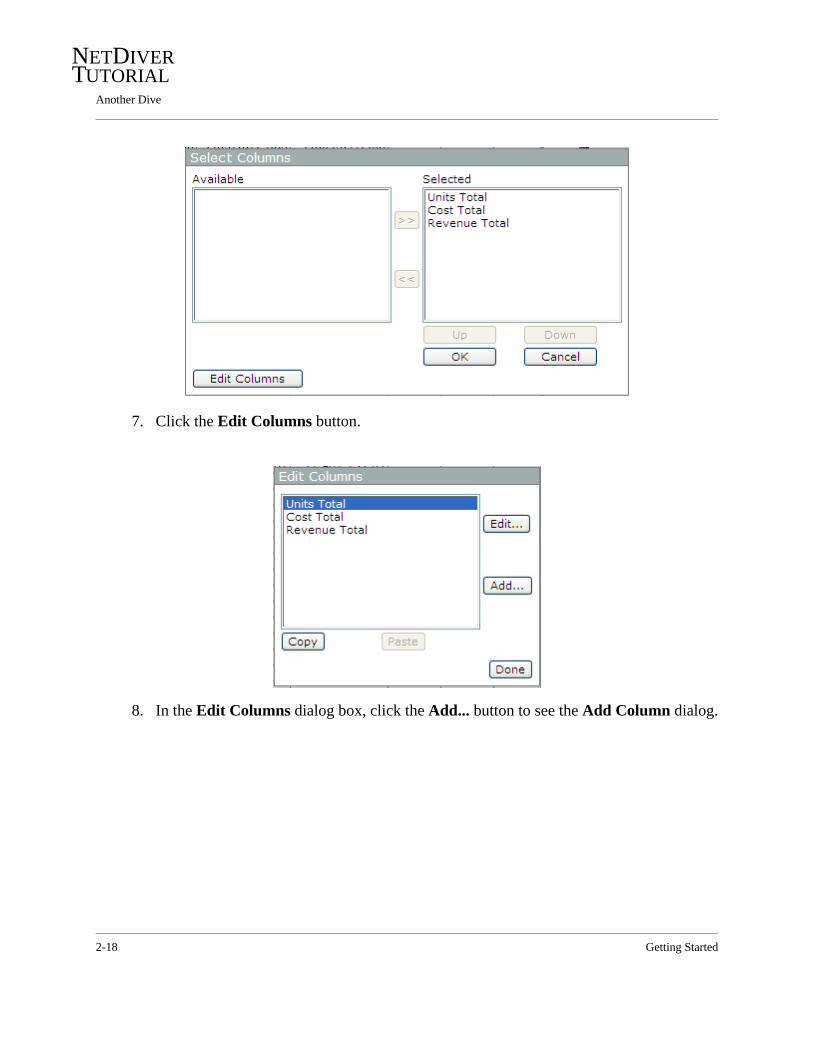
6. Double-click the header row in the Tabular. This displays the Select Columns dialog box shown below.
Getting Started 2-17
Another Dive
NETDIVER TUTORIAL
7. Click the Edit Columns button.
8. In the Edit Columns dialog box, click the Add... button to see the Add Column dialog.
2-18 Getting Started

Another Dive
NETDIVER TUTORIAL
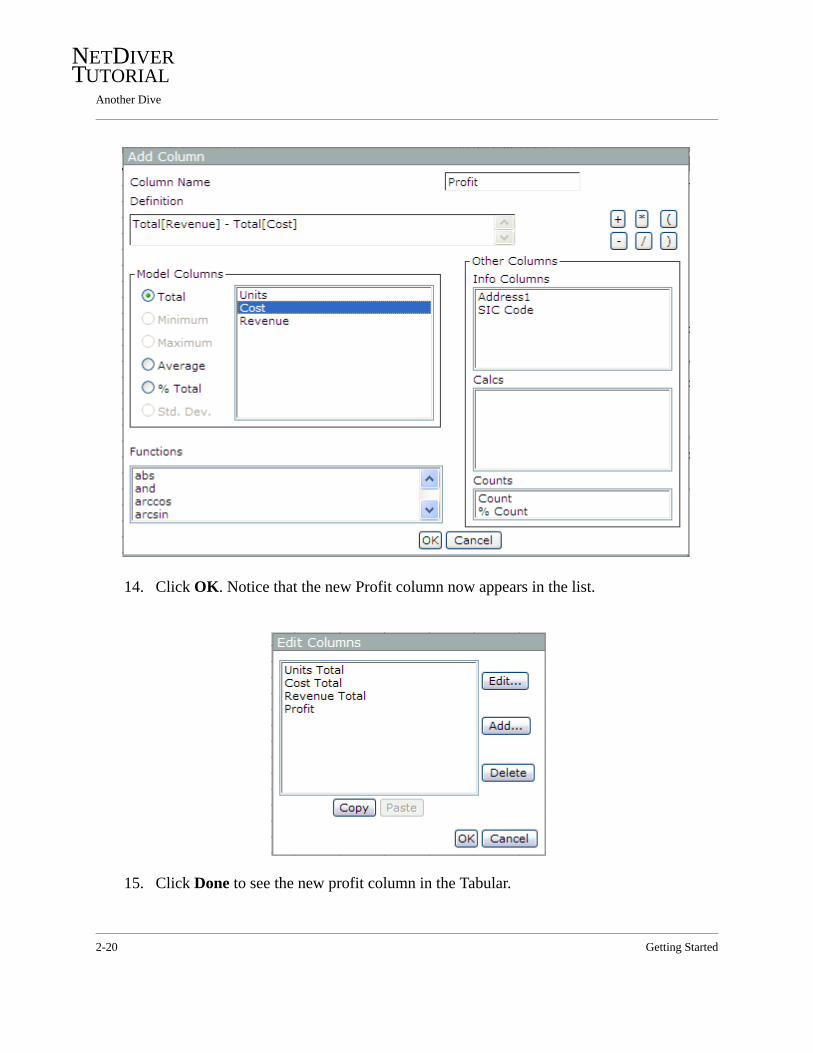
9. For the Column Name, enter “Profit” in the blank text box.
10. Under Model Columns, make sure the radio button next to Total is selected.
11. Select the Model Column Revenue by clicking on it. Notice that the Definition text box displays the calculation being defined.
12. Click the Subtraction (-) button to the right of the Definition box.
13. Select Cost under Model Columns.
The Definition text box now displays the calculation: Total[Revenue] -Total[Cost].
Getting Started 2-19
Another Dive
NETDIVER TUTORIAL
14. Click OK. Notice that the new Profit column now appears in the list.
15. Click Done to see the new profit column in the Tabular.
2-20 Getting Started

Another Dive
NETDIVER TUTORIAL
In the Dive Window, we have a Tabular with the top ten Salespersons. It not only has the Summaries from the Model, but a calculated Profit column as well. It took 15 steps to get to this point. You may want to use this as a starting point at a later time for further diving. That is one reason to save a Marker.
Saving a Marker 2A Marker is similar to a bookmark. It does not contain data, but records the steps of the dive and allows you to continue the dive from that point at a later time, or to replay the dive with updated data. In order to save the currently active Dive Window, the dive path that leads to it, and the Model that it came from, a Marker must be saved. If a DiveBook is open, the Marker can be stored in that DiveBook, or in an external file. Without a DiveBook open, the Marker will be saved as a file.
Getting Started 2-21
Another Dive
NETDIVER TUTORIAL
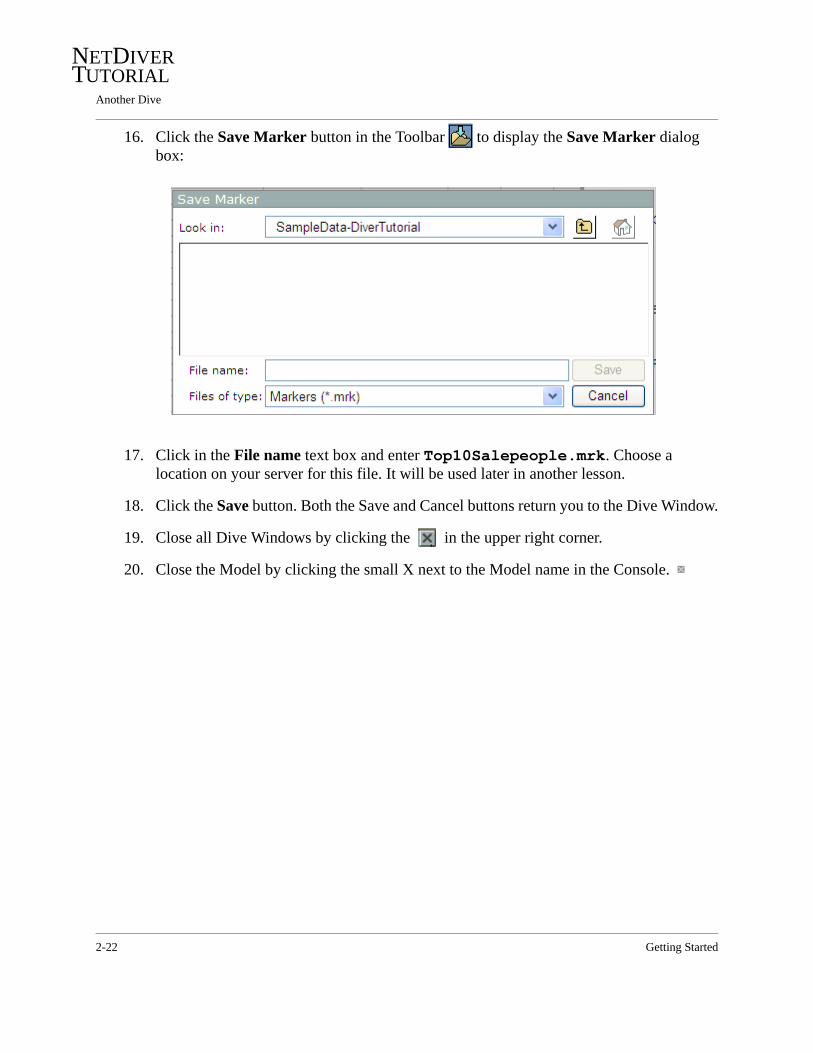
16. Click the Save Marker button in the Toolbar to display the Save Marker dialog box:
17. Click in the File name text box and enter Top10Salepeople.mrk. Choose a location on your server for this file. It will be used later in another lesson.
18. Click the Save button. Both the Save and Cancel buttons return you to the Dive Window.
19. Close all Dive Windows by clicking the in the upper right corner.
20. Close the Model by clicking the small X next to the Model name in the Console.
2-22 Getting Started

Diving Deeper
NETDIVER TUTORIAL
Diving Deeper 2A dive can be done using multiple Dimensions. Each step in the dive path further narrows down the displayed data. Values selected for prior steps can be changed without redoing the later steps. This lesson uses the Marker file Top10Salesmen.mrk created in the last lesson (see Saving a Marker on page 2-21).In this lesson, you will:
• Dive deeper into the data.• Use the Cascade feature.
1. Click the Open File button in the Toolbar and locate Top10Salesmen.mrk. Click the Marker name to open it as a Tabular display.
2. Expand the Categories in the Console. Notice there are no down arrows, since no Dimension is selected.
3. Double-click “Fagin” in the first column. The Dive Window is shown below, and the updated Console is shown on the next page.
Getting Started 2-23
Diving Deeper
NETDIVER TUTORIAL
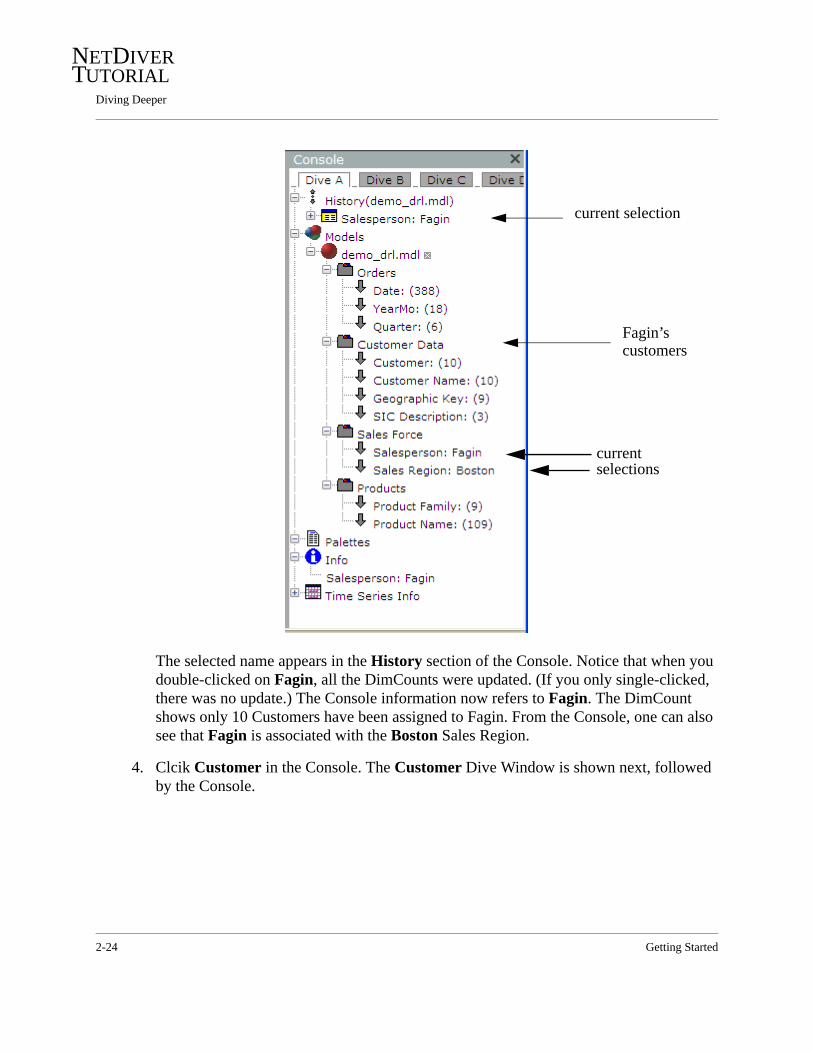
The selected name appears in the History section of the Console. Notice that when you double-clicked on Fagin, all the DimCounts were updated. (If you only single-clicked, there was no update.) The Console information now refers to Fagin. The DimCount shows only 10 Customers have been assigned to Fagin. From the Console, one can also see that Fagin is associated with the Boston Sales Region.
4. Clcik Customer in the Console. The Customer Dive Window is shown next, followed by the Console.
current selection
Fagin’scustomers
currentselections
2-24 Getting Started

Diving Deeper
NETDIVER TUTORIAL
This new window displays Fagin’s 10 customers.
current dive step
Getting Started 2-25

Diving Deeper
NETDIVER TUTORIAL
Notice that Totals, the first row in the Customer Dive Window, matches the row for Fagin in the previous Salesperson Dive Window.
This is a two-step dive: first into Salesperson and then into Customer.
The History area at the top of the Console keeps track of your dives. Currently the History area shows Salesperson: Fagin and Customer. This area of the Console is important for cascading your dives.
Cascading 2In order to view the customers for a different Salesperson, return to step one of the dive. This is done by using the History area of the Console. In this example, the Customers of a different Salesperson are displayed simply by clicking on the new Salesperson’s name in the first Dive Window. Values in the second Dive Window are then updated for the new Salesperson. This is called a Cascade. A Cascade can be done along an entire dive path or within a section of a dive path.
5. Double-click Salesperson: Fagin in the History area of the Console. The Dive Window for this step of the dive is redisplayed, and the Console’s History area is updated.
current Dive Window
2-26 Getting Started
Diving Deeper
NETDIVER TUTORIAL
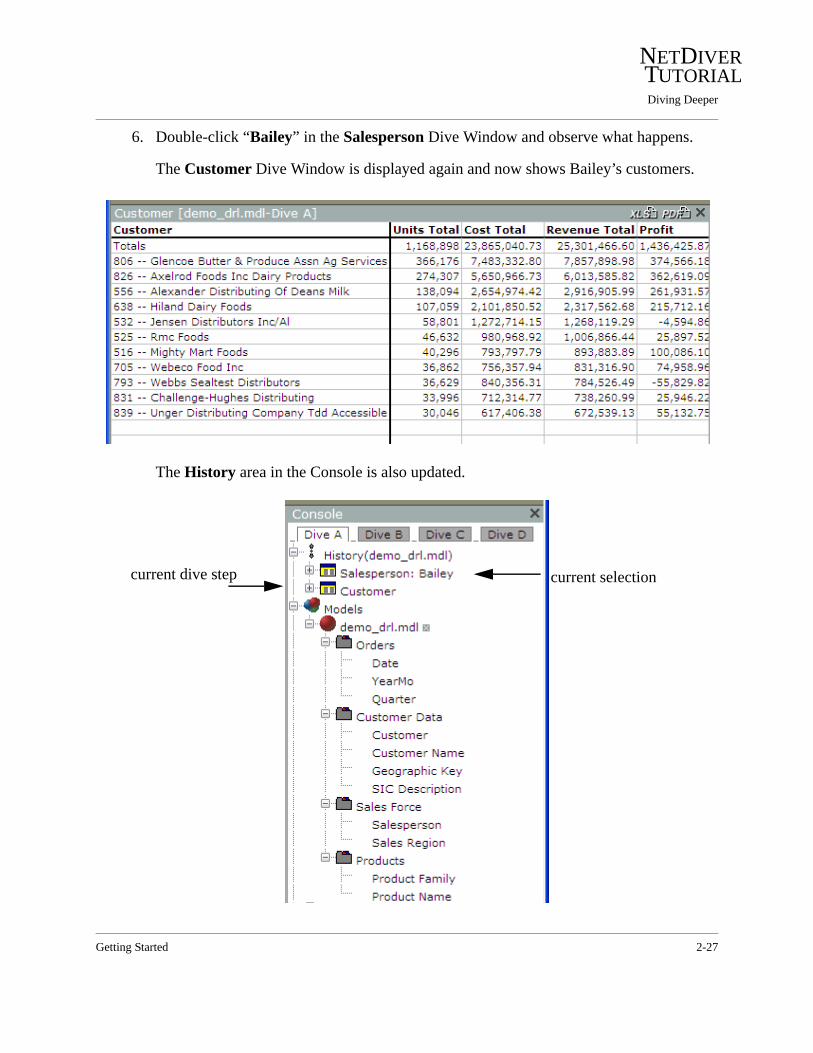
6. Double-click “Bailey” in the Salesperson Dive Window and observe what happens.
The Customer Dive Window is displayed again and now shows Bailey’s customers.
The History area in the Console is also updated.
current selectioncurrent dive step
Getting Started 2-27

Diving Deeper
NETDIVER TUTORIAL
7. Click once on Bailey’s customer, “806 -- Glencoe Butter & Produce Assn Ag Services” in the Customer Dive Window. Notice the Console. Customer Name appears in the History section and the down arrows reappear on the Dimensions, making them divable.
8. Click Product Name in the Console to take this dive one step deeper.
dive arrows
current dive step current selection
2-28 Getting Started
Diving Deeper
NETDIVER TUTORIAL
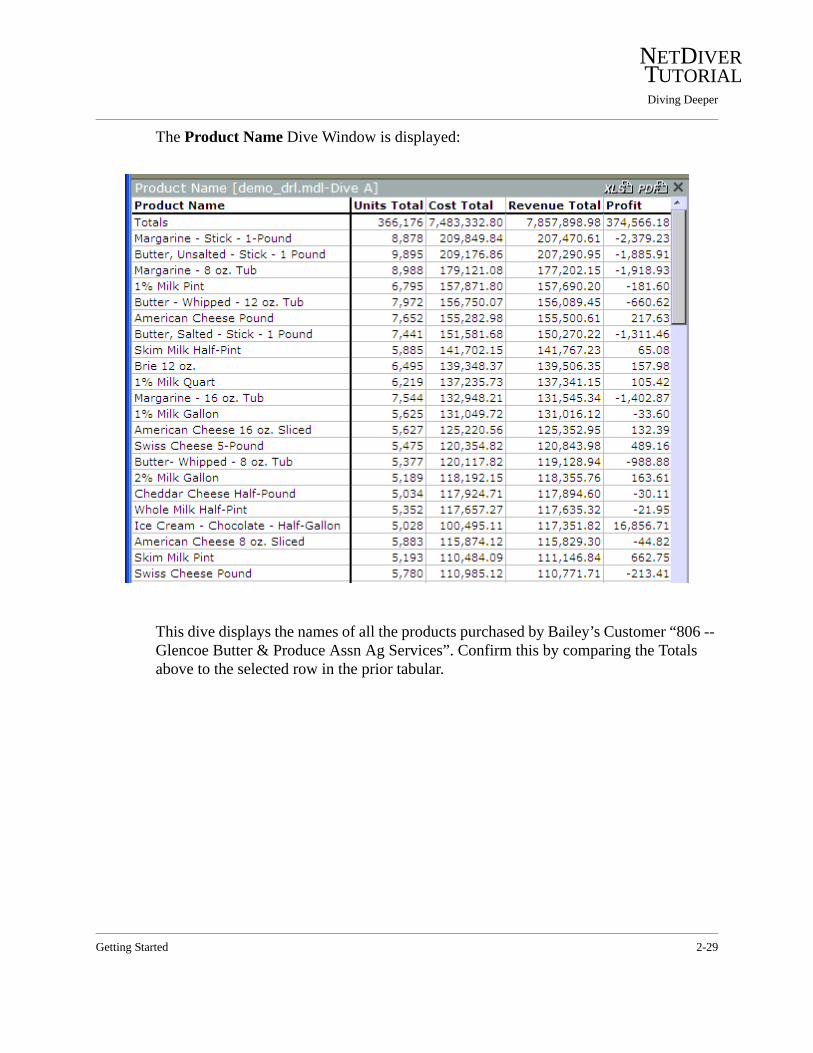
The Product Name Dive Window is displayed:
This dive displays the names of all the products purchased by Bailey’s Customer “806 -- Glencoe Butter & Produce Assn Ag Services”. Confirm this by comparing the Totals above to the selected row in the prior tabular.
Getting Started 2-29
Diving Deeper
NETDIVER TUTORIAL
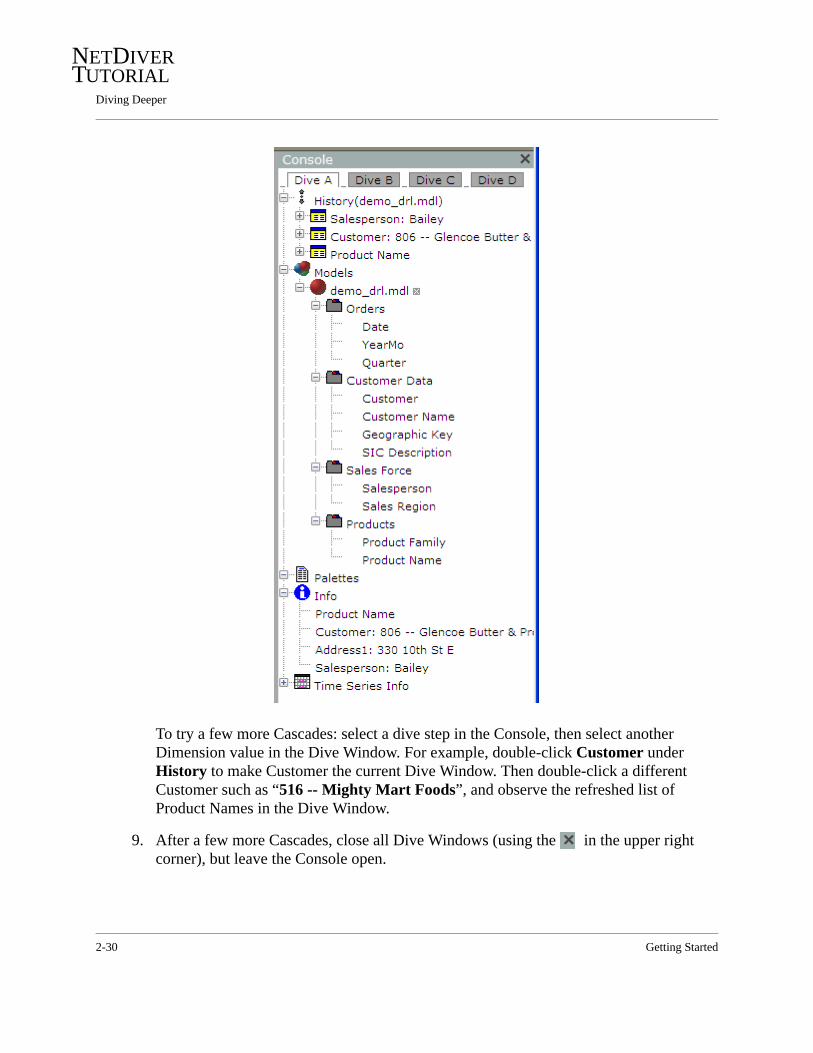
To try a few more Cascades: select a dive step in the Console, then select another Dimension value in the Dive Window. For example, double-click Customer under History to make Customer the current Dive Window. Then double-click a different Customer such as “516 -- Mighty Mart Foods”, and observe the refreshed list of Product Names in the Dive Window.
9. After a few more Cascades, close all Dive Windows (using the in the upper right corner), but leave the Console open.
2-30 Getting Started

Diving Deeper
NETDIVER TUTORIAL
An easy way to close all of the Dive Windows at once is to close the highest window in the dive path. In this Cascading lesson, the highest window in the dive path is the Salesperson window. Redisplay this Dive Window by double-clicking on the Salesperson step in the History section of the Console. Then use the close button.
Notice that closing all Dive Windows does not close the Model. The Console still shows the Model name and the Dimensions are once again available for diving (i.e. are preceded by down arrows).
Getting Started 2-31

Diving Deeper
NETDIVER TUTORIAL
Finding and Grouping 2In NetDiver, a search for specific data can be performed, or multiple Dimension values can be grouped as a single unit, and related data can be retrieved. In this lesson, you will:
• Search for text in a Dive Window using Find. • Experiment with the Find actions.• Group multiple Dimension values into a single unit.• Dive and Cascade on a Group.
The demo_drl.dvp should still be open. If not, locate and open it now.
1. Click Product Name in the Console. Scroll down to see more Product Names.
2. In the Tabular, click once on the Product Name column header to select it.
3. Click the Find button in the Toolbar.
2-32 Getting Started
Diving Deeper
NETDIVER TUTORIAL
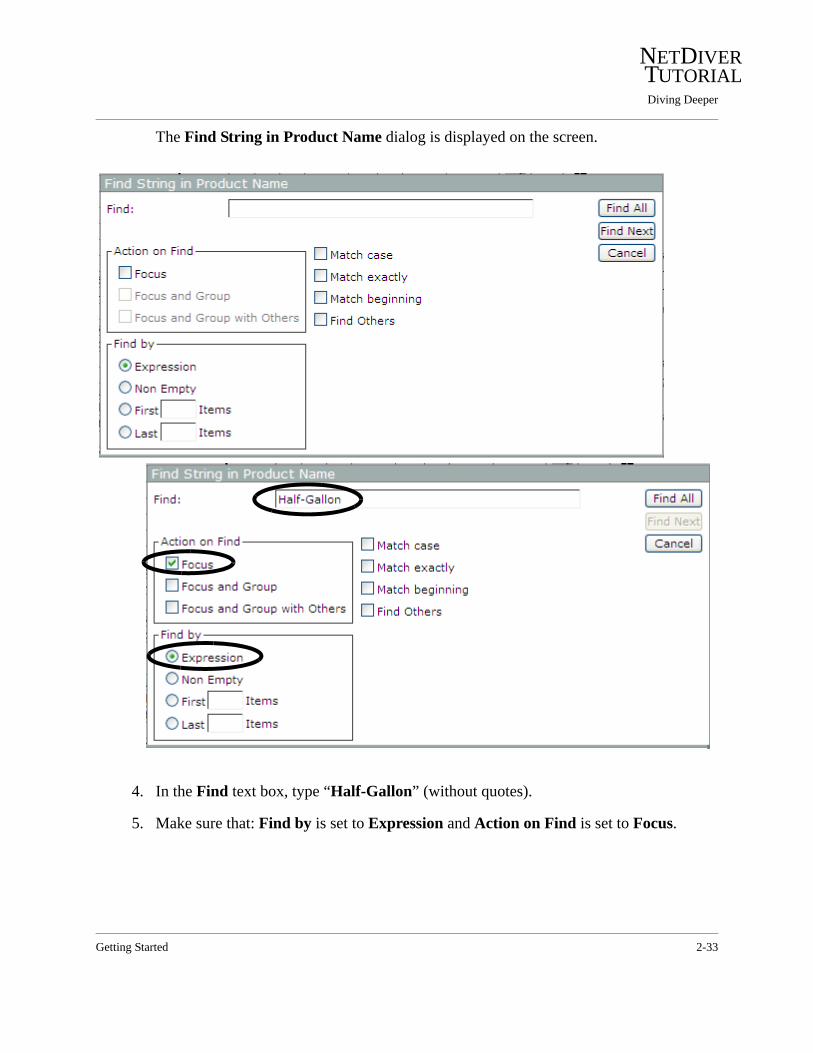
The Find String in Product Name dialog is displayed on the screen.
4. In the Find text box, type “Half-Gallon” (without quotes).
5. Make sure that: Find by is set to Expression and Action on Find is set to Focus.
Getting Started 2-33
Diving Deeper
NETDIVER TUTORIAL
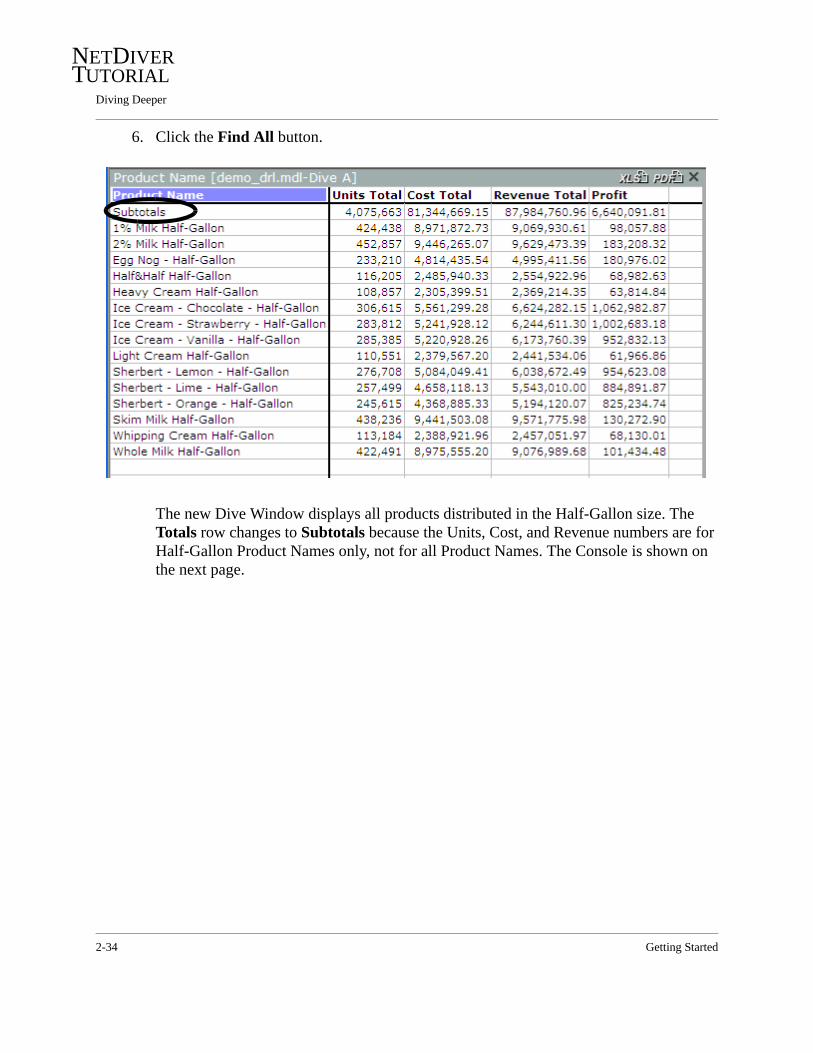
6. Click the Find All button.
The new Dive Window displays all products distributed in the Half-Gallon size. The Totals row changes to Subtotals because the Units, Cost, and Revenue numbers are for Half-Gallon Product Names only, not for all Product Names. The Console is shown on the next page.
2-34 Getting Started

Diving Deeper
NETDIVER TUTORIAL
In order to enable further diving, a specific Product Name needs to be selected in the detail rows of the Tabular, causing the down arrows to reappear in the Console. The Subtotals row is not available for selection.
There are two other options of interest on the Find dialog.
7. Close the Dive Window and dive on Product Name again.
8. Click the Find button. Repeat selections from the previous Find, but this time, also select Focus and Group.
Getting Started 2-35
Diving Deeper
NETDIVER TUTORIAL
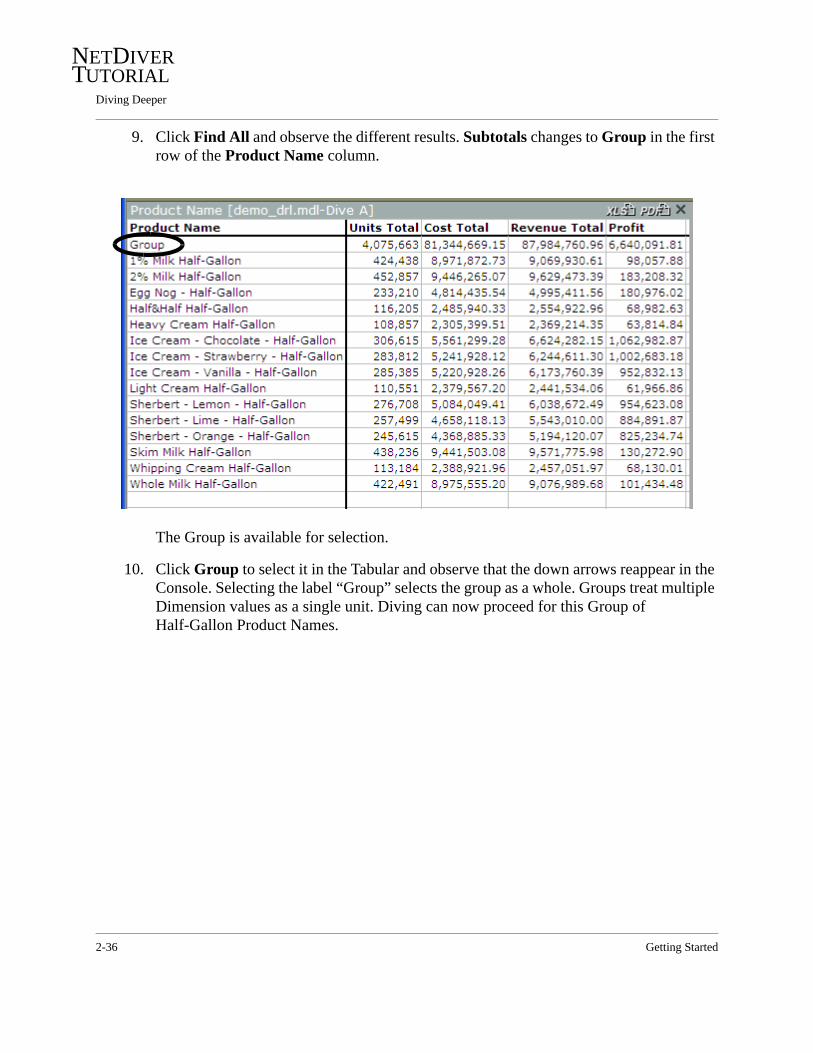
9. Click Find All and observe the different results. Subtotals changes to Group in the first row of the Product Name column.
The Group is available for selection.
10. Click Group to select it in the Tabular and observe that the down arrows reappear in the Console. Selecting the label “Group” selects the group as a whole. Groups treat multiple Dimension values as a single unit. Diving can now proceed for this Group of Half-Gallon Product Names.
2-36 Getting Started
Diving Deeper
NETDIVER TUTORIAL
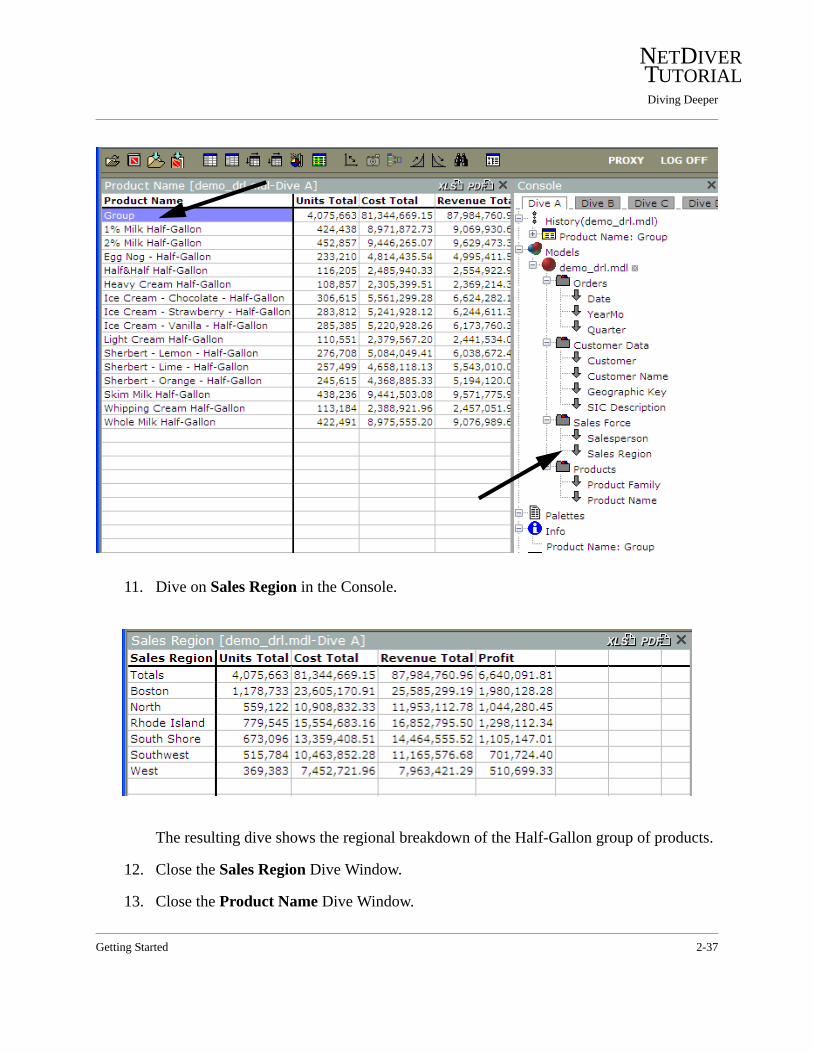
11. Dive on Sales Region in the Console.
The resulting dive shows the regional breakdown of the Half-Gallon group of products.
12. Close the Sales Region Dive Window.
13. Close the Product Name Dive Window.
Getting Started 2-37

Diving Deeper
NETDIVER TUTORIAL
14. Dive again on Product Name in the Console.
15. Click the Find button.
16. In the Find String in Product Name dialog, enter Half-Gallon, click Focus and Focus and Group with Others, then click the Find All button.
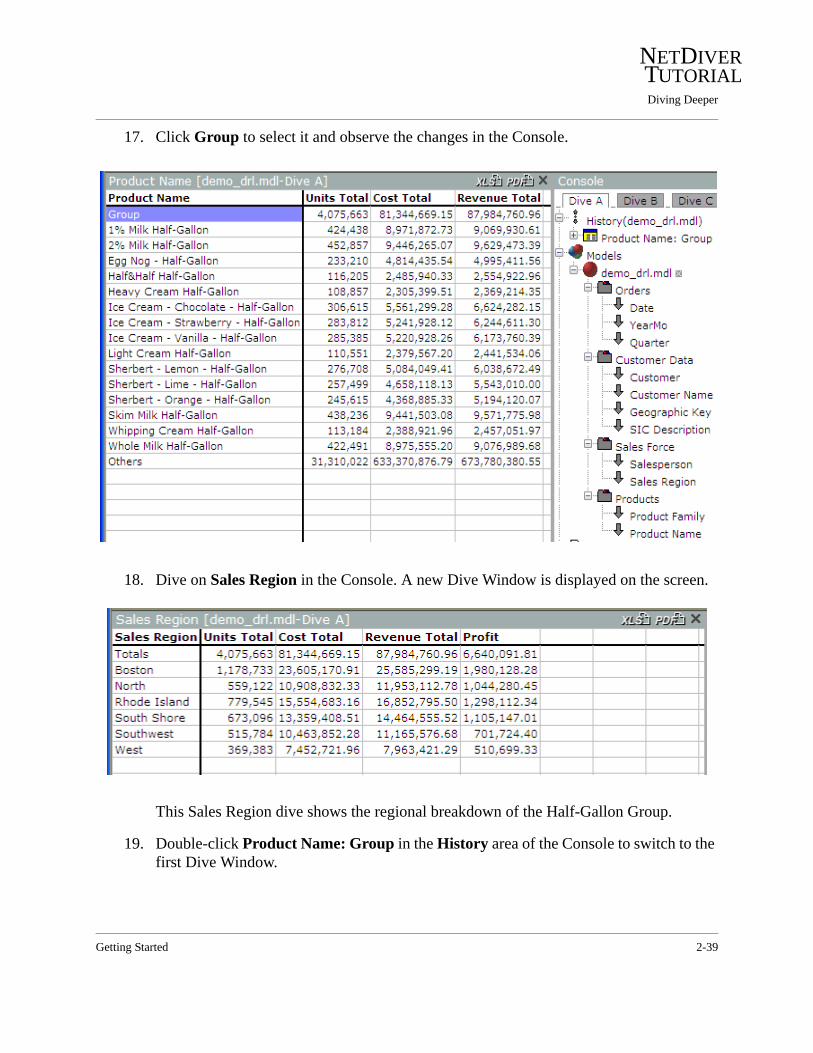
These Find results not only have a Group at the top of the Tabular, but include a final row labeled Others. The sum of the Group number with the Others number (e.g. the Units Total of 4,075,663 + 31,310,022) accounts for all the data presented in the very first dive on Product Name. To check this total, see the first screen shot of the dive on Product Name under Finding and Grouping on page 2-32.
2-38 Getting Started
Diving Deeper
NETDIVER TUTORIAL
17. Click Group to select it and observe the changes in the Console.
18. Dive on Sales Region in the Console. A new Dive Window is displayed on the screen.
This Sales Region dive shows the regional breakdown of the Half-Gallon Group.
19. Double-click Product Name: Group in the History area of the Console to switch to the first Dive Window.
Getting Started 2-39

Diving Deeper
NETDIVER TUTORIAL
20. Double-click Others in the Dive Window to Cascade the dive.
This regional breakdown shows Totals for all Product Names except for those with “Half-Gallon” in them.
21. Double-click Product Name: Others in the History area of the Console to return to the first dive step.
22. Double-click another value in the Dive Window to Cascade again: the Summaries in the Sales Region Dive Window change according to the Product Name totals in the first dive. You can verify numbers in prior screen shots.
.
2-40 Getting Started

Diving Deeper
NETDIVER TUTORIAL
23. Close all the Dive Windows, keeping the Console open.
In this lesson we searched for a string of text. The Find function can also search for numbers and date and period ranges, depending on the selected Dimension.
Getting Started 2-41

Chapter 3
Display Formats 3NetDiver has three types of displays: Tabular, Graphic, and Reports. These display options allow you to tailor the presentation of any particular set of data to your needs. The previous chapter showed the basic Tabular display. A sampling beyond the basic Tabular is explored in the following lessons.
Tabular Displays 3
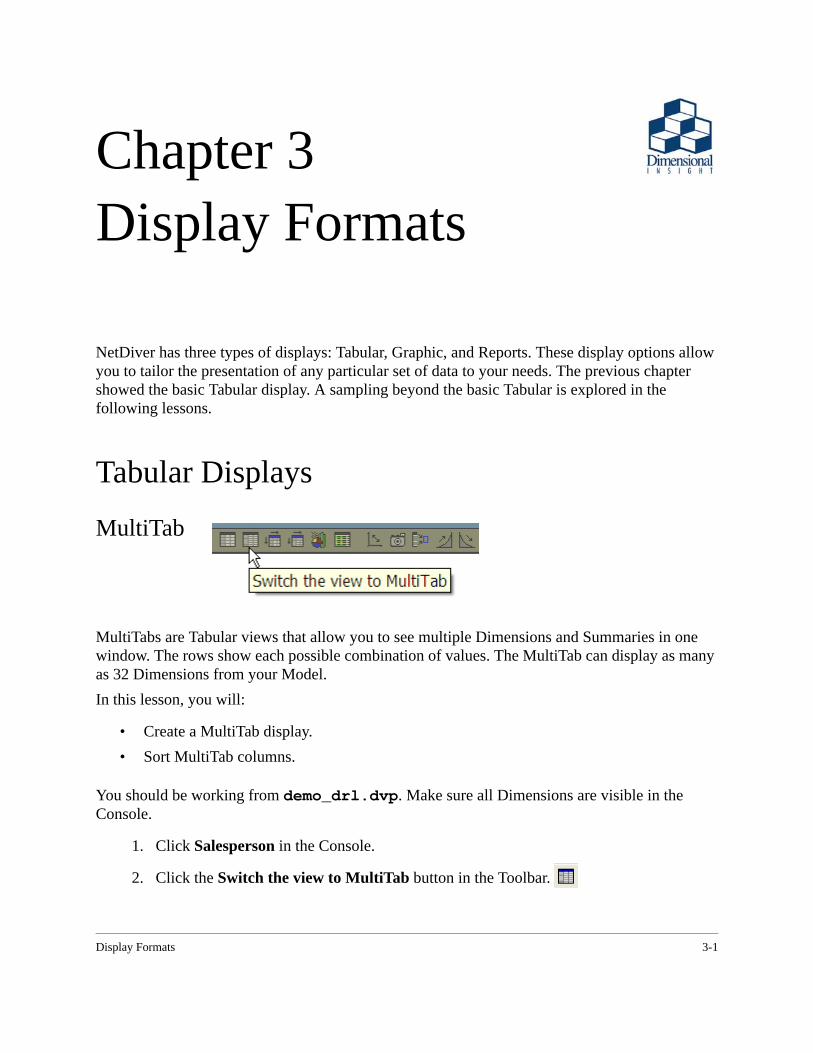
MultiTab 3
MultiTabs are Tabular views that allow you to see multiple Dimensions and Summaries in one window. The rows show each possible combination of values. The MultiTab can display as many as 32 Dimensions from your Model.In this lesson, you will:
• Create a MultiTab display.• Sort MultiTab columns.
You should be working from demo_drl.dvp. Make sure all Dimensions are visible in the Console.
1. Click Salesperson in the Console.
2. Click the Switch the view to MultiTab button in the Toolbar.
Display Formats 3-1
Tabular Displays
NETDIVER TUTORIAL
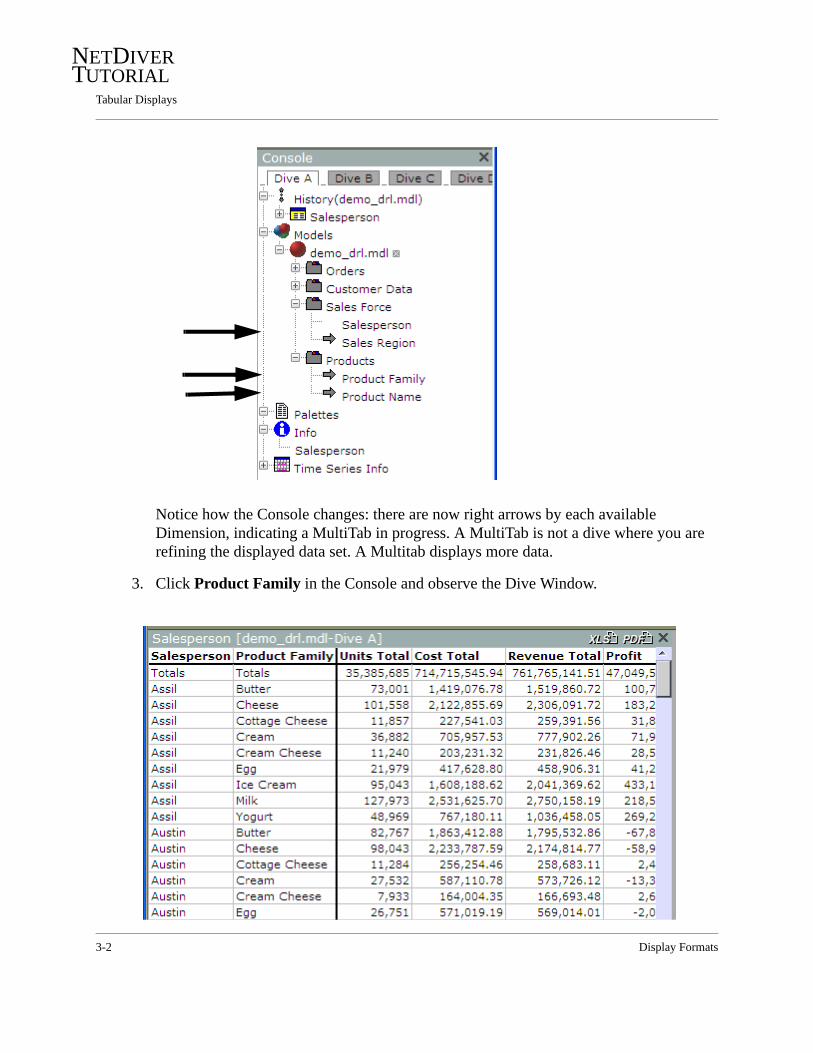
Notice how the Console changes: there are now right arrows by each available Dimension, indicating a MultiTab in progress. A MultiTab is not a dive where you are refining the displayed data set. A Multitab displays more data.
3. Click Product Family in the Console and observe the Dive Window.
3-2 Display Formats
Tabular Displays
NETDIVER TUTORIAL
Scroll the Tabular and notice that all valid combinations of Product Family data are now listed for each Salesperson.
4. Click Product Name in the Console.
Now the various valid Product Names are shown for each Product Family.
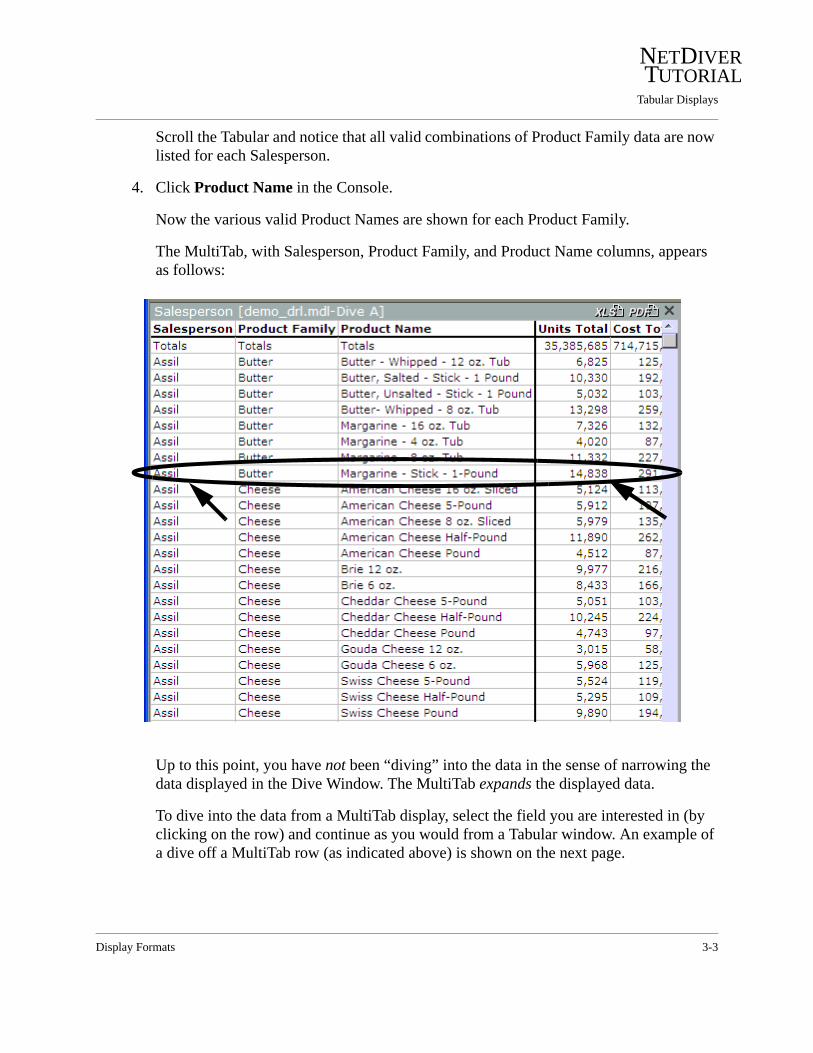
The MultiTab, with Salesperson, Product Family, and Product Name columns, appears as follows:
Up to this point, you have not been “diving” into the data in the sense of narrowing the data displayed in the Dive Window. The MultiTab expands the displayed data.
To dive into the data from a MultiTab display, select the field you are interested in (by clicking on the row) and continue as you would from a Tabular window. An example of a dive off a MultiTab row (as indicated above) is shown on the next page.
Display Formats 3-3

Tabular Displays
NETDIVER TUTORIAL
A dive on Customer for the highlighted row (“Assil/Butter/Margarine - Stick - 1-Pound”) displays a basic Tabular showing Assil’s Customers of one pound margarine.
5. Close the Dive Windows.
3-4 Display Formats

Tabular Displays
NETDIVER TUTORIAL
CrossTab 3
A CrossTab allows you to display two Dimensions at a time. One Dimension is shown vertically and one is shown horizontally for a single Summary data element, creating cells. The CrossTab display shows all possible combinations, even those not valid (empty cells).In this lesson, you will:
• Create a CrossTab display. • Dive off the CrossTab window.
You should be working from demo_drl.dvp. Close any open Dive Windows. Make sure the Categories are open in the Console.
1. Click Product Family in the Console. Product Family is the vertical Dimension.
2. Click the Switch the view to CrossTab button in the Toolbar.
3. The CrossTab Inputs dialog is displayed on the screen:
4. Select Quarter in the Horizontal Dimension pulldown.
5. Select Revenue Total in the Column pulldown.
6. Click OK.
Display Formats 3-5
Tabular Displays
NETDIVER TUTORIAL
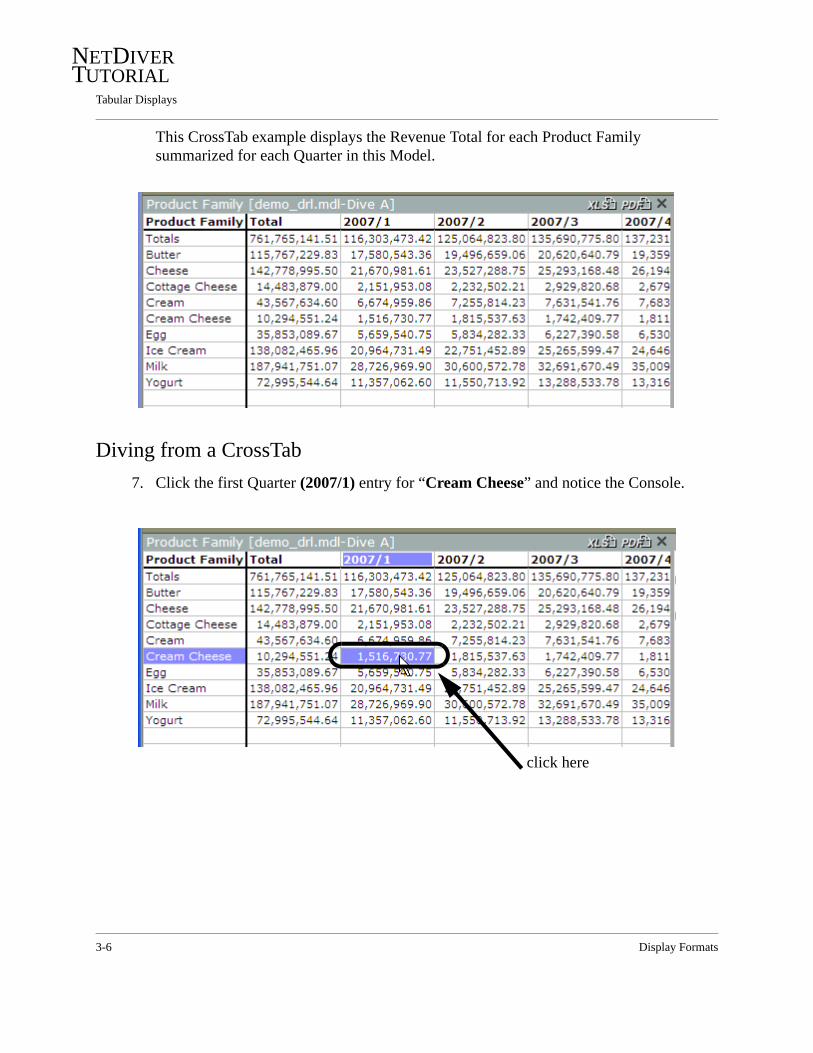
This CrossTab example displays the Revenue Total for each Product Family summarized for each Quarter in this Model.
Diving from a CrossTab 37. Click the first Quarter (2007/1) entry for “Cream Cheese” and notice the Console.
click here
3-6 Display Formats

Tabular Displays
NETDIVER TUTORIAL
8. Dive on Customer Name by clicking on it in the Console. Diving off a CrossTab cell, like the one selected in the last step, results in a basic Tabular display. The results are on the next page. Compare the Revenue Total numbers in the Dive Windows so you can see that the dive reflects the cell selected.
Display Formats 3-7

Tabular Displays
NETDIVER TUTORIAL
This Tabular shows the Customers who purchased Cream Cheese in the first quarter.
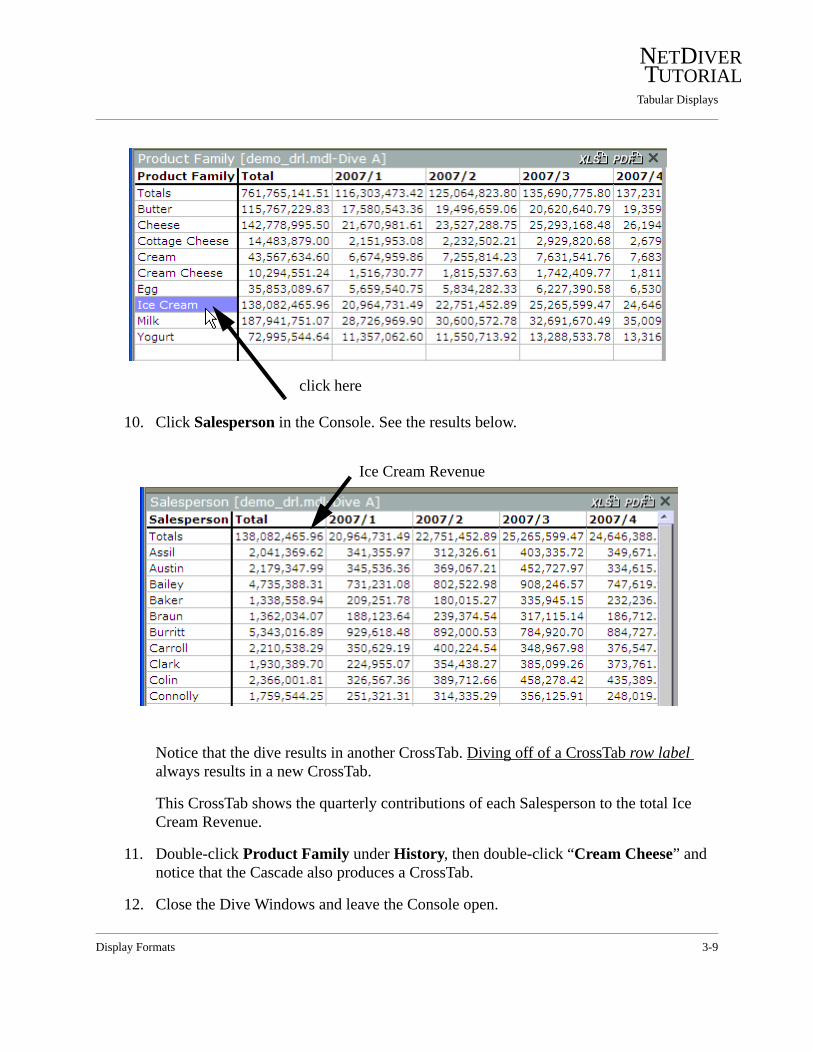
9. Close the Customer Name Dive Window and click “Ice Cream” under Product Family to select the row. This is selecting a row by the label, as opposed to selecting a number (cell) as was done in step 7.
basic Tabular
3-8 Display Formats
Tabular Displays
NETDIVER TUTORIAL
10. Click Salesperson in the Console. See the results below.
Notice that the dive results in another CrossTab. Diving off of a CrossTab row label always results in a new CrossTab.
This CrossTab shows the quarterly contributions of each Salesperson to the total Ice Cream Revenue.
11. Double-click Product Family under History, then double-click “Cream Cheese” and notice that the Cascade also produces a CrossTab.
12. Close the Dive Windows and leave the Console open.
click here
Ice Cream Revenue
Display Formats 3-9

Tabular Displays
NETDIVER TUTORIAL
MultiCrossTab 3
A MultiCrossTab combines two Dimensions, displaying one vertically and one horizontally, with the values of more than one Summary element. Each Summary element is displayed as multiple columns, labeled for each horizontal Dimension value. In this lesson, you will:
• Create a MultiCrossTab display.• Examine DimCounts.
You should be working from demo_drl.dvp. Close any open Dive Windows.
1. Click Product Family in the Console.
2. Click the Switch the view to MultiCrossTab button in the Toolbar.
A MultiCrossTab Inputs dialog is displayed on the screen:
3. Select YearMo in the Horizontal Dimension pulldown.
4. In the Columns list, select Units Total and Revenue Total. That is, click one, then hold down the Ctrl key and click the other one.
5. Click the OK button. The results are shown on the next page.
3-10 Display Formats

Tabular Displays
NETDIVER TUTORIAL
Below is the Product Family MultiCrossTab, displaying Units Total and Revenue Total by Year and Month.
Clickon the horizontal scroll bar located at the bottom of the display to show additional columns.
Diving from a MultiCrossTab 36. With the Console showing, single-click the cell within the MultiCrossTab representing
the January 2007 Revenue Total for Cheese. Notice the Console down arrows that let you dive deeper.
click here
Display Formats 3-11
Tabular Displays
NETDIVER TUTORIAL
7. Dive by clicking on Customer Name in the Console.
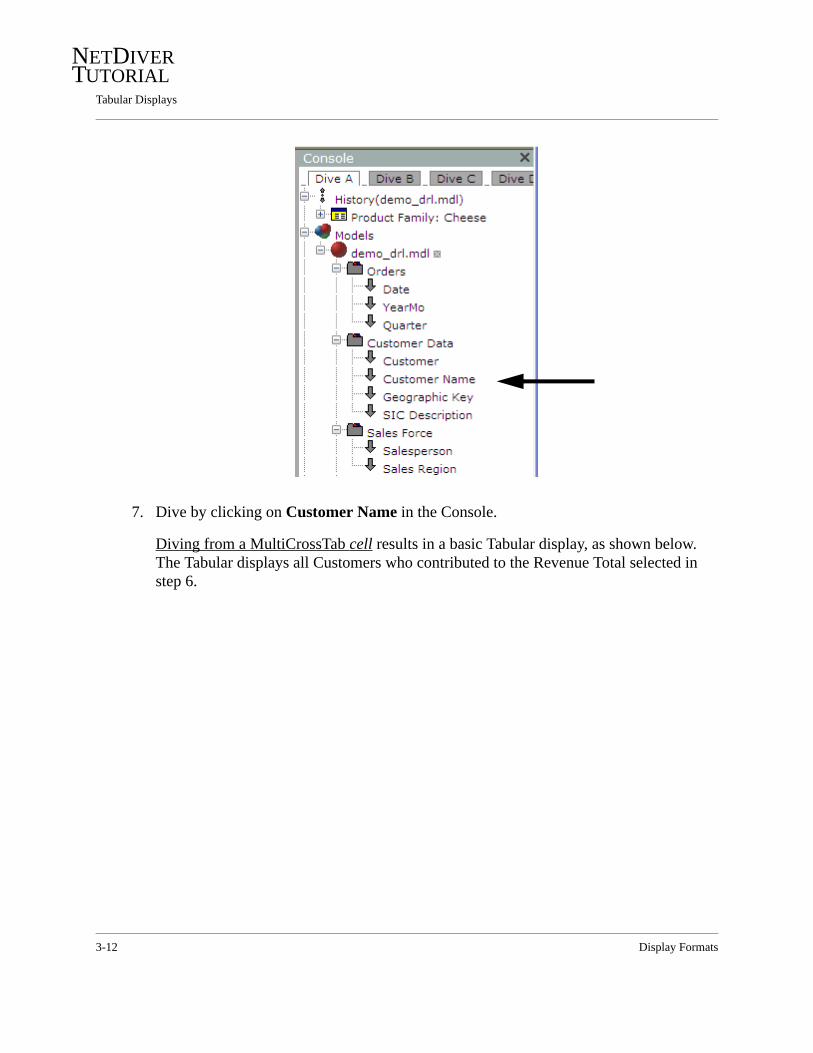
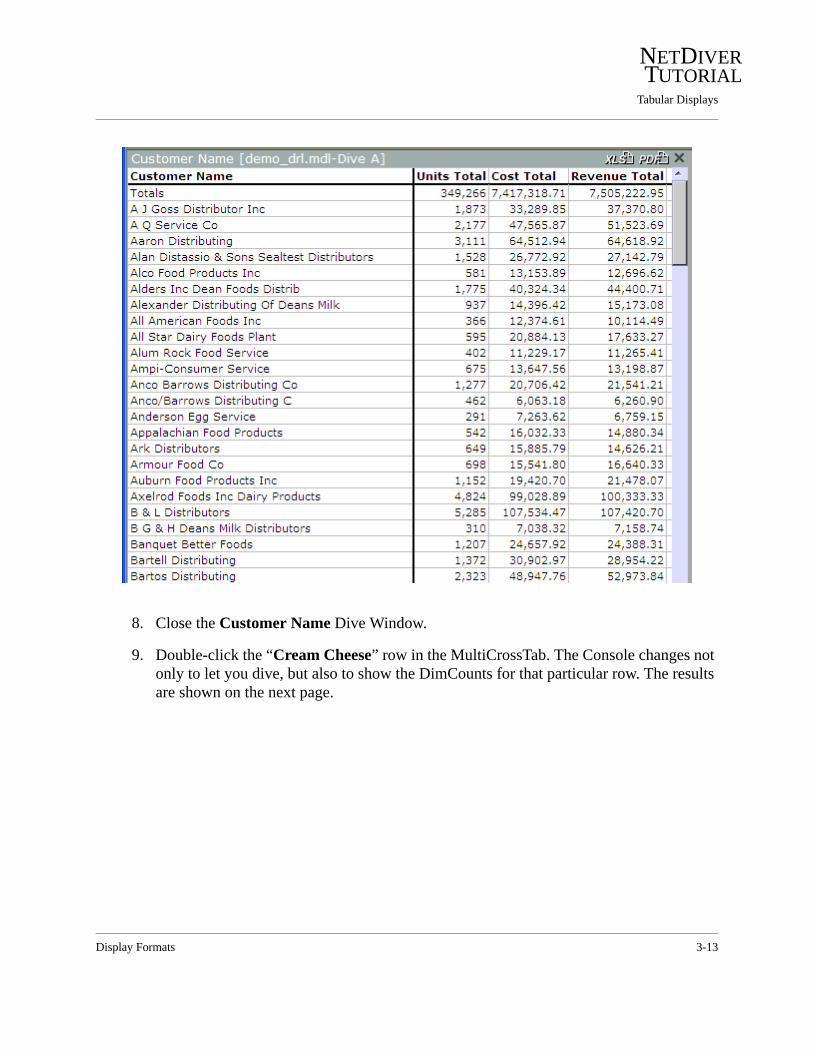
Diving from a MultiCrossTab cell results in a basic Tabular display, as shown below. The Tabular displays all Customers who contributed to the Revenue Total selected in step 6.
3-12 Display Formats
Tabular Displays
NETDIVER TUTORIAL
8. Close the Customer Name Dive Window.
9. Double-click the “Cream Cheese” row in the MultiCrossTab. The Console changes not only to let you dive, but also to show the DimCounts for that particular row. The results are shown on the next page.
Display Formats 3-13

Tabular Displays
NETDIVER TUTORIAL
Selecting a row label:
double-click here
DimCounts
3-14 Display Formats

Tabular Displays
NETDIVER TUTORIAL
10. Dive on SIC Description by clicking on it in the Console. The result of diving off a MultiCrossTab row label is another MultiCrossTab, as shown below.
11. Close the SIC Description Dive Window.
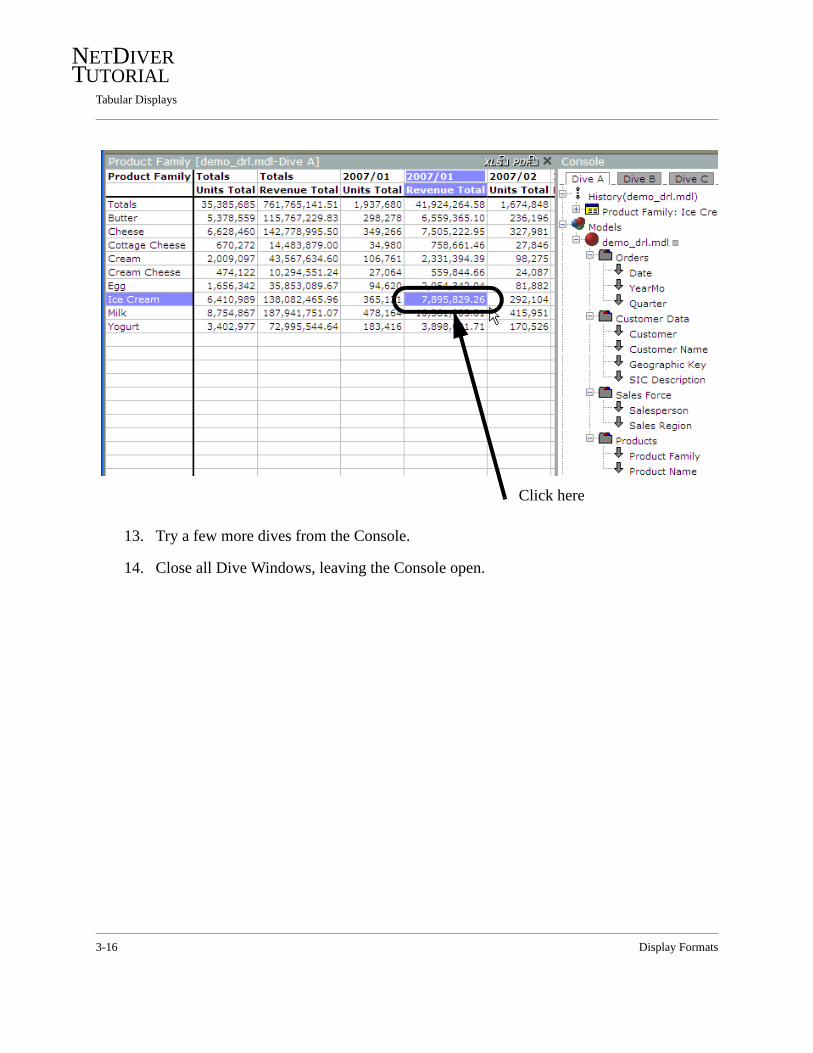
12. In the Product Family Dive Window, click the cell for the January 2007 Revenue Total for Ice Cream and observe the results. See the next page.
Display Formats 3-15
Tabular Displays
NETDIVER TUTORIAL
13. Try a few more dives from the Console.
14. Close all Dive Windows, leaving the Console open.
Click here
3-16 Display Formats
Graphic Displays
NETDIVER TUTORIAL
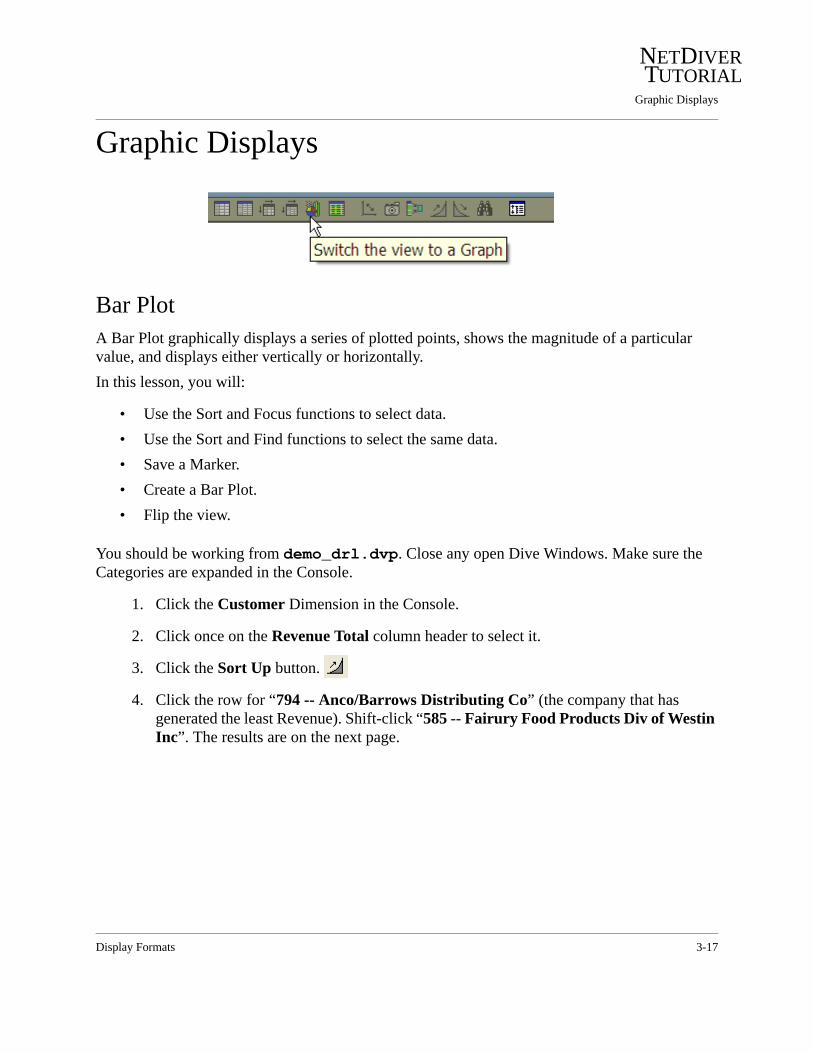
Graphic Displays 3
Bar Plot 3A Bar Plot graphically displays a series of plotted points, shows the magnitude of a particular value, and displays either vertically or horizontally. In this lesson, you will:
• Use the Sort and Focus functions to select data.• Use the Sort and Find functions to select the same data.• Save a Marker.• Create a Bar Plot.• Flip the view.
You should be working from demo_drl.dvp. Close any open Dive Windows. Make sure the Categories are expanded in the Console.
1. Click the Customer Dimension in the Console.
2. Click once on the Revenue Total column header to select it.
3. Click the Sort Up button.
4. Click the row for “794 -- Anco/Barrows Distributing Co” (the company that has generated the least Revenue). Shift-click “585 -- Fairury Food Products Div of Westin Inc”. The results are on the next page.
Display Formats 3-17

Graphic Displays
NETDIVER TUTORIAL
5. Click the Focus button in the Toolbar.
You have now narrowed the items in the Dive Window to the 10 Customers with the least amount of Revenue.
This dive can also be performed using Find rather than Focus.
6. Close the Dive Window.
7. Dive on Customer in the Console.
...
3-18 Display Formats

Graphic Displays
NETDIVER TUTORIAL
8. Click the Revenue Total column header to select it.
9. Click the Sort Down button.
10. Click the Find button. The Find Numbers in Revenue Total dialog is displayed.
11. Under Find by, click Last and enter 10 in the text box. Action on Find should be Focus.
12. Click the Find All button and observe the results.
Display Formats 3-19

Graphic Displays
NETDIVER TUTORIAL
The items are ordered differently, since they were sorted differently, but they are the same: the l0 lowest revenue-generating Customers. The key difference in the dive sequence is that use of the Sort and Find functions allows a Marker to be saved that will work for updated data. Use of Sort and Focus on the other hand, relies on explicit selection of data items (a “hard select”), making any Marker inadequate for long term use, since data changes over time.
13. Click the Save Marker button. In the dialog that displays, choose a location to store the Marker file.
14. Save the Marker as lowcustomers.mrk. You will re-open this Marker in the Stack Plot lesson.
3-20 Display Formats

Graphic Displays
NETDIVER TUTORIAL
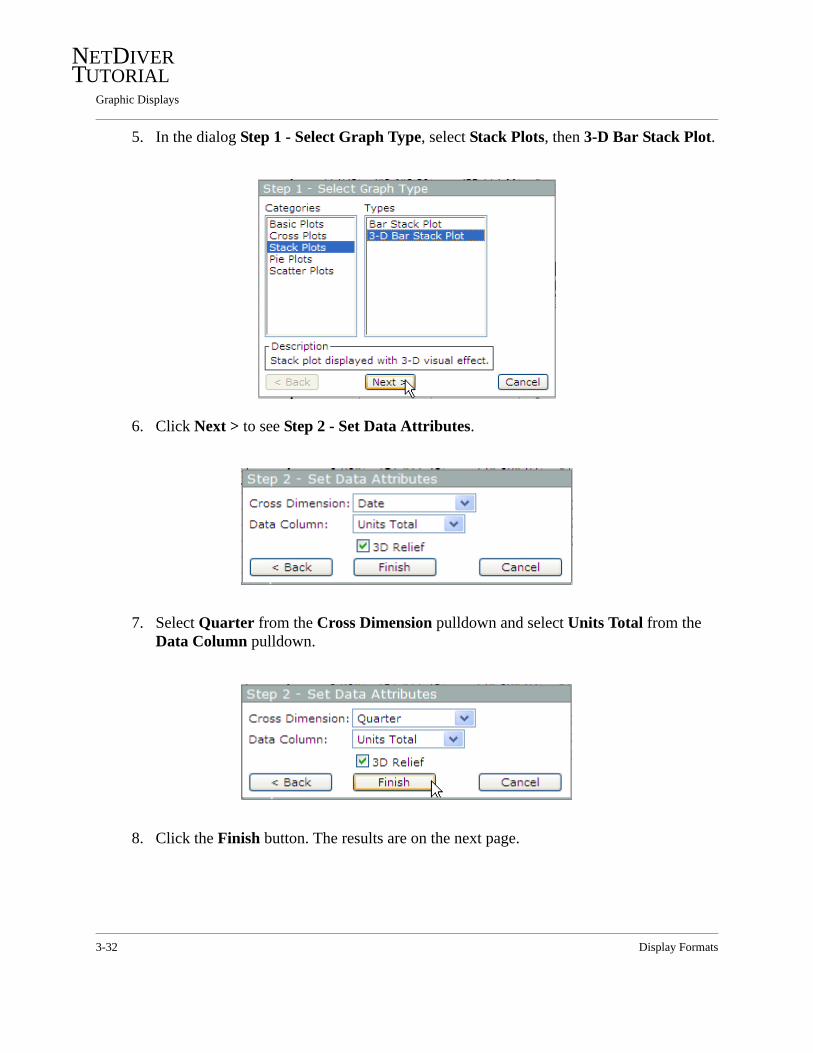
15. Click the Switch the view to a Graph button in the Toolbar. The Step 1 - Select Graph Type dialog is displayed.
16. The default selection, Basic Plots and Bar Plot is as desired, so click Next >.
Display Formats 3-21

Graphic Displays
NETDIVER TUTORIAL
17. In the Step 2 - Set Data Attributes dialog, the two items to be graphed are Cost and Revenue. If needed, select Cost Total from the pulldown list under Column Name and repeat for Revenue Total.
Any unwanted Columns can be eliminated by choosing the blank item on the pulldown list. Column 1 should be Cost Total. Column 2 should be Revenue Total.
The Plot Types available are Bar, Line, Point, Bar - Sum, Line - Sum, and Point - Sum.
18. Leave the defaults as is. Click the Finish button. A Bar Plot of the ten lowest revenue-generating companies is displayed.
You may prefer to display the Customer names as horizontal text.
3-22 Display Formats
Graphic Displays
NETDIVER TUTORIAL
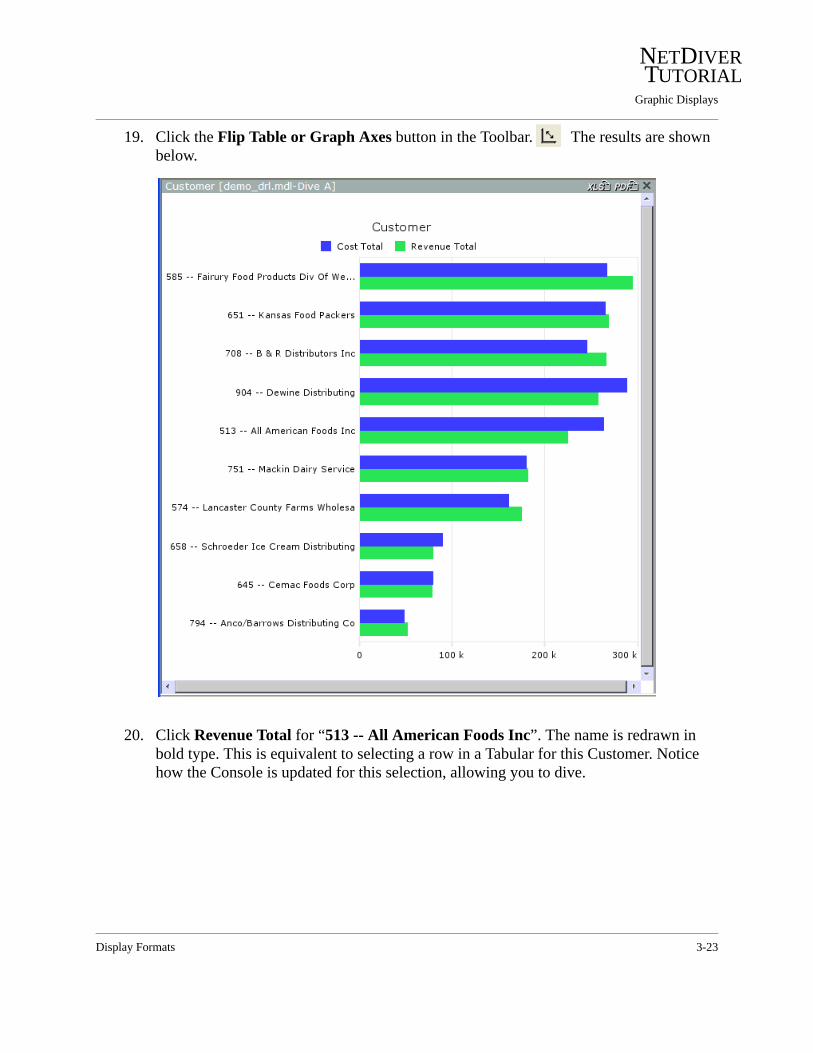
19. Click the Flip Table or Graph Axes button in the Toolbar. The results are shown below.
20. Click Revenue Total for “513 -- All American Foods Inc”. The name is redrawn in bold type. This is equivalent to selecting a row in a Tabular for this Customer. Notice how the Console is updated for this selection, allowing you to dive.
Display Formats 3-23

Graphic Displays
NETDIVER TUTORIAL
In the Console’s History section, “513 -- All American Foods Inc” is the selected Customer. In the Info section, the company’s street address is listed. You may need to expand the History and/or Info portions of the Console if they are not open. The down arrows indicate that diving can proceed from this point. Diving from a Bar Plot displays another Bar Plot.
21. Close all Dive Windows used in this lesson.
3-24 Display Formats

Graphic Displays
NETDIVER TUTORIAL
Cross Plot 3A Cross Plot lets you plot up to 16 values of a given Dimension for one Summary, against all values of another Dimension. Cross Plots can be drawn as bars, lines, or points.In this lesson you will:
• Dive on a Dimension to plot.• Create a 3 dimensional line Cross Plot.• Adjust the selections for the Cross Plot.
You should be working from demo_drl.dvp. Close any open Dive Windows and make sure all Categories are expanded in the Console.
1. Click Sales Region.
2. Click the Switch the View to a Graph button. The dialog Step 1 - Select Graph Type is displayed.
Display Formats 3-25
Graphic Displays
NETDIVER TUTORIAL
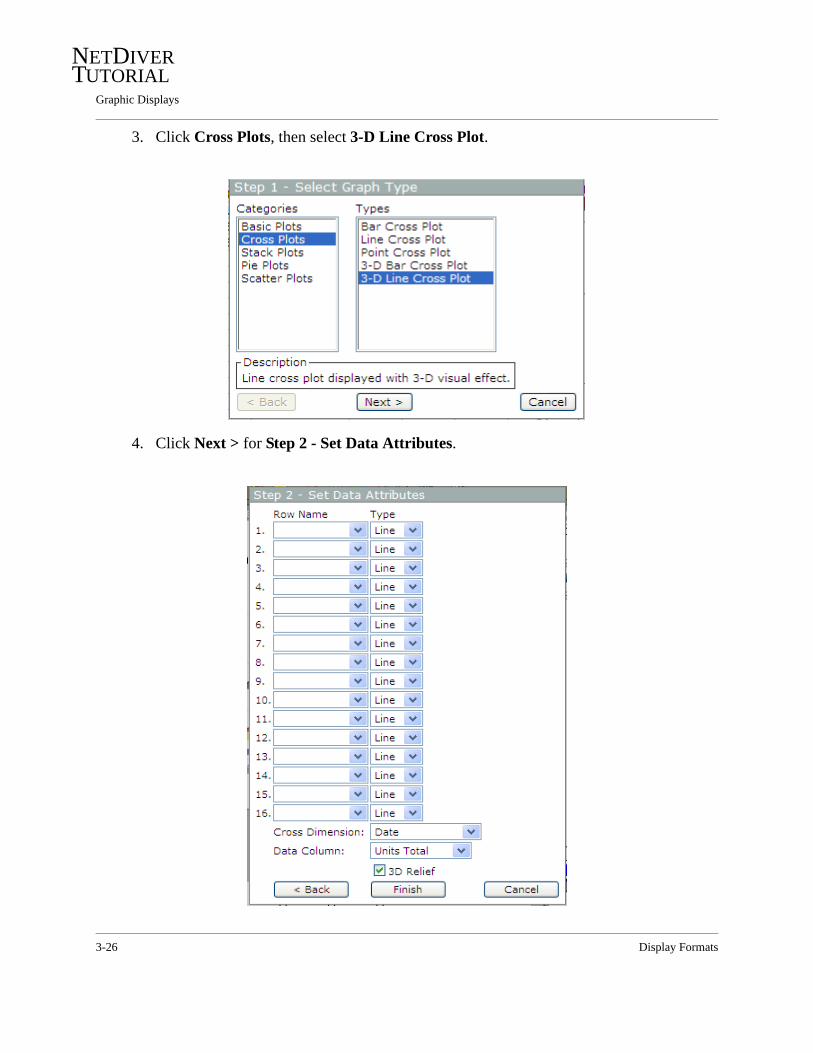
3. Click Cross Plots, then select 3-D Line Cross Plot.
4. Click Next > for Step 2 - Set Data Attributes.
3-26 Display Formats

Graphic Displays
NETDIVER TUTORIAL
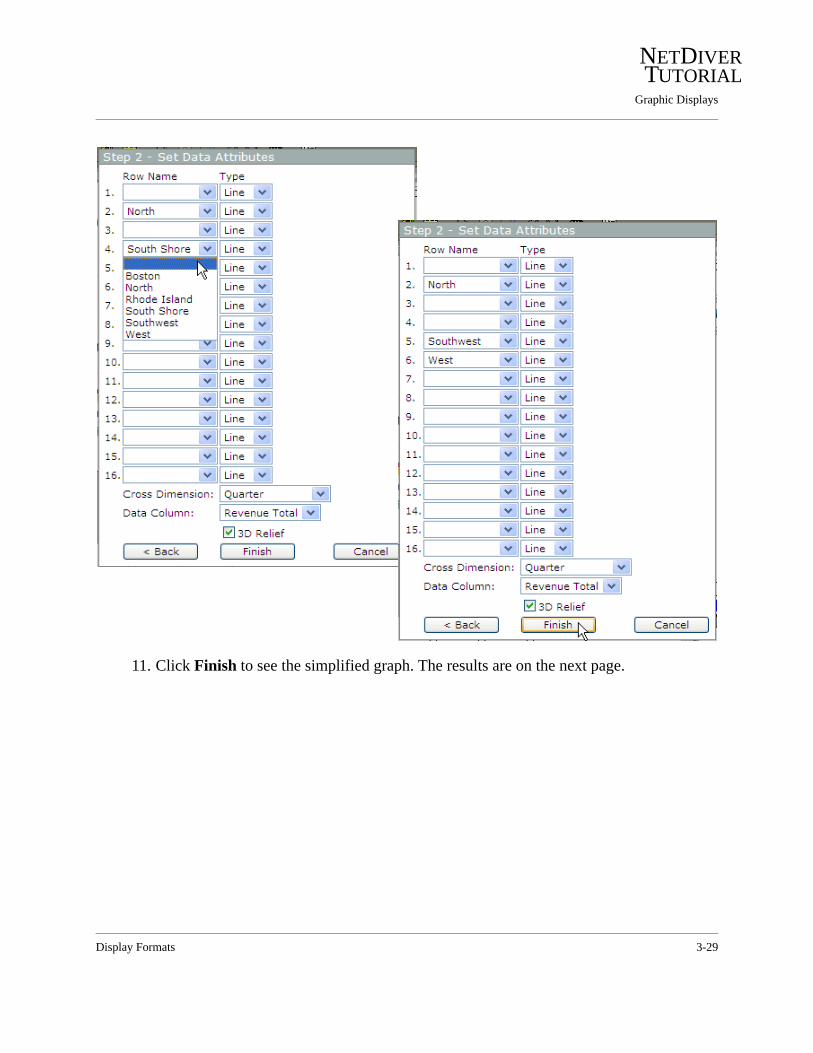
5. Under Row Name, select each of the 6 Sales Region names.
6. For the Cross Dimension, select Quarter.
7. The Data Column should be Revenue Total.
8. Click Finish to draw the Cross Plot. It is shown on the next page.
Display Formats 3-27

Graphic Displays
NETDIVER TUTORIAL
The Sales Region 3-D Line Cross Plot of Revenue by Quarter appears as follows:
9. Additional adjustments can be made without restarting the dive. Click the Switch the View to a CrossPlot button again.
10. Deselect Boston, Rhode Island, and South Shore by using the pulldown and selecting a blank.
3-28 Display Formats
Graphic Displays
NETDIVER TUTORIAL
11. Click Finish to see the simplified graph. The results are on the next page.
Display Formats 3-29
Graphic Displays
NETDIVER TUTORIAL
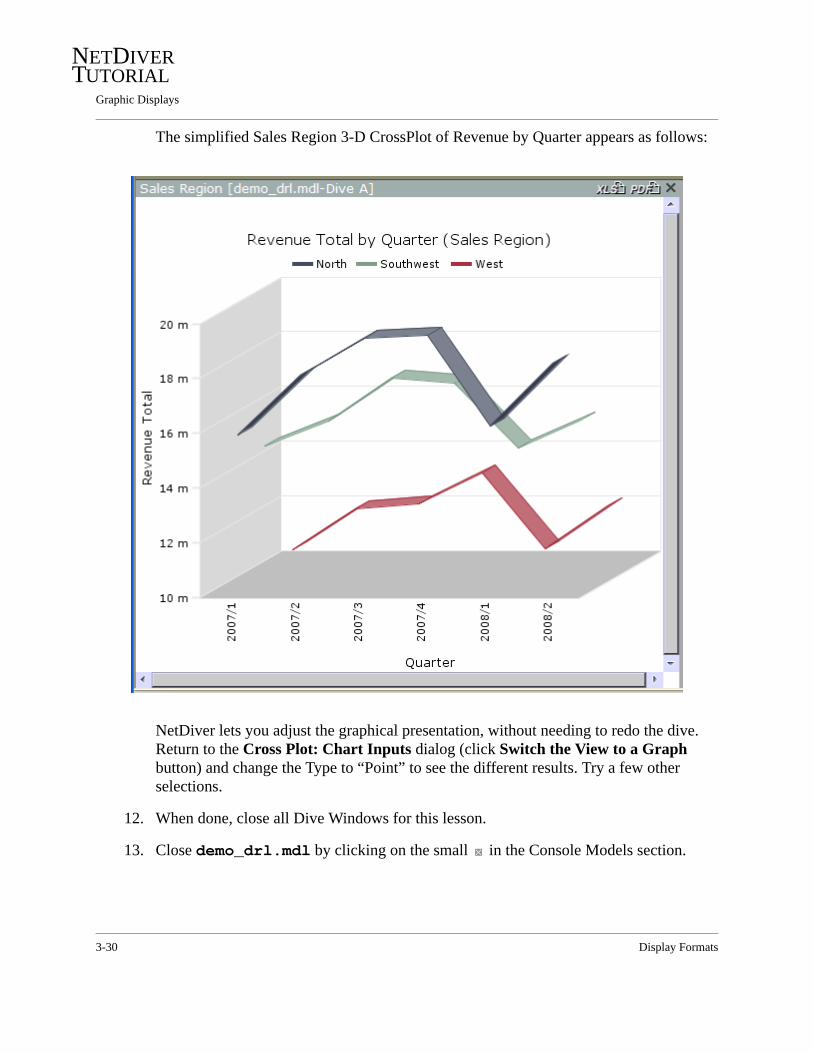
The simplified Sales Region 3-D CrossPlot of Revenue by Quarter appears as follows:
NetDiver lets you adjust the graphical presentation, without needing to redo the dive. Return to the Cross Plot: Chart Inputs dialog (click Switch the View to a Graph button) and change the Type to “Point” to see the different results. Try a few other selections.
12. When done, close all Dive Windows for this lesson.
13. Close demo_drl.mdl by clicking on the small in the Console Models section.
3-30 Display Formats

Graphic Displays
NETDIVER TUTORIAL
Stack Plot 3A Stack Plot is used to demonstrate a measure of the portions that make up the whole of a particular value within a bar. Like Bar Plots, Stack Plots display a series of plotted bars on a quantitative axis. Stack Plots display one Summary element at a time. In this lesson, you will:
• Open a previously saved Marker.• Create a Stack Plot.• Perform a dive off the graph.
1. Start a new NetDiver session by making sure there are no open Models.
2. If needed, click the Open Files button.
3. Navigate as needed to open the previously saved Marker lowcustomers.mrk.
4. Click the Switch the view to a Graph button in the Toolbar.
Display Formats 3-31
Graphic Displays
NETDIVER TUTORIAL
5. In the dialog Step 1 - Select Graph Type, select Stack Plots, then 3-D Bar Stack Plot.
6. Click Next > to see Step 2 - Set Data Attributes.
7. Select Quarter from the Cross Dimension pulldown and select Units Total from the Data Column pulldown.
8. Click the Finish button. The results are on the next page.
3-32 Display Formats

Graphic Displays
NETDIVER TUTORIAL
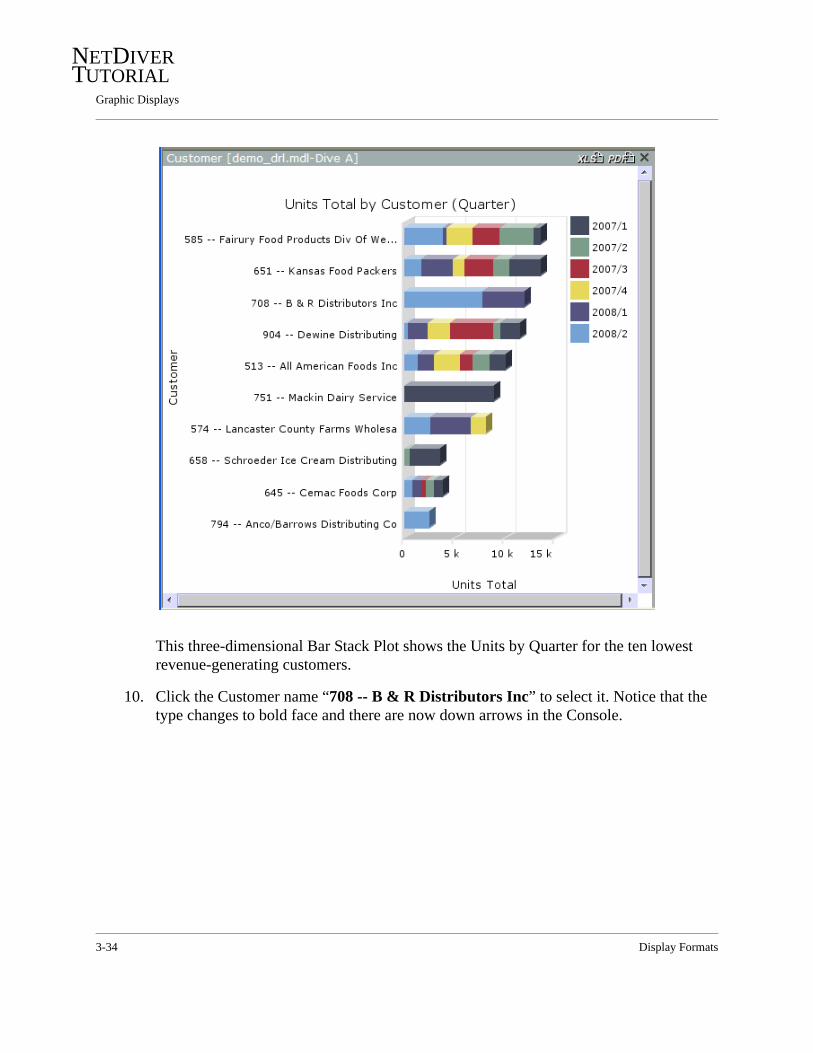
The Stack Plot is displayed:
9. If desired, click the Flip Table or Graph Axes button in the Toolbar.
Display Formats 3-33
Graphic Displays
NETDIVER TUTORIAL
This three-dimensional Bar Stack Plot shows the Units by Quarter for the ten lowest revenue-generating customers.
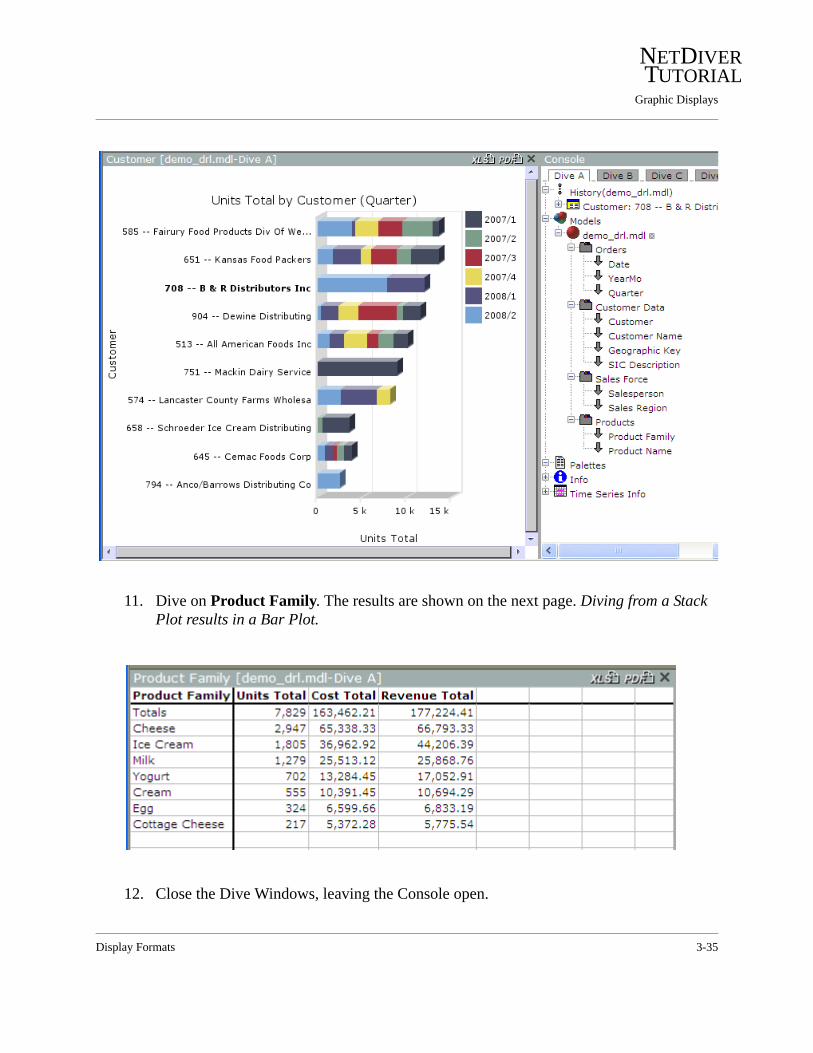
10. Click the Customer name “708 -- B & R Distributors Inc” to select it. Notice that the type changes to bold face and there are now down arrows in the Console.
3-34 Display Formats
Graphic Displays
NETDIVER TUTORIAL
11. Dive on Product Family. The results are shown on the next page. Diving from a Stack Plot results in a Bar Plot.
12. Close the Dive Windows, leaving the Console open.
Display Formats 3-35

Graphic Displays
NETDIVER TUTORIAL
Scatter Plot 3If you are looking for a value in relation to other values, a Scatter Plot is ideal. It displays all points along a scatter line, which allows you to quickly view relationships between points, observe trends and spot anything unusual.In this lesson, you will:
• Create a Scatter Plot.• Select data to continue the dive.
You should be working from demo_drl.dvp. Make sure the Categories are expanded in the Console.
1. Click Product Family in the Console.
2. Click the Switch the view to a Graph button in the Toolbar. The dialog Step 1 - Select Graph Type is displayed.
3. Select Scatter Plots and Scatter Plot (Point and Line).
3-36 Display Formats

Graphic Displays
NETDIVER TUTORIAL
4. Click Next > to see the dialog Step 2 - Set Data Attributes.
5. Select Cost Total from the X-Axis Column pulldown.
6. Select Revenue Total from the Y-Axis Column pulldown.
.
7. Click the Finish button. The resulting plot is on the next page.
Display Formats 3-37
Graphic Displays
NETDIVER TUTORIAL
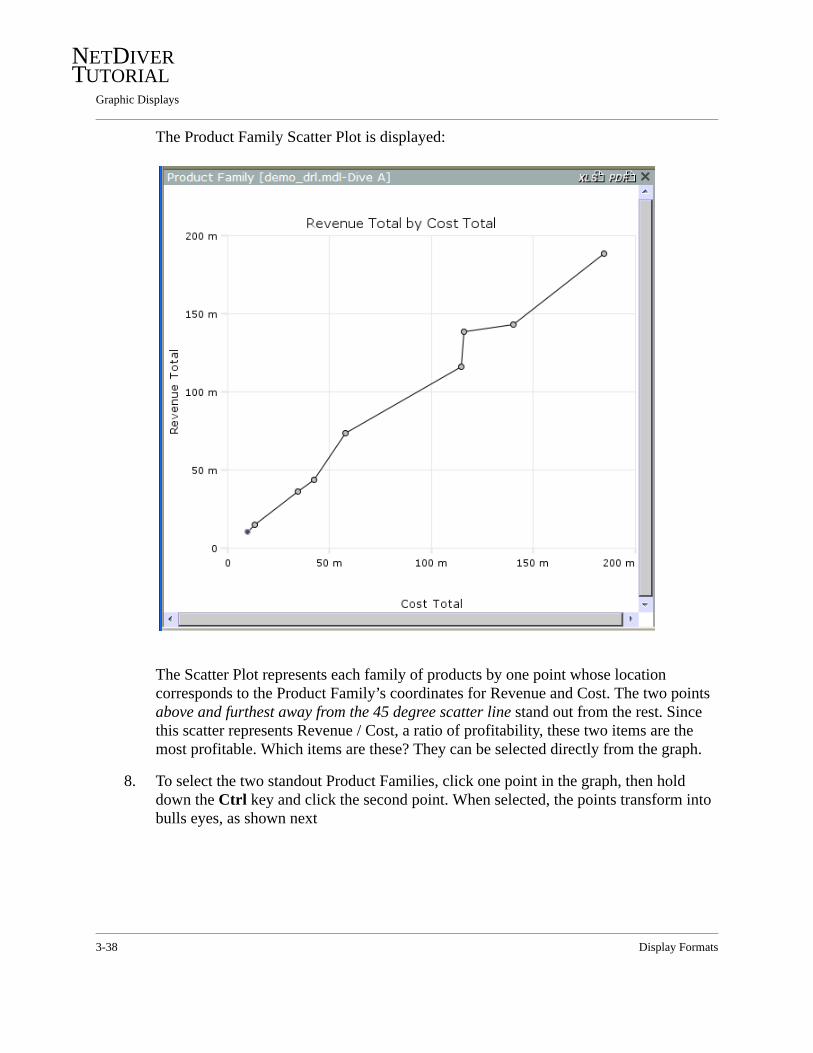
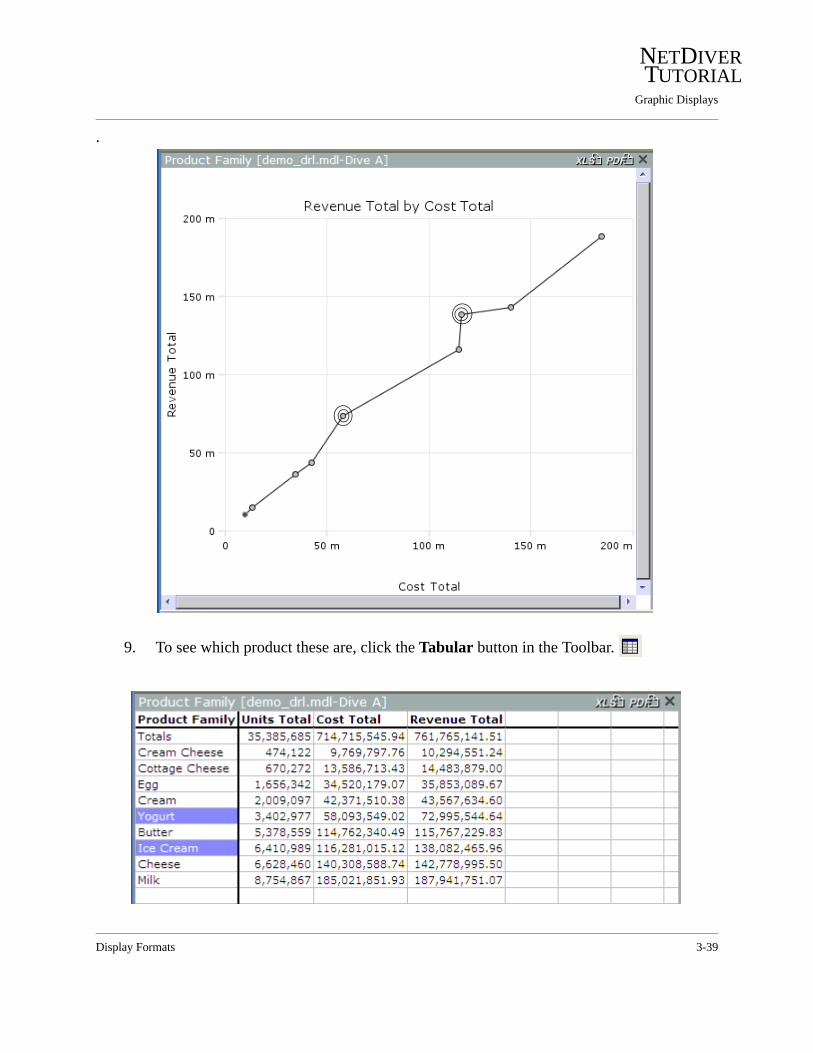
The Product Family Scatter Plot is displayed:
The Scatter Plot represents each family of products by one point whose location corresponds to the Product Family’s coordinates for Revenue and Cost. The two points above and furthest away from the 45 degree scatter line stand out from the rest. Since this scatter represents Revenue / Cost, a ratio of profitability, these two items are the most profitable. Which items are these? They can be selected directly from the graph.
8. To select the two standout Product Families, click one point in the graph, then hold down the Ctrl key and click the second point. When selected, the points transform into bulls eyes, as shown next
3-38 Display Formats
Graphic Displays
NETDIVER TUTORIAL
.
9. To see which product these are, click the Tabular button in the Toolbar.
Display Formats 3-39

Graphic Displays
NETDIVER TUTORIAL
10. The Tabular display reveals the selected scatter points to be Yogurt and Ice Cream. To focus on the selected items and remove items that are not selected, click the Focus button in the Toolbar.
11. Close all Dive Windows, leaving the Console open.
3-40 Display Formats

Graphic Displays
NETDIVER TUTORIAL
Pie Plot 3A Pie Plot (or Pie Chart) is useful when there is a limited number of divisions of the whole. For example, it can help you compare the percentage of Revenue generated by six different Sales Regions. In this lesson, you will:
• Create a Pie Plot.• Select a wedge and dive again.
You should be working from demo_drl.dvp. Make sure the Dimensions are visible in the Console.
1. Click Sales Region in the Console.
2. Click the Switch the view to a Graph button in the Toolbar. The dialog Step 1 - Select Graph Type appears.
3. Select Pie Plots and 3-D Pie Plot, then click Next >. The dialog Step 2 - Set Data Attributes is displayed.
Display Formats 3-41

Graphic Displays
NETDIVER TUTORIAL
4. Select Revenue Total from the Summary Column pulldown.
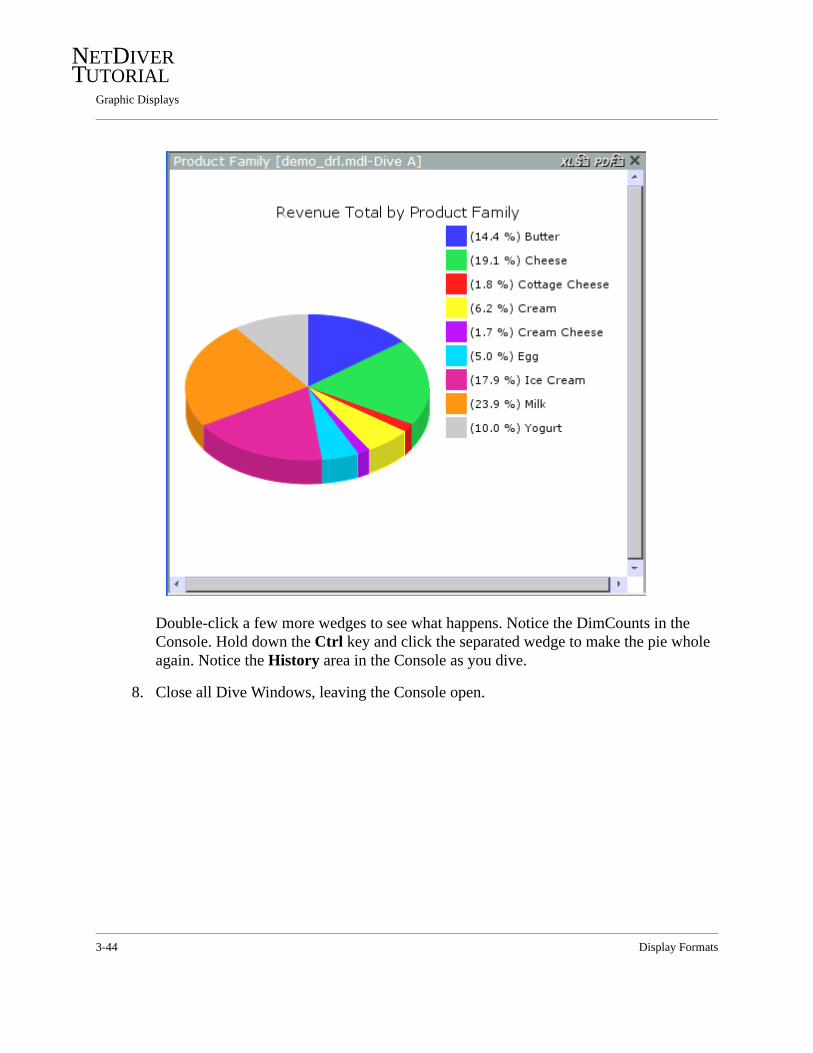
5. Click Finish to create the Pie Plot shown below.
3-42 Display Formats

Graphic Displays
NETDIVER TUTORIAL
6. Single-click any wedge of the pie. Notice that the name and value for the wedge now appear in bold type in the Legend area and there are down arrows in the Console. In order to see DimCounts in the Console, double-click a wedge.
7. With the North Sales Region wedge selected, click Product Family in the Console. The result is another Pie Plot.
Display Formats 3-43
Graphic Displays
NETDIVER TUTORIAL
Double-click a few more wedges to see what happens. Notice the DimCounts in the Console. Hold down the Ctrl key and click the separated wedge to make the pie whole again. Notice the History area in the Console as you dive.
8. Close all Dive Windows, leaving the Console open.
3-44 Display Formats

QuickViews
NETDIVER TUTORIAL
QuickViews 3QuickViews make diving easier by providing instant access to multiple Dimensions and values, on one screen. Below is an example of a Pulldown QuickView, which functions like a pulldown menu. By clicking on the pulldown next to the QuickView’s name, (Sales Region), a value such as “South Shore” can be selected as the Sales Region of interest. Once selected, the Salesperson Dive Window Cascades, displaying the Salespersons in the South Shore region only.For example, if the Sales Region QuickView pulldown appears as follows:
Click the pulldown and select “South Shore”:
Display Formats 3-45

QuickViews
NETDIVER TUTORIAL
Then the view Cascades to show only the Salespersons in the South Shore Sales Region:
In a situation where there are multiple QuickViews presented, you select each in turn and then click the Go button to Cascade the view. Two examples are shown below.
3-46 Display Formats

QuickViews
NETDIVER TUTORIAL
A QuickView can also be created as a PickList. Multple values can be selected similar to how one selects multiple rows in a DiveWindow.
Display Formats 3-47

NETDIVER TUTORIAL
Chapter 4
Reports 4A report in NetDiver is a dive in which the final window is transformed to a Report View. This is commonly done before saving a Marker to be used to distribute standard information to various people in the organization. The report can be used as a starting point for further diving. It can be printed as a hard copy or manipulated on-line as a .pdf or .xls file. Reports are created in NetDiver directly from a Tabular display, or from the Tabular underlying a graphic display. The user is presented with a Default Report dialog, with options corresponding to the current dive type.These lessons lead you step-by-step through the key reporting features of NetDiver. Some steps may not be explained in full detail in this chapter as they have already been covered in previous chapters.
Creating Reports 4
Basic Tabular Report 4Reports are an important part of information delivery. NetDiver provides many default reporting features, as well as some customization options.In this lesson you will:
• Create a report from a Tabular.• Specify a title.• Remove automatic page numbers.
You should be working from demo_drl.dvp. Make sure all Dimensions are visible in the Console.
1. Click Sales Region in the Console.
Reports 4-1

Creating Reports
NETDIVER TUTORIAL
2. Click the Switch the view to a Report button in the Toolbar.
The Default Report dialog is displayed on the screen. The options selected may vary slightly, depending on the type of Tabular being converted to a report.
3. In the Title text box, type “Sales Region Report”.
4. Click the radio button next to Top in the Totals area.
5. If appropriate, uncheck the box next to Page Numbers. This Report is small enough to only have one page, so page numbers are not needed.
4-2 Reports
Creating Reports
NETDIVER TUTORIAL
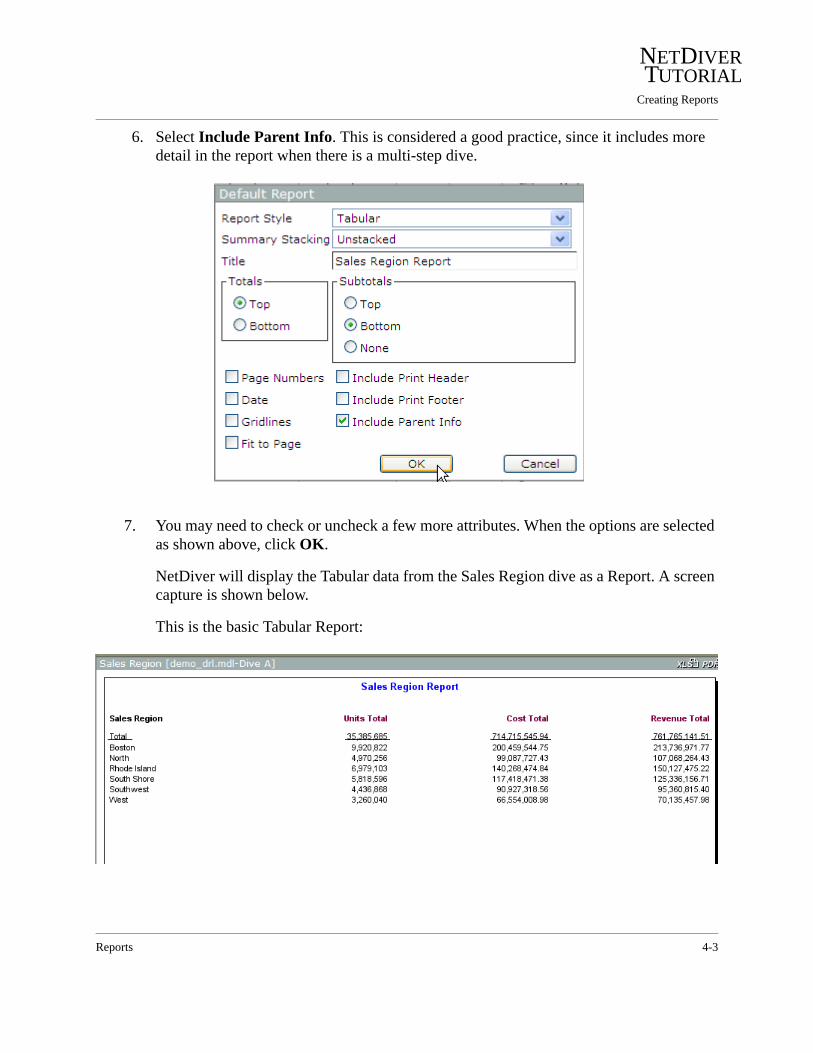
6. Select Include Parent Info. This is considered a good practice, since it includes more detail in the report when there is a multi-step dive.
7. You may need to check or uncheck a few more attributes. When the options are selected as shown above, click OK.
NetDiver will display the Tabular data from the Sales Region dive as a Report. A screen capture is shown below.
This is the basic Tabular Report:
Reports 4-3

Creating Reports
NETDIVER TUTORIAL
8. Click the Open as PDF button. A new browser window opens the report in Adobe Acrobat Reader.
9. Experiment with saving, e-mailing, or printing this one page report.
When you have multi-page Reports, Opening in PDF insures you can print the entire report, in the format shown in the NetDiver window.
10. Close all Dive Windows used in this lesson, except the Console.
4-4 Reports

Creating Reports
NETDIVER TUTORIAL
MultiTab Report 4A MultiTab Report is created from a MultiTabular display, which allows you to view all the Summaries for multiple Dimensions. The current dive and Tabular options control the choices in the Default Report dialog.In this lesson, you will:
• Create a report from a MultiTab.• Add a title and include the date.• Compare two report styles.
The Model demo_drl.dvp should still be open. Close any previous Dive Windows.
1. From the Console, dive on Sales Region.
2. Click the Switch the view to a MultiTab button , then click Product Family in the Console.
3. Click Product Name in the Console.
Reports 4-5

Creating Reports
NETDIVER TUTORIAL
4. Click the Switch the view to a Report button in the Toolbar.
5. Type “Regional Product Profile” in the Title text box.
6. Leave the Report Style as Tabular MultiTab and the other selections as shown in the figure above. Click OK.
Notice how repeated items in the Tabular are blanked out and how the scroll bar on the right indicates more data.
4-6 Reports

Creating Reports
NETDIVER TUTORIAL
7. Click the Report button again.
8. This time, from the Report Style pulldown, select the Indented Subtotal MultiTab.
9. Change the title to “Regional Product Detail”.
10. Check the box next to Page Numbers to select it.
11. Check the box next to Date to select it.
Reports 4-7

Creating Reports
NETDIVER TUTORIAL
12. Check the box next to Gridlines to select it.
13. Check the box next to Include Parent Info to select it.
14. Click OK.
NetDiver will display a slightly different Report. Notice that it now includes a subtotal for each Sales Region; for example Boston’s Units subtotal is 9,920,822.
15. Use the scroll bar to review the Report.
16. Click the Save Marker button and name the Marker Reg_Prod.mrk. Navigate to the appropriate location and click Save. The next time you want to see the Regional Product Detail Report, just open the Marker. If the Model is updated before you look at the Report again, the next time you open it, the Report will be displayed with the updated numbers.
4-8 Reports
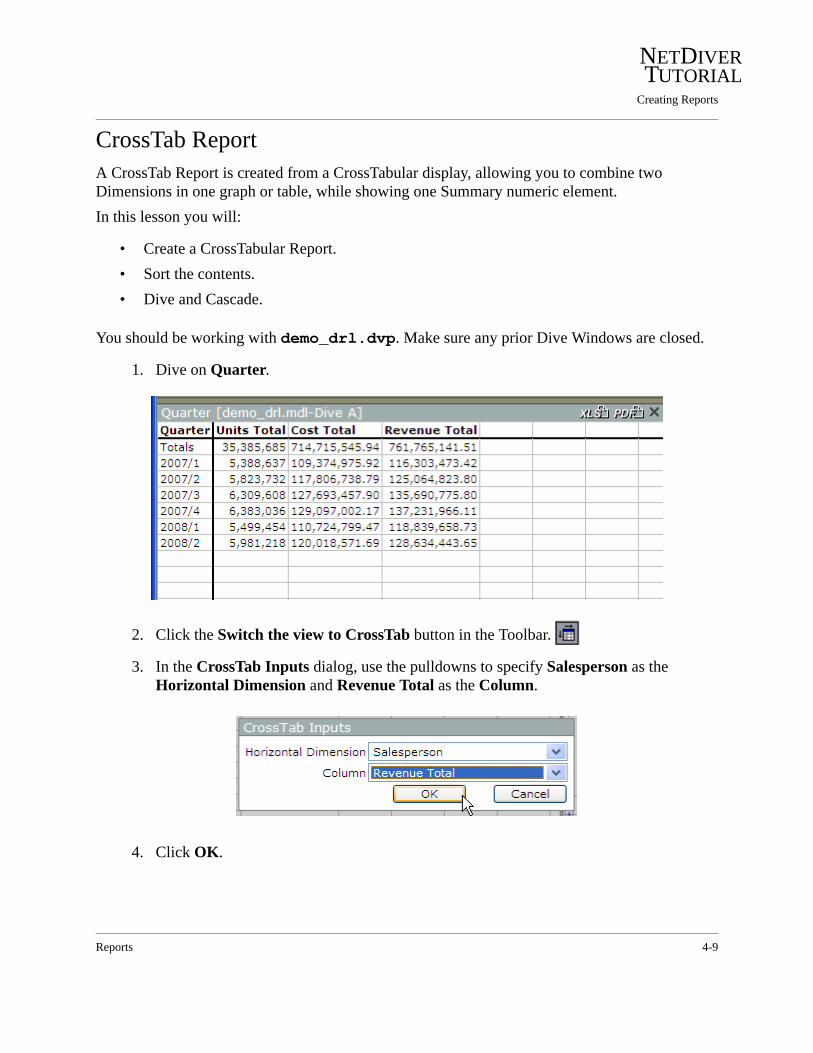
Creating Reports
NETDIVER TUTORIAL
CrossTab Report 4A CrossTab Report is created from a CrossTabular display, allowing you to combine two Dimensions in one graph or table, while showing one Summary numeric element.In this lesson you will:
• Create a CrossTabular Report.• Sort the contents.• Dive and Cascade.
You should be working with demo_drl.dvp. Make sure any prior Dive Windows are closed.
1. Dive on Quarter.
2. Click the Switch the view to CrossTab button in the Toolbar.
3. In the CrossTab Inputs dialog, use the pulldowns to specify Salesperson as the Horizontal Dimension and Revenue Total as the Column.
4. Click OK.
Reports 4-9
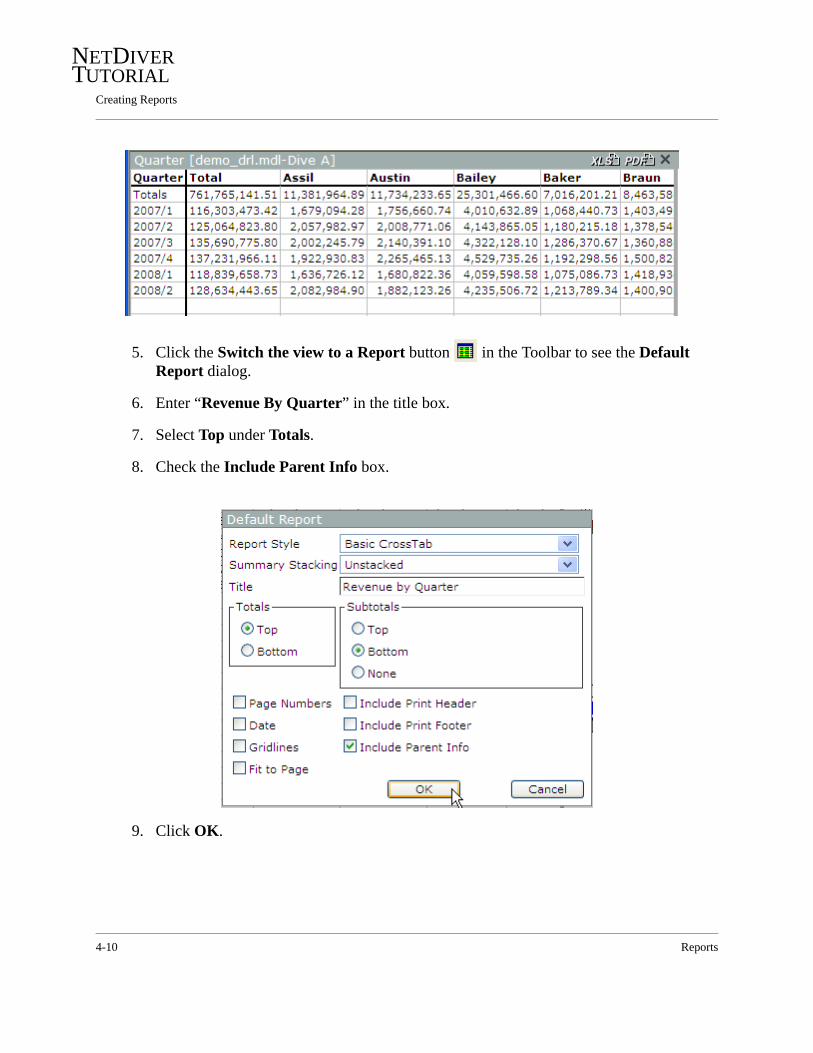
Creating Reports
NETDIVER TUTORIAL
5. Click the Switch the view to a Report button in the Toolbar to see the Default Report dialog.
6. Enter “Revenue By Quarter” in the title box.
7. Select Top under Totals.
8. Check the Include Parent Info box.
9. Click OK.
4-10 Reports

Creating Reports
NETDIVER TUTORIAL
10. Click “2008/2” in the first column of the report. Notice the Console is now ready for diving.
11. Dive on Product Family.
The resulting report shows the Product Families for the second quarter of 2008, sorted alphabetically.
Reports 4-11
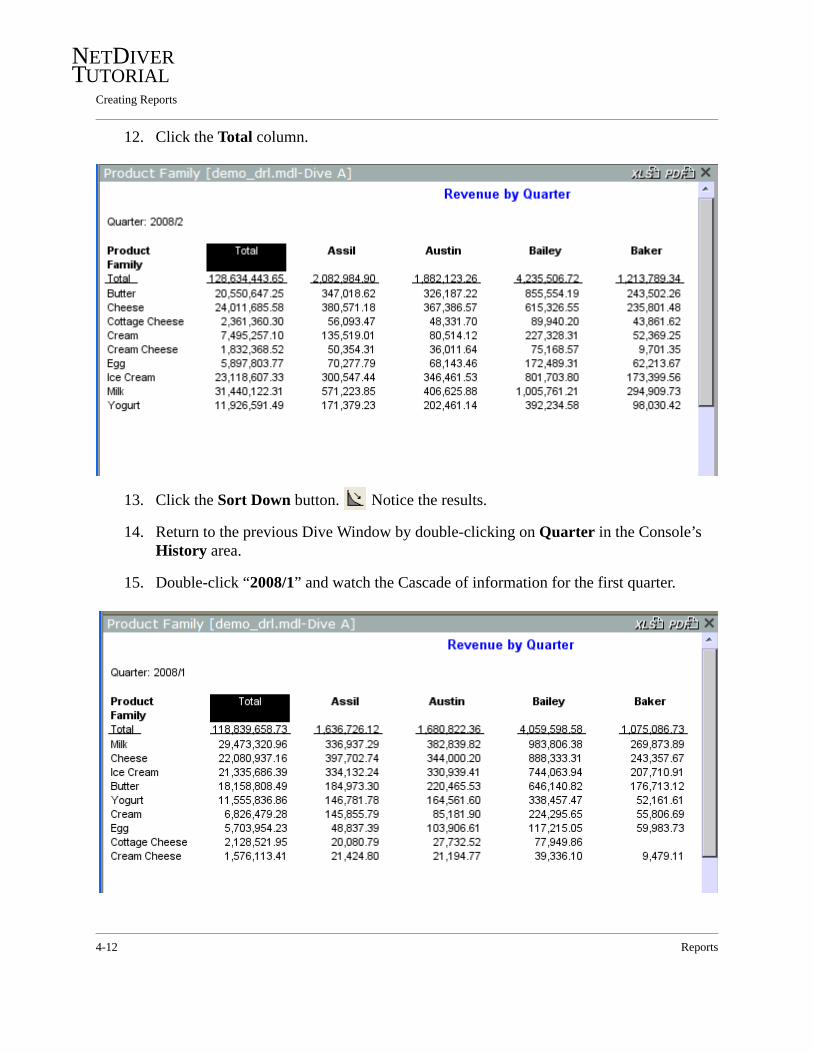
Creating Reports
NETDIVER TUTORIAL
12. Click the Total column.
13. Click the Sort Down button. Notice the results.
14. Return to the previous Dive Window by double-clicking on Quarter in the Console’s History area.
15. Double-click “2008/1” and watch the Cascade of information for the first quarter.
4-12 Reports

Creating Reports
NETDIVER TUTORIAL
16. Double-click “Cream Cheese” and observe the DimCounts in the Console.
17. Dive on Product Name to view the two items.
Reports 4-13
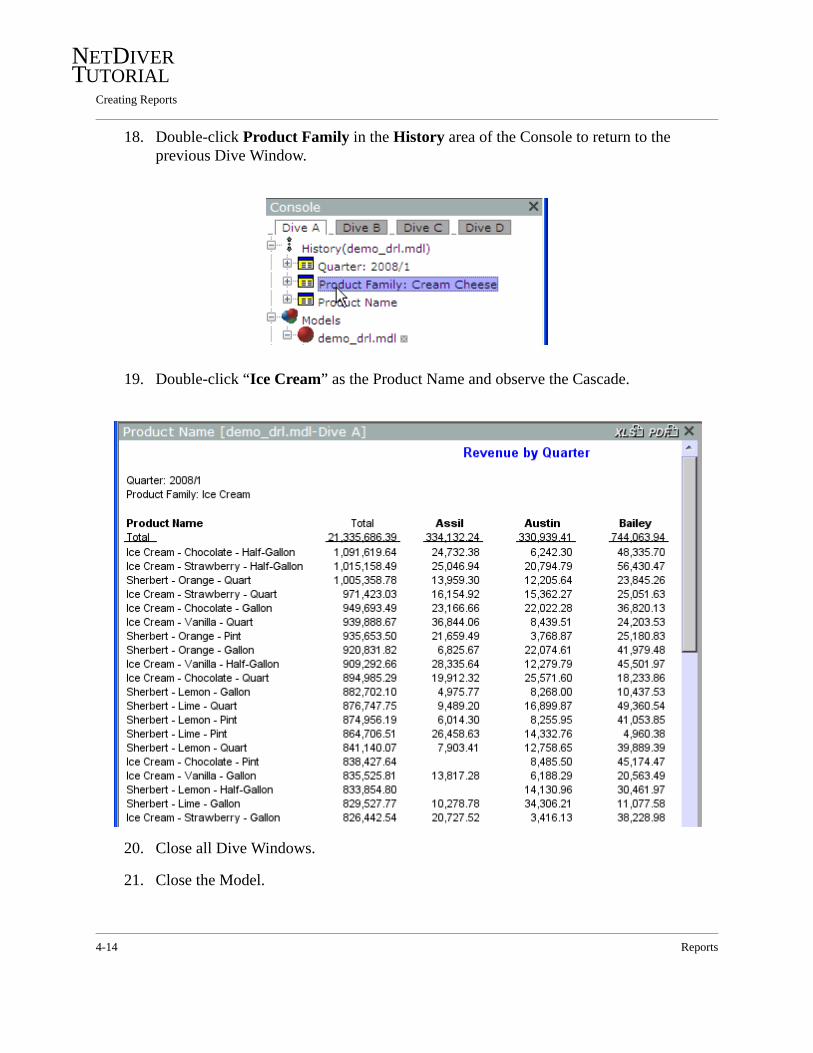
Creating Reports
NETDIVER TUTORIAL
18. Double-click Product Family in the History area of the Console to return to the previous Dive Window.
19. Double-click “Ice Cream” as the Product Name and observe the Cascade.
20. Close all Dive Windows.
21. Close the Model.
4-14 Reports
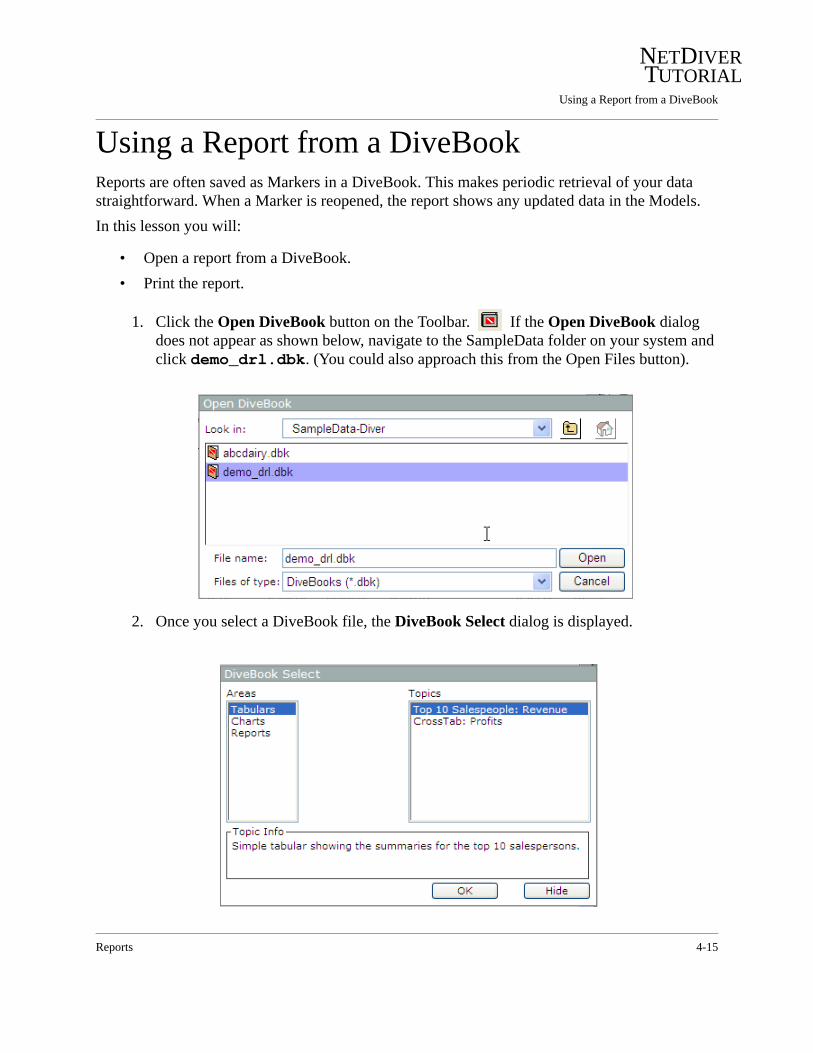
Using a Report from a DiveBook
NETDIVER TUTORIAL
Using a Report from a DiveBook 4Reports are often saved as Markers in a DiveBook. This makes periodic retrieval of your data straightforward. When a Marker is reopened, the report shows any updated data in the Models.In this lesson you will:
• Open a report from a DiveBook. • Print the report.
1. Click the Open DiveBook button on the Toolbar. If the Open DiveBook dialog does not appear as shown below, navigate to the SampleData folder on your system and click demo_drl.dbk. (You could also approach this from the Open Files button).
2. Once you select a DiveBook file, the DiveBook Select dialog is displayed.
Reports 4-15

Using a Report from a DiveBook
NETDIVER TUTORIAL
3. Click Reports.
The Topic “Salesperson by Product Family” is selected by default.
4. Click the OK button and the Report is displayed.
5. Click the Open as PDF button. A new browser window opens with the report loaded in Adobe Reader.
4-16 Reports
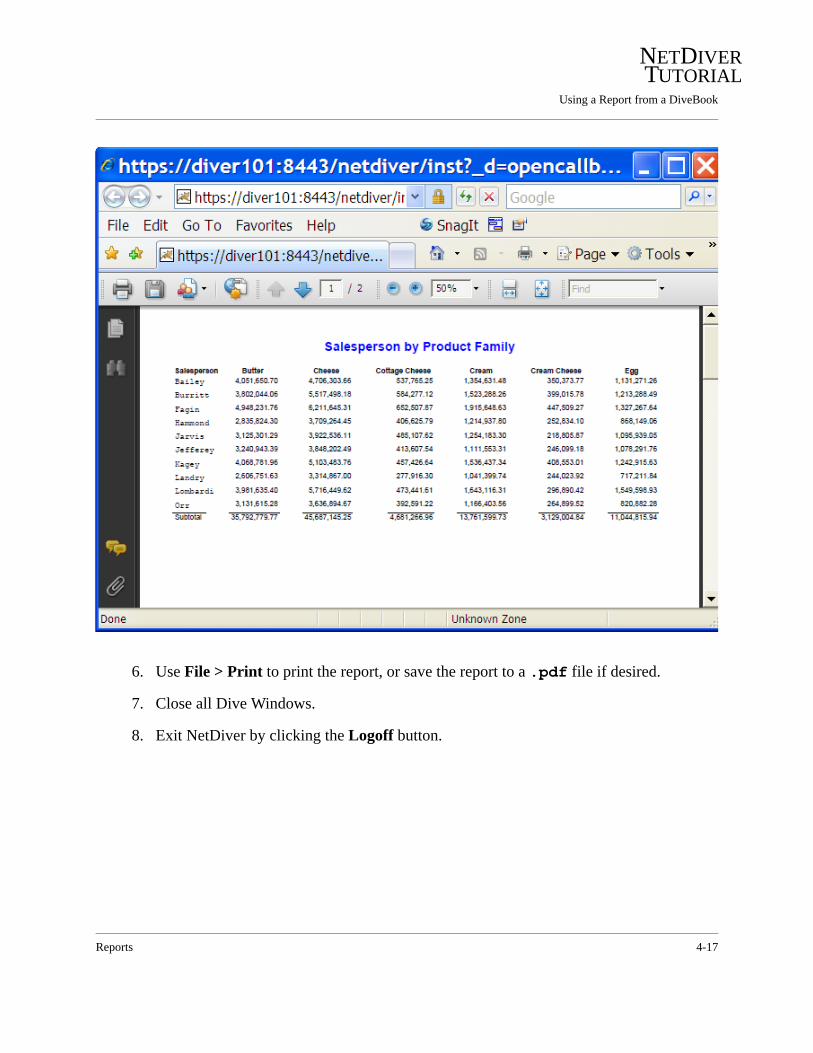
Using a Report from a DiveBook
NETDIVER TUTORIAL
6. Use File > Print to print the report, or save the report to a .pdf file if desired.
7. Close all Dive Windows.
8. Exit NetDiver by clicking the Logoff button.
Reports 4-17
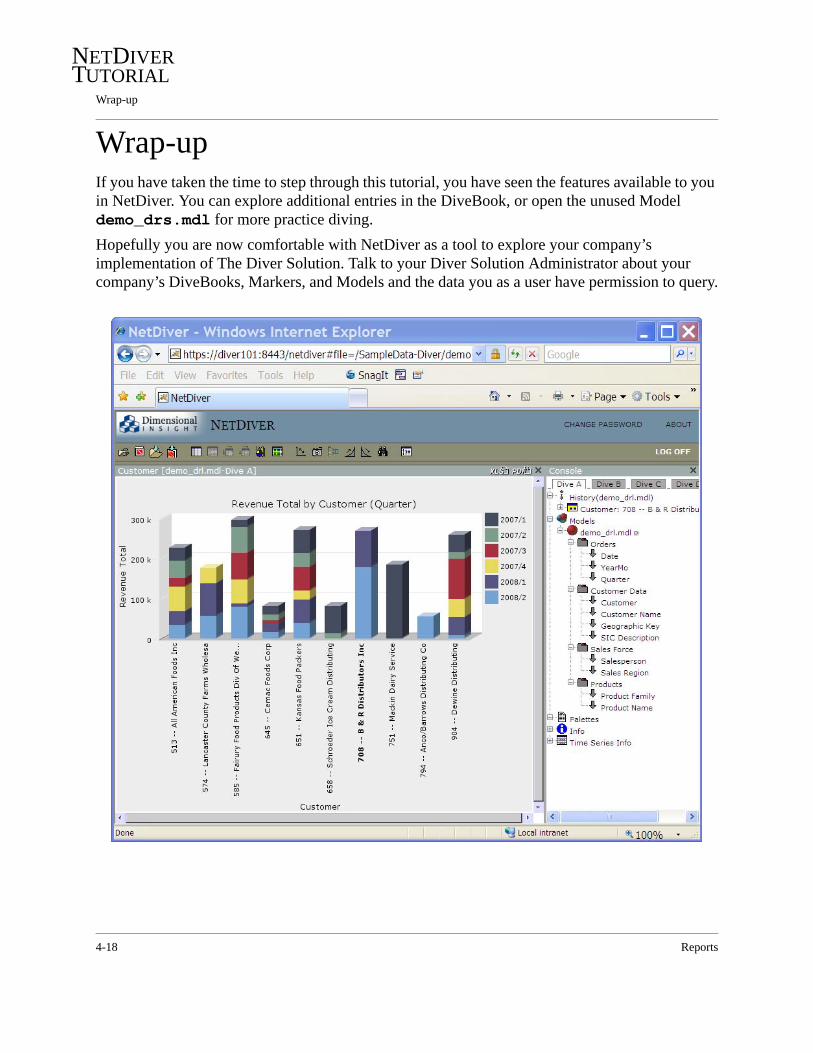
Wrap-up
NETDIVER TUTORIAL
Wrap-up 4If you have taken the time to step through this tutorial, you have seen the features available to you in NetDiver. You can explore additional entries in the DiveBook, or open the unused Model demo_drs.mdl for more practice diving.Hopefully you are now comfortable with NetDiver as a tool to explore your company’s implementation of The Diver Solution. Talk to your Diver Solution Administrator about your company’s DiveBooks, Markers, and Models and the data you as a user have permission to query.
4-18 Reports

Index 0Index 0
Commands
.dbk 2-2, 4-15
.dvp 2-2, 2-8
.mdl 2-2, 2-8, 2-32, 3-1, 3-5, 3-17, 3-25, 3-36, 3-41, 4-1, 4-5, 4-9
.mrk 3-31
.pdf 4-1, 4-4, 4-17
.xls 4-1
A
adding a Calculated Column 2-17adding a title to a report 4-2Adobe Reader 4-4Apache Tomcat 1-1Areas in a DiveBook 2-3arrows in Console 2-10, 3-2, 3-24
B
Back button in browser 1-10Bar Plot
graphic display 3-17bookmark 2-21
C
Cascade 3-9Cascading 2-26, 2-40, 4-14
with QuickViews 3-45
Categories 2-8defined 2-9
Click Action Menu 1-5closing all Dive Windows 2-30closing Dive Windows 2-31, 3-4closing Models 2-22, 3-30Console
Categories 2-9defined 1-9DimCounts 3-43Dimensions 2-10down arrows 2-10gray folders 2-9History 2-24, 3-24Info section 3-24Model 2-8plus signs 2-9right arrows 3-2
Cross Plotgraphic display 3-25
CrossTab 3-5button 3-5, 4-9example 3-6Report 4-9Tabular Display 3-5
CrossTab Inputsdialog 3-5
Ctrl-click 2-12, 3-10, 3-38, 3-44cursor arrow 1-10customization of Excel 1-11
Index-1
NETDIVER TUTORIAL
D
data types defined 1-3de-selecting data 2-12, 3-28Default Report dialog 4-2, 4-6DimCount 3-13, 3-43, 3-44
defined 1-4Dimension
defined 1-3in Console 2-10
Dive Windowsclosing 2-31defined 1-9
DiveBookArea 2-3button 2-6, 4-15defined 1-3file extension 2-2saving Marker to 2-21Select dialog 2-3, 4-15Topics 2-3
DiveLine 1-6, 1-9defined 1-1files 2-1password 1-2username 1-2
DivePlan 2-8, 2-9defined 1-3
DivePort 1-4defined 1-1
diving 2-2, 2-11, 2-23, 2-31Cascading 2-26, 2-40defined 1-3from a CrossTab 3-6from a CrossTab cell 3-7from a CrossTab row 3-9from a group 2-36, 2-39from a MultiCrossTab 3-11from a MultiCrossTab cell 3-12from a MultiCrossTab row 3-15from a report 4-1from Others 2-40
diving from a Bar Plot 3-24diving from a Pie Chart 3-43diving from a Stack Plot 3-35double-click 2-30, 2-40, 3-9, 3-43down arrows 2-10, 2-31, 3-24
E
end-user workstations 1-4Excel 2-14
open in 1-11Excel preferences
recommendation for NetDiver 1-11Exporting to Excel 2-14
F
Findbutton 2-32, 2-35, 2-38, 3-19example 2-32options 2-41
Find Numeric example 3-19Find String dialog 2-33Flip Axes button 3-23, 3-33Flip Table 3-23Focus
button 2-13, 2-17, 3-18example 3-18
Focus and Group 2-35
G
Go button 3-46Graph button 3-21, 3-25, 3-31, 3-36, 3-41graph legend area 3-43
Index-2
NETDIVER TUTORIAL
Graphic DisplaysBar Plot 3-17Cross Plot 3-25Pie Plot 3-41Plot Options 3-21Scatter Plot 3-36Stack Plot 3-31
gray folders 2-9Group
example 2-32row 2-36with Others 2-38
H
History in Console 2-24, 2-39, 3-24HTTP Session Cookies 1-4HTTPS 1-4
I
Include Parent Info 4-3, 4-10Info Fields 2-10
defined 1-3Info section of Console 3-24
J
JavaScript 1-4
L
launching NetDiverfrom browser 1-8from DivePort 1-4
LOG OFF 1-11LOG OFF button 2-7Log On 1-8
M
Marker 1-5, 2-16, 3-31defined 1-3saving 2-21, 4-8
Model 1-1Categories 2-9close 2-22, 3-30defined 1-3, 2-8in Console 2-8open 2-8
MultiCrossTab 3-10button 3-10Inputs dialog 3-10
MultiTab 3-1button 3-1, 4-5example 3-3Report 4-5
MY ACCOUNT button 1-4
N
navigating in NetDiver 1-10NetDiver window components 1-9
O
Open as PDF button 4-4Open DiveBook button 4-15Open File button 2-1, 2-8, 3-31Open File dialog 2-8Open in Excel button 2-14opening a Model 2-8opening Categories 2-8Others 2-40Others row 2-38
P
password for DiveLine 1-2PDF button 1-11, 4-4
Index-3
NETDIVER TUTORIAL
PickList QuickView 3-47Pie Plot
example 3-42Pie Plot graphic display 3-41plus signs in Console 2-9printing 1-11, 4-4, 4-15ProDiver 1-1Pulldown QuickView 3-45
Q
QuickViewdata selection 3-45defined 1-3example 3-45Go button 3-46PickList 3-47Pulldown 3-45window area 1-9
R
ReportBasic Tabular 4-1button 4-2, 4-6, 4-10CrossTab 4-9Include Parent Info 4-3, 4-10MultiTab 4-5sample 4-3subtotal 4-8titles 4-2
right arrows 3-2
S
SampleData 2-8folder 2-2for tutorial 1-2
Save Markerbutton 2-22, 3-20, 4-8dialog 2-22
saving data 4-4saving Markers 2-16, 3-20, 4-8Saving your work 1-11Scatter Plot
example 3-38graphic display 3-36
Select Graph Type dialog 3-21, 3-25, 3-32, 3-36, 3-41
selecting data 2-12, 2-17from a graph 3-23, 3-34, 3-38, 3-43in a QuickView 3-45in a Tabular 2-12, 2-17
Session Timeout 1-11Set Data Attributes dialog 3-22, 3-26, 3-32,
3-37, 3-41Shift-click 2-12, 2-17, 3-17Show the Console button 2-8single-click 3-43Sort Down button 2-12, 2-17, 4-12Sort Up button 3-17sorting 3-17Stack Plot
graphic display 3-31Start NetDiver 1-4subtotal in report 4-8Subtotals row 2-34Summaries 1-3, 2-10, 2-11Switch the view to a Basic Plot button 3-17Switch the view to a Graph button 3-25, 3-31,
3-36, 3-41Switch the view to a MultiTab button 4-5Switch the view to a Report button 4-2, 4-6,
4-10Switch the view to CrossTab button 3-5, 4-9Switch the view to MultiCrossTab button 3-10Switch the view to MultiTab button 3-1
T
Tabular button 3-39
Index-4
NETDIVER TUTORIAL
Tabular Displays 3-1CrossTab 3-5MultiCrossTab 3-10MultiTab 3-1Report 4-1
The Diver Solution 1-11, 2-1title box for report 4-2Topics in a DiveBook 2-3Totals row 2-34
U
unselecting data 3-28URL 1-8user level 1-1, 1-5, 1-8username for DiveLine 1-2
W
web browser 1-1window components in NetDiver 1-9
X
XLS button 1-11
Index-5

NETDIVER TUTORIAL