

NETCAE LIMITED - Netcare Group Reports/PDF/Netcare Annual... · The Group’s external auditors,...
120
ANNUAL FINANCIAL STATEMENTS 2017 NETCARE LIMITED
-
Upload
nguyenhuong -
Category
Documents
-
view
226 -
download
0
Transcript of NETCAE LIMITED - Netcare Group Reports/PDF/Netcare Annual... · The Group’s external auditors,...

ANNUAL FINANCIAL STATEMENTS 2017
NETCARE LIMITED

ANNUAL FINANCIAL STATEMENTS
02 Directors' responsibility and approval
02 Certificate by the Company Secretary
03 Directors' report
10 Audit Committee report
13 Independent auditor’s report
17 Group statement of profit or loss
18 Group statement of other comprehensive income
19 Group statement of financial position
20 Group statement of changes in equity
22 Group statement of cash flows
23 Index of the notes to the Group annual financial statements
24 Notes to the Group annual financial statements
97 Company annual financial statements
106 Annexure A – Interest in subsidiaries
110 Annexure B – Interest in joint ventures
111 Annexure C – Investment in associated companies
114 Annexure D – Analysis of shareholders
OTHER INFORMATION115 Corporate information
116 Shareholders' diary
IBC Disclaimer
cont
ents
01NETCARE LIMITED
Consolidated annual financial statements 2017
Annual Financial Statements 30 September 2017
These annual financial statements were prepared by the finance department of Netcare Limited acting under the supervision of KN Gibson CA (SA), Chief Financial Officer of the Group.
NETCARE LIMITED
02NETCARE LIMITED
Consolidated annual financial statements 2017
DIRECTORS’ RESPONSIBILITY AND APPROVAL
The directors of Netcare Limited are responsible for the preparation and integrity of the annual financial statements of the Company and the Group, which have been prepared under the supervision of the Chief Financial Officer, Mr KN Gibson, CA(SA). These annual financial statements are prepared in accordance with International Financial Reporting Standards (IFRS) and the SAICA Financial Reporting Guides as issued by the Accounting Practices Committee (APC), Financial Reporting Pronouncements as issued by the Financial Reporting Standards Council (FRSC), the requirements of the South African Companies Act, No 71 of 2008 (the Companies Act), and the JSE Listings Requirements in line with the accounting policies of the Group, which are supported by prudent judgements and estimates. The Group’s external auditors, Grant Thornton Johannesburg (Grant Thornton), are engaged to express an independent opinion on these financial statements which has been presented on pages 13 to 16.
To enable the directors to fulfil this responsibility, the Group maintains internal accounting and administrative control systems designed to provide reasonable assurance that assets are safeguarded and that transactions are executed and recorded in accordance with the Group’s policies and procedures to prevent and detect material misstatement and loss.
The directors are of the opinion that such accounting and administrative control systems have been maintained during the year. Nothing has come to the attention of the Netcare Board that caused it to believe that the Group’s system of internal controls and risk management are not effective and that the internal financial controls do not form a sound basis for the preparation of reliable financial statements.
The annual financial statements are prepared on a going concern basis and in accordance with IFRS. These financial statements are audited by the external auditors in conformity with International Standards on Auditing.
The annual financial statements were approved by the Board of directors on 17 November 2017 and are signed on its behalf by:
JM Kahn RH Friedland KN GibsonNon-executive Chairman Chief Executive Officer Chief Financial Officer
Sandton
17 November 2017
I hereby certify that, in respect of the year under review, the Company has lodged with the Companies and Intellectual Property Commission all returns and notices required of a public company in terms of the Companies Act, section 88(2)(e) and that all such returns appear to be true, correct and up to date.
L BagwandeenCompany Secretary
Sandton
17 November 2017
CERTIFICATE BY THE COMPANY SECRETARY
03NETCARE LIMITED
Consolidated annual financial statements 2017
Your directors have pleasure in presenting their report on the activities of Netcare Limited consolidated (the Group) and of Netcare Limited (the Company) for the year ended 30 September 2017.
NATURE OF BUSINESSNetcare Limited is an investment holding company and through its subsidiaries, joint ventures and associates in Southern Africa (SA) and in the United Kingdom (UK) carries on business as a private hospital group, providing an extensive range of general, emergency and specialised medical care services. Ancillary healthcare businesses include primary, administration and logistical services.
FINANCIAL RESULTS AND REVIEW The 2017 financial year has been an unusually difficult year for Netcare. Market conditions have presented challenges to growth in both South Africa (SA) and the United Kingdom (UK). Funder-led demand management initiatives in both geographies impacted results with negative patient day growth in SA, while in the UK overall caseload volumes were marginally up on the prior year with strong growth in day cases but a decline in inpatient cases.
In addition, there have been a number of large, non-recurring transactions which have had a significant impact on the Group results comprising of:
> A capital profit on the sale of the old Netcare Christiaan Barnard Memorial Hospital (CBMH) land and buildings of R203 million (R169 million after tax). The sale proceeds of R300 million were received in July 2017;
> A non-cash profit of R937 million (2016: loss of R1 988 million) after tax, arising on the mark-to-market revaluation of the UK Retail Price Index (RPI) swap instruments. Refer to notes 6.3 and 6.4; and
> Non-cash adjustments of an aggregate R5 563 million relating to the impairment of property, plant and equipment (R1 540 million), recognition of onerous lease provisions (R1 669 million) and impairment of goodwill (R2 354 million) in the UK operations (collectively referred to as “UK impairment and onerous lease charges”). The assessment of these non-cash accounting adjustments required the application of judgment and in light of the difficult current trading environment a conservative view has been applied. Refer to notes 1.4, 2.8, 2.10 and 7.1.
The financial results of the Group are set out on pages 17 to 96 of this report and a segment report is included in note 2.11 to the Group annual financial statements. The Company annual financial statements are presented on pages 97 to 105.
SUBSIDIARIES, ASSOCIATES AND JOINT VENTURESDetails of interests in subsidiaries, joint ventures and associates are shown on pages 106 to 113 respectively.
Acquisitions, disposals and changes in holdingsAcquisitionsThe Group acquired the following new subsidiaries during the year:
> With effect from December 2016:
– 100% shareholding in Starchoice Trading Fourty One Benmed Park Clinic Proprietary Limited with effect from 1 December 2016.
– 100% shareholding in Netcare Occupational Health Proprietary Limited with effect from 14 December 2016.
> With effect from 1 January 2017:
– 100% shareholding in Netcare CBMH Cancer Centre Proprietary Limited.
– 100% shareholding in Netcare Milpark Intraop Proprietary Limited.
– 100% shareholding in Netcare Pinehaven Cancer Centre Proprietary Limited.
– 100% shareholding in Southern Cape Cancer Centre Proprietary Limited.
> With effect from 1 March 2017:
– 100% shareholding in Medicross Constantia Park Day Theatre Proprietary Limited.
– 100% shareholding in Medicross Boksburg Day Theatre Proprietary Limited.
– 100% shareholding in Medicross Germiston Day Theatre Proprietary Limited.
– 100% shareholding in Medicross Silverton Day Theatre Proprietary Limited.
– 52% shareholding in Seteclass Proprietary Limited.
DIRECTORS’ REPORTfor the year ended 30 September 2017
04NETCARE LIMITED
Consolidated annual financial statements 2017
> With effect from 10 April 2017:
– 100% shareholding in Netcare Olivedale Investment Company (RF) Proprietary Limited.
> With effect from 21 April 2017:
– 100% shareholding in Netcare Garden City Hospital Investment Company (RF) Proprietary Limited.
> With effect from 12 May 2017:
– 100% shareholding in Netcare Montana Investment Company (RF) Proprietary Limited.
> With effect from 19 May 2017:
– 100% shareholding in Netcare N1 City Investment Company (RF) Proprietary Limited.
– 100% of shareholding in Netcare Pretoria East Investment Company (RF) Proprietary Limited.
> With effect from 13 July 2017:
– 100% shareholding in Netcare Sunninghill Investment Company (RF) Proprietary Limited.
> With effect from 31 July 2017:
– 100% shareholding in Aztowize Proprietary Limited.
> With effect from 10 August 2017:
– 100% shareholding in Netcare Loftus Park Hospital Opco Proprietary Limited.
> With effect from 23 August 2017:
– 100% shareholding in Netcare Moot Investment Company (RF) Proprietary Limited.
Disposals > With effect from 1 January 2017:
– The Group disposed of 100% of it’s shareholding in Prime Cure Health Proprietary Limited.
> With effect from 22 June 2017:
– The Group disposed of its entire joint venture shareholding (50%) in The Thornbury Radiosurgery Centre Limited (incorporated in the United Kingdom).
> With effect from 29 September 2017:
– The Group disposed of it’s entire shareholding (70%) in Centurion Sub-Acute Facility Proprietary Limited.
Changes in holdingsThe Group changed its shareholding in the following subsidiaries and associates during the year:
> With effect from 1 March 2017:
– The Group acquired an additional 5% shareholding in Waterfall City Hospital Proprietary Limited. This did not result in a change in control, and the entity is still consolidated as a subsidiary.
> With effect from 1 April 2017:
– As a result of a share buyback by Cancare Proprietary Limited, the Group’s interest increased to 64.1%. This did not result in a change in control, and the entity is still consolidated as a subsidiary.
> With effect from 6 July 2017:
– Due to a change in equity structure, the Group’s investment in BMI Syon Clinic Limited (incorporated in the United Kingdom) reduced from 90% to 50%. The change did not affect control, and the entity is still consolidated as a subsidiary.
> With effect from 30 September 2017:
– The Group diluted its associate shareholding in Gamma Knife South Africa Proprietary Limited to 31.8%.
The above excludes acquisitions, disposals and changes in holdings of dormant companies.
There were no other material changes in the Group to holdings in subsidiaries, associates or joint ventures during the year ended 30 September 2017.
The complete list of acquisitions, disposals, deregistrations and changes in holdings is available to shareholders on request.
Directors’ report continuedAcquisitions, disposals and changes in holdings continued
05NETCARE LIMITED
Consolidated annual financial statements 2017
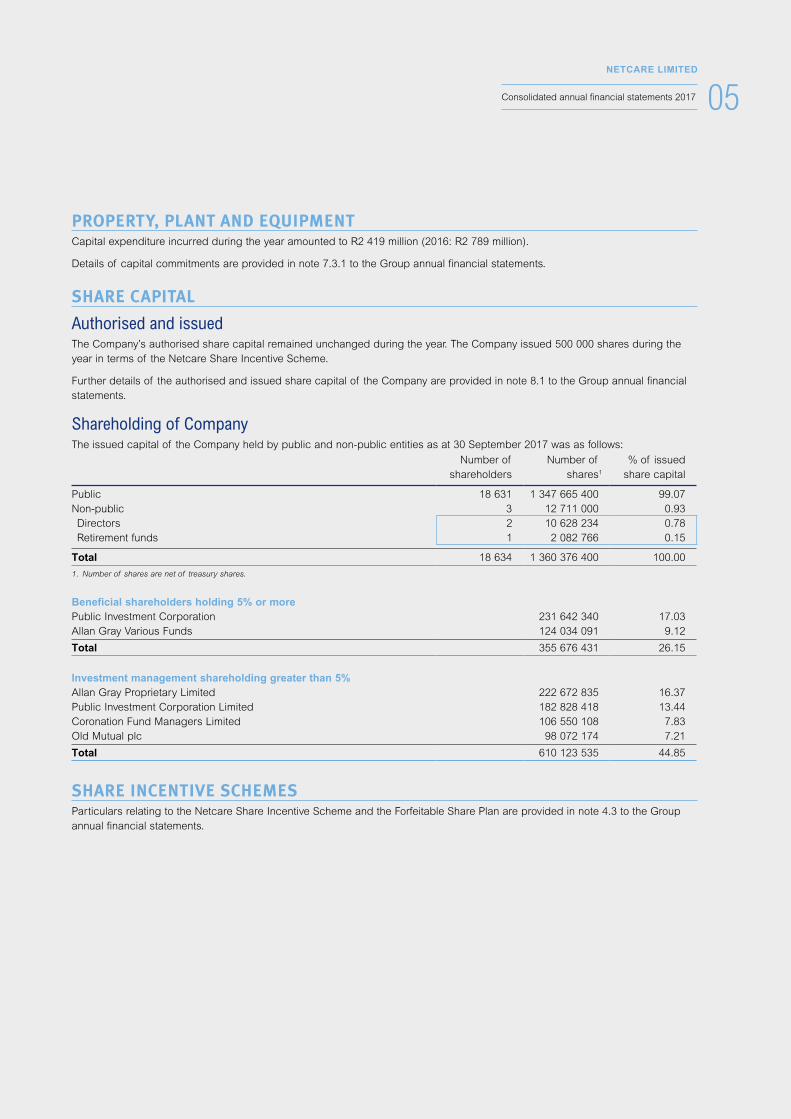
PROPERTY, PLANT AND EQUIPMENTCapital expenditure incurred during the year amounted to R2 419 million (2016: R2 789 million).
Details of capital commitments are provided in note 7.3.1 to the Group annual financial statements.
SHARE CAPITAL
Authorised and issuedThe Company’s authorised share capital remained unchanged during the year. The Company issued 500 000 shares during the year in terms of the Netcare Share Incentive Scheme.
Further details of the authorised and issued share capital of the Company are provided in note 8.1 to the Group annual financial statements.
Shareholding of CompanyThe issued capital of the Company held by public and non-public entities as at 30 September 2017 was as follows:
Number of shareholders
Number of shares1
% of issued share capital
Public 18 631 1 347 665 400 99.07 Non-public 3 12 711 000 0.93 Directors 2 10 628 234 0.78 Retirement funds 1 2 082 766 0.15
Total 18 634 1 360 376 400 100.00
1. Number of shares are net of treasury shares.
Beneficial shareholders holding 5% or morePublic Investment Corporation 231 642 340 17.03 Allan Gray Various Funds 124 034 091 9.12
Total 355 676 431 26.15
Investment management shareholding greater than 5%Allan Gray Proprietary Limited 222 672 835 16.37 Public Investment Corporation Limited 182 828 418 13.44 Coronation Fund Managers Limited 106 550 108 7.83 Old Mutual plc 98 072 174 7.21
Total 610 123 535 44.85
SHARE INCENTIVE SCHEMESParticulars relating to the Netcare Share Incentive Scheme and the Forfeitable Share Plan are provided in note 4.3 to the Group annual financial statements.
06NETCARE LIMITED
Consolidated annual financial statements 2017
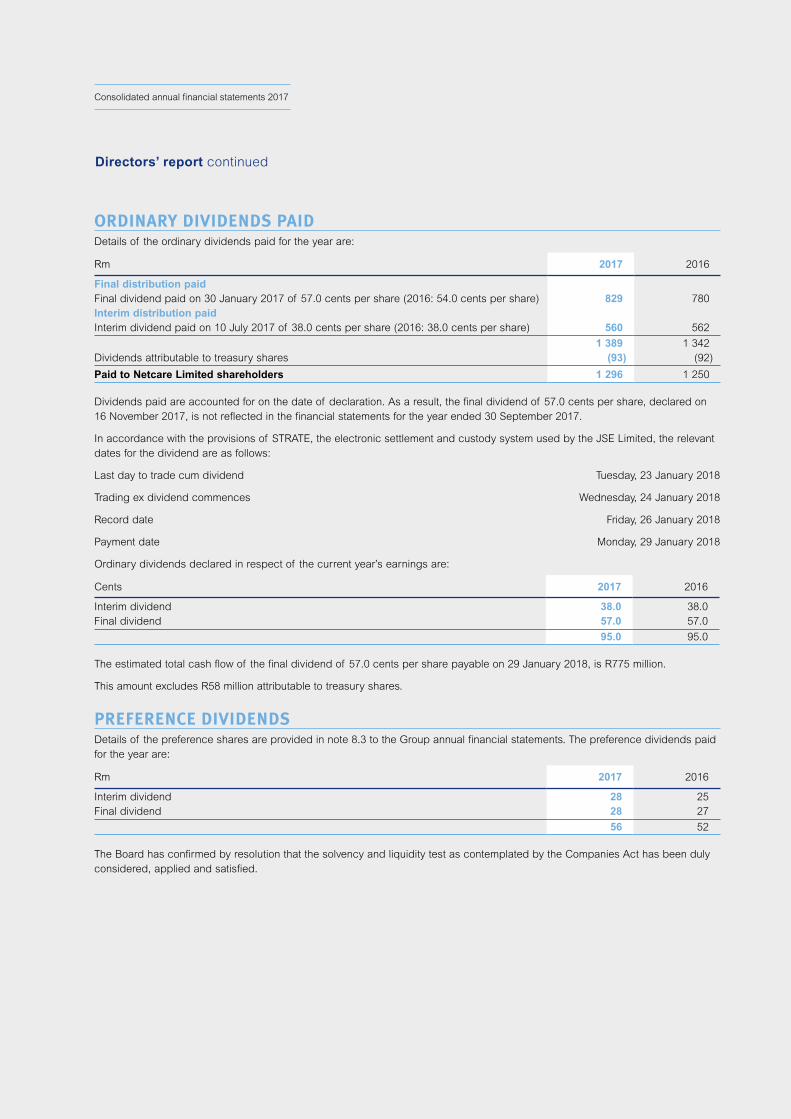
ORDINARY DIVIDENDS PAID Details of the ordinary dividends paid for the year are:
Rm 2017 2016
Final distribution paidFinal dividend paid on 30 January 2017 of 57.0 cents per share (2016: 54.0 cents per share) 829 780 Interim distribution paidInterim dividend paid on 10 July 2017 of 38.0 cents per share (2016: 38.0 cents per share) 560 562
1 389 1 342 Dividends attributable to treasury shares (93) (92)
Paid to Netcare Limited shareholders 1 296 1 250
Dividends paid are accounted for on the date of declaration. As a result, the final dividend of 57.0 cents per share, declared on 16 November 2017, is not reflected in the financial statements for the year ended 30 September 2017.
In accordance with the provisions of STRATE, the electronic settlement and custody system used by the JSE Limited, the relevant dates for the dividend are as follows:
Last day to trade cum dividend Tuesday, 23 January 2018
Trading ex dividend commences Wednesday, 24 January 2018
Record date Friday, 26 January 2018
Payment date Monday, 29 January 2018
Ordinary dividends declared in respect of the current year’s earnings are:
Cents 2017 2016
Interim dividend 38.0 38.0 Final dividend 57.0 57.0
95.0 95.0
The estimated total cash flow of the final dividend of 57.0 cents per share payable on 29 January 2018, is R775 million.
This amount excludes R58 million attributable to treasury shares.
PREFERENCE DIVIDENDSDetails of the preference shares are provided in note 8.3 to the Group annual financial statements. The preference dividends paid for the year are:
Rm 2017 2016
Interim dividend 28 25Final dividend 28 27
56 52
The Board has confirmed by resolution that the solvency and liquidity test as contemplated by the Companies Act has been duly considered, applied and satisfied.
Directors’ report continued
07NETCARE LIMITED
Consolidated annual financial statements 2017
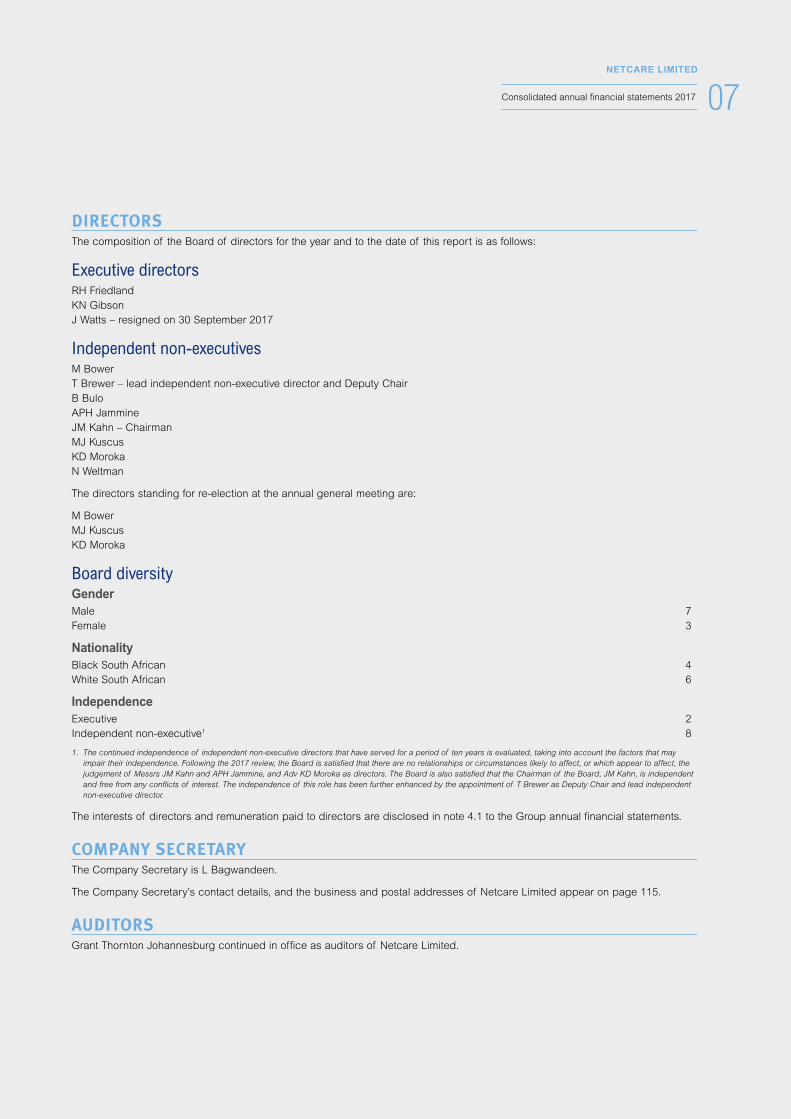
DIRECTORS The composition of the Board of directors for the year and to the date of this report is as follows:
Executive directors RH Friedland KN Gibson J Watts – resigned on 30 September 2017
Independent non-executives M BowerT Brewer – lead independent non-executive director and Deputy ChairB Bulo APH JammineJM Kahn – ChairmanMJ KuscusKD MorokaN Weltman
The directors standing for re-election at the annual general meeting are:
M BowerMJ KuscusKD Moroka
Board diversityGender Male 7Female 3
Nationality Black South African 4White South African 6
Independence Executive 2Independent non-executive1 8
1. The continued independence of independent non-executive directors that have served for a period of ten years is evaluated, taking into account the factors that may impair their independence. Following the 2017 review, the Board is satisfied that there are no relationships or circumstances likely to affect, or which appear to affect, the judgement of Messrs JM Kahn and APH Jammine, and Adv KD Moroka as directors. The Board is also satisfied that the Chairman of the Board, JM Kahn, is independent and free from any conflicts of interest. The independence of this role has been further enhanced by the appointment of T Brewer as Deputy Chair and lead independent non-executive director.
The interests of directors and remuneration paid to directors are disclosed in note 4.1 to the Group annual financial statements.
COMPANY SECRETARYThe Company Secretary is L Bagwandeen.
The Company Secretary’s contact details, and the business and postal addresses of Netcare Limited appear on page 115.
AUDITORSGrant Thornton Johannesburg continued in office as auditors of Netcare Limited.
08NETCARE LIMITED
Consolidated annual financial statements 2017
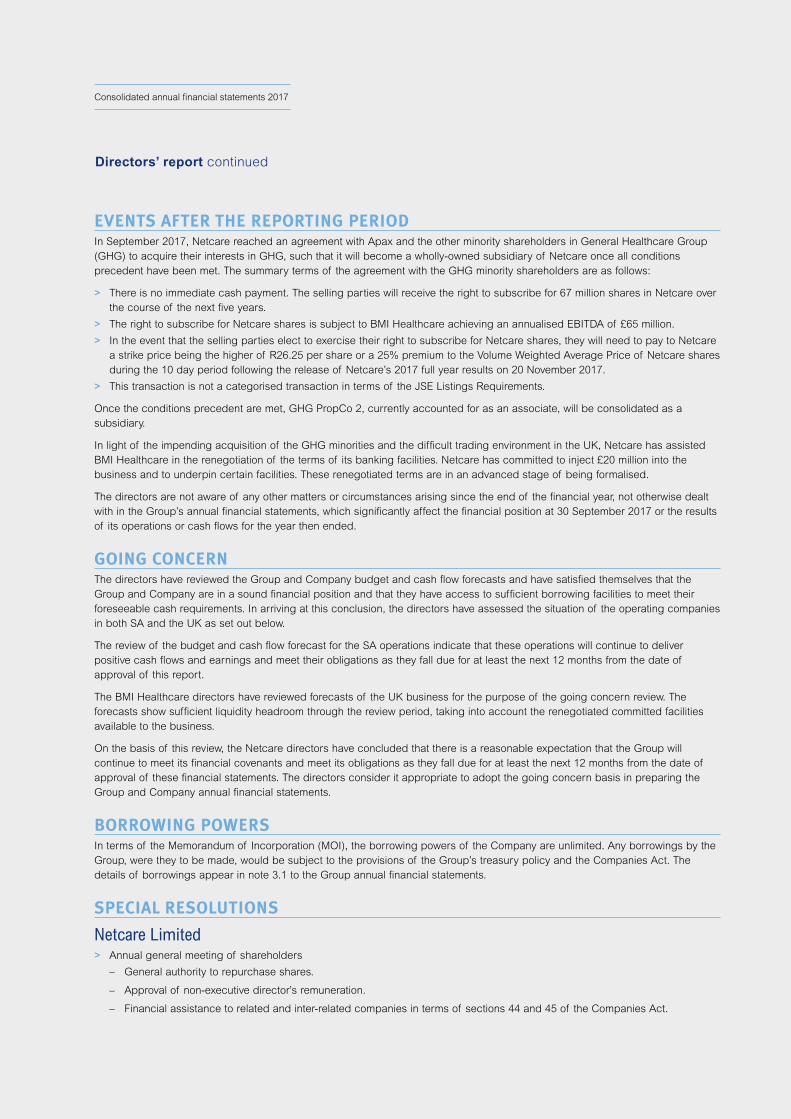
EVENTS AFTER THE REPORTING PERIOD In September 2017, Netcare reached an agreement with Apax and the other minority shareholders in General Healthcare Group (GHG) to acquire their interests in GHG, such that it will become a wholly-owned subsidiary of Netcare once all conditions precedent have been met. The summary terms of the agreement with the GHG minority shareholders are as follows:
> There is no immediate cash payment. The selling parties will receive the right to subscribe for 67 million shares in Netcare over the course of the next five years.
> The right to subscribe for Netcare shares is subject to BMI Healthcare achieving an annualised EBITDA of £65 million.
> In the event that the selling parties elect to exercise their right to subscribe for Netcare shares, they will need to pay to Netcare a strike price being the higher of R26.25 per share or a 25% premium to the Volume Weighted Average Price of Netcare shares during the 10 day period following the release of Netcare’s 2017 full year results on 20 November 2017.
> This transaction is not a categorised transaction in terms of the JSE Listings Requirements.
Once the conditions precedent are met, GHG PropCo 2, currently accounted for as an associate, will be consolidated as a subsidiary.
In light of the impending acquisition of the GHG minorities and the difficult trading environment in the UK, Netcare has assisted BMI Healthcare in the renegotiation of the terms of its banking facilities. Netcare has committed to inject £20 million into the business and to underpin certain facilities. These renegotiated terms are in an advanced stage of being formalised.
The directors are not aware of any other matters or circumstances arising since the end of the financial year, not otherwise dealt with in the Group’s annual financial statements, which significantly affect the financial position at 30 September 2017 or the results of its operations or cash flows for the year then ended.
GOING CONCERNThe directors have reviewed the Group and Company budget and cash flow forecasts and have satisfied themselves that the Group and Company are in a sound financial position and that they have access to sufficient borrowing facilities to meet their foreseeable cash requirements. In arriving at this conclusion, the directors have assessed the situation of the operating companies in both SA and the UK as set out below.
The review of the budget and cash flow forecast for the SA operations indicate that these operations will continue to deliver positive cash flows and earnings and meet their obligations as they fall due for at least the next 12 months from the date of approval of this report.
The BMI Healthcare directors have reviewed forecasts of the UK business for the purpose of the going concern review. The forecasts show sufficient liquidity headroom through the review period, taking into account the renegotiated committed facilities available to the business.
On the basis of this review, the Netcare directors have concluded that there is a reasonable expectation that the Group will continue to meet its financial covenants and meet its obligations as they fall due for at least the next 12 months from the date of approval of these financial statements. The directors consider it appropriate to adopt the going concern basis in preparing the Group and Company annual financial statements.
BORROWING POWERSIn terms of the Memorandum of Incorporation (MOI), the borrowing powers of the Company are unlimited. Any borrowings by the Group, were they to be made, would be subject to the provisions of the Group’s treasury policy and the Companies Act. The details of borrowings appear in note 3.1 to the Group annual financial statements.
SPECIAL RESOLUTIONS
Netcare Limited > Annual general meeting of shareholders
– General authority to repurchase shares.
– Approval of non-executive director’s remuneration.
– Financial assistance to related and inter-related companies in terms of sections 44 and 45 of the Companies Act.
Directors’ report continued
09NETCARE LIMITED
Consolidated annual financial statements 2017
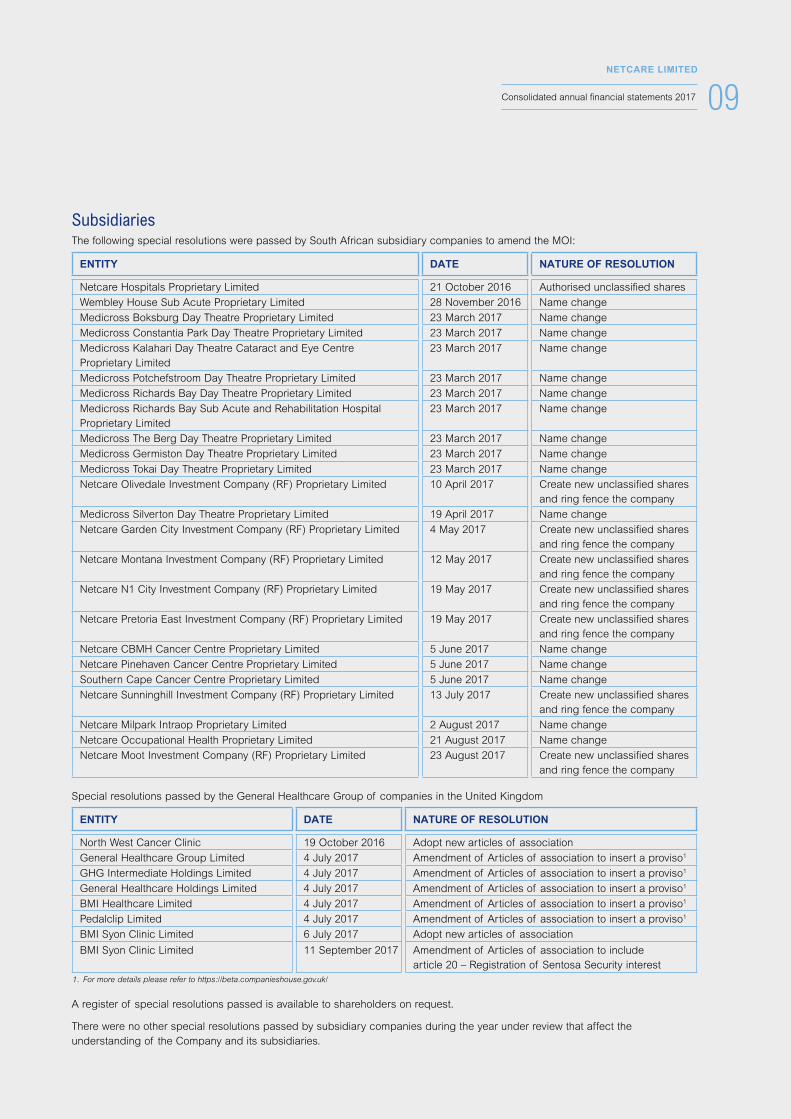
SubsidiariesThe following special resolutions were passed by South African subsidiary companies to amend the MOI:
ENTITY DATE NATURE OF RESOLUTION
Netcare Hospitals Proprietary Limited 21 October 2016 Authorised unclassified shares
Wembley House Sub Acute Proprietary Limited 28 November 2016 Name change
Medicross Boksburg Day Theatre Proprietary Limited 23 March 2017 Name change
Medicross Constantia Park Day Theatre Proprietary Limited 23 March 2017 Name change
Medicross Kalahari Day Theatre Cataract and Eye Centre Proprietary Limited
23 March 2017 Name change
Medicross Potchefstroom Day Theatre Proprietary Limited 23 March 2017 Name change
Medicross Richards Bay Day Theatre Proprietary Limited 23 March 2017 Name change
Medicross Richards Bay Sub Acute and Rehabilitation Hospital Proprietary Limited
23 March 2017 Name change
Medicross The Berg Day Theatre Proprietary Limited 23 March 2017 Name change
Medicross Germiston Day Theatre Proprietary Limited 23 March 2017 Name change
Medicross Tokai Day Theatre Proprietary Limited 23 March 2017 Name change
Netcare Olivedale Investment Company (RF) Proprietary Limited 10 April 2017 Create new unclassified shares and ring fence the company
Medicross Silverton Day Theatre Proprietary Limited 19 April 2017 Name change
Netcare Garden City Investment Company (RF) Proprietary Limited 4 May 2017 Create new unclassified shares and ring fence the company
Netcare Montana Investment Company (RF) Proprietary Limited 12 May 2017 Create new unclassified shares and ring fence the company
Netcare N1 City Investment Company (RF) Proprietary Limited 19 May 2017 Create new unclassified shares and ring fence the company
Netcare Pretoria East Investment Company (RF) Proprietary Limited 19 May 2017 Create new unclassified shares and ring fence the company
Netcare CBMH Cancer Centre Proprietary Limited 5 June 2017 Name change
Netcare Pinehaven Cancer Centre Proprietary Limited 5 June 2017 Name change
Southern Cape Cancer Centre Proprietary Limited 5 June 2017 Name change
Netcare Sunninghill Investment Company (RF) Proprietary Limited 13 July 2017 Create new unclassified shares and ring fence the company
Netcare Milpark Intraop Proprietary Limited 2 August 2017 Name change
Netcare Occupational Health Proprietary Limited 21 August 2017 Name change
Netcare Moot Investment Company (RF) Proprietary Limited 23 August 2017 Create new unclassified shares and ring fence the company
Special resolutions passed by the General Healthcare Group of companies in the United Kingdom
ENTITY DATE NATURE OF RESOLUTION
North West Cancer Clinic 19 October 2016 Adopt new articles of association
General Healthcare Group Limited 4 July 2017 Amendment of Articles of association to insert a proviso1
GHG Intermediate Holdings Limited 4 July 2017 Amendment of Articles of association to insert a proviso1
General Healthcare Holdings Limited 4 July 2017 Amendment of Articles of association to insert a proviso1
BMI Healthcare Limited 4 July 2017 Amendment of Articles of association to insert a proviso1
Pedalclip Limited 4 July 2017 Amendment of Articles of association to insert a proviso1
BMI Syon Clinic Limited 6 July 2017 Adopt new articles of association
BMI Syon Clinic Limited 11 September 2017 Amendment of Articles of association to include article 20 – Registration of Sentosa Security interest
1. For more details please refer to https://beta.companieshouse.gov.uk/
A register of special resolutions passed is available to shareholders on request.
There were no other special resolutions passed by subsidiary companies during the year under review that affect the understanding of the Company and its subsidiaries.

10NETCARE LIMITED
Consolidated annual financial statements 2017
INTRODUCTIONThe Audit Committee (the Committee) is pleased to present its report in terms of section 91 of the Companies Act, No 71 of 2008, as amended (the Companies Act), the King IV Report of Corporate Governance for South Africa (King IV) and the JSE Listings Requirements for the financial year ended 30 September 2017. The Committee conducted its duties in accordance with its written terms of reference approved by the Board.
ROLE OF THE AUDIT COMMITTEEThe Committee’s main objective is to assist the Board in fulfulling its oversight responsibilities, in particular with regard to the evaluation of the adequacy and efficiency of accounting policies, internal controls and financial and corporate reporting processes.
In summary, during the year under review, the Committee performed the following roles:
> Reviewed and recommended for approval the interim and annual financial statements and related SENS and press announcements.
> Monitored and reviewed the effectiveness of internal control systems, including IT financial auditing.
> Monitored and reviewed the staffing, work plan, resources and activities of the Internal Audit function.
> Reviewed and evaluated the effectiveness of the Internal Audit, financial risk management and compliance functions.
> Reviewed the Internal Audit charter.
> Considered the progress pertaining to the implementation of a combined assurance model.
> Reviewed and approved the proposed amendments to the combined assurance model to ensure its appropriate alignment to King IV.
> Reviewed the overall impact and requirements of King IV on financial reporting and the role of the Audit Committee.
> Reviewed and evaluated reports relating to findings of Internal Audit investigations and whistle-blowing arrangements.
> Reviewed developments in the Companies Act and corporate governance in relation to the Audit Committee’s functions.
> Assessed the effectiveness of the external audit process following the end of the annual audit cycle.
> Reviewed the integrated reporting process so as to consider factors and risks that may impact the integrity of the annual integrated report.
> Recommended the annual integrated report to the Board for approval.
STRUCTURE OF THE AUDIT COMMITTEEThe Committee was appointed by the Board of directors to hold office in respect of the financial year under review. The Committee also performs statutory duties on behalf of all relevant subsidiary companies of Netcare. The Committee members are all independent non-executive directors with adequate knowledge and experience to equip the Committee to perform its functions. The Committee satisfies the requirements as stipulated in the Companies Act.
The fees paid to the Committee members for the year ended 30 September 2017 were approved by the shareholders at the annual general meeting held on 3 February 2017.
Committee members attendance is detailed below.
Committee attendance
T Brewer Audit Committee Chair 3/3M Bower 3/3APH Jammine 3/3N Weltman 3/3
AUDIT COMMITTEE REPORTfor the year ended 30 September 2017
11NETCARE LIMITED
Consolidated annual financial statements 2017
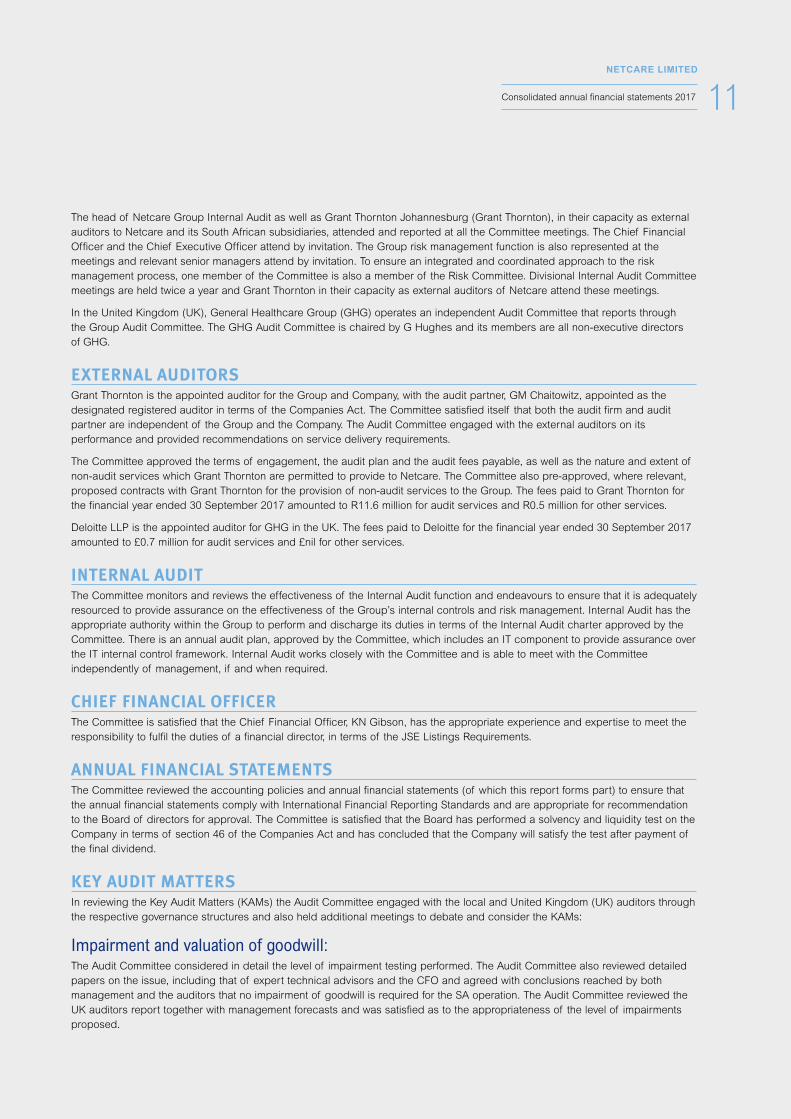
The head of Netcare Group Internal Audit as well as Grant Thornton Johannesburg (Grant Thornton), in their capacity as external auditors to Netcare and its South African subsidiaries, attended and reported at all the Committee meetings. The Chief Financial Officer and the Chief Executive Officer attend by invitation. The Group risk management function is also represented at the meetings and relevant senior managers attend by invitation. To ensure an integrated and coordinated approach to the risk management process, one member of the Committee is also a member of the Risk Committee. Divisional Internal Audit Committee meetings are held twice a year and Grant Thornton in their capacity as external auditors of Netcare attend these meetings.
In the United Kingdom (UK), General Healthcare Group (GHG) operates an independent Audit Committee that reports through the Group Audit Committee. The GHG Audit Committee is chaired by G Hughes and its members are all non-executive directors of GHG.
EXTERNAL AUDITORSGrant Thornton is the appointed auditor for the Group and Company, with the audit partner, GM Chaitowitz, appointed as the designated registered auditor in terms of the Companies Act. The Committee satisfied itself that both the audit firm and audit partner are independent of the Group and the Company. The Audit Committee engaged with the external auditors on its performance and provided recommendations on service delivery requirements.
The Committee approved the terms of engagement, the audit plan and the audit fees payable, as well as the nature and extent of non-audit services which Grant Thornton are permitted to provide to Netcare. The Committee also pre-approved, where relevant, proposed contracts with Grant Thornton for the provision of non-audit services to the Group. The fees paid to Grant Thornton for the financial year ended 30 September 2017 amounted to R11.6 million for audit services and R0.5 million for other services.
Deloitte LLP is the appointed auditor for GHG in the UK. The fees paid to Deloitte for the financial year ended 30 September 2017 amounted to £0.7 million for audit services and £nil for other services.
INTERNAL AUDITThe Committee monitors and reviews the effectiveness of the Internal Audit function and endeavours to ensure that it is adequately resourced to provide assurance on the effectiveness of the Group’s internal controls and risk management. Internal Audit has the appropriate authority within the Group to perform and discharge its duties in terms of the Internal Audit charter approved by the Committee. There is an annual audit plan, approved by the Committee, which includes an IT component to provide assurance over the IT internal control framework. Internal Audit works closely with the Committee and is able to meet with the Committee independently of management, if and when required.
CHIEF FINANCIAL OFFICERThe Committee is satisfied that the Chief Financial Officer, KN Gibson, has the appropriate experience and expertise to meet the responsibility to fulfil the duties of a financial director, in terms of the JSE Listings Requirements.
ANNUAL FINANCIAL STATEMENTSThe Committee reviewed the accounting policies and annual financial statements (of which this report forms part) to ensure that the annual financial statements comply with International Financial Reporting Standards and are appropriate for recommendation to the Board of directors for approval. The Committee is satisfied that the Board has performed a solvency and liquidity test on the Company in terms of section 46 of the Companies Act and has concluded that the Company will satisfy the test after payment of the final dividend.
KEY AUDIT MATTERSIn reviewing the Key Audit Matters (KAMs) the Audit Committee engaged with the local and United Kingdom (UK) auditors through the respective governance structures and also held additional meetings to debate and consider the KAMs:
Impairment and valuation of goodwill: The Audit Committee considered in detail the level of impairment testing performed. The Audit Committee also reviewed detailed papers on the issue, including that of expert technical advisors and the CFO and agreed with conclusions reached by both management and the auditors that no impairment of goodwill is required for the SA operation. The Audit Committee reviewed the UK auditors report together with management forecasts and was satisfied as to the appropriateness of the level of impairments proposed.
12NETCARE LIMITED
Consolidated annual financial statements 2017
Property, plant and equipment impairment and onerous lease provisions: The Audit Committee was updated in detail on the UKs underperformance compared to the 2017 budget. The Audit Committee was fully apprised of the audit procedures undertaken which included a detailed review of the appropriateness of management’s forecasts and key assumptions. The Audit Committee reviewed detailed papers provided by the CFO and additional expert advice relied upon and was satisfied as to the appropriateness of the level of impairments proposed.
Valuation of RPI swaps: The Audit Committee was advised that the computation of the UK RPI swap instruments involves significant judgement. The Audit Committee relied on the detailed updates provided in conjunction with the report of the valuation specialist and concluded that the valuation was appropriate.
The above key audit matters are detailed more fully in the External Auditor Report on pages 13 to 16.
OTHER MATTERSThe Audit Committee reviewed the King IV recommendations and will review the proposed roll out of processes to ensure the Group’s compliance with the revised code in 2017 and 2018. The Committee also critically reviewed mandatory audit firm rotation and is currently preparing for its implementation on 1 April 2023.
APPROVAL OF AUDIT COMMITTEE REPORTThe Committee hereby confirms that it has functioned in accordance with its terms of reference and discharged its duties for the financial year under review.
T BrewerAudit Committee Chair
Sandton
13 November 2017
Audit Committee report continued
13NETCARE LIMITED
Consolidated annual financial statements 2017
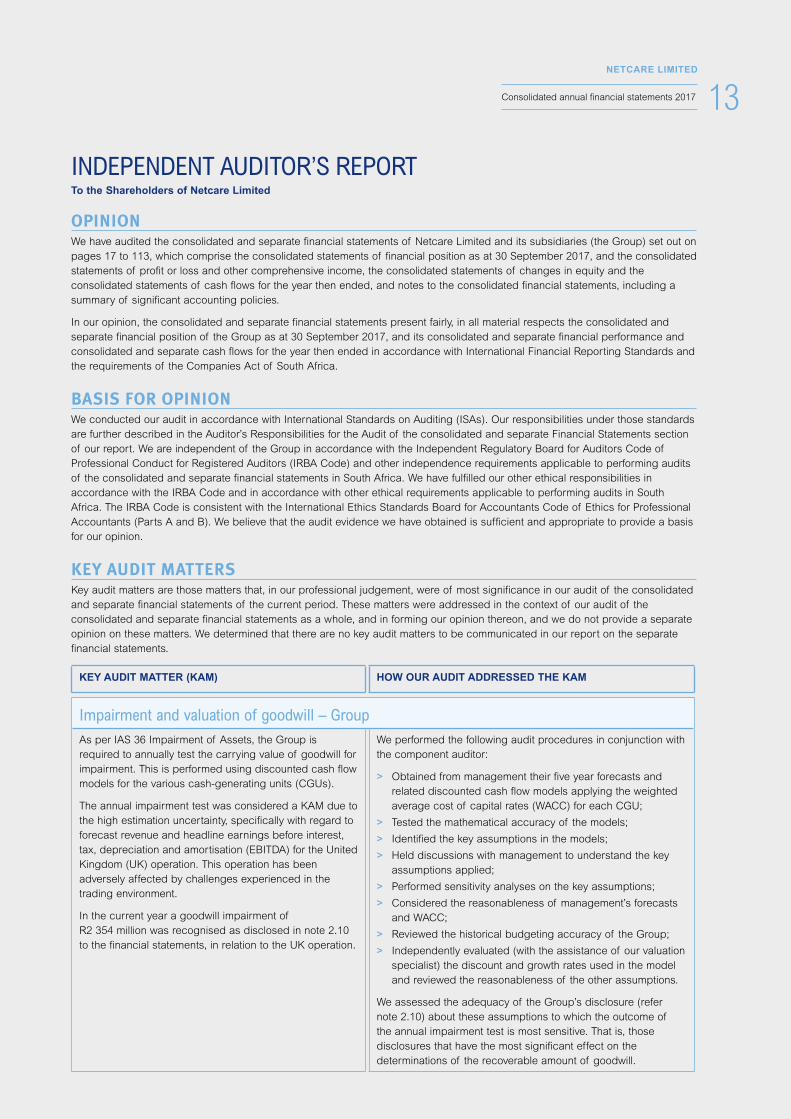
OPINIONWe have audited the consolidated and separate financial statements of Netcare Limited and its subsidiaries (the Group) set out on pages 17 to 113, which comprise the consolidated statements of financial position as at 30 September 2017, and the consolidated statements of profit or loss and other comprehensive income, the consolidated statements of changes in equity and the consolidated statements of cash flows for the year then ended, and notes to the consolidated financial statements, including a summary of significant accounting policies.
In our opinion, the consolidated and separate financial statements present fairly, in all material respects the consolidated and separate financial position of the Group as at 30 September 2017, and its consolidated and separate financial performance and consolidated and separate cash flows for the year then ended in accordance with International Financial Reporting Standards and the requirements of the Companies Act of South Africa.
BASIS FOR OPINIONWe conducted our audit in accordance with International Standards on Auditing (ISAs). Our responsibilities under those standards are further described in the Auditor’s Responsibilities for the Audit of the consolidated and separate Financial Statements section of our report. We are independent of the Group in accordance with the Independent Regulatory Board for Auditors Code of Professional Conduct for Registered Auditors (IRBA Code) and other independence requirements applicable to performing audits of the consolidated and separate financial statements in South Africa. We have fulfilled our other ethical responsibilities in accordance with the IRBA Code and in accordance with other ethical requirements applicable to performing audits in South Africa. The IRBA Code is consistent with the International Ethics Standards Board for Accountants Code of Ethics for Professional Accountants (Parts A and B). We believe that the audit evidence we have obtained is sufficient and appropriate to provide a basis for our opinion.
KEY AUDIT MATTERS Key audit matters are those matters that, in our professional judgement, were of most significance in our audit of the consolidated and separate financial statements of the current period. These matters were addressed in the context of our audit of the consolidated and separate financial statements as a whole, and in forming our opinion thereon, and we do not provide a separate opinion on these matters. We determined that there are no key audit matters to be communicated in our report on the separate financial statements.
KEY AUDIT MATTER (KAM) HOW OUR AUDIT ADDRESSED THE KAM
Impairment and valuation of goodwill – GroupAs per IAS 36 Impairment of Assets, the Group is required to annually test the carrying value of goodwill for impairment. This is performed using discounted cash flow models for the various cash-generating units (CGUs).
The annual impairment test was considered a KAM due to the high estimation uncertainty, specifically with regard to forecast revenue and headline earnings before interest, tax, depreciation and amortisation (EBITDA) for the United Kingdom (UK) operation. This operation has been adversely affected by challenges experienced in the trading environment.
In the current year a goodwill impairment of R2 354 million was recognised as disclosed in note 2.10 to the financial statements, in relation to the UK operation.
We performed the following audit procedures in conjunction with the component auditor:
> Obtained from management their five year forecasts and related discounted cash flow models applying the weighted average cost of capital rates (WACC) for each CGU;
> Tested the mathematical accuracy of the models;
> Identified the key assumptions in the models;
> Held discussions with management to understand the key assumptions applied;
> Performed sensitivity analyses on the key assumptions;
> Considered the reasonableness of management’s forecasts and WACC;
> Reviewed the historical budgeting accuracy of the Group;
> Independently evaluated (with the assistance of our valuation specialist) the discount and growth rates used in the model and reviewed the reasonableness of the other assumptions.
We assessed the adequacy of the Group’s disclosure (refer note 2.10) about these assumptions to which the outcome of the annual impairment test is most sensitive. That is, those disclosures that have the most significant effect on the determinations of the recoverable amount of goodwill.
INDEPENDENT AUDITOR’S REPORTTo the Shareholders of Netcare Limited

14NETCARE LIMITED
Consolidated annual financial statements 2017
KEY AUDIT MATTER (KAM) HOW OUR AUDIT ADDRESSED THE KAM
Property, pant and equipment impairment and onerous lease provisions – GroupIAS 36 Impairment of Assets, requires management to determine the recoverable amount of an asset when there is an indication that an asset may be impaired. IAS 37 Provisions, Contingent Liabilities and Contingent Assets requires the recognition of the present obligation under an onerous contract.
Forecasts prepared for the UK operation identified impairment indicators for property, plant and equipment and required the recognition of onerous lease provisions representing the excess, unavoidable costs of meeting the hospital lease obligations.
Management’s assessment of property, plant and equipment impairments and onerous lease provision requirements are considered a KAM due to several key judgements asserted, including the rent payable in cash flow forecasts, the long-term growth and discount rates applied in management’s model and the determination of individual hospital cash generating units. As disclosed in notes 2.8 and 7.1, the Group has impaired property, plant and equipment in the amount of R1 540 million and recognised a corresponding onerous lease provision in the amount of R1 669 million in relation to the UK operation.
We performed the following audit procedures in conjunction with the component auditor:
> Obtained management’s fixed asset impairment model;
> Assessed the appropriateness of management forecasts used and challenged the key assumptions;
> Reviewed the current year results for loss making hospitals and hospitals significantly behind budget to identify indicators of impairment;
> Reviewed the onerous lease model to gain assurance that any excess unavoidable costs compared to future economic benefits are being provided for.
We assessed the adequacy of the Group’s disclosure (refer notes 2.8 and 7.1) of the property, plant and equipment impairment balance and onerous lease provisions.
Valuation of Retail Price Index (“RPI”) Swap Instruments – GroupThe computation of the UK RPI swap instruments involves significant judgement. The valuation of these instruments is sensitive to future RPI expectations and also the expected timing and amount of any swap termination payment and has therefore been determined as a KAM.
The fair value of the UK RPI swap instruments of R1 133 million is recognised in accordance with IAS 39 Financial Instruments – Recognition and Measurement. It is valued on a mark-to-market basis determined by the counterparty and adjusted for the UK operation’s credit worthiness (DVA). The valuation of the UK RPI swap instruments takes into consideration management’s expectation of the future cash flow attributable to these swap instruments. In the current financial period, a credit of R937 million was recognised in the statement of profit or loss and other comprehensive income.
The future RPI rates used in the valuation of the RPI swap instruments have been premised on future forecasts available in the market.
We performed the following audit procedures in conjunction with the component auditor:
> Examined the correspondence between management and the independent expert, interviewed the expert and reviewed their final report;
> Involved a valuation specialist to assess the appropriateness of the RPI swap valuation and debit value adjustment;
> Reviewed the various contracts and agreements and held discussions with management.
> Challenged the assumptions that have been applied in the significantly judgemental assessment.
We assessed the adequacy of the Group’s disclosure (refer notes 6.3 and 6.4) of the UK RPI swap instruments.
Independent auditor’s report continued

15NETCARE LIMITED
Consolidated annual financial statements 2017
OTHER INFORMATIONThe directors are responsible for the other information. The other information comprises the Directors’ Report, the Audit Committee’s Report and the Company Secretary’s Certificate as required by the Companies Act of South Africa, which we obtained prior to the date of this report, and the Annual Report, which is expected to be made available to us after that date. Other information does not include the consolidated and separate financial statements and our auditor’s report thereon.
Our opinion on the consolidated and separate financial statements does not cover the other information and we do not express an audit opinion or any form of assurance conclusion thereon.
In connection with our audit of the consolidated and separate financial statements, our responsibility is to read the other information and, in doing so, consider whether the other information is materially inconsistent with the consolidated and separate financial statements or our knowledge obtained in the audit, or otherwise appears to be materially misstated. If, based on the work we have performed on the other information obtained prior to the date of this auditor’s report, we conclude that there is a material misstatement of this other information, we are required to report that fact. We have nothing to report in this regard.
RESPONSIBILITIES OF THE DIRECTORS FOR THE CONSOLIDATED AND SEPARATE FINANCIAL STATEMENTSThe directors are responsible for the preparation and fair presentation of the consolidated and separate financial statements in accordance with International Financial Reporting Standards and the requirements of the Companies Act of South Africa, and for such internal control as the directors determine is necessary to enable the preparation of consolidated and separate financial statements that are free from material misstatement, whether due to fraud or error.
In preparing the consolidated and separate financial statements, the directors are responsible for assessing the Group’s ability to continue as a going concern, disclosing, as applicable, matters related to going concern and using the going concern basis of accounting unless the directors either intend to liquidate the Group or to cease operations, or have no realistic alternative but to do so.
AUDITOR’S RESPONSIBILITIES FOR THE AUDIT OF THE CONSOLIDATED AND SEPARATE FINANCIAL STATEMENTSOur objectives are to obtain reasonable assurance about whether the consolidated and separate financial statements as a whole are free from material misstatement, whether due to fraud or error, and to issue an auditor’s report that includes our opinion. Reasonable assurance is a high level of assurance, but is not a guarantee that an audit conducted in accordance with ISAs will always detect a material misstatement when it exists. Misstatements can arise from fraud or error and are considered material if, individually or in the aggregate, they could reasonably be expected to influence the economic decisions of users taken on the basis of these consolidated and separate financial statements.
As part of an audit in accordance with ISAs, we exercise professional judgement and maintain professional scepticism throughout the audit. We also:
> Identify and assess the risks of material misstatement of the consolidated and separate financial statements, whether due to fraud or error; design and perform audit procedures responsive to those risks and, obtain audit evidence that is sufficient and appropriate to provide a basis for our opinion. The risk of not detecting a material misstatement resulting from fraud is higher than for one resulting from error, as fraud may involve collusion, forgery, intentional omissions, misrepresentations, or the override of internal control.
> Obtain an understanding of internal control relevant to the audit in order to design audit procedures that are appropriate in the circumstances, but not for the purpose of expressing an opinion on the effectiveness of the Group’s internal control.
> Evaluate the appropriateness of accounting policies used and the reasonableness of accounting estimates and related disclosures made by the directors.
> Conclude on the appropriateness of the directors’ use of the going concern basis of accounting and based on the audit evidence obtained, whether a material uncertainty exists related to events or conditions that may cast significant doubt on the Group’s ability to continue as a going concern. If we conclude that a material uncertainty exists, we are required to draw attention in our auditor’s report to the related disclosures in the consolidated and separate financial statements or, if such disclosures are inadequate, to modify our opinion. Our conclusions are based on the audit evidence obtained up to the date of our auditor’s report. However, future events or conditions may cause the Group to cease to continue as a going concern.
16NETCARE LIMITED
Consolidated annual financial statements 2017
> Evaluate the overall presentation, structure and content of the consolidated and separate financial statements, including the disclosures, and whether the consolidated and separate financial statements represent the underlying transactions and events in a manner that achieves fair presentation.
> Obtain sufficient appropriate audit evidence regarding the financial information of the entities or business activities within the Group to express an opinion on the consolidated financial statements. We are responsible for the direction, supervision and performance of the Group audit. We remain solely responsible for our audit opinion.
We communicate with the directors regarding, among other matters, the planned scope and timing of the audit and significant audit findings, including any significant deficiencies in internal control that we identify during our audit.
We also provide the directors with a statement that we have complied with relevant ethical requirements regarding independence, and to communicate with them all relationships and other matters that may reasonably be thought to bear on our independence, and where applicable, related safeguards.
From the matters communicated with the directors, we determine those matters that were of most significance in the audit of the consolidated and separate financial statements of the current period and are therefore the key audit matters. We describe these matters in our auditor’s report unless law or regulation precludes public disclosure about the matter or when, in extremely rare circumstances, we determine that a matter should not be communicated in our report because the adverse consequences of doing so would reasonably be expected to outweigh the public interest benefits of such communication.
REPORT ON OTHER LEGAL AND REGULATORY REQUIREMENTSIn terms of the IRBA Rule published in Government Gazette Number 39475 dated 4 December 2015, we report that Grant Thornton Johannesburg has been the auditor of Netcare Limited for 21 years.
Grant Thornton Johannesburg Registered Auditors Practice Number: 903485E
G M ChaitowitzPartnerRegistered AuditorChartered Accountant (SA)
17 November 2017
@ Grant ThorntonWanderers Office Park52 Corlett DriveIllovo 2196
Independent auditor’s report continued
17NETCARE LIMITED
Consolidated annual financial statements 2017
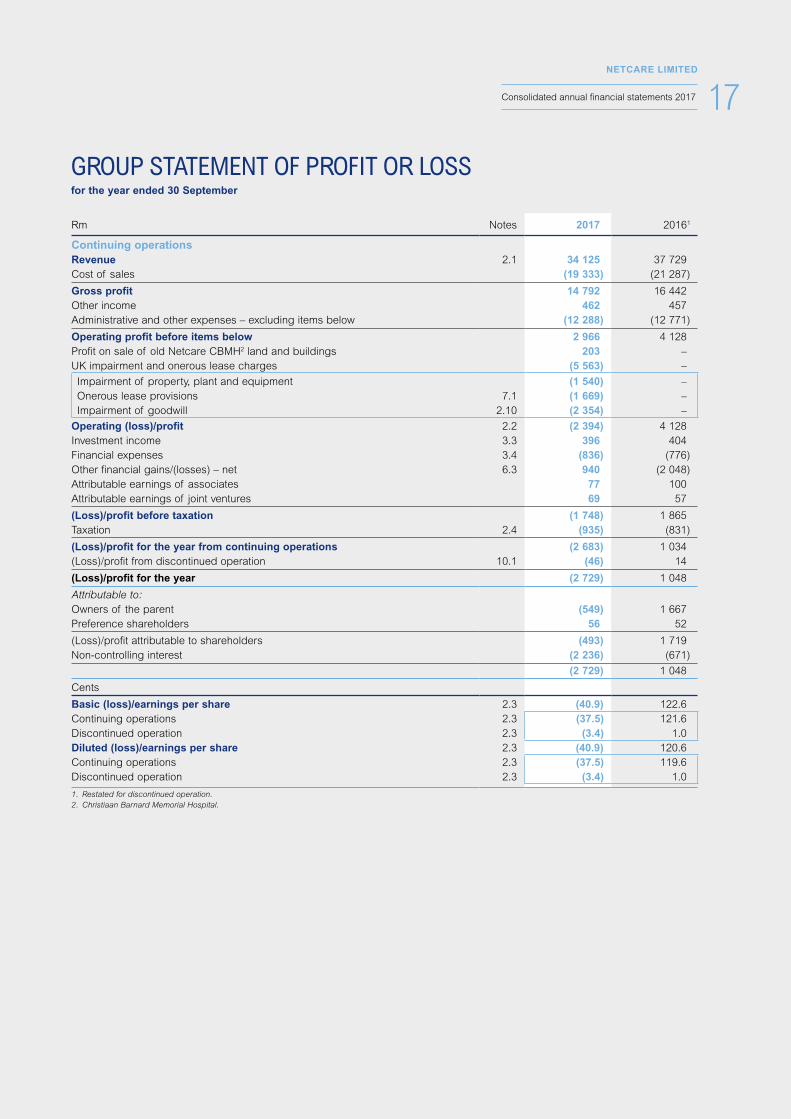
GROUP STATEMENT OF PROFIT OR LOSSfor the year ended 30 September
Rm Notes 2017 20161
Continuing operations Revenue 2.1 34 125 37 729 Cost of sales (19 333) (21 287)
Gross profit 14 792 16 442 Other income 462 457 Administrative and other expenses – excluding items below (12 288) (12 771)
Operating profit before items below 2 966 4 128 Profit on sale of old Netcare CBMH2 land and buildings 203 – UK impairment and onerous lease charges (5 563) –
Impairment of property, plant and equipment (1 540) – Onerous lease provisions 7.1 (1 669) – Impairment of goodwill 2.10 (2 354) –
Operating (loss)/profit 2.2 (2 394) 4 128 Investment income 3.3 396 404 Financial expenses 3.4 (836) (776)Other financial gains/(losses) – net 6.3 940 (2 048)Attributable earnings of associates 77 100Attributable earnings of joint ventures 69 57
(Loss)/profit before taxation (1 748) 1 865 Taxation 2.4 (935) (831)
(Loss)/profit for the year from continuing operations (2 683) 1 034 (Loss)/profit from discontinued operation 10.1 (46) 14
(Loss)/profit for the year (2 729) 1 048
Attributable to:Owners of the parent (549) 1 667 Preference shareholders 56 52
(Loss)/profit attributable to shareholders (493) 1 719 Non-controlling interest (2 236) (671)
(2 729) 1 048
Cents
Basic (loss)/earnings per share 2.3 (40.9) 122.6 Continuing operations 2.3 (37.5) 121.6 Discontinued operation 2.3 (3.4) 1.0 Diluted (loss)/earnings per share 2.3 (40.9) 120.6 Continuing operations 2.3 (37.5) 119.6 Discontinued operation 2.3 (3.4) 1.0
1. Restated for discontinued operation. 2. Christiaan Barnard Memorial Hospital.
18NETCARE LIMITED
Consolidated annual financial statements 2017
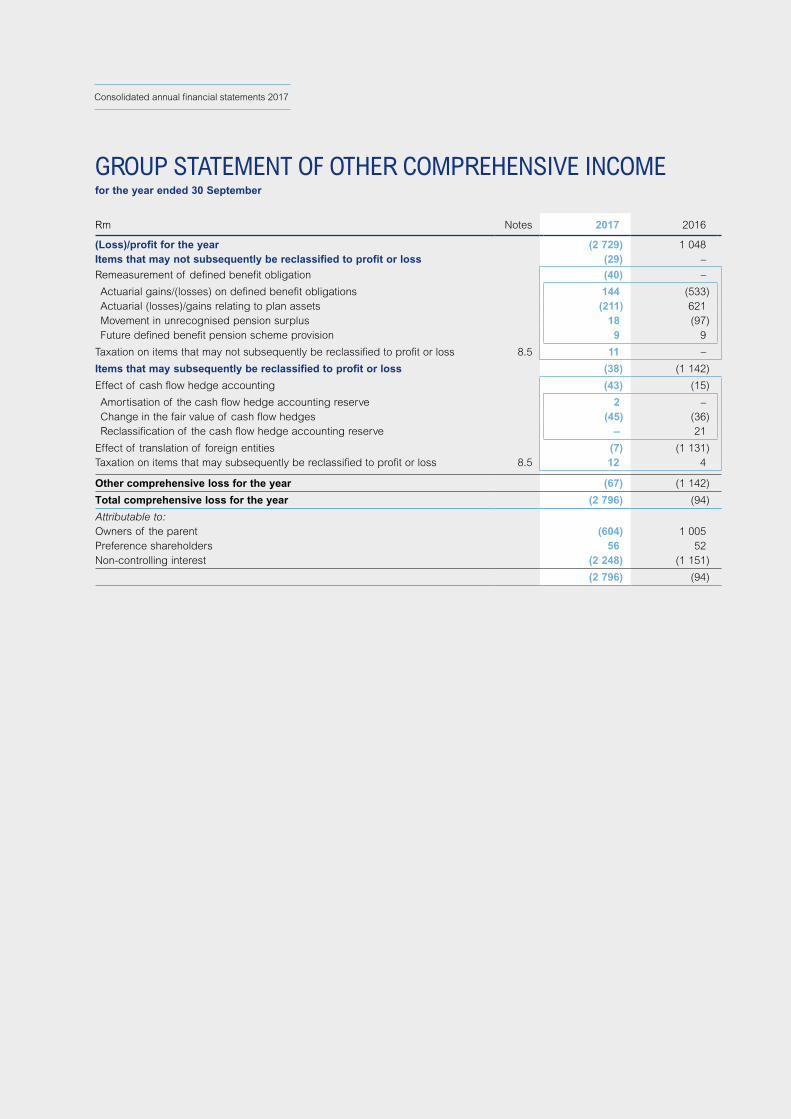
Rm Notes 2017 2016
(Loss)/profit for the year (2 729) 1 048 Items that may not subsequently be reclassified to profit or loss (29) –
Remeasurement of defined benefit obligation (40) –
Actuarial gains/(losses) on defined benefit obligations 144 (533) Actuarial (losses)/gains relating to plan assets (211) 621 Movement in unrecognised pension surplus 18 (97) Future defined benefit pension scheme provision 9 9
Taxation on items that may not subsequently be reclassified to profit or loss 8.5 11 –
Items that may subsequently be reclassified to profit or loss (38) (1 142)
Effect of cash flow hedge accounting (43) (15)
Amortisation of the cash flow hedge accounting reserve 2 – Change in the fair value of cash flow hedges (45) (36) Reclassification of the cash flow hedge accounting reserve – 21
Effect of translation of foreign entities (7) (1 131)Taxation on items that may subsequently be reclassified to profit or loss 8.5 12 4
Other comprehensive loss for the year (67) (1 142)
Total comprehensive loss for the year (2 796) (94)
Attributable to:Owners of the parent (604) 1 005 Preference shareholders 56 52 Non-controlling interest (2 248) (1 151)
(2 796) (94)
GROUP STATEMENT OF OTHER COMPREHENSIVE INCOMEfor the year ended 30 September

19NETCARE LIMITED
Consolidated annual financial statements 2017
Rm Notes 2017 2016
ASSETSNon-current assetsProperty, plant and equipment 2.8 13 908 14 421 Goodwill 2.10 1 705 3 942 Intangible assets 2.9 332 314 Investment in joint ventures 9.1 228 191 Investment in associates 9.2 817 721 Loans and receivables 9.3 1 831 1 652 Financial assets 6.1 17 34 Deferred lease assets 23 21 Deferred taxation 2.5 1 092 1 318
Total non-current assets 19 953 22 614
Current assetsLoans and receivables 9.3 53 58 Financial assets 6.1 1 – Inventories 5.2 984 1 019 Trade and other receivables 5.1 4 541 4 972 Taxation receivable 6 16 Cash and cash equivalents 3.2 2 531 1 980
8 116 8 045 Assets classified as held-for-sale 10.2 43 –
Total current assets 8 159 8 045
Total assets 28 112 30 659
EQUITY AND LIABILITIESCapital and reservesOrdinary share capital and premium 8.1 4 205 4 197 Treasury shares 8.2 (3 720) (3 768)Other reserves 2 481 2 465 Retained earnings 5 316 7 283
Equity attributable to owners of the parent 8 282 10 177 Preference share capital and premium 8.3 644 644 Non-controlling interest 8.4 (64) 2 188
Total shareholders’ equity 8 862 13 009
Non-current liabilitiesLong-term debt 3.1 7 232 6 132 Financial liabilities 6.2 1 187 2 158 Post-retirement benefit obligations 4.2 497 427 Deferred lease liabilities 149 124 Deferred taxation 2.5 1 049 1 207 Provisions 7.1 1 470 113
Total non-current liabilities 11 584 10 161
Current liabilitiesTrade and other payables 5.3 5 912 6 012 Short-term debt 3.1 1 678 1 390 Financial liabilities 6.2 9 5 Taxation payable 56 81 Bank overdrafts 3.2 6 1
7 661 7 489 Liabilities classified as held-for-sale 10.2 5 –
Total current liabilities 7 666 7 489
Total equity and liabilities 28 112 30 659
GROUP STATEMENT OF FINANCIAL POSITIONat 30 September
20NETCARE LIMITED
Consolidated annual financial statements 2017
Rm
Ordinaryshare
capital
Ordinaryshare
premiumTreasury
shares
Cash flow hedge
accounting reserve
Employee
share trust reserve
Foreign currency
translation reserve
Investment fair value
reserve
Share-based
payment reserve
Retained earnings
Equityattributable
to ownersof the parent
Preferenceshare
capital andpremium
Non-controlling
interest
Totalshareholders’
equity
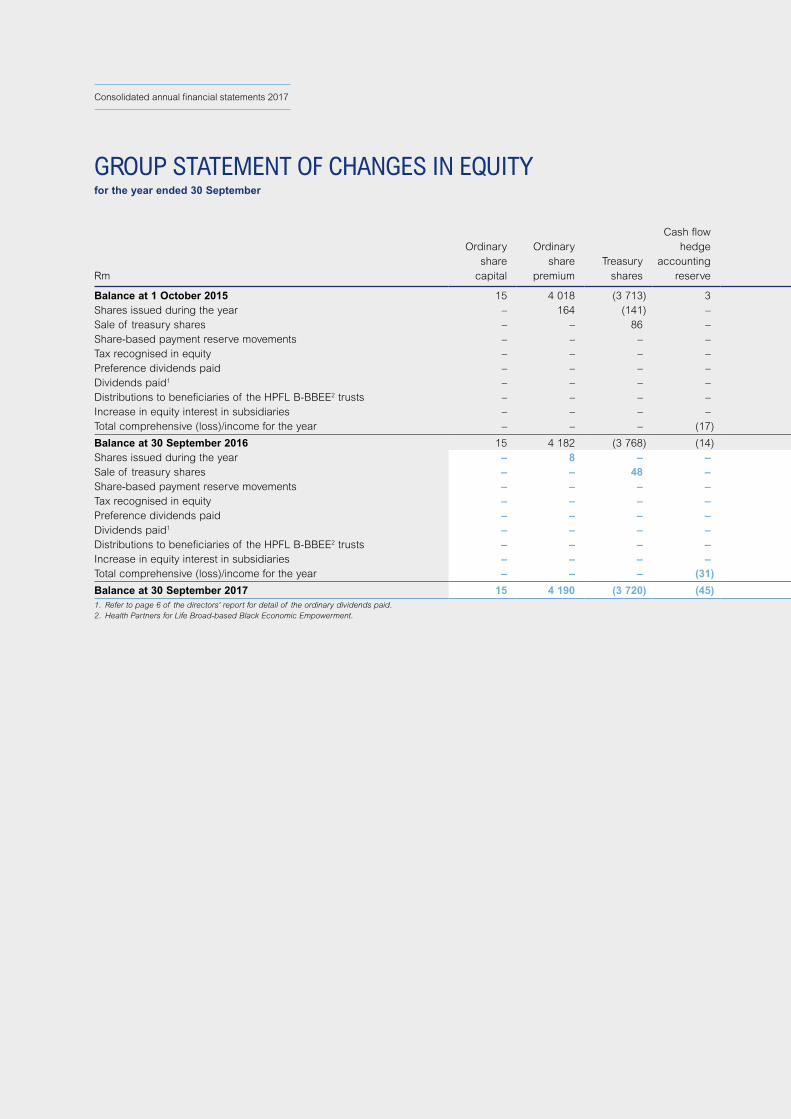
Balance at 1 October 2015 15 4 018 (3 713) 3 32 2 641 90 324 6 902 10 312 644 3 325 14 281 Shares issued during the year – 164 (141) – – – – – – 23 – – 23 Sale of treasury shares – – 86 – – – – – 15 101 – – 101 Share-based payment reserve movements – – – – – – – 33 – 33 – – 33 Tax recognised in equity – – – – – – – – 35 35 – – 35 Preference dividends paid – – – – – – – – – – (52) – (52)Dividends paid1 – – – – – – – – (1 250) (1 250) – (9) (1 259)Distributions to beneficiaries of the HPFL B-BBEE2 trusts – – – – – – – – (74) (74) – – (74)Increase in equity interest in subsidiaries – – – – – – – – (8) (8) – 23 15 Total comprehensive (loss)/income for the year – – – (17) – (641) – – 1 663 1 005 52 (1 151) (94)
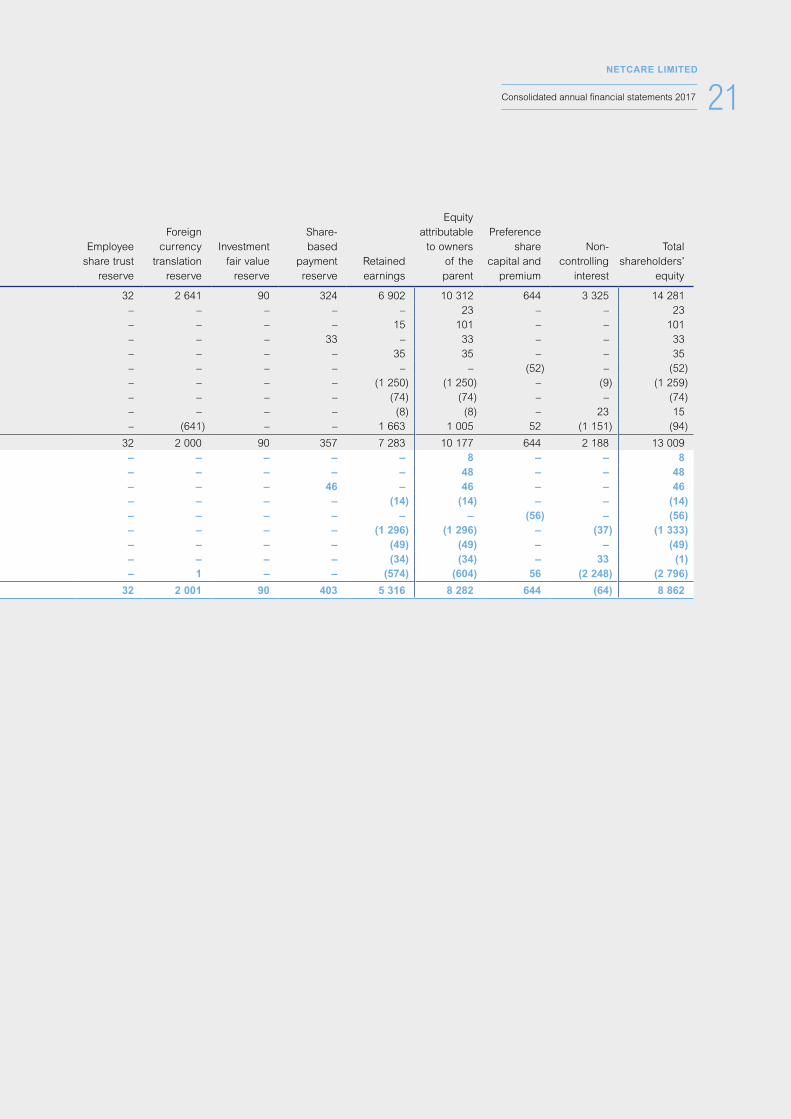
Balance at 30 September 2016 15 4 182 (3 768) (14) 32 2 000 90 357 7 283 10 177 644 2 188 13 009 Shares issued during the year – 8 – – – – – – – 8 – – 8 Sale of treasury shares – – 48 – – – – – – 48 – – 48 Share-based payment reserve movements – – – – – – – 46 – 46 – – 46 Tax recognised in equity – – – – – – – – (14) (14) – – (14)Preference dividends paid – – – – – – – – – – (56) – (56)Dividends paid1 – – – – – – – – (1 296) (1 296) – (37) (1 333)Distributions to beneficiaries of the HPFL B-BBEE2 trusts – – – – – – – – (49) (49) – – (49)Increase in equity interest in subsidiaries – – – – – – – – (34) (34) – 33 (1)Total comprehensive (loss)/income for the year – – – (31) – 1 – – (574) (604) 56 (2 248) (2 796)
Balance at 30 September 2017 15 4 190 (3 720) (45) 32 2 001 90 403 5 316 8 282 644 (64) 8 862 1. Refer to page 6 of the directors' report for detail of the ordinary dividends paid.2. Health Partners for Life Broad-based Black Economic Empowerment.
GROUP STATEMENT OF CHANGES IN EQUITYfor the year ended 30 September
21NETCARE LIMITED
Consolidated annual financial statements 2017
Rm
Ordinaryshare
capital
Ordinaryshare
premiumTreasury
shares
Cash flow hedge
accounting reserve
Employee
share trust reserve
Foreign currency
translation reserve
Investment fair value
reserve
Share-based
payment reserve
Retained earnings
Equityattributable
to ownersof the parent
Preferenceshare
capital andpremium
Non-controlling
interest
Totalshareholders’
equity
Balance at 1 October 2015 15 4 018 (3 713) 3 32 2 641 90 324 6 902 10 312 644 3 325 14 281 Shares issued during the year – 164 (141) – – – – – – 23 – – 23 Sale of treasury shares – – 86 – – – – – 15 101 – – 101 Share-based payment reserve movements – – – – – – – 33 – 33 – – 33 Tax recognised in equity – – – – – – – – 35 35 – – 35 Preference dividends paid – – – – – – – – – – (52) – (52)Dividends paid1 – – – – – – – – (1 250) (1 250) – (9) (1 259)Distributions to beneficiaries of the HPFL B-BBEE2 trusts – – – – – – – – (74) (74) – – (74)Increase in equity interest in subsidiaries – – – – – – – – (8) (8) – 23 15 Total comprehensive (loss)/income for the year – – – (17) – (641) – – 1 663 1 005 52 (1 151) (94)
Balance at 30 September 2016 15 4 182 (3 768) (14) 32 2 000 90 357 7 283 10 177 644 2 188 13 009 Shares issued during the year – 8 – – – – – – – 8 – – 8 Sale of treasury shares – – 48 – – – – – – 48 – – 48 Share-based payment reserve movements – – – – – – – 46 – 46 – – 46 Tax recognised in equity – – – – – – – – (14) (14) – – (14)Preference dividends paid – – – – – – – – – – (56) – (56)Dividends paid1 – – – – – – – – (1 296) (1 296) – (37) (1 333)Distributions to beneficiaries of the HPFL B-BBEE2 trusts – – – – – – – – (49) (49) – – (49)Increase in equity interest in subsidiaries – – – – – – – – (34) (34) – 33 (1)Total comprehensive (loss)/income for the year – – – (31) – 1 – – (574) (604) 56 (2 248) (2 796)
Balance at 30 September 2017 15 4 190 (3 720) (45) 32 2 001 90 403 5 316 8 282 644 (64) 8 862 1. Refer to page 6 of the directors' report for detail of the ordinary dividends paid.2. Health Partners for Life Broad-based Black Economic Empowerment.
22NETCARE LIMITED
Consolidated annual financial statements 2017
Rm Notes 2017 2016
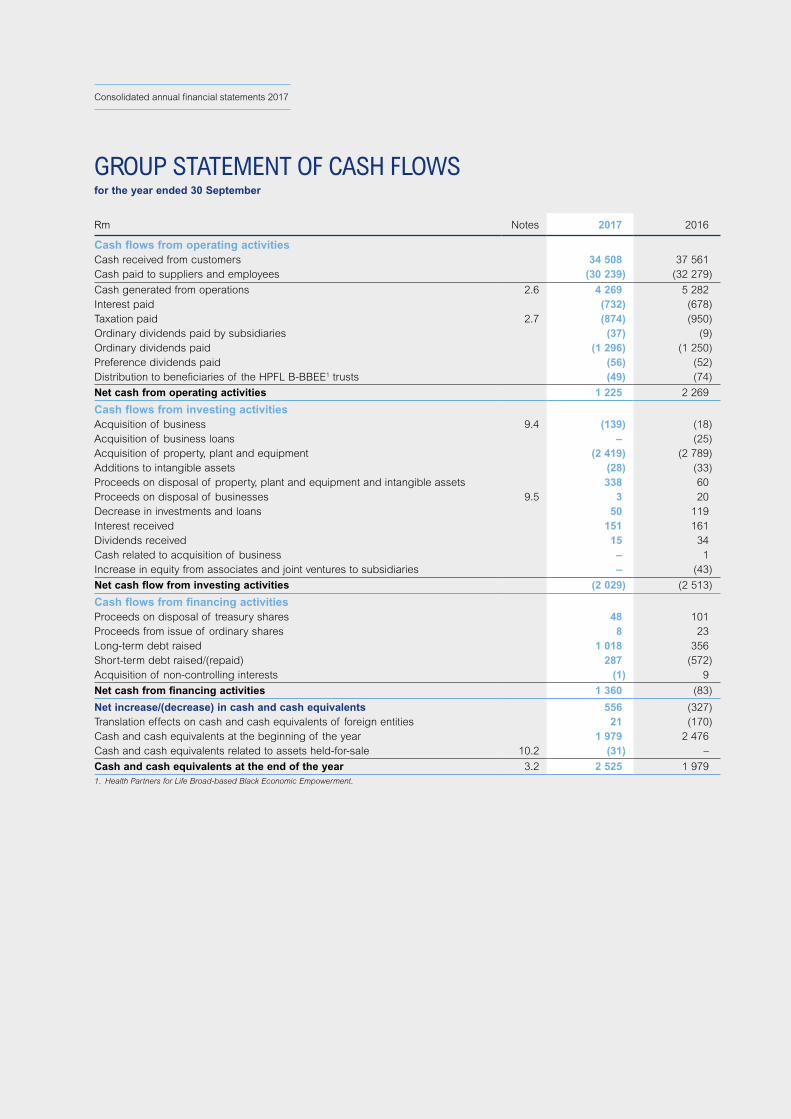
Cash flows from operating activities Cash received from customers 34 508 37 561 Cash paid to suppliers and employees (30 239) (32 279)
Cash generated from operations 2.6 4 269 5 282 Interest paid (732) (678)Taxation paid 2.7 (874) (950)Ordinary dividends paid by subsidiaries (37) (9)Ordinary dividends paid (1 296) (1 250)Preference dividends paid (56) (52)Distribution to beneficiaries of the HPFL B-BBEE1 trusts (49) (74)
Net cash from operating activities 1 225 2 269
Cash flows from investing activities Acquisition of business 9.4 (139) (18)Acquisition of business loans – (25)Acquisition of property, plant and equipment (2 419) (2 789)Additions to intangible assets (28) (33)Proceeds on disposal of property, plant and equipment and intangible assets 338 60 Proceeds on disposal of businesses 9.5 3 20 Decrease in investments and loans 50 119 Interest received 151 161 Dividends received 15 34 Cash related to acquisition of business – 1 Increase in equity from associates and joint ventures to subsidiaries – (43)
Net cash flow from investing activities (2 029) (2 513)
Cash flows from financing activities Proceeds on disposal of treasury shares 48 101 Proceeds from issue of ordinary shares 8 23 Long-term debt raised 1 018 356 Short-term debt raised/(repaid) 287 (572)Acquisition of non-controlling interests (1) 9
Net cash from financing activities 1 360 (83)
Net increase/(decrease) in cash and cash equivalents 556 (327)Translation effects on cash and cash equivalents of foreign entities 21 (170)Cash and cash equivalents at the beginning of the year 1 979 2 476 Cash and cash equivalents related to assets held-for-sale 10.2 (31) –
Cash and cash equivalents at the end of the year 3.2 2 525 1 979 1. Health Partners for Life Broad-based Black Economic Empowerment.
GROUP STATEMENT OF CASH FLOWSfor the year ended 30 September
23NETCARE LIMITED
Consolidated annual financial statements 2017
NOTES TO THE GROUP ANNUAL FINANCIAL STATEMENTS Page Page
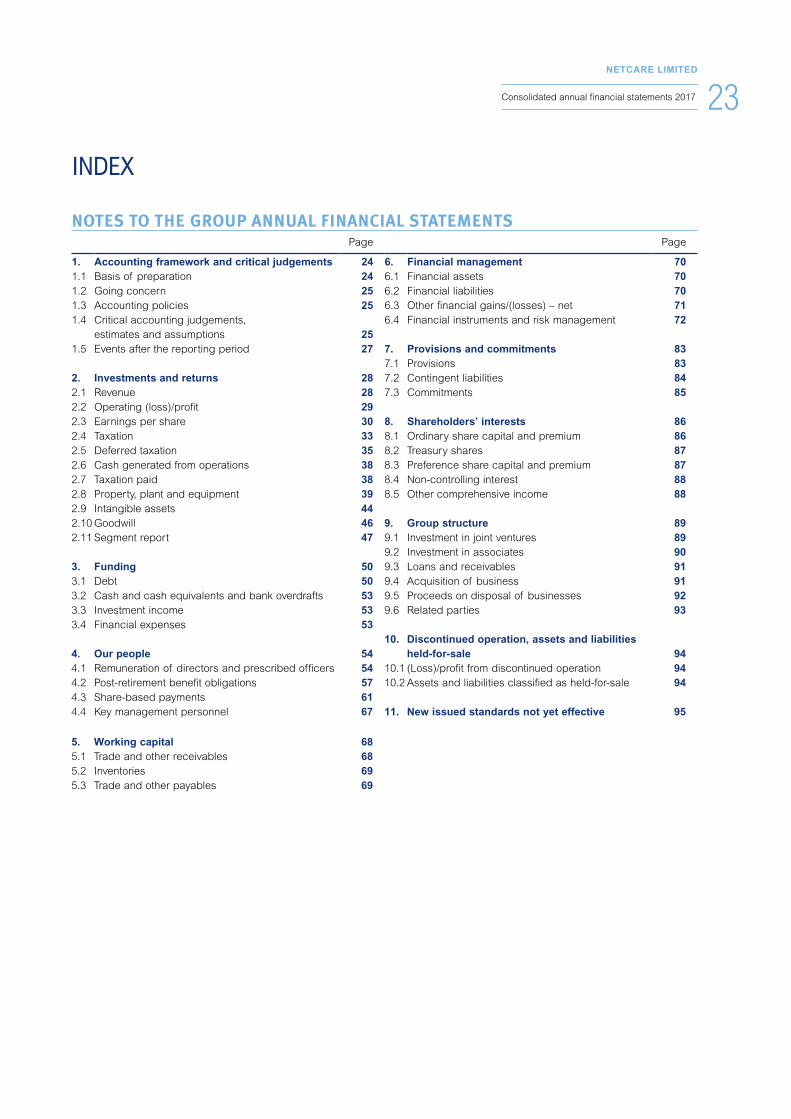
1. Accounting framework and critical judgements 24 6. Financial management 701.1 Basis of preparation 24 6.1 Financial assets 701.2 Going concern 25 6.2 Financial liabilities 701.3 Accounting policies 25 6.3 Other financial gains/(losses) – net 711.4 Critical accounting judgements, 6.4 Financial instruments and risk management 72
estimates and assumptions 251.5 Events after the reporting period 27 7. Provisions and commitments 83
7.1 Provisions 832. Investments and returns 28 7.2 Contingent liabilities 842.1 Revenue 28 7.3 Commitments 852.2 Operating (loss)/profit 292.3 Earnings per share 30 8. Shareholders’ interests 862.4 Taxation 33 8.1 Ordinary share capital and premium 862.5 Deferred taxation 35 8.2 Treasury shares 872.6 Cash generated from operations 38 8.3 Preference share capital and premium 872.7 Taxation paid 38 8.4 Non-controlling interest 882.8 Property, plant and equipment 39 8.5 Other comprehensive income 882.9 Intangible assets 442.10 Goodwill 46 9. Group structure 892.11 Segment report 47 9.1 Investment in joint ventures 89
9.2 Investment in associates 903. Funding 50 9.3 Loans and receivables 913.1 Debt 50 9.4 Acquisition of business 913.2 Cash and cash equivalents and bank overdrafts 53 9.5 Proceeds on disposal of businesses 923.3 Investment income 53 9.6 Related parties 933.4 Financial expenses 53
10. Discontinued operation, assets and liabilities4. Our people 54 held-for-sale 944.1 Remuneration of directors and prescribed officers 54 10.1 (Loss)/profit from discontinued operation 944.2 Post-retirement benefit obligations 57 10.2 Assets and liabilities classified as held-for-sale 944.3 Share-based payments 614.4 Key management personnel 67 11. New issued standards not yet effective 95
5. Working capital 685.1 Trade and other receivables 685.2 Inventories 695.3 Trade and other payables 69
INDEX
24NETCARE LIMITED
Consolidated annual financial statements 2017
1. ACCOUNTING FRAMEWORK AND CRITICAL JUDGEMENTS
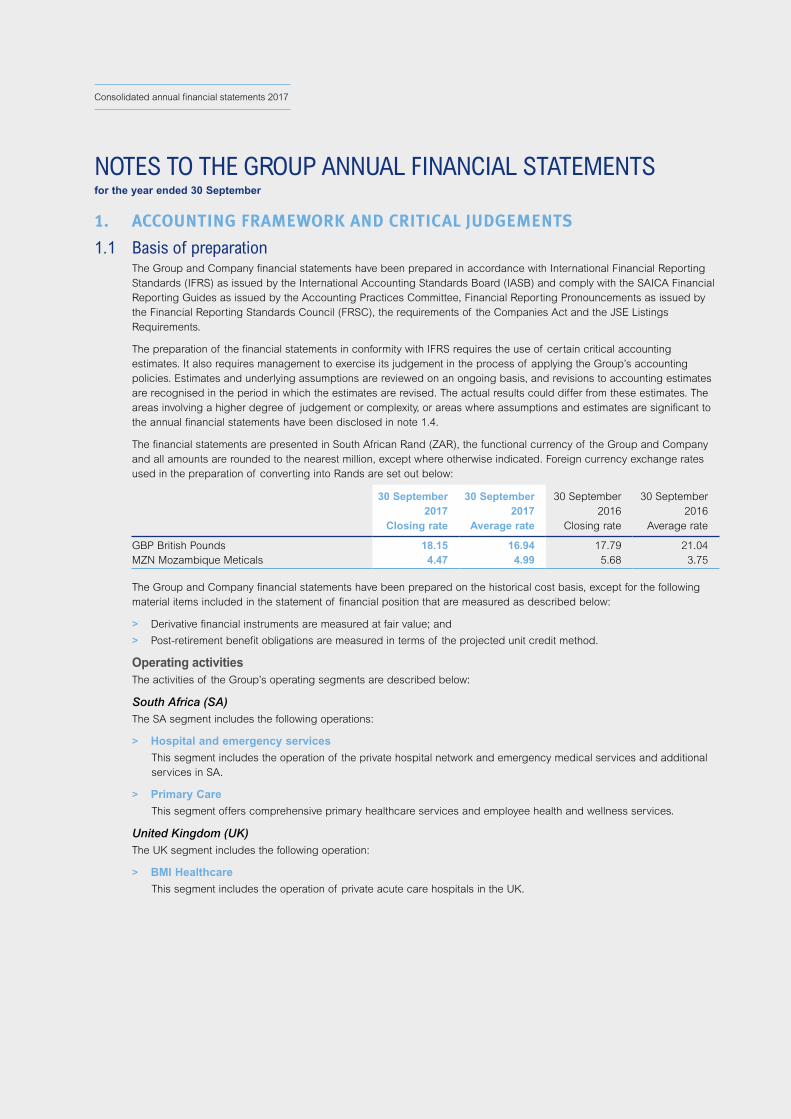
1.1 Basis of preparation The Group and Company financial statements have been prepared in accordance with International Financial Reporting
Standards (IFRS) as issued by the International Accounting Standards Board (IASB) and comply with the SAICA Financial Reporting Guides as issued by the Accounting Practices Committee, Financial Reporting Pronouncements as issued by the Financial Reporting Standards Council (FRSC), the requirements of the Companies Act and the JSE Listings Requirements.
The preparation of the financial statements in conformity with IFRS requires the use of certain critical accounting estimates. It also requires management to exercise its judgement in the process of applying the Group’s accounting policies. Estimates and underlying assumptions are reviewed on an ongoing basis, and revisions to accounting estimates are recognised in the period in which the estimates are revised. The actual results could differ from these estimates. The areas involving a higher degree of judgement or complexity, or areas where assumptions and estimates are significant to the annual financial statements have been disclosed in note 1.4.
The financial statements are presented in South African Rand (ZAR), the functional currency of the Group and Company and all amounts are rounded to the nearest million, except where otherwise indicated. Foreign currency exchange rates used in the preparation of converting into Rands are set out below:
30 September 2017
Closing rate
30 September 2017
Average rate
30 September 2016
Closing rate
30 September 2016
Average rate
GBP British Pounds 18.15 16.94 17.79 21.04MZN Mozambique Meticals 4.47 4.99 5.68 3.75
The Group and Company financial statements have been prepared on the historical cost basis, except for the following material items included in the statement of financial position that are measured as described below:
> Derivative financial instruments are measured at fair value; and
> Post-retirement benefit obligations are measured in terms of the projected unit credit method.
Operating activities The activities of the Group’s operating segments are described below:
South Africa (SA) The SA segment includes the following operations:
> Hospital and emergency services
This segment includes the operation of the private hospital network and emergency medical services and additional services in SA.
> Primary Care
This segment offers comprehensive primary healthcare services and employee health and wellness services.
United Kingdom (UK) The UK segment includes the following operation:
> BMI Healthcare
This segment includes the operation of private acute care hospitals in the UK.
NOTES TO THE GROUP ANNUAL FINANCIAL STATEMENTSfor the year ended 30 September

25NETCARE LIMITED
Consolidated annual financial statements 2017
1. ACCOUNTING FRAMEWORK AND CRITICAL JUDGEMENTS continued
1.2 Going concern The directors consider it appropriate to adopt the going concern basis in preparing the Group and Company’s annual
financial statements.
1.3 Accounting policies The accounting policies applied in the preparation of these Group and Company financial statements are consistent in all
material respects with those applied for the year ended 30 September 2016.
Accounting policies for which no choice is permitted in terms of International Financial Reporting Standards have been included only if management concluded that the disclosure would assist users in understanding the financial statements as a whole, and taking into account the materiality of the item being discussed. Accounting policies which are not applicable from time to time, have been removed, but will be included if the type of transaction occurs in future or becomes material. Accounting policies that refer to “consolidated" or "Group” apply equally to the Company financial statements where relevant.
No new, revised or amended standards were implemented during the financial reporting period ended 30 September 2017.
1.4 Critical accounting judgements, estimates and assumptions UK impairment and onerous lease charges Trading conditions in the UK were challenging during 2017, particularly in the second half of the financial year, where the
acceleration of demand management initiatives implemented by both the National Health Service (NHS) and private medical insurers affected patient activity, in combination with lower tariffs for NHS work effective from 1 April 2017, and further change in case mix in favour of more day cases. Inpatient and day caseload grew 0.5% year-on-year. However, the underlying mix comprised of growth in day case admissions and a reduction in inpatient admissions, while continued tariff pressure has led to a decline in revenue per case.
The combination of the weaker UK trading results and difficult trading environment informed the revision of BMI Healthcare’s medium-term forecasts and business plan. In light of these conditions a review of the carrying value of property, plant and equipment and goodwill, as well as a consideration of onerous lease obligations within BMI Healthcare was undertaken.
In the application of the Group’s accounting policies, judgements, estimates and assumptions are required to be made about the carrying amounts of assets and liabilities that are not readily apparent from other sources. The estimates and associated assumptions are based on historical experience and other factors that are considered to be relevant. Actual results may differ from these estimates.
The estimates and underlying assumptions are reviewed on an ongoing basis. Revisions to accounting estimates are recognised in the year in which the estimate is revised if the revision affects only that year, or in the year of the revision and future years if the revision affects both current and future years. The following are the critical judgements that have been made in the process of applying the Group’s accounting policies, and that have the most significant effect on the amounts recognised in the financial statements:
Critical accounting judgements Valuation of Retail Price Index (RPI) swap instruments – methodology BMI Healthcare (BMI) leases 35 of its hospital properties from Hospital Topco. BMI holds certain RPI swap instruments
which are used to achieve the fixed rental uplifts on the leases with Hospital Topco. IFRS require these to be carried at their fair value at each balance sheet date. The fair value of the swap instruments has been determined based on the mark to market valuation (MTM) provided by the counterparty and, where appropriate, an adjustment to reflect BMI's credit risk profile. At 30 September 2016, the fair value (and therefore balance sheet amount) was the MTM at that date, as this was the amount at which the swap instruments were expected to be settled shortly after that date under a then contemplated rent reduction transaction. As the settlement of the swap instruments during the subsequent financial year was considered to be probable, no adjustment was made to reflect BMI's credit risk profile. As the swap instruments were not settled during the year ended 30 September 2017 and no settlement of the swap instruments is currently anticipated, an adjustment to reflect BMI's credit risk profile has been applied to the MTM in arriving at the fair value of these swap instruments in accordance with the requirements of IFRS 13.
26NETCARE LIMITED
Consolidated annual financial statements 2017
1. ACCOUNTING FRAMEWORK AND CRITICAL JUDGEMENTS continued
1.4 Critical accounting judgements, estimates and assumptions continued Impairment of assets Goodwill is considered for impairment at least annually. Property, plant and equipment, and other intangible assets are
considered for impairment if there is any reason to believe that impairment may be necessary.
All BMI hospital fixed assets are grouped into cash-generating units (CGUs), being each individual hospital operation, and tested for impairment, if any indicators of impairment exist. Following this goodwill, constituting BMI's hospital operations as a whole, is tested for impairment.
BMI assessed the recoverable values of each CGU as at 30 September 2017 using forecasts of the pre-rent profitability of each hospital unit, the anticipated maintenance capital expenditure for each hospital, and assessments of the probable rental cash flows under their leases, using a weighted average probability assessment.
Onerous lease provision BMI assessed its leases as at 30 September 2017 using forecasts of the pre-rent profitability of each hospital unit, the
anticipated maintenance capital expenditure for each hospital, and assessments of the probable rental cash flows under the Group’s leases, using a weighted average probability assessment.
Key sources of estimation uncertainty Valuation of RPI swap instruments The fair value of the RPI swaps at 30 September 2017 was R1 133 million (2016: R2 129 million). The valuation of these
swap instruments is sensitive to future RPI expectations and also the expected timing and amount of any swap instrument termination. The future RPI rates were based on future forecasts available in the market at the balance sheet date.
Future cash flows The Group tests its fixed assets for impairment when indicators of impairment exist and goodwill is tested annually. The
recoverable amounts of assets (including goodwill), individual cash-generating units (CGUs) and groups of CGUs are based on the Group’s best estimate of the future cash flows relating to those assets or CGUs, including assessments of the probable rental cash flows under the Group’s leases, discounted to reflect the time value of money and the risks specific to the asset, group of assets or contracts and leases under consideration. The resulting impairment calculations are highly sensitive to changes in the timing or quantum of future cash flows, the discount rates used and the assumed long-term growth rate. In particular, changes in one or more of these inputs to management’s estimations could result in material reversals of impairment losses, or the recognition of further non-cash impairment charges. See notes 2.8 and 2.10 for further discussion of the methodology and rationale for selecting these inputs to management’s estimations.
The Group also recognises provisions for onerous leases on its hospital sites when the unavoidable costs of meeting the obligations under the contract (rental costs) exceed the economic benefits expected to be received under it. These economic benefits are estimated using the future cash flows described above. The value of the subsequent onerous lease provision is also highly sensitive to changes in the quantum and timing of cash flows, the discount rates and the long-term growth rate. Any change in these inputs could result in material changes to the value of the onerous lease provisions recognised, with consequent non-cash credits or charges to operating expenses. See note 7.1 for further discussion of the approach taken to the recognition of provisions for onerous leases.
Disclosure of impairments and onerous lease charges Due to the significance of these adjustments, both quantitatively and qualitatively, we have presented them separately on
the face of the statement of profit or loss, together with the profit on the sale of the old Netcare Christiaan Barnard Memorial Hospital land and buildings.
We believe that this presentation is in line with IAS 1: Presentation of Financial Statements, which notes that additional line items may be presented in the statement of profit or loss when such presentation is relevant to an understanding of the entity's financial performance.
Additional details relating to the calculation of the impairments and onerous lease charges can be found in the relevant notes:
Note Asset impairment 2.8 Goodwill impairment 2.10 Onerous lease charges 7.1
Notes to the Group annual financial statements continuedfor the year ended 30 September
27NETCARE LIMITED
Consolidated annual financial statements 2017
1. ACCOUNTING FRAMEWORK AND CRITICAL JUDGEMENTS continued
1.5 Events after the reporting period In September 2017, Netcare reached an agreement with Apax and the other minority shareholders in General Healthcare
Group (GHG) to acquire their interests in GHG, such that it will become a wholly-owned subsidiary of Netcare once all conditions precedent have been met. The summary terms of the agreement with the GHG minority shareholders are as follows:
> There is no immediate cash payment. The selling parties will receive the right to subscribe for 67 million shares in Netcare over the course of the next five years.
> The right to subscribe for Netcare shares is subject to BMI Healthcare achieving an annualised EBITDA of £65 million.
> In the event that the selling parties elect to exercise their right to subscribe for Netcare shares, they will need to pay to Netcare a strike price being the higher of R26.25 per share or a 25% premium to the Volume Weighted Average Price of Netcare shares during the 10 day period following the release of Netcare's 2017 full year results on 20 November 2017.
> This transaction is not a categorised transaction in terms of the JSE Listings Requirements.
Once the conditions precedent are met, GHG PropCo 2, currently accounted for as an associate, will be consolidated as a subsidiary.
In light of the impending acquisition of the GHG minorities and the difficult trading environment in the UK, Netcare has assisted BMI Healthcare in the renegotiation of the terms of its banking facilities. Netcare has committed to inject £20 million into the business and to underpin certain facilities. These renegotiated terms are in an advanced stage of being formalised.
The directors are not aware of any other matters or circumstances arising since the end of the financial year, not otherwise dealt with in the Group's annual financial statements, which significantly affect the financial position at 30 September 2017 or the results of its operations or cash flows for the year then ended.
28NETCARE LIMITED
Consolidated annual financial statements 2017
2. INVESTMENTS AND RETURNS
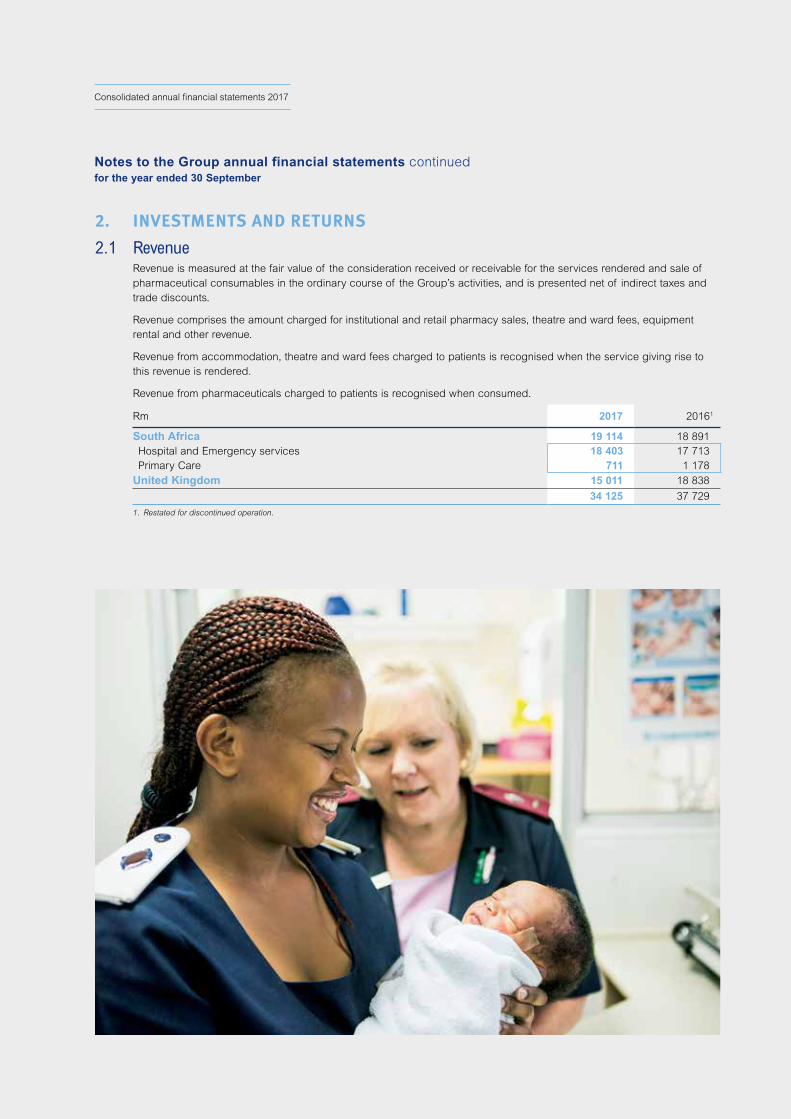
2.1 Revenue Revenue is measured at the fair value of the consideration received or receivable for the services rendered and sale of
pharmaceutical consumables in the ordinary course of the Group’s activities, and is presented net of indirect taxes and trade discounts.
Revenue comprises the amount charged for institutional and retail pharmacy sales, theatre and ward fees, equipment rental and other revenue.
Revenue from accommodation, theatre and ward fees charged to patients is recognised when the service giving rise to this revenue is rendered.
Revenue from pharmaceuticals charged to patients is recognised when consumed.
Rm 2017 20161
South Africa 19 114 18 891 Hospital and Emergency services 18 403 17 713 Primary Care 711 1 178 United Kingdom 15 011 18 838
34 125 37 729
1. Restated for discontinued operation.
Notes to the Group annual financial statements continuedfor the year ended 30 September
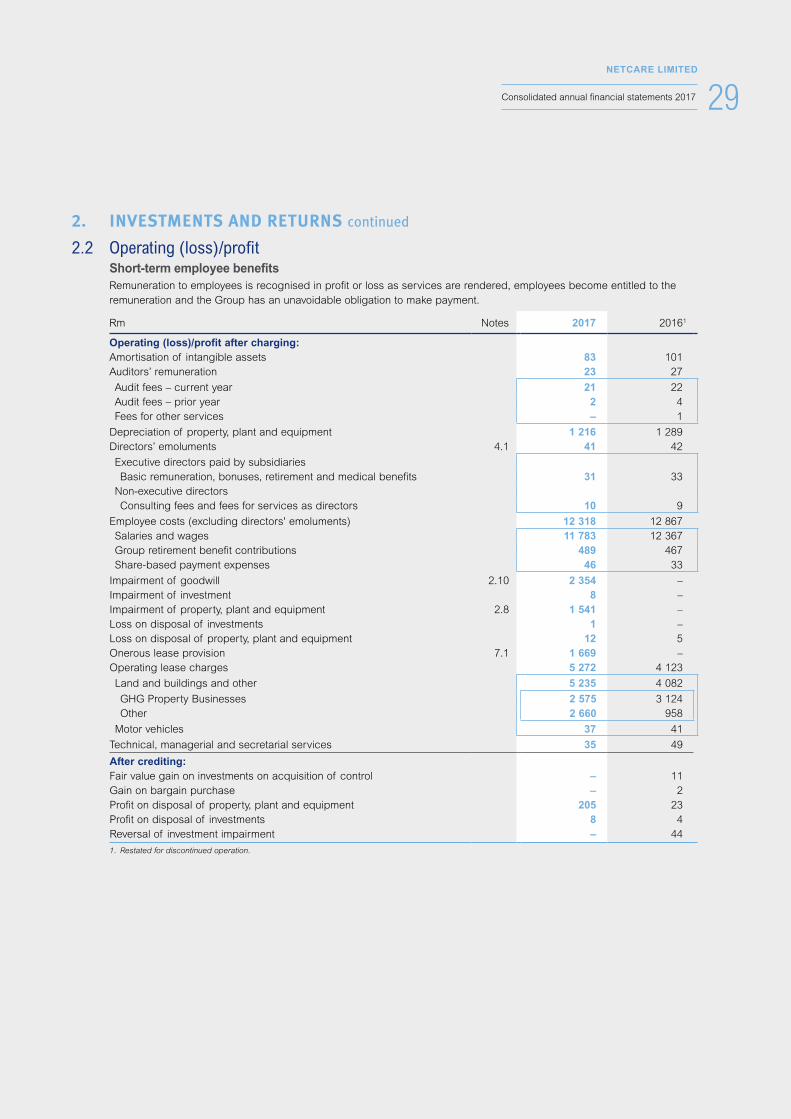
29NETCARE LIMITED
Consolidated annual financial statements 2017
2. INVESTMENTS AND RETURNS continued
2.2 Operating (loss)/profit Short-term employee benefits Remuneration to employees is recognised in profit or loss as services are rendered, employees become entitled to the
remuneration and the Group has an unavoidable obligation to make payment.
Rm Notes 2017 20161
Operating (loss)/profit after charging:Amortisation of intangible assets 83 101 Auditors’ remuneration 23 27
Audit fees – current year 21 22 Audit fees – prior year 2 4 Fees for other services – 1
Depreciation of property, plant and equipment 1 216 1 289 Directors’ emoluments 4.1 41 42
Executive directors paid by subsidiaries Basic remuneration, bonuses, retirement and medical benefits 31 33 Non-executive directors Consulting fees and fees for services as directors 10 9
Employee costs (excluding directors' emoluments) 12 318 12 867 Salaries and wages 11 783 12 367 Group retirement benefit contributions 489 467 Share-based payment expenses 46 33
Impairment of goodwill 2.10 2 354 – Impairment of investment 8 – Impairment of property, plant and equipment 2.8 1 541 – Loss on disposal of investments 1 – Loss on disposal of property, plant and equipment 12 5 Onerous lease provision 7.1 1 669 – Operating lease charges 5 272 4 123
Land and buildings and other 5 235 4 082
GHG Property Businesses 2 575 3 124 Other 2 660 958
Motor vehicles 37 41
Technical, managerial and secretarial services 35 49
After crediting:Fair value gain on investments on acquisition of control – 11 Gain on bargain purchase – 2 Profit on disposal of property, plant and equipment 205 23 Profit on disposal of investments 8 4 Reversal of investment impairment – 44
1. Restated for discontinued operation.
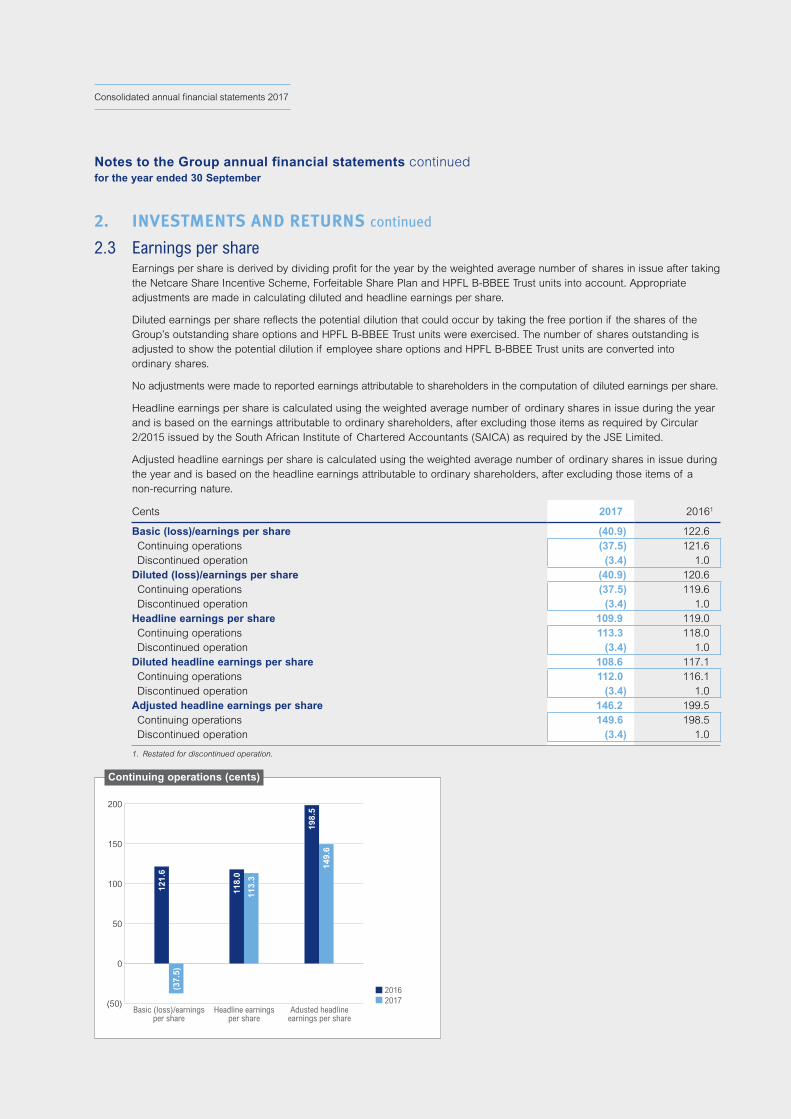
30NETCARE LIMITED
Consolidated annual financial statements 2017
2. INVESTMENTS AND RETURNS continued
2.3 Earnings per share Earnings per share is derived by dividing profit for the year by the weighted average number of shares in issue after taking
the Netcare Share Incentive Scheme, Forfeitable Share Plan and HPFL B-BBEE Trust units into account. Appropriate adjustments are made in calculating diluted and headline earnings per share.
Diluted earnings per share reflects the potential dilution that could occur by taking the free portion if the shares of the Group’s outstanding share options and HPFL B-BBEE Trust units were exercised. The number of shares outstanding is adjusted to show the potential dilution if employee share options and HPFL B-BBEE Trust units are converted into ordinary shares.
No adjustments were made to reported earnings attributable to shareholders in the computation of diluted earnings per share.
Headline earnings per share is calculated using the weighted average number of ordinary shares in issue during the year and is based on the earnings attributable to ordinary shareholders, after excluding those items as required by Circular 2/2015 issued by the South African Institute of Chartered Accountants (SAICA) as required by the JSE Limited.
Adjusted headline earnings per share is calculated using the weighted average number of ordinary shares in issue during the year and is based on the headline earnings attributable to ordinary shareholders, after excluding those items of a non-recurring nature.
Cents 2017 20161
Basic (loss)/earnings per share (40.9) 122.6 Continuing operations (37.5) 121.6 Discontinued operation (3.4) 1.0 Diluted (loss)/earnings per share (40.9) 120.6 Continuing operations (37.5) 119.6 Discontinued operation (3.4) 1.0 Headline earnings per share 109.9 119.0 Continuing operations 113.3 118.0 Discontinued operation (3.4) 1.0 Diluted headline earnings per share 108.6 117.1 Continuing operations 112.0 116.1 Discontinued operation (3.4) 1.0 Adjusted headline earnings per share 146.2 199.5 Continuing operations 149.6 198.5 Discontinued operation (3.4) 1.0
1. Restated for discontinued operation.
2016 2017(50)
0
50
100
150
200
121.
6
Basic (loss)/earningsper share
Headline earningsper share
Adusted headlineearnings per share
(37.
5)
118.
0
113.
3
198.
5
149.
6
Continuing operations (cents)
Notes to the Group annual financial statements continuedfor the year ended 30 September
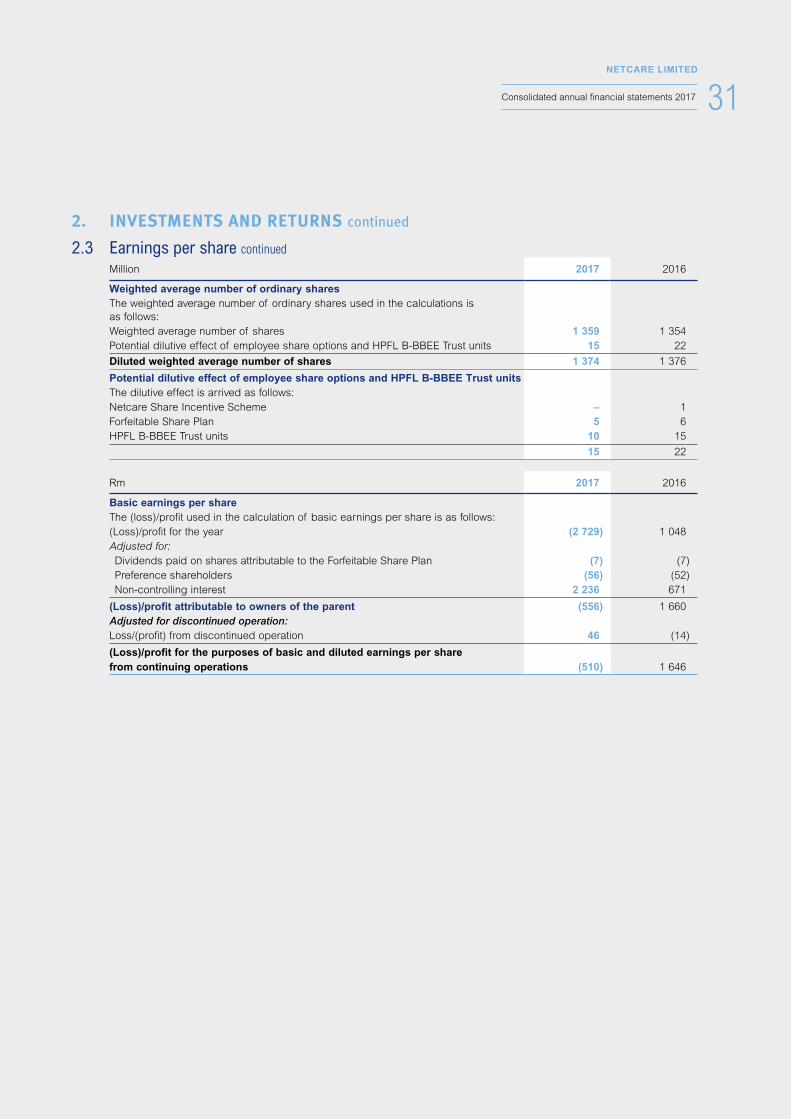
31NETCARE LIMITED
Consolidated annual financial statements 2017
2. INVESTMENTS AND RETURNS continued
2.3 Earnings per share continued
Million 2017 2016
Weighted average number of ordinary sharesThe weighted average number of ordinary shares used in the calculations is as follows:Weighted average number of shares 1 359 1 354 Potential dilutive effect of employee share options and HPFL B-BBEE Trust units 15 22
Diluted weighted average number of shares 1 374 1 376
Potential dilutive effect of employee share options and HPFL B-BBEE Trust unitsThe dilutive effect is arrived as follows:Netcare Share Incentive Scheme – 1 Forfeitable Share Plan 5 6 HPFL B-BBEE Trust units 10 15
15 22
Rm 2017 2016
Basic earnings per shareThe (loss)/profit used in the calculation of basic earnings per share is as follows:(Loss)/profit for the year (2 729) 1 048 Adjusted for: Dividends paid on shares attributable to the Forfeitable Share Plan (7) (7) Preference shareholders (56) (52) Non-controlling interest 2 236 671
(Loss)/profit attributable to owners of the parent (556) 1 660 Adjusted for discontinued operation:Loss/(profit) from discontinued operation 46 (14)
(Loss)/profit for the purposes of basic and diluted earnings per share from continuing operations (510) 1 646
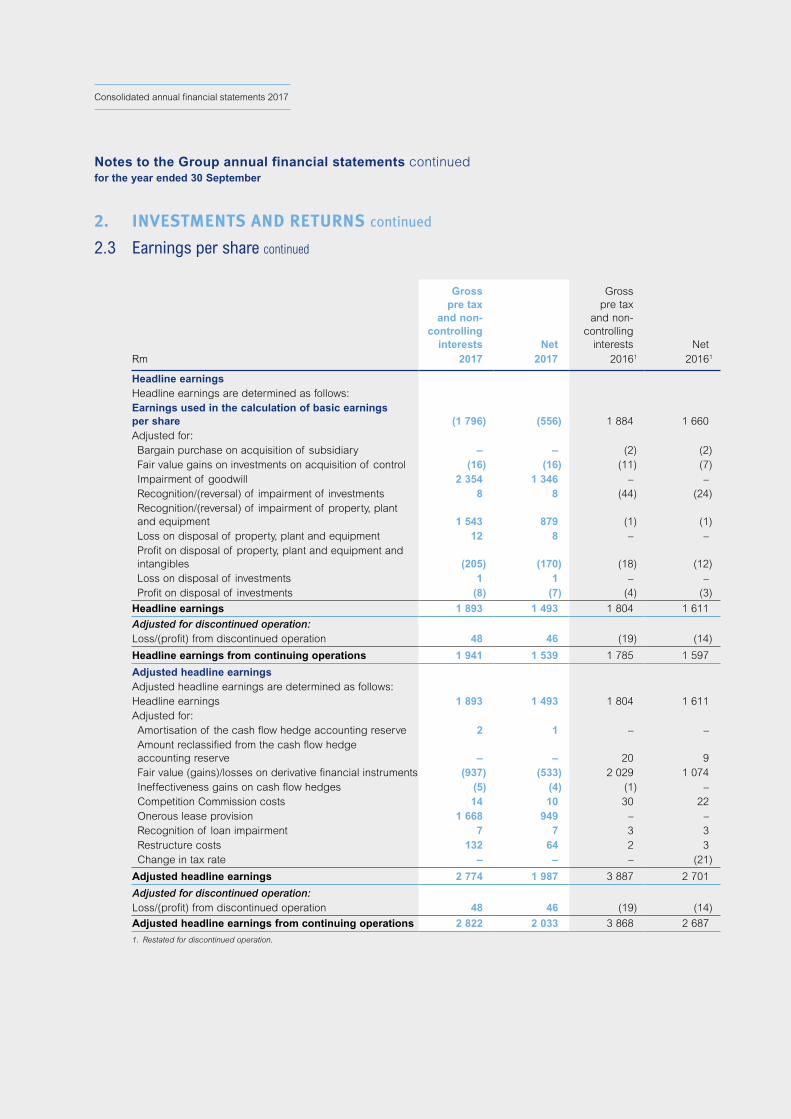
32NETCARE LIMITED
Consolidated annual financial statements 2017
2. INVESTMENTS AND RETURNS continued
2.3 Earnings per share continued
Rm
Gross pre tax
and non-controlling
interests2017
Net2017
Gross pre tax
and non-controlling
interests20161
Net 20161
Headline earnings Headline earnings are determined as follows:Earnings used in the calculation of basic earnings per share (1 796) (556) 1 884 1 660 Adjusted for: Bargain purchase on acquisition of subsidiary – – (2) (2) Fair value gains on investments on acquisition of control (16) (16) (11) (7) Impairment of goodwill 2 354 1 346 – – Recognition/(reversal) of impairment of investments 8 8 (44) (24) Recognition/(reversal) of impairment of property, plant and equipment 1 543 879 (1) (1)
Loss on disposal of property, plant and equipment 12 8 – – Profit on disposal of property, plant and equipment and intangibles (205) (170) (18) (12)
Loss on disposal of investments 1 1 – – Profit on disposal of investments (8) (7) (4) (3)
Headline earnings 1 893 1 493 1 804 1 611
Adjusted for discontinued operation:Loss/(profit) from discontinued operation 48 46 (19) (14)
Headline earnings from continuing operations 1 941 1 539 1 785 1 597
Adjusted headline earningsAdjusted headline earnings are determined as follows:Headline earnings 1 893 1 493 1 804 1 611 Adjusted for: Amortisation of the cash flow hedge accounting reserve 2 1 – – Amount reclassified from the cash flow hedge accounting reserve – – 20 9
Fair value (gains)/losses on derivative financial instruments (937) (533) 2 029 1 074 Ineffectiveness gains on cash flow hedges (5) (4) (1) – Competition Commission costs 14 10 30 22 Onerous lease provision 1 668 949 – – Recognition of loan impairment 7 7 3 3 Restructure costs 132 64 2 3 Change in tax rate – – – (21)
Adjusted headline earnings 2 774 1 987 3 887 2 701
Adjusted for discontinued operation:Loss/(profit) from discontinued operation 48 46 (19) (14)
Adjusted headline earnings from continuing operations 2 822 2 033 3 868 2 687
1. Restated for discontinued operation.
Notes to the Group annual financial statements continuedfor the year ended 30 September
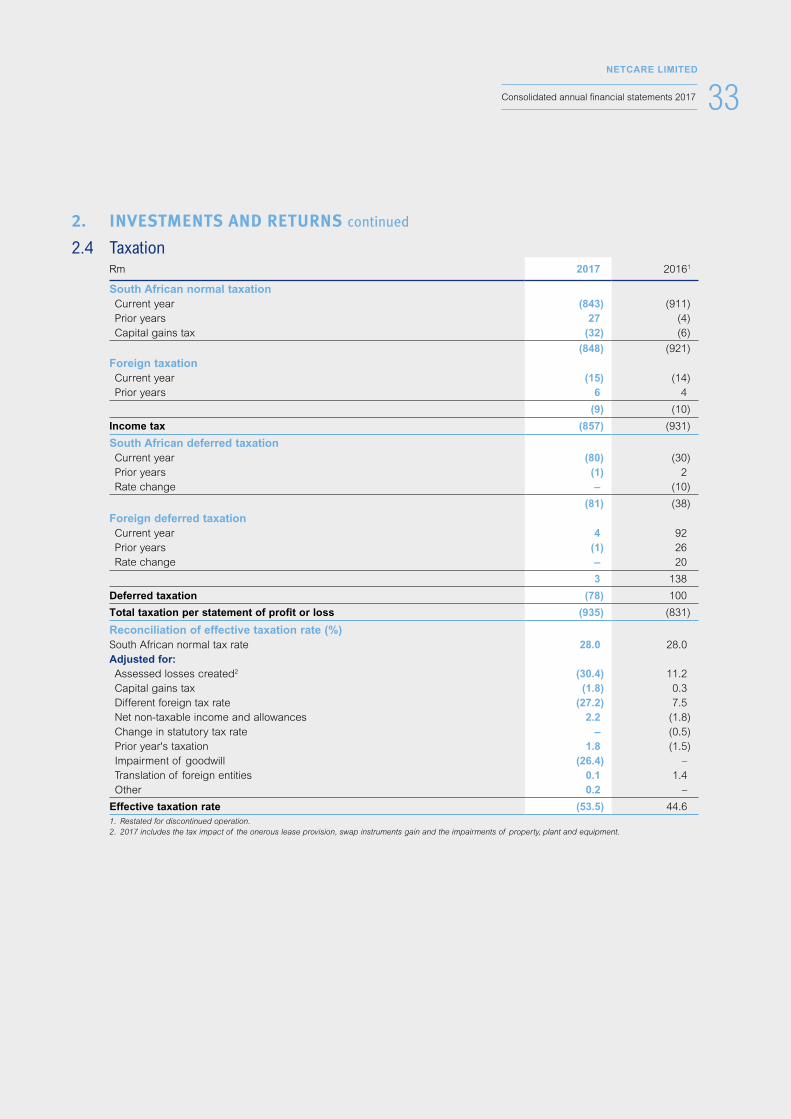
33NETCARE LIMITED
Consolidated annual financial statements 2017
2. INVESTMENTS AND RETURNS continued
2.4 TaxationRm 2017 20161
South African normal taxation Current year (843) (911) Prior years 27 (4) Capital gains tax (32) (6)
(848) (921)Foreign taxation Current year (15) (14) Prior years 6 4
(9) (10)
Income tax (857) (931)
South African deferred taxation Current year (80) (30) Prior years (1) 2 Rate change – (10)
(81) (38)Foreign deferred taxation Current year 4 92 Prior years (1) 26 Rate change – 20
3 138
Deferred taxation (78) 100
Total taxation per statement of profit or loss (935) (831)
Reconciliation of effective taxation rate (%)South African normal tax rate 28.0 28.0 Adjusted for: Assessed losses created2 (30.4) 11.2 Capital gains tax (1.8) 0.3 Different foreign tax rate (27.2) 7.5 Net non-taxable income and allowances 2.2 (1.8) Change in statutory tax rate – (0.5) Prior year's taxation 1.8 (1.5) Impairment of goodwill (26.4) – Translation of foreign entities 0.1 1.4 Other 0.2 –
Effective taxation rate (53.5) 44.6 1. Restated for discontinued operation. 2. 2017 includes the tax impact of the onerous lease provision, swap instruments gain and the impairments of property, plant and equipment.

34NETCARE LIMITED
Consolidated annual financial statements 2017
2. INVESTMENTS AND RETURNS continued
2.4 Taxation continued
Rm 2017 2016
Estimated taxation lossesUnused tax losses available for set-off against future taxable income South Africa 386 350 United Kingdom 7 513 6 864
7 899 7 214 Utilised against the deferred tax balance South Africa (280) (298) United Kingdom (3 078) (4 913)
(3 358) (5 211)Not recognised as a deferred tax asset South Africa 106 52 United Kingdom 4 434 1 951
4 540 2 003
A deferred tax asset is recognised to the extent that it is probable that future taxable profits will be available against which the unused tax losses and unused credits can be utilised. Future taxable profits are estimated based on business plans which include estimates and assumptions regarding economic growth, interest, inflation rates, taxation rates and competitive forces. The deferred tax asset is reviewed at the end of the reporting period and adjusted taking into consideration the existing and forecast future results of the business.
Notes to the Group annual financial statements continuedfor the year ended 30 September
35NETCARE LIMITED
Consolidated annual financial statements 2017
2. INVESTMENTS AND RETURNS continued
2.5 Deferred taxationDeferred taxation assets and liabilities are offset where there is a legal enforceable right to offset and relate to taxes levied by the same revenue authority and legal entity.
Rm Note 2017 2016
Reconciliation of movementBalance at beginning of year 111 (36)Current year charge Per the statement of profit or loss 2.4 (78) 100 Amounts recognised in other comprehensive income 21 4 Amounts recognised directly in equity (10) 25 Acquisition of businesses – (1)Translation of foreign entities (1) 19
Balance at end of year 43 111
Comprising:Deferred tax assets 1 092 1 318 Deferred tax liabilities (1 049) (1 207)
43 111

36NETCARE LIMITED
Consolidated annual financial statements 2017
2. INVESTMENTS AND RETURNS continued
2.5 Deferred taxation continued
Rm
Balance at beginning
of year
Reclassification between
categories
Recognised in profit
or loss
Recognised in other
comprehensive income
Recognised directly
in equity Acquisitions/
disposals Exchange
differences
Balance at end
of year
2017Property, plant and equipment (337) – 341 – – – (83) (79)Cash-settled share-based payments of subsidiaries 1 – – – (3) – – (2)Prepayments (9) – (1) – – – – (10)Allowance for doubtful debts 33 – 9 – – – – 42 Post-retirement benefit obligations 123 – 8 9 – – 1 141 Payroll accruals and provisions 171 – (7) – – – – 164 Deferred lease liabilities/derivatives (725) – 115 – – – (39) (649)Calculated tax losses 960 – (474) – – – 117 603 Financial instruments 5 – (1) 12 – – – 16 Other temporary differences (111) – (68) – (7) – 3 (183)
111 – (78) 21 (10) – (1) 43
Rm
Balance at beginning
of year
Reclassification between
categories
Recognised in profit
or loss
Recognised in other
comprehensive income
Recognised directly
in equity Acquisitions/
disposals Exchange
differences
Balance at end
of year
2016Property, plant and equipment (301) (87) 19 – – (1) 33 (337)Cash-settled share-based payments of subsidiaries 6 – – – (5) – – 1 Prepayments (8) – (1) – – – – (9)Allowance for doubtful debts 25 – 8 – – – – 33 Post-retirement benefit obligations 118 – 8 (2) – – (1) 123 Payroll accruals and provisions 147 – 24 – – – – 171 Deferred lease liabilities/derivatives (1 121) 42 197 – – – 157 (725)Calculated tax losses 1 221 – (94) – – – (167) 960 Financial instruments 37 (42) 3 6 – – 1 5 Other temporary differences (160) 87 (64) – 30 – (4) (111)
(36) – 100 4 25 (1) 19 111
Notes to the Group annual financial statements continuedfor the year ended 30 September

37NETCARE LIMITED
Consolidated annual financial statements 2017
2. INVESTMENTS AND RETURNS continued
2.5 Deferred taxation continued
Rm
Balance at beginning
of year
Reclassification between
categories
Recognised in profit
or loss
Recognised in other
comprehensive income
Recognised directly
in equity Acquisitions/
disposals Exchange
differences
Balance at end
of year
2017Property, plant and equipment (337) – 341 – – – (83) (79)Cash-settled share-based payments of subsidiaries 1 – – – (3) – – (2)Prepayments (9) – (1) – – – – (10)Allowance for doubtful debts 33 – 9 – – – – 42 Post-retirement benefit obligations 123 – 8 9 – – 1 141 Payroll accruals and provisions 171 – (7) – – – – 164 Deferred lease liabilities/derivatives (725) – 115 – – – (39) (649)Calculated tax losses 960 – (474) – – – 117 603 Financial instruments 5 – (1) 12 – – – 16 Other temporary differences (111) – (68) – (7) – 3 (183)
111 – (78) 21 (10) – (1) 43
Rm
Balance at beginning
of year
Reclassification between
categories
Recognised in profit
or loss
Recognised in other
comprehensive income
Recognised directly
in equity Acquisitions/
disposals Exchange
differences
Balance at end
of year
2016Property, plant and equipment (301) (87) 19 – – (1) 33 (337)Cash-settled share-based payments of subsidiaries 6 – – – (5) – – 1 Prepayments (8) – (1) – – – – (9)Allowance for doubtful debts 25 – 8 – – – – 33 Post-retirement benefit obligations 118 – 8 (2) – – (1) 123 Payroll accruals and provisions 147 – 24 – – – – 171 Deferred lease liabilities/derivatives (1 121) 42 197 – – – 157 (725)Calculated tax losses 1 221 – (94) – – – (167) 960 Financial instruments 37 (42) 3 6 – – 1 5 Other temporary differences (160) 87 (64) – 30 – (4) (111)
(36) – 100 4 25 (1) 19 111

38NETCARE LIMITED
Consolidated annual financial statements 2017
2. INVESTMENTS AND RETURNS continued
2.6 Cash generated from operationsRm Notes 2017 20161
Operating (loss)/profit (2 394) 4 128 Adjustments for: Discontinued operation 10.1 (48) 20 Amortisation of intangible assets 2.9 83 101 Depreciation of property, plant and equipment 2.8 1 216 1 289 Profit on disposal of property, plant and equipment and intangible assets (205) (23) Loss on disposal of property, plant and equipment and intangible assets 12 5 Recognition/(reversal) of impairment of property, plant and equipment 2.8 1 541 (1) Impairment of goodwill 2.10 2 354 – Impairment of investment 8 – Impairment of receivables 111 34 Recognition of loan impairments 7 3 Reversal of impairment of investments and loans – (44) Profit on disposal of investments (net) (7) (4) Increase in deferred lease liabilities 21 15 Share-based payment expense 4.3 46 33 Provisions raised/(utilised) 1 650 (15) Fair value gains on investments on acquisition of control (16) (11) Other non-cash flow items 16 11
Cash generated from operations before working capital changes 4 395 5 541 Decrease/(increase) in trade and other receivables 359 (235)Decrease in inventories 44 16 Decrease in trade and other payables (529) (40)
4 269 5 282
1. Restated for discontinued operation.
2.7 Taxation paidRm 2017 2016
Amounts payable at beginning of year (net) 65 91 Charge per the statement of profit or loss (excluding deferred taxation) 855 936 Other taxation movements through equity 2 (10)Translation of foreign entities 2 (2)Amounts payable at end of year (net) (50) (65)
874 950
Notes to the Group annual financial statements continuedfor the year ended 30 September
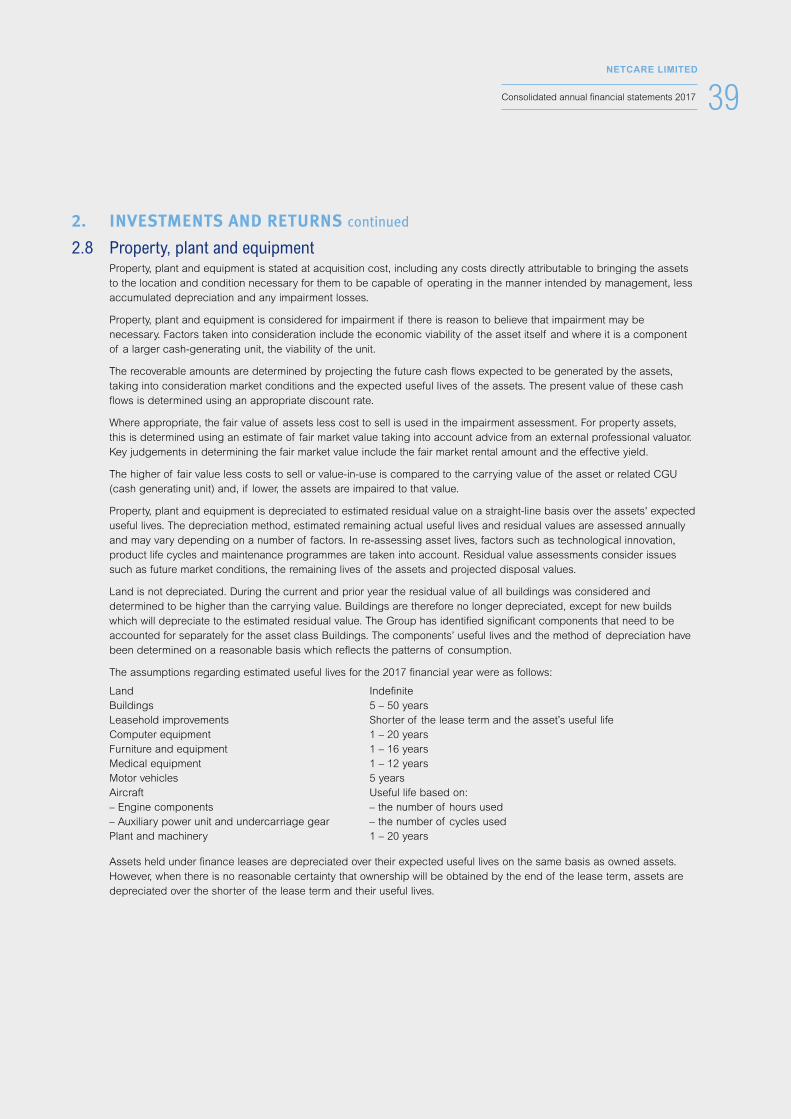
39NETCARE LIMITED
Consolidated annual financial statements 2017
2. INVESTMENTS AND RETURNS continued
2.8 Property, plant and equipment Property, plant and equipment is stated at acquisition cost, including any costs directly attributable to bringing the assets
to the location and condition necessary for them to be capable of operating in the manner intended by management, less accumulated depreciation and any impairment losses.
Property, plant and equipment is considered for impairment if there is reason to believe that impairment may be necessary. Factors taken into consideration include the economic viability of the asset itself and where it is a component of a larger cash-generating unit, the viability of the unit.
The recoverable amounts are determined by projecting the future cash flows expected to be generated by the assets, taking into consideration market conditions and the expected useful lives of the assets. The present value of these cash flows is determined using an appropriate discount rate.
Where appropriate, the fair value of assets less cost to sell is used in the impairment assessment. For property assets, this is determined using an estimate of fair market value taking into account advice from an external professional valuator. Key judgements in determining the fair market value include the fair market rental amount and the effective yield.
The higher of fair value less costs to sell or value-in-use is compared to the carrying value of the asset or related CGU (cash generating unit) and, if lower, the assets are impaired to that value.
Property, plant and equipment is depreciated to estimated residual value on a straight-line basis over the assets' expected useful lives. The depreciation method, estimated remaining actual useful lives and residual values are assessed annually and may vary depending on a number of factors. In re-assessing asset lives, factors such as technological innovation, product life cycles and maintenance programmes are taken into account. Residual value assessments consider issues such as future market conditions, the remaining lives of the assets and projected disposal values.
Land is not depreciated. During the current and prior year the residual value of all buildings was considered and determined to be higher than the carrying value. Buildings are therefore no longer depreciated, except for new builds which will depreciate to the estimated residual value. The Group has identified significant components that need to be accounted for separately for the asset class Buildings. The components’ useful lives and the method of depreciation have been determined on a reasonable basis which reflects the patterns of consumption.
The assumptions regarding estimated useful lives for the 2017 financial year were as follows:
Land IndefiniteBuildings 5 – 50 yearsLeasehold improvements Shorter of the lease term and the asset’s useful lifeComputer equipment 1 – 20 yearsFurniture and equipment 1 – 16 yearsMedical equipment 1 – 12 yearsMotor vehicles 5 yearsAircraft Useful life based on:– Engine components – the number of hours used– Auxiliary power unit and undercarriage gear – the number of cycles usedPlant and machinery 1 – 20 years
Assets held under finance leases are depreciated over their expected useful lives on the same basis as owned assets. However, when there is no reasonable certainty that ownership will be obtained by the end of the lease term, assets are depreciated over the shorter of the lease term and their useful lives.
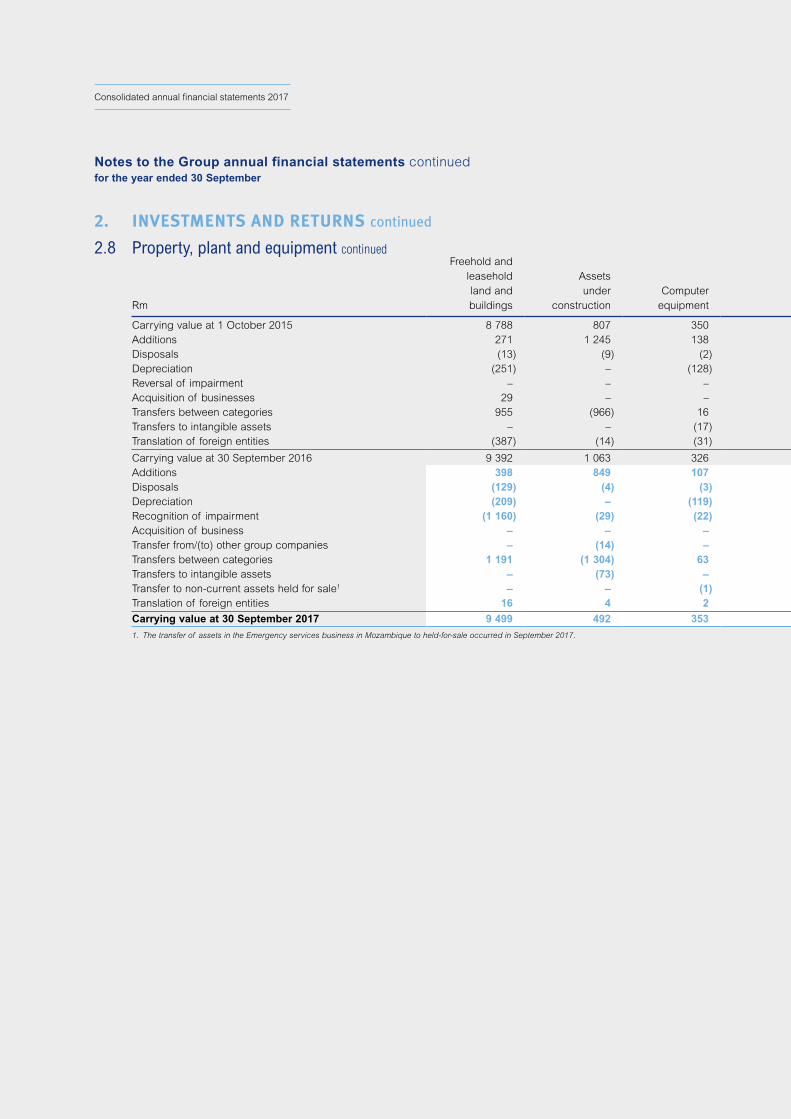
40NETCARE LIMITED
Consolidated annual financial statements 2017
2. INVESTMENTS AND RETURNS continued
2.8 Property, plant and equipment continued
Rm
Freehold and leasehold land and buildings
Assets under
construction Computer equipment
Furniture and
equipment Medical
equipment
Motor vehicles
and aircraft
Plant and
machinery Total
Carrying value at 1 October 2015 8 788 807 350 260 3 395 18 4 13 622 Additions 271 1 245 138 61 1 042 11 21 2 789 Disposals (13) (9) (2) (1) (9) – – (34)Depreciation (251) – (128) (106) (784) (5) (16) (1 290)Reversal of impairment – – – – – 1 – 1 Acquisition of businesses 29 – – 1 – – – 30 Transfers between categories 955 (966) 16 – (5) – – – Transfers to intangible assets – – (17) – – – – (17)Translation of foreign entities (387) (14) (31) (13) (236) (1) 2 (680)
Carrying value at 30 September 2016 9 392 1 063 326 202 3 403 24 11 14 421 Additions 398 849 107 76 974 12 3 2 419 Disposals (129) (4) (3) (2) (4) – – (142)Depreciation (209) – (119) (84) (799) (4) (3) (1 218)Recognition of impairment (1 160) (29) (22) (29) (301) – – (1 541)Acquisition of business – – – – 5 – – 5 Transfer from/(to) other group companies – (14) – – 14 – – – Transfers between categories 1 191 (1 304) 63 1 49 – – – Transfers to intangible assets – (73) – – – – – (73)Transfer to non-current assets held for sale1 – – (1) (3) – (1) – (5)Translation of foreign entities 16 4 2 (2) 20 1 1 42
Carrying value at 30 September 2017 9 499 492 353 159 3 361 32 12 13 908
1. The transfer of assets in the Emergency services business in Mozambique to held-for-sale occurred in September 2017.
Notes to the Group annual financial statements continuedfor the year ended 30 September
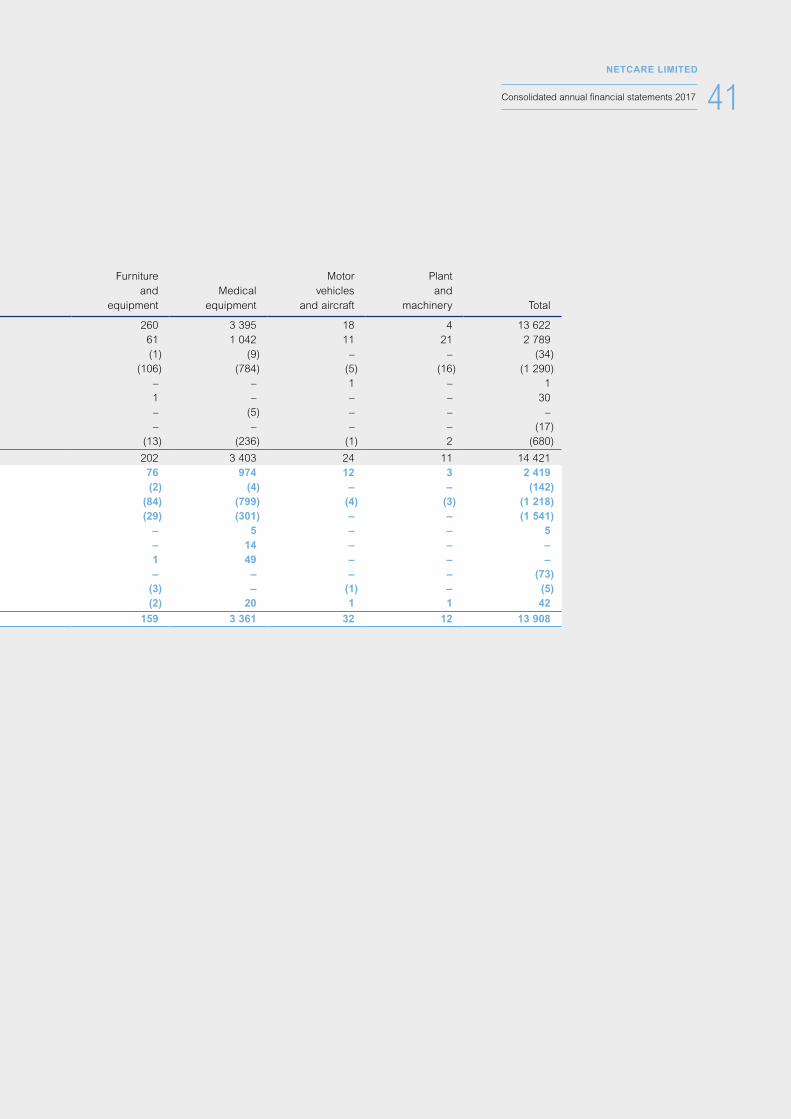
41NETCARE LIMITED
Consolidated annual financial statements 2017
2. INVESTMENTS AND RETURNS continued
2.8 Property, plant and equipment continued
Rm
Freehold and leasehold land and buildings
Assets under
construction Computer equipment
Furniture and
equipment Medical
equipment
Motor vehicles
and aircraft
Plant and
machinery Total
Carrying value at 1 October 2015 8 788 807 350 260 3 395 18 4 13 622 Additions 271 1 245 138 61 1 042 11 21 2 789 Disposals (13) (9) (2) (1) (9) – – (34)Depreciation (251) – (128) (106) (784) (5) (16) (1 290)Reversal of impairment – – – – – 1 – 1 Acquisition of businesses 29 – – 1 – – – 30 Transfers between categories 955 (966) 16 – (5) – – – Transfers to intangible assets – – (17) – – – – (17)Translation of foreign entities (387) (14) (31) (13) (236) (1) 2 (680)
Carrying value at 30 September 2016 9 392 1 063 326 202 3 403 24 11 14 421 Additions 398 849 107 76 974 12 3 2 419 Disposals (129) (4) (3) (2) (4) – – (142)Depreciation (209) – (119) (84) (799) (4) (3) (1 218)Recognition of impairment (1 160) (29) (22) (29) (301) – – (1 541)Acquisition of business – – – – 5 – – 5 Transfer from/(to) other group companies – (14) – – 14 – – – Transfers between categories 1 191 (1 304) 63 1 49 – – – Transfers to intangible assets – (73) – – – – – (73)Transfer to non-current assets held for sale1 – – (1) (3) – (1) – (5)Translation of foreign entities 16 4 2 (2) 20 1 1 42
Carrying value at 30 September 2017 9 499 492 353 159 3 361 32 12 13 908
1. The transfer of assets in the Emergency services business in Mozambique to held-for-sale occurred in September 2017.
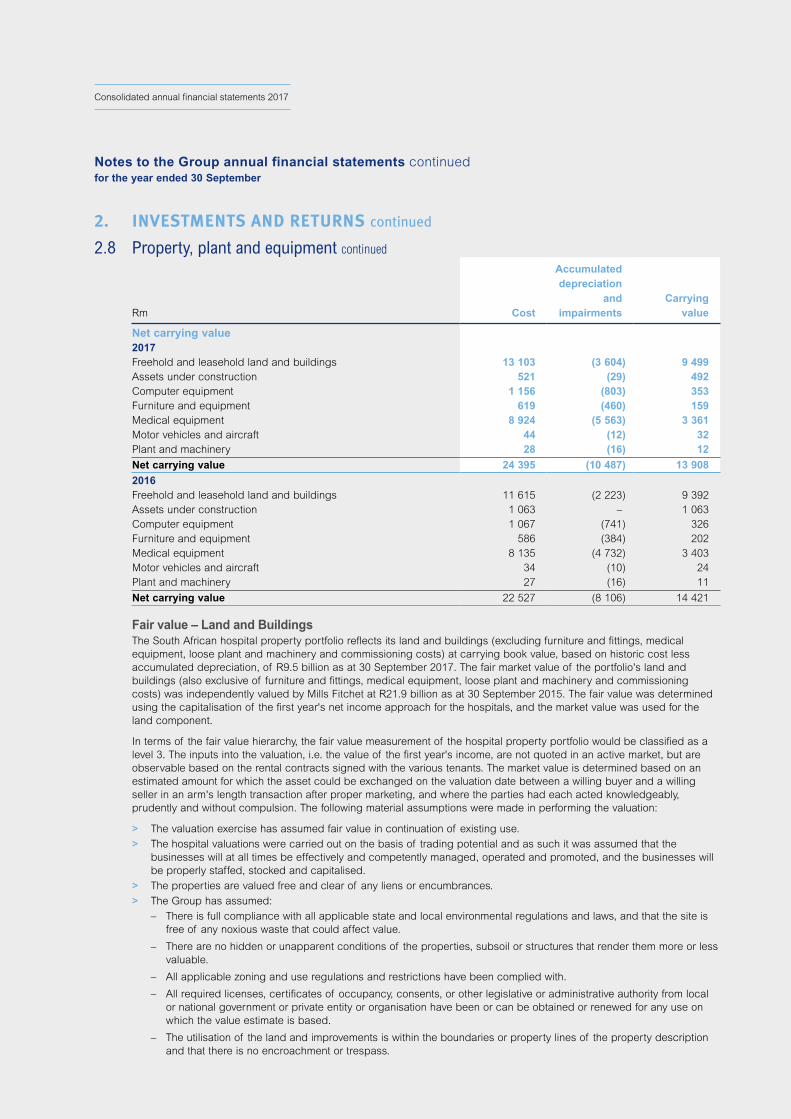
42NETCARE LIMITED
Consolidated annual financial statements 2017
2. INVESTMENTS AND RETURNS continued
2.8 Property, plant and equipment continued
Rm Cost
Accumulated depreciation
and impairments
Carrying value
Net carrying value2017Freehold and leasehold land and buildings 13 103 (3 604) 9 499 Assets under construction 521 (29) 492 Computer equipment 1 156 (803) 353 Furniture and equipment 619 (460) 159 Medical equipment 8 924 (5 563) 3 361 Motor vehicles and aircraft 44 (12) 32 Plant and machinery 28 (16) 12
Net carrying value 24 395 (10 487) 13 908
2016Freehold and leasehold land and buildings 11 615 (2 223) 9 392 Assets under construction 1 063 – 1 063 Computer equipment 1 067 (741) 326 Furniture and equipment 586 (384) 202 Medical equipment 8 135 (4 732) 3 403 Motor vehicles and aircraft 34 (10) 24 Plant and machinery 27 (16) 11
Net carrying value 22 527 (8 106) 14 421
Fair value – Land and Buildings The South African hospital property portfolio reflects its land and buildings (excluding furniture and fittings, medical
equipment, loose plant and machinery and commissioning costs) at carrying book value, based on historic cost less accumulated depreciation, of R9.5 billion as at 30 September 2017. The fair market value of the portfolio's land and buildings (also exclusive of furniture and fittings, medical equipment, loose plant and machinery and commissioning costs) was independently valued by Mills Fitchet at R21.9 billion as at 30 September 2015. The fair value was determined using the capitalisation of the first year's net income approach for the hospitals, and the market value was used for the land component.
In terms of the fair value hierarchy, the fair value measurement of the hospital property portfolio would be classified as a level 3. The inputs into the valuation, i.e. the value of the first year's income, are not quoted in an active market, but are observable based on the rental contracts signed with the various tenants. The market value is determined based on an estimated amount for which the asset could be exchanged on the valuation date between a willing buyer and a willing seller in an arm's length transaction after proper marketing, and where the parties had each acted knowledgeably, prudently and without compulsion. The following material assumptions were made in performing the valuation:
> The valuation exercise has assumed fair value in continuation of existing use.
> The hospital valuations were carried out on the basis of trading potential and as such it was assumed that the businesses will at all times be effectively and competently managed, operated and promoted, and the businesses will be properly staffed, stocked and capitalised.
> The properties are valued free and clear of any liens or encumbrances.
> The Group has assumed:
– There is full compliance with all applicable state and local environmental regulations and laws, and that the site is free of any noxious waste that could affect value.
– There are no hidden or unapparent conditions of the properties, subsoil or structures that render them more or less valuable.
– All applicable zoning and use regulations and restrictions have been complied with.
– All required licenses, certificates of occupancy, consents, or other legislative or administrative authority from local or national government or private entity or organisation have been or can be obtained or renewed for any use on which the value estimate is based.
– The utilisation of the land and improvements is within the boundaries or property lines of the property description and that there is no encroachment or trespass.
Notes to the Group annual financial statements continuedfor the year ended 30 September
43NETCARE LIMITED
Consolidated annual financial statements 2017
2. INVESTMENTS AND RETURNS continued
2.8 Property, plant and equipment continued
Impairment losses recognised in the year During the year, as a result of the lower activity and continued shift in payor and case mix in the UK, as discussed in
note 1.4, BMI Healthcare carried out a review of the recoverable amount of property, plant and equipment balances held at each leased hospital. These assets are used in BMI Healthcare's hospital operations.
An impairment loss is recognised to the extent by which the carrying amount of an asset or cash generating unit (CGU) exceeds its recoverable amount. The recoverable amount of an asset or a CGU is the higher of its fair value less costs of disposal and its value in use.
Impairment is assessed at the hospital CGU level, as this is the smallest identifiable group of assets that generates cash inflows that are largely independent of the cash inflows from other assets or group of assets. Fair value less costs of disposal would therefore apply to each hospital. As there is currently no basis for making a reliable estimate of the amount obtainable from the sale of each hospital CGU in an arm's length transaction between knowledgeable and willing parties, with the current leases in place, we have used each hospital CGU's value in use as its recoverable amount.
The recoverable amounts are determined by projecting the future cash flows expected to be generated by the hospital CGUs, taking into account market conditions and the expected useful lives of the hospital CGUs. The present value of these cash flows is determined using an appropriate discount rate.
The key assumptions used in the value in use calculations are as follows:
> Latest management forecasts for the five year period from 1 October 2017 to 30 September 2022, using key assumptions concerning caseload volume, payor and case mix, tariff changes, general inflation and staffing cost movements.
> A pre-tax WACC1 of 7.6% based on current market assessments of optimal capital structure, cost of debt and market risk premium.
> Long-term growth rate of 2%, being the long-term growth forecasts for the UK economy.
Other assumptions used:
> A sustaining capital expenditure level has been included in the cash flow forecasts to maintain the existing EBITDAR² forecasts in the plan.
> Rental charges that are considered to be the most probable, taking into consideration various probabilities relating to the conclusion of a rent restructure agreement.
Based on the calculations performed, the recoverable amount at a number of hospital CGUs was lower than the carrying value, and an impairment loss of R1 540 million was recognised.
A R1 million impairment was recognised on SA land and buildings.
The UK impairment of R1 540 million is included in operating loss for the year, separately disclosed on the statement of profit or loss.
The SA impairment of R1 million is included in operating loss for the year, in administrative and other expenses.
No impairment assessment was required to be performed in 2016 as there were no indicators of impairment.
Borrowing costs Borrowing costs of R40 million (2016: R48 million) were capitalised during the year and are included in the "Additions"
disclosed.
The capitalisation rate ranges between 9.0% – 11.0% per annum.
Security Property, plant and equipment with a carrying value of R337 million (2016 : R326 million) has been encumbered as
security for debt. Refer to note 3.1.1 for more details.
1. Weighted average cost of capital. 2. Earnings before interest, tax, depreciation amortisation and rental charges.
44NETCARE LIMITED
Consolidated annual financial statements 2017
2. INVESTMENTS AND RETURNS continued
2.9 Intangible assets Intangible assets are stated at cost less accumulated amortisation and accumulated impairment losses.
Intangible assets are considered for impairment if there is any reason to believe that impairment may be necessary. Factors taken into consideration include the economic viability of the asset itself and where it is a component of a larger cash-generating unit, the viability of the unit.
Intangible assets are amortised on a straight-line basis over their estimated useful lives. The amortisation methods and remaining useful lives are reviewed at least annually. The estimation of the useful lives of intangible assets is based on historic performance as well as expectations about future use and therefore requires a significant degree of judgement. Amortisation has been included in operating profit.
The assumptions regarding estimated useful lives for the 2017 financial year were as follows:
Management contracts Over contract period Computer software – purchased 2 – 6 years Computer software – other 20 years Development expenditure Over contract period Other 4 years
Management contracts comprise the value of contracts with third parties to operate hospital facilities.
Development expenditure comprises the capitalisation of bid costs incurred in mobilising management contracts which have gained preferred bidder status. All costs incurred in the preparation of bids are expensed in the statement of profit or loss up to the point where the contract is virtually certain and the contract has then gained preferred bidder status. Bid costs incurred after this point are capitalised to the intangible asset.
Notes to the Group annual financial statements continuedfor the year ended 30 September

45NETCARE LIMITED
Consolidated annual financial statements 2017
2. INVESTMENTS AND RETURNS continued
2.9 Intangible assets continued
Rm
Management contracts and other Software
Development expenditure Total
2017Net carrying valueCost 119 626 38 783 Accumulated amortisation and impairment losses (47) (395) (9) (451)
72 231 29 332
Movement in the carrying valueCarrying value at 1 October 2016 70 215 29 314 Additions 8 19 1 28 Disposals (2) – (1) (3)Amortisation (3) (79) (1) (83)Transfers from property, plant and equipment – 73 – 73 Translation of foreign entities (1) 3 1 3
Carrying value at 30 September 2017 72 231 29 332
2016Net carrying valueCost 70 1 091 37 1 198 Accumulated amortisation and impairment losses – (876) (8) (884)
70 215 29 314
Movement in intangible assetsCarrying value at 1 October 2015 76 308 13 397 Additions 8 9 16 33 Amortisation (6) (94) (1) (101)Transfers from property, plant and equipment – 15 2 17 Transfers between categories 1 (1) – – Translation of foreign entities (9) (22) (1) (32)
Carrying value at 30 September 2016 70 215 29 314
The remaining amortisation periods for intangible assets at 30 September 2017 are:
Management contracts and other 2 – 18 years Software 2 – 20 years Development expenditure 1 – 8 years
No borrowing costs were capitalised during the 2017 and 2016 years.
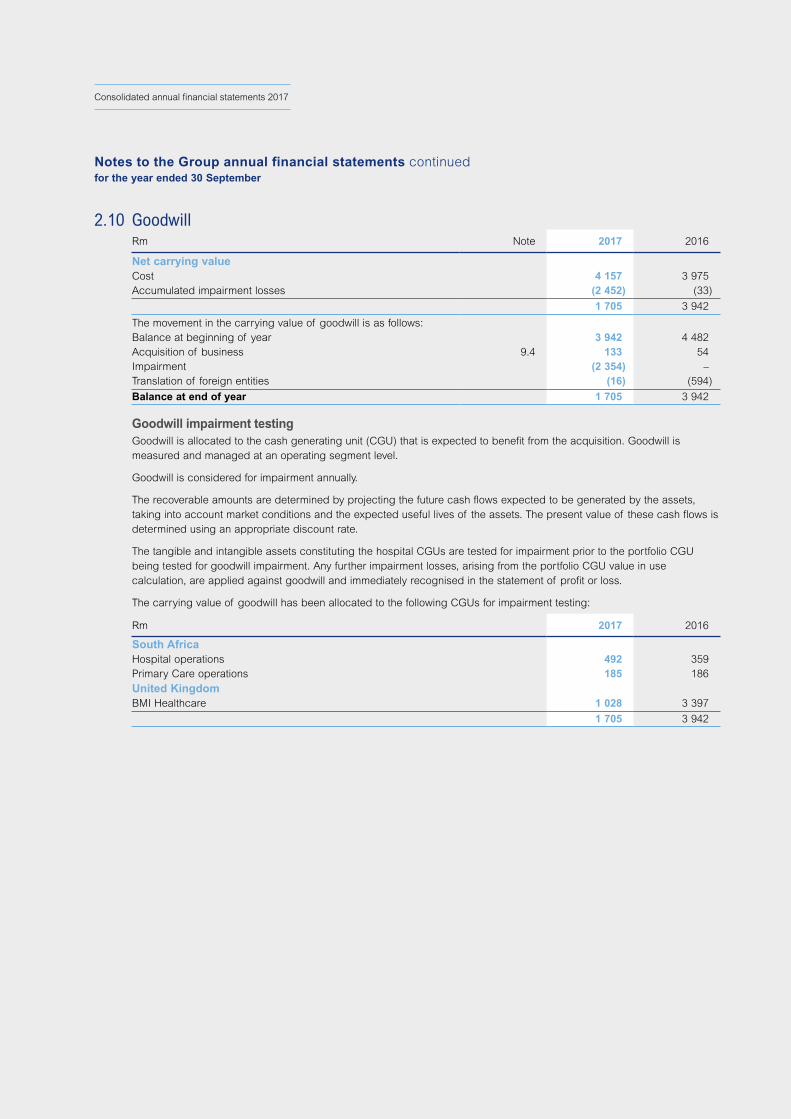
46NETCARE LIMITED
Consolidated annual financial statements 2017
2.10 GoodwillRm Note 2017 2016
Net carrying valueCost 4 157 3 975 Accumulated impairment losses (2 452) (33)
1 705 3 942
The movement in the carrying value of goodwill is as follows:Balance at beginning of year 3 942 4 482 Acquisition of business 9.4 133 54 Impairment (2 354) – Translation of foreign entities (16) (594)
Balance at end of year 1 705 3 942
Goodwill impairment testing Goodwill is allocated to the cash generating unit (CGU) that is expected to benefit from the acquisition. Goodwill is
measured and managed at an operating segment level.
Goodwill is considered for impairment annually.
The recoverable amounts are determined by projecting the future cash flows expected to be generated by the assets, taking into account market conditions and the expected useful lives of the assets. The present value of these cash flows is determined using an appropriate discount rate.
The tangible and intangible assets constituting the hospital CGUs are tested for impairment prior to the portfolio CGU being tested for goodwill impairment. Any further impairment losses, arising from the portfolio CGU value in use calculation, are applied against goodwill and immediately recognised in the statement of profit or loss.
The carrying value of goodwill has been allocated to the following CGUs for impairment testing:
Rm 2017 2016
South Africa Hospital operations 492 359 Primary Care operations 185 186 United Kingdom BMI Healthcare 1 028 3 397
1 705 3 942
Notes to the Group annual financial statements continuedfor the year ended 30 September

47NETCARE LIMITED
Consolidated annual financial statements 2017
2. INVESTMENTS AND RETURNS continued
2.10 Goodwill continued
SA Hospital and Primary Care operations The recoverable amounts of the SA Hospital and Primary Care operations' CGUs are determined based on value-in-use.
The value-in-use is calculated as the present value of the projected cash flows attributable to each CGU. The key assumptions in the value-in-use calculations for each CGU are as follows:
> The future projected cash flows are based on management’s forecast for the five-year period from 1 October 2017 to 30 September 2022. Key assumptions applied in the cash flow forecasts include activity and tariff changes, salary increases and inflation.
> The pre-tax weighted average cost of capital (WACC) of 12.0% (2016: 13.5%) is based on current market assessments of the optimal capital structure, cost of debt and cost of equity.
> Long-term growth rate of 5.5% (2016: 5.5%).
The amount by which the value-in-use exceeds the carrying value provides sufficient headroom to enable the directors to conclude that a reasonable change in any of the key assumptions would not result in an impairment loss.
BMI Healthcare BMI Healthcare's hospital operations represent the sole portfolio of CGUs to which goodwill is allocated. The recoverable
amount of BMI Healthcare is assessed using a value-in-use model. Value-in-use is calculated as the present value of the projected cash flows attributable to that CGU. The key assumptions in the value-in-use calculations are as follows:
> Latest management forecasts for the five year period from 1 October 2017 to 30 September 2022, using key assumptions concerning caseload volume, payor and case mix, tariff changes, general inflation and staffing cost movements.
> A pre-tax WACC of 7.6% (2016: 9.2%) based on current market assessments of optimal capital structure, cost of debt and market risk premium.
> Long-term growth rate of 2.0% (2016: 2.0%) being the long-term growth forecasts for the UK economy.
The WACC rate used reflects both market factors as well as sector and company factors. At 30 September 2017, before impairment testing, goodwill of R3 448 million was allocated to BMI Healthcare's hospital operations. As a result of the current trading environment, these operations have experienced lower cash inflows during the current year. BMI Healthcare has therefore revised its cash flow forecasts for the portfolio of CGUs. The impairment test resulted in a recoverable amount below the carrying value of its net assets, giving rise to an impairment loss against goodwill of R2 354 million being recognised. In accordance with IAS 36, this impairment cannot be reversed in future periods.
Overall, a 2.5% increase in the post-tax WACC rate, or a 3.1% reduction in the long-term growth rate, or a reduction in perpetuity cash flows of R68 million per annum would result in the recoverable amount and therefore the carrying amount being reduced to nil.
2.11 Segment report Information reported to the chief operating decision maker (the Executive Committee) is based on the two geographical
divisions in which the entity operates, South Africa (SA) and the United Kingdom (UK).
SA has two further segments which are separately reported on. Refer to note 1.1 for further details.
2.11.1 Measurement of segment performance and allocation of resources The segments within SA and the UK are reviewed by the Executive Committee to the operating profit level.
Net interest expenses, other net financial losses, attributable earnings of associates and joint ventures and taxation are only allocated to the SA and UK segments as a whole.
Similarly, total assets, total liabilities, additions to property, plant and equipment and debt net of cash are reviewed for the total SA and UK segments.
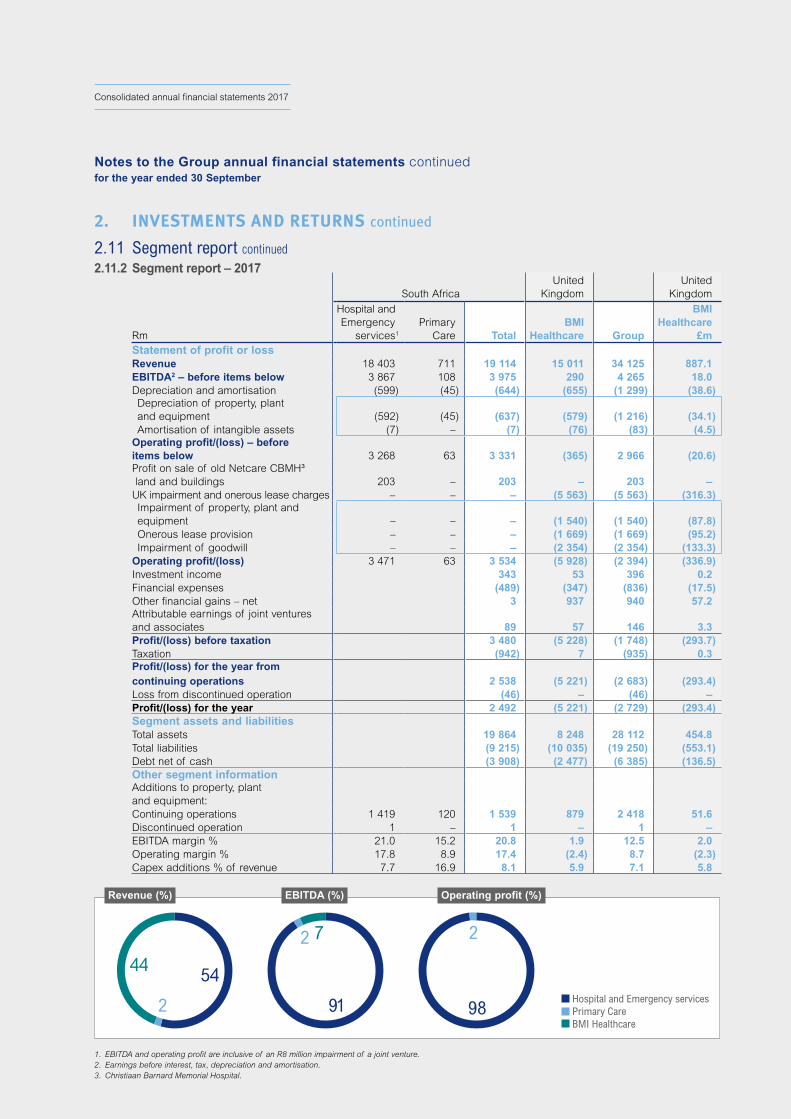
48NETCARE LIMITED
Consolidated annual financial statements 2017
2. INVESTMENTS AND RETURNS continued
2.11 Segment report continued
2.11.2 Segment report – 2017
South Africa United
Kingdom United
Kingdom
Rm
Hospital and Emergency
services1
Primary Care Total
BMI Healthcare Group
BMI Healthcare
£m Statement of profit or loss Revenue 18 403 711 19 114 15 011 34 125 887.1 EBITDA2 – before items below 3 867 108 3 975 290 4 265 18.0 Depreciation and amortisation (599) (45) (644) (655) (1 299) (38.6) Depreciation of property, plant and equipment (592) (45) (637) (579) (1 216) (34.1)
Amortisation of intangible assets (7) – (7) (76) (83) (4.5) Operating profit/(loss) – before items below 3 268 63 3 331 (365) 2 966 (20.6) Profit on sale of old Netcare CBMH³ land and buildings 203 – 203 – 203 – UK impairment and onerous lease charges – – – (5 563) (5 563) (316.3) Impairment of property, plant and equipment – – – (1 540) (1 540) (87.8)
Onerous lease provision – – – (1 669) (1 669) (95.2) Impairment of goodwill – – – (2 354) (2 354) (133.3)Operating profit/(loss) 3 471 63 3 534 (5 928) (2 394) (336.9)Investment income 343 53 396 0.2 Financial expenses (489) (347) (836) (17.5)Other financial gains – net 3 937 940 57.2 Attributable earnings of joint ventures and associates 89 57 146 3.3 Profit/(loss) before taxation 3 480 (5 228) (1 748) (293.7)Taxation (942) 7 (935) 0.3 Profit/(loss) for the year from continuing operations 2 538 (5 221) (2 683) (293.4)Loss from discontinued operation (46) – (46) – Profit/(loss) for the year 2 492 (5 221) (2 729) (293.4)Segment assets and liabilities Total assets 19 864 8 248 28 112 454.8 Total liabilities (9 215) (10 035) (19 250) (553.1) Debt net of cash (3 908) (2 477) (6 385) (136.5) Other segment information Additions to property, plant and equipment: Continuing operations 1 419 120 1 539 879 2 418 51.6 Discontinued operation 1 – 1 – 1 – EBITDA margin % 21.0 15.2 20.8 1.9 12.5 2.0Operating margin % 17.8 8.9 17.4 (2.4) 8.7 (2.3)Capex additions % of revenue 7.7 16.9 8.1 5.9 7.1 5.8
Hospital and Emergency services Primary Care BMI Healthcare
2
54442
91
7 2
98
Revenue (%) EBITDA (%) Operating profit (%)
1. EBITDA and operating profit are inclusive of an R8 million impairment of a joint venture. 2. Earnings before interest, tax, depreciation and amortisation. 3. Christiaan Barnard Memorial Hospital.
Notes to the Group annual financial statements continuedfor the year ended 30 September
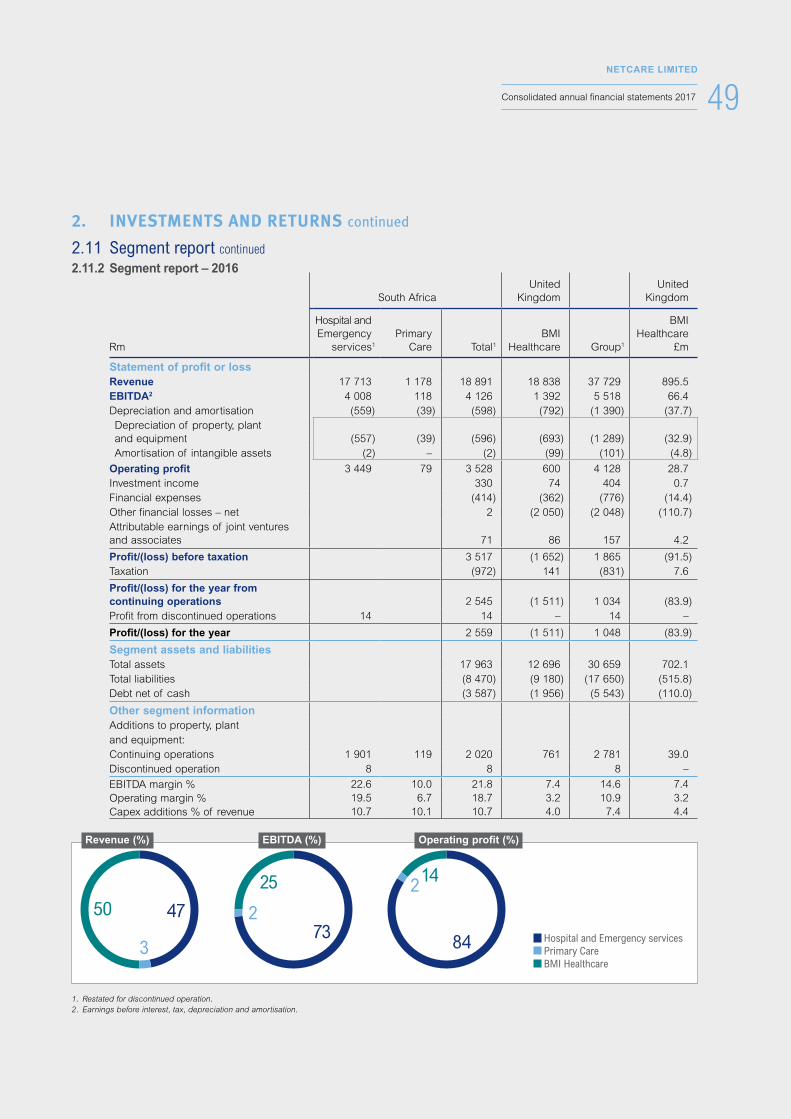
49NETCARE LIMITED
Consolidated annual financial statements 2017
2. INVESTMENTS AND RETURNS continued
2.11 Segment report continued
2.11.2 Segment report – 2016
South Africa United
Kingdom United
Kingdom
Rm
Hospital andEmergency
services1
Primary Care Total1
BMIHealthcare Group1
BMI Healthcare
£m
Statement of profit or loss Revenue 17 713 1 178 18 891 18 838 37 729 895.5 EBITDA2 4 008 118 4 126 1 392 5 518 66.4 Depreciation and amortisation (559) (39) (598) (792) (1 390) (37.7) Depreciation of property, plant and equipment (557) (39) (596) (693) (1 289) (32.9)
Amortisation of intangible assets (2) – (2) (99) (101) (4.8)
Operating profit 3 449 79 3 528 600 4 128 28.7 Investment income 330 74 404 0.7 Financial expenses (414) (362) (776) (14.4)Other financial losses – net 2 (2 050) (2 048) (110.7)Attributable earnings of joint ventures and associates 71 86 157 4.2
Profit/(loss) before taxation 3 517 (1 652) 1 865 (91.5)Taxation (972) 141 (831) 7.6
Profit/(loss) for the year from continuing operations 2 545 (1 511) 1 034 (83.9)Profit from discontinued operations 14 14 – 14 –
Profit/(loss) for the year 2 559 (1 511) 1 048 (83.9)
Segment assets and liabilities Total assets 17 963 12 696 30 659 702.1 Total liabilities (8 470) (9 180) (17 650) (515.8) Debt net of cash (3 587) (1 956) (5 543) (110.0)
Other segment information Additions to property, plant and equipment: Continuing operations 1 901 119 2 020 761 2 781 39.0 Discontinued operation 8 8 8 –
EBITDA margin % 22.6 10.0 21.8 7.4 14.6 7.4Operating margin % 19.5 6.7 18.7 3.2 10.9 3.2Capex additions % of revenue 10.7 10.1 10.7 4.0 7.4 4.4
3 Hospital and Emergency services Primary Care BMI Healthcare
4750 273
25 2
84
14
Revenue (%) EBITDA (%) Operating profit (%)
1. Restated for discontinued operation. 2. Earnings before interest, tax, depreciation and amortisation.
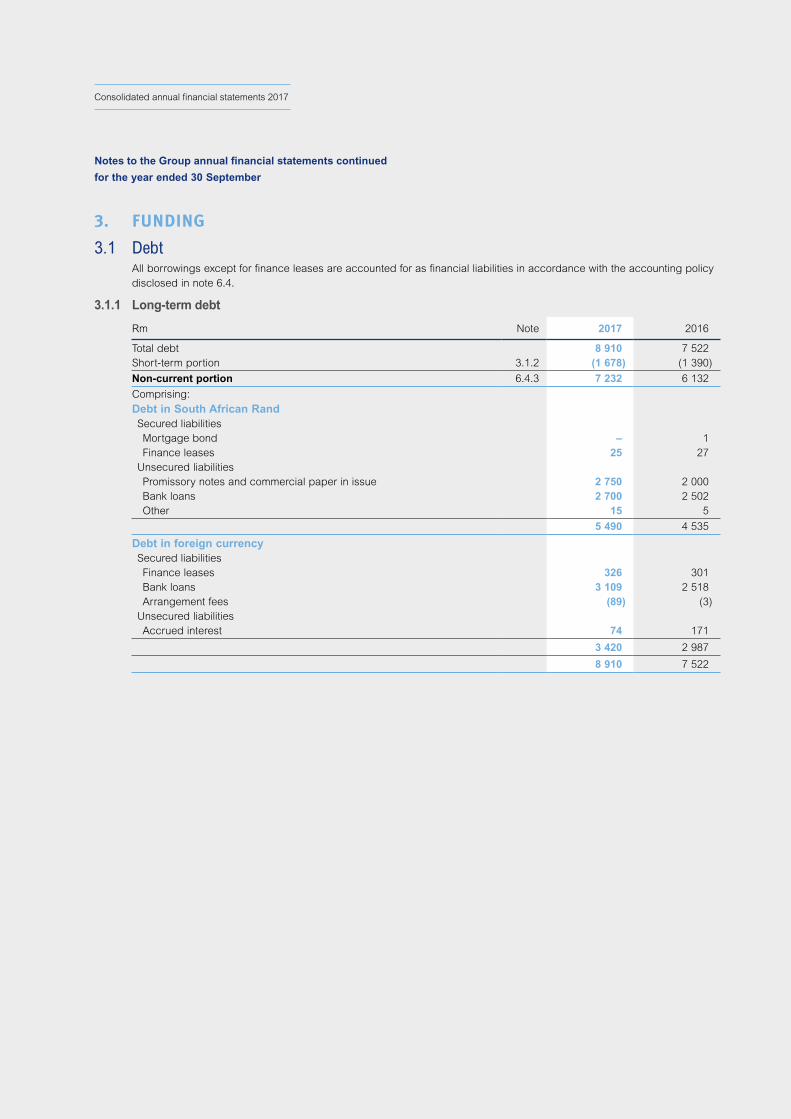
50NETCARE LIMITED
Consolidated annual financial statements 2017
3. FUNDING
3.1 Debt All borrowings except for finance leases are accounted for as financial liabilities in accordance with the accounting policy
disclosed in note 6.4.
3.1.1 Long-term debt
Rm Note 2017 2016
Total debt 8 910 7 522 Short-term portion 3.1.2 (1 678) (1 390)
Non-current portion 6.4.3 7 232 6 132
Comprising:Debt in South African Rand Secured liabilities Mortgage bond – 1 Finance leases 25 27 Unsecured liabilities Promissory notes and commercial paper in issue 2 750 2 000 Bank loans 2 700 2 502 Other 15 5
5 490 4 535
Debt in foreign currency Secured liabilities Finance leases 326 301 Bank loans 3 109 2 518 Arrangement fees (89) (3) Unsecured liabilities Accrued interest 74 171
3 420 2 987
8 910 7 522
Notes to the Group annual financial statements continued
for the year ended 30 September
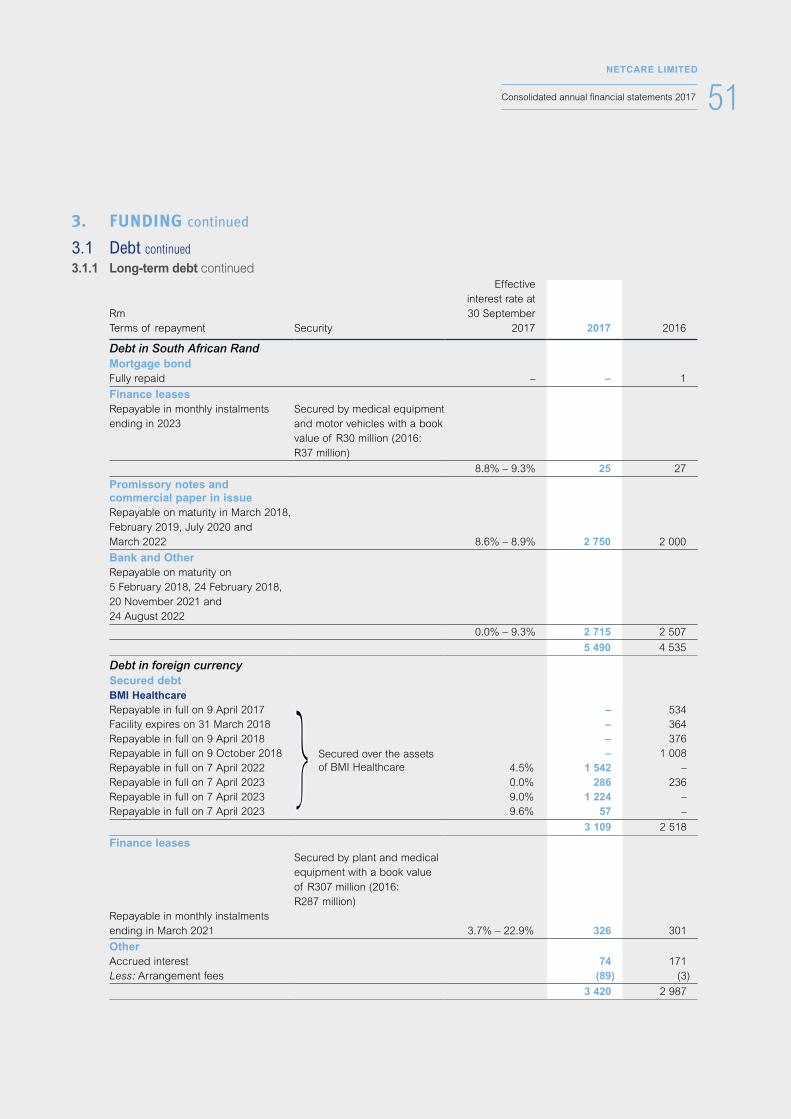
51NETCARE LIMITED
Consolidated annual financial statements 2017
3. FUNDING continued
3.1 Debt continued
3.1.1 Long-term debt continued
RmTerms of repayment Security
Effective interest rate at 30 September
2017 2017 2016
Debt in South African RandMortgage bondFully repaid – – 1
Finance leasesRepayable in monthly instalments ending in 2023
Secured by medical equipment and motor vehicles with a book value of R30 million (2016: R37 million)
8.8% – 9.3% 25 27
Promissory notes and commercial paper in issue Repayable on maturity in March 2018, February 2019, July 2020 and March 2022 8.6% – 8.9% 2 750 2 000
Bank and OtherRepayable on maturity on 5 February 2018, 24 February 2018, 20 November 2021 and 24 August 2022
0.0% – 9.3% 2 715 2 507
5 490 4 535
Debt in foreign currencySecured debtBMI HealthcareRepayable in full on 9 April 2017
Secured over the assets of BMI Healthcare
– 534 Facility expires on 31 March 2018 – 364 Repayable in full on 9 April 2018 – 376 Repayable in full on 9 October 2018 – 1 008 Repayable in full on 7 April 2022 4.5% 1 542 – Repayable in full on 7 April 2023 0.0% 286 236 Repayable in full on 7 April 2023 9.0% 1 224 – Repayable in full on 7 April 2023 9.6% 57 –
3 109 2 518
Finance leasesSecured by plant and medical equipment with a book value of R307 million (2016: R287 million)
Repayable in monthly instalments ending in March 2021 3.7% – 22.9% 326 301
Other Accrued interest 74 171 Less: Arrangement fees (89) (3)
3 420 2 987
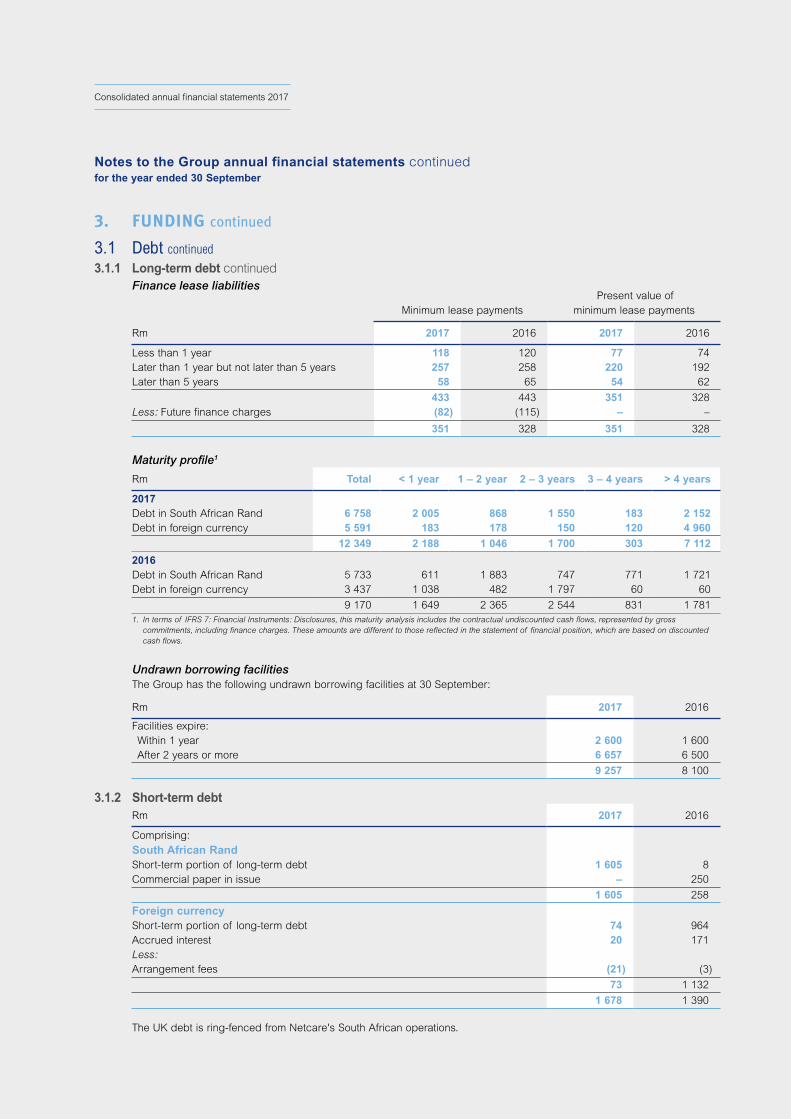
52NETCARE LIMITED
Consolidated annual financial statements 2017
3. FUNDING continued
3.1 Debt continued
3.1.1 Long-term debt continued Finance lease liabilities
Minimum lease payments Present value of
minimum lease payments
Rm 2017 2016 2017 2016
Less than 1 year 118 120 77 74 Later than 1 year but not later than 5 years 257 258 220 192 Later than 5 years 58 65 54 62
433 443 351 328 Less: Future finance charges (82) (115) – –
351 328 351 328
Maturity profile1
Rm Total < 1 year 1 – 2 year 2 – 3 years 3 – 4 years > 4 years
2017Debt in South African Rand 6 758 2 005 868 1 550 183 2 152 Debt in foreign currency 5 591 183 178 150 120 4 960
12 349 2 188 1 046 1 700 303 7 112
2016Debt in South African Rand 5 733 611 1 883 747 771 1 721 Debt in foreign currency 3 437 1 038 482 1 797 60 60
9 170 1 649 2 365 2 544 831 1 781 1. In terms of IFRS 7: Financial Instruments: Disclosures, this maturity analysis includes the contractual undiscounted cash flows, represented by gross
commitments, including finance charges. These amounts are different to those reflected in the statement of financial position, which are based on discounted cash flows.
Undrawn borrowing facilitiesThe Group has the following undrawn borrowing facilities at 30 September:
Rm 2017 2016
Facilities expire: Within 1 year 2 600 1 600 After 2 years or more 6 657 6 500
9 257 8 100
3.1.2 Short-term debtRm 2017 2016
Comprising:South African RandShort-term portion of long-term debt 1 605 8 Commercial paper in issue – 250
1 605 258
Foreign currencyShort-term portion of long-term debt 74 964 Accrued interest 20 171 Less:Arrangement fees (21) (3)
73 1 132
1 678 1 390
The UK debt is ring-fenced from Netcare's South African operations.
Notes to the Group annual financial statements continuedfor the year ended 30 September
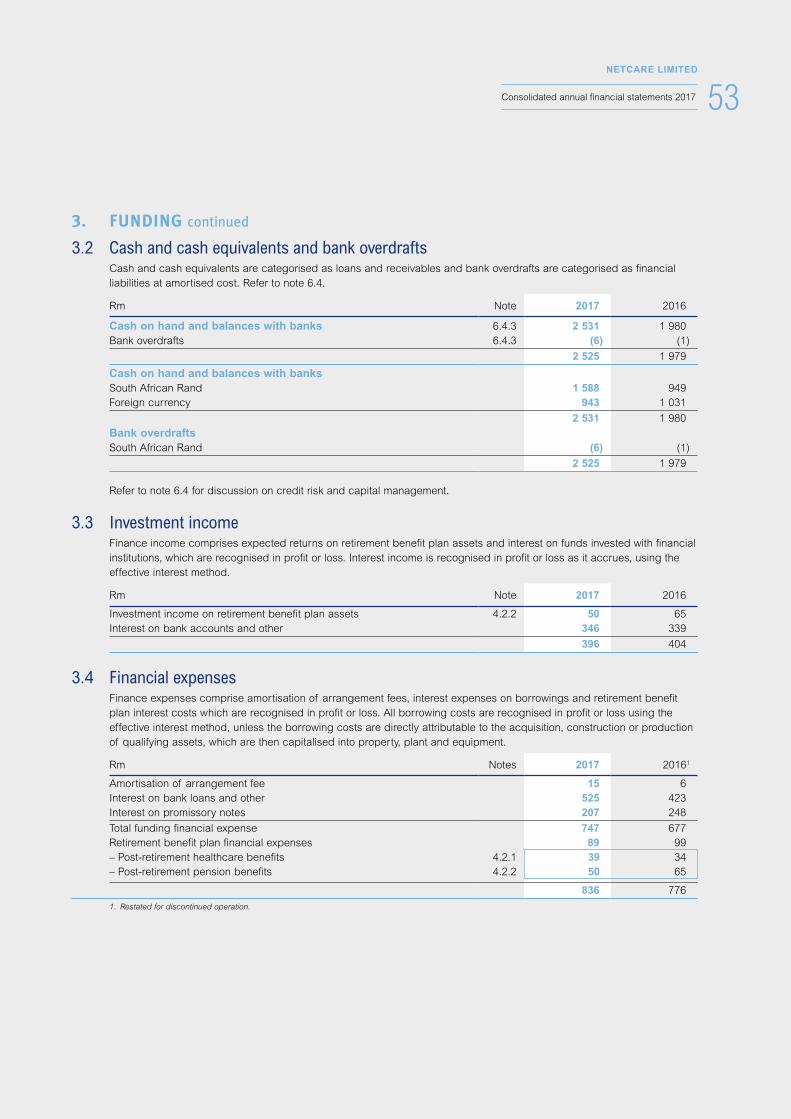
53NETCARE LIMITED
Consolidated annual financial statements 2017
3. FUNDING continued
3.2 Cash and cash equivalents and bank overdrafts Cash and cash equivalents are categorised as loans and receivables and bank overdrafts are categorised as financial
liabilities at amortised cost. Refer to note 6.4.
Rm Note 2017 2016
Cash on hand and balances with banks 6.4.3 2 531 1 980 Bank overdrafts 6.4.3 (6) (1)
2 525 1 979
Cash on hand and balances with banksSouth African Rand 1 588 949 Foreign currency 943 1 031
2 531 1 980 Bank overdraftsSouth African Rand (6) (1)
2 525 1 979
Refer to note 6.4 for discussion on credit risk and capital management.
3.3 Investment income Finance income comprises expected returns on retirement benefit plan assets and interest on funds invested with financial
institutions, which are recognised in profit or loss. Interest income is recognised in profit or loss as it accrues, using the effective interest method.
Rm Note 2017 2016
Investment income on retirement benefit plan assets 4.2.2 50 65 Interest on bank accounts and other 346 339
396 404
3.4 Financial expenses Finance expenses comprise amortisation of arrangement fees, interest expenses on borrowings and retirement benefit
plan interest costs which are recognised in profit or loss. All borrowing costs are recognised in profit or loss using the effective interest method, unless the borrowing costs are directly attributable to the acquisition, construction or production of qualifying assets, which are then capitalised into property, plant and equipment.
Rm Notes 2017 20161
Amortisation of arrangement fee 15 6 Interest on bank loans and other 525 423 Interest on promissory notes 207 248
Total funding financial expense 747 677 Retirement benefit plan financial expenses 89 99 – Post-retirement healthcare benefits 4.2.1 39 34 – Post-retirement pension benefits 4.2.2 50 65
836 776
1. Restated for discontinued operation.
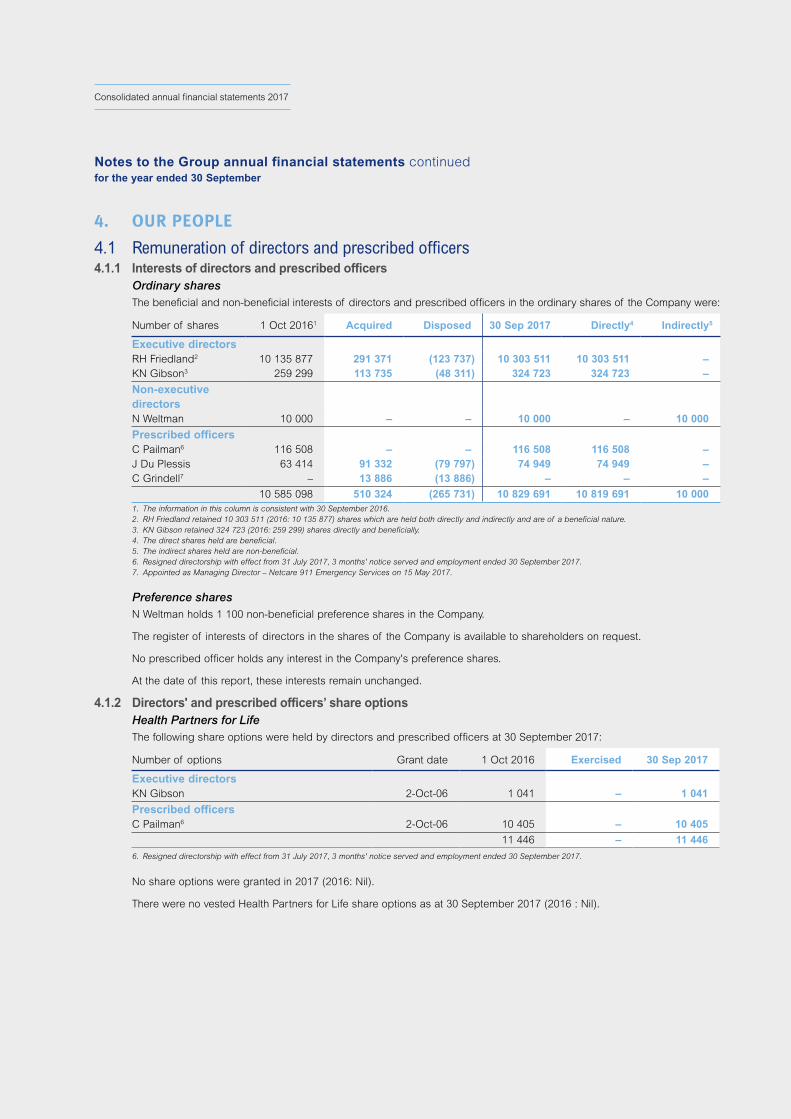
54NETCARE LIMITED
Consolidated annual financial statements 2017
4. OUR PEOPLE
4.1 Remuneration of directors and prescribed officers4.1.1 Interests of directors and prescribed officers Ordinary shares The beneficial and non-beneficial interests of directors and prescribed officers in the ordinary shares of the Company were:
Number of shares 1 Oct 20161 Acquired Disposed 30 Sep 2017 Directly4 Indirectly5
Executive directorsRH Friedland2 10 135 877 291 371 (123 737) 10 303 511 10 303 511 –KN Gibson3 259 299 113 735 (48 311) 324 723 324 723 –
Non-executive directorsN Weltman 10 000 – – 10 000 – 10 000
Prescribed officersC Pailman6 116 508 – – 116 508 116 508 –J Du Plessis 63 414 91 332 (79 797) 74 949 74 949 –C Grindell7 – 13 886 (13 886) – – –
10 585 098 510 324 (265 731) 10 829 691 10 819 691 10 000 1. The information in this column is consistent with 30 September 2016.2. RH Friedland retained 10 303 511 (2016: 10 135 877) shares which are held both directly and indirectly and are of a beneficial nature. 3. KN Gibson retained 324 723 (2016: 259 299) shares directly and beneficially. 4. The direct shares held are beneficial.5. The indirect shares held are non-beneficial.6. Resigned directorship with effect from 31 July 2017, 3 months' notice served and employment ended 30 September 2017. 7. Appointed as Managing Director – Netcare 911 Emergency Services on 15 May 2017.
Preference shares N Weltman holds 1 100 non-beneficial preference shares in the Company.
The register of interests of directors in the shares of the Company is available to shareholders on request.
No prescribed officer holds any interest in the Company's preference shares.
At the date of this report, these interests remain unchanged.
4.1.2 Directors' and prescribed officers’ share options Health Partners for Life The following share options were held by directors and prescribed officers at 30 September 2017:
Number of options Grant date 1 Oct 2016 Exercised 30 Sep 2017
Executive directorsKN Gibson 2-Oct-06 1 041 – 1 041
Prescribed officersC Pailman6 2-Oct-06 10 405 – 10 405
11 446 – 11 446
6. Resigned directorship with effect from 31 July 2017, 3 months' notice served and employment ended 30 September 2017.
No share options were granted in 2017 (2016: Nil).
There were no vested Health Partners for Life share options as at 30 September 2017 (2016 : Nil).
Notes to the Group annual financial statements continuedfor the year ended 30 September
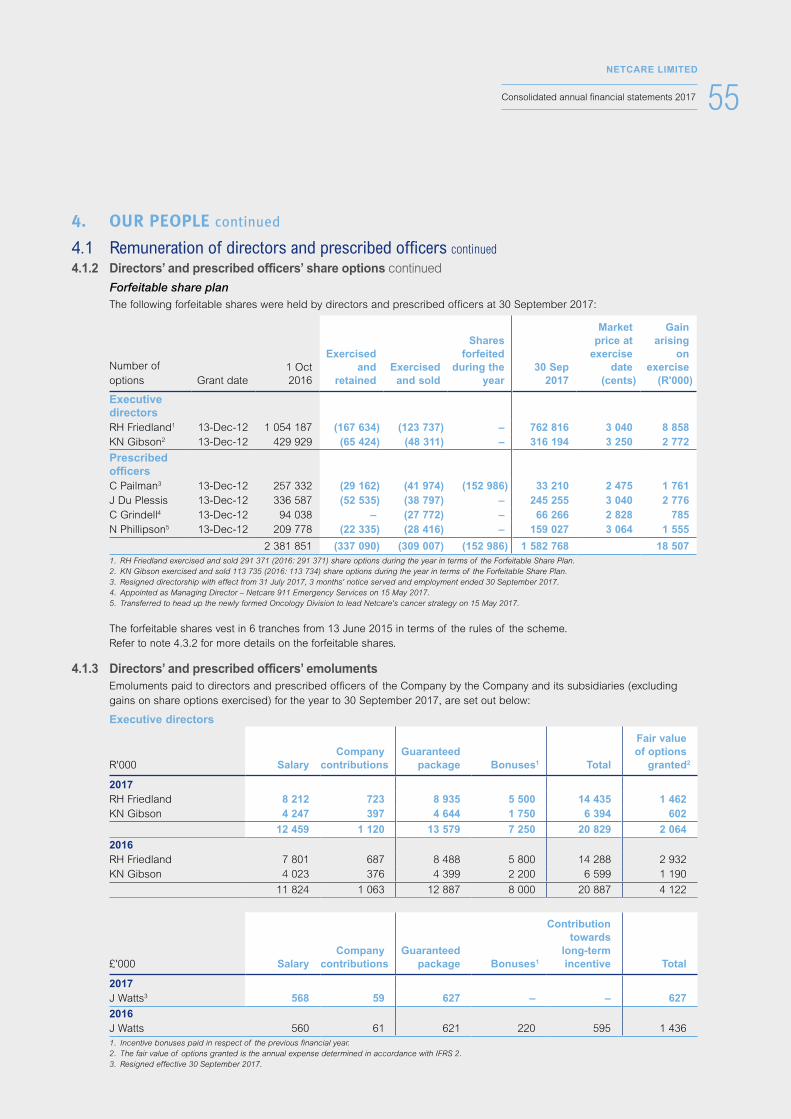
55NETCARE LIMITED
Consolidated annual financial statements 2017
4. OUR PEOPLE continued
4.1 Remuneration of directors and prescribed officers continued
4.1.2 Directors’ and prescribed officers’ share options continued
Forfeitable share plan The following forfeitable shares were held by directors and prescribed officers at 30 September 2017:
Number of options Grant date
1 Oct 2016
Exercised and
retainedExercised and sold
Shares forfeited
during the year
30 Sep 2017
Market price at
exercisedate
(cents)
Gain arising
on exercise
(R'000)
Executive directorsRH Friedland1 13-Dec-12 1 054 187 (167 634) (123 737) – 762 816 3 040 8 858 KN Gibson2 13-Dec-12 429 929 (65 424) (48 311) – 316 194 3 250 2 772
Prescribed officersC Pailman3 13-Dec-12 257 332 (29 162) (41 974) (152 986) 33 210 2 475 1 761 J Du Plessis 13-Dec-12 336 587 (52 535) (38 797) – 245 255 3 040 2 776 C Grindell4 13-Dec-12 94 038 – (27 772) – 66 266 2 828 785 N Phillipson5 13-Dec-12 209 778 (22 335) (28 416) – 159 027 3 064 1 555
2 381 851 (337 090) (309 007) (152 986) 1 582 768 18 507 1. RH Friedland exercised and sold 291 371 (2016: 291 371) share options during the year in terms of the Forfeitable Share Plan. 2. KN Gibson exercised and sold 113 735 (2016: 113 734) share options during the year in terms of the Forfeitable Share Plan. 3. Resigned directorship with effect from 31 July 2017, 3 months' notice served and employment ended 30 September 2017. 4. Appointed as Managing Director – Netcare 911 Emergency Services on 15 May 2017. 5. Transferred to head up the newly formed Oncology Division to lead Netcare's cancer strategy on 15 May 2017.
The forfeitable shares vest in 6 tranches from 13 June 2015 in terms of the rules of the scheme. Refer to note 4.3.2 for more details on the forfeitable shares.
4.1.3 Directors’ and prescribed officers’ emoluments Emoluments paid to directors and prescribed officers of the Company by the Company and its subsidiaries (excluding
gains on share options exercised) for the year to 30 September 2017, are set out below:
Executive directors
R'000 SalaryCompany
contributionsGuaranteed
package Bonuses1 Total
Fair valueof options
granted2
2017RH Friedland 8 212 723 8 935 5 500 14 435 1 462 KN Gibson 4 247 397 4 644 1 750 6 394 602
12 459 1 120 13 579 7 250 20 829 2 064
2016RH Friedland 7 801 687 8 488 5 800 14 288 2 932 KN Gibson 4 023 376 4 399 2 200 6 599 1 190
11 824 1 063 12 887 8 000 20 887 4 122
£'000 SalaryCompany
contributionsGuaranteed
package Bonuses1
Contributiontowards
long-termincentive Total
2017J Watts3 568 59 627 – – 627
2016J Watts 560 61 621 220 595 1 436 1. Incentive bonuses paid in respect of the previous financial year.2. The fair value of options granted is the annual expense determined in accordance with IFRS 2.3. Resigned effective 30 September 2017.
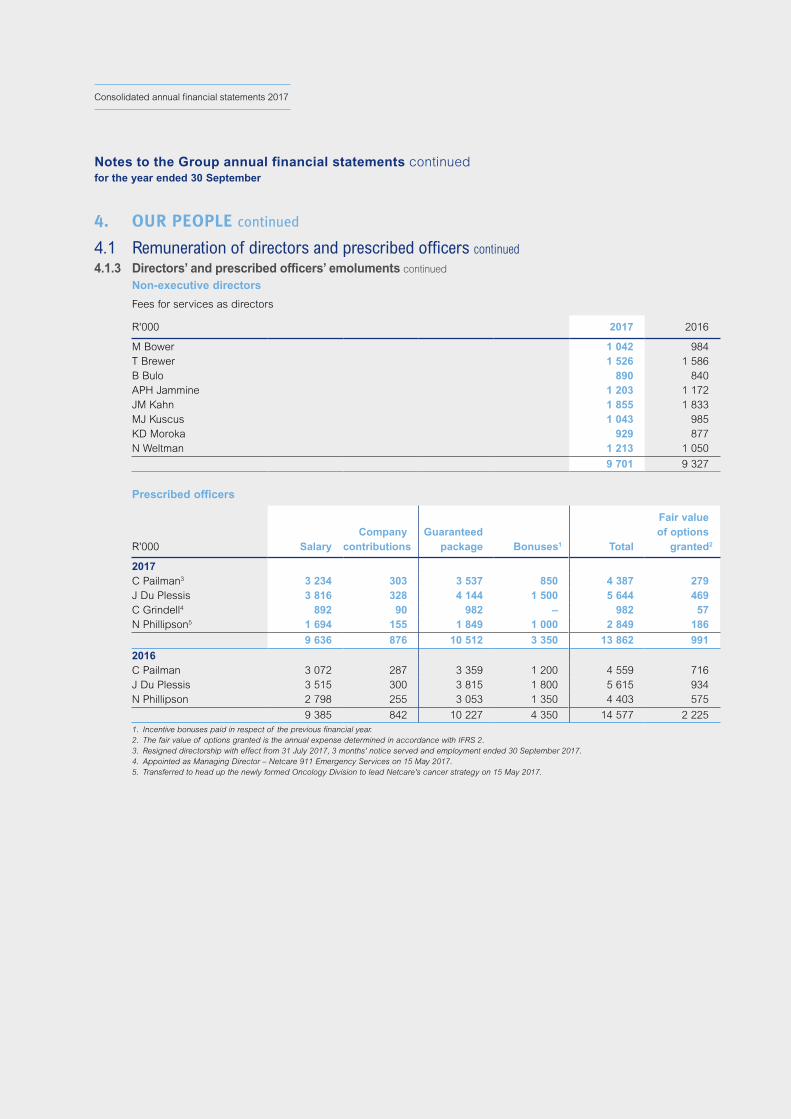
56NETCARE LIMITED
Consolidated annual financial statements 2017
4. OUR PEOPLE continued
4.1 Remuneration of directors and prescribed officers continued
4.1.3 Directors’ and prescribed officers’ emoluments continued
Non-executive directors
Fees for services as directors
R'000 2017 2016
M Bower 1 042 984 T Brewer 1 526 1 586 B Bulo 890 840 APH Jammine 1 203 1 172 JM Kahn 1 855 1 833 MJ Kuscus 1 043 985 KD Moroka 929 877 N Weltman 1 213 1 050
9 701 9 327
Prescribed officers
R'000 SalaryCompany
contributionsGuaranteed
package Bonuses1 Total
Fair valueof options
granted2
2017C Pailman3 3 234 303 3 537 850 4 387 279 J Du Plessis 3 816 328 4 144 1 500 5 644 469 C Grindell4 892 90 982 – 982 57 N Phillipson5 1 694 155 1 849 1 000 2 849 186
9 636 876 10 512 3 350 13 862 991
2016C Pailman 3 072 287 3 359 1 200 4 559 716 J Du Plessis 3 515 300 3 815 1 800 5 615 934 N Phillipson 2 798 255 3 053 1 350 4 403 575
9 385 842 10 227 4 350 14 577 2 225 1. Incentive bonuses paid in respect of the previous financial year.2. The fair value of options granted is the annual expense determined in accordance with IFRS 2.3. Resigned directorship with effect from 31 July 2017, 3 months' notice served and employment ended 30 September 2017. 4. Appointed as Managing Director – Netcare 911 Emergency Services on 15 May 2017. 5. Transferred to head up the newly formed Oncology Division to lead Netcare's cancer strategy on 15 May 2017.
Notes to the Group annual financial statements continuedfor the year ended 30 September
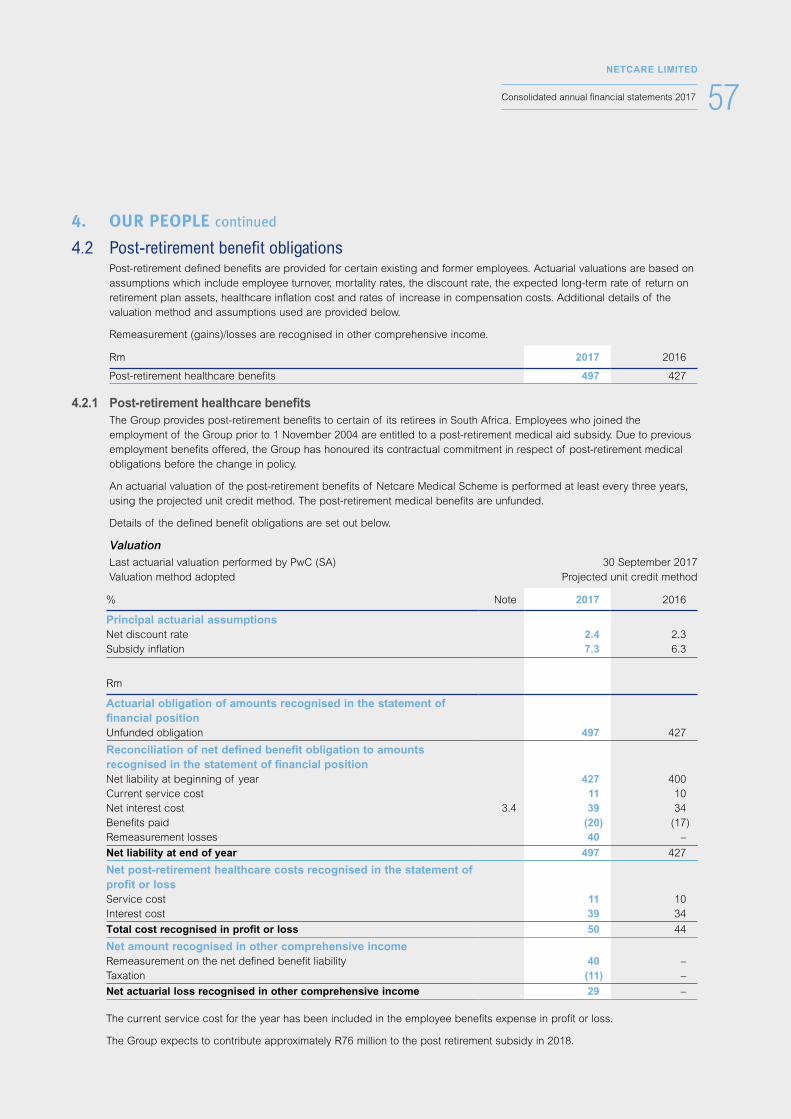
57NETCARE LIMITED
Consolidated annual financial statements 2017
4. OUR PEOPLE continued
4.2 Post-retirement benefit obligations Post-retirement defined benefits are provided for certain existing and former employees. Actuarial valuations are based on
assumptions which include employee turnover, mortality rates, the discount rate, the expected long-term rate of return on retirement plan assets, healthcare inflation cost and rates of increase in compensation costs. Additional details of the valuation method and assumptions used are provided below.
Remeasurement (gains)/losses are recognised in other comprehensive income.
Rm 2017 2016
Post-retirement healthcare benefits 497 427
4.2.1 Post-retirement healthcare benefits The Group provides post-retirement benefits to certain of its retirees in South Africa. Employees who joined the
employment of the Group prior to 1 November 2004 are entitled to a post-retirement medical aid subsidy. Due to previous employment benefits offered, the Group has honoured its contractual commitment in respect of post-retirement medical obligations before the change in policy.
An actuarial valuation of the post-retirement benefits of Netcare Medical Scheme is performed at least every three years, using the projected unit credit method. The post-retirement medical benefits are unfunded.
Details of the defined benefit obligations are set out below.
Valuation Last actuarial valuation performed by PwC (SA) 30 September 2017 Valuation method adopted Projected unit credit method
% Note 2017 2016
Principal actuarial assumptionsNet discount rate 2.4 2.3 Subsidy inflation 7.3 6.3
Rm
Actuarial obligation of amounts recognised in the statement of financial positionUnfunded obligation 497 427
Reconciliation of net defined benefit obligation to amounts recognised in the statement of financial positionNet liability at beginning of year 427 400 Current service cost 11 10 Net interest cost 3.4 39 34 Benefits paid (20) (17)Remeasurement losses 40 –
Net liability at end of year 497 427
Net post-retirement healthcare costs recognised in the statement of profit or lossService cost 11 10 Interest cost 39 34
Total cost recognised in profit or loss 50 44
Net amount recognised in other comprehensive incomeRemeasurement on the net defined benefit liability 40 –Taxation (11) –
Net actuarial loss recognised in other comprehensive income 29 –
The current service cost for the year has been included in the employee benefits expense in profit or loss.
The Group expects to contribute approximately R76 million to the post retirement subsidy in 2018.
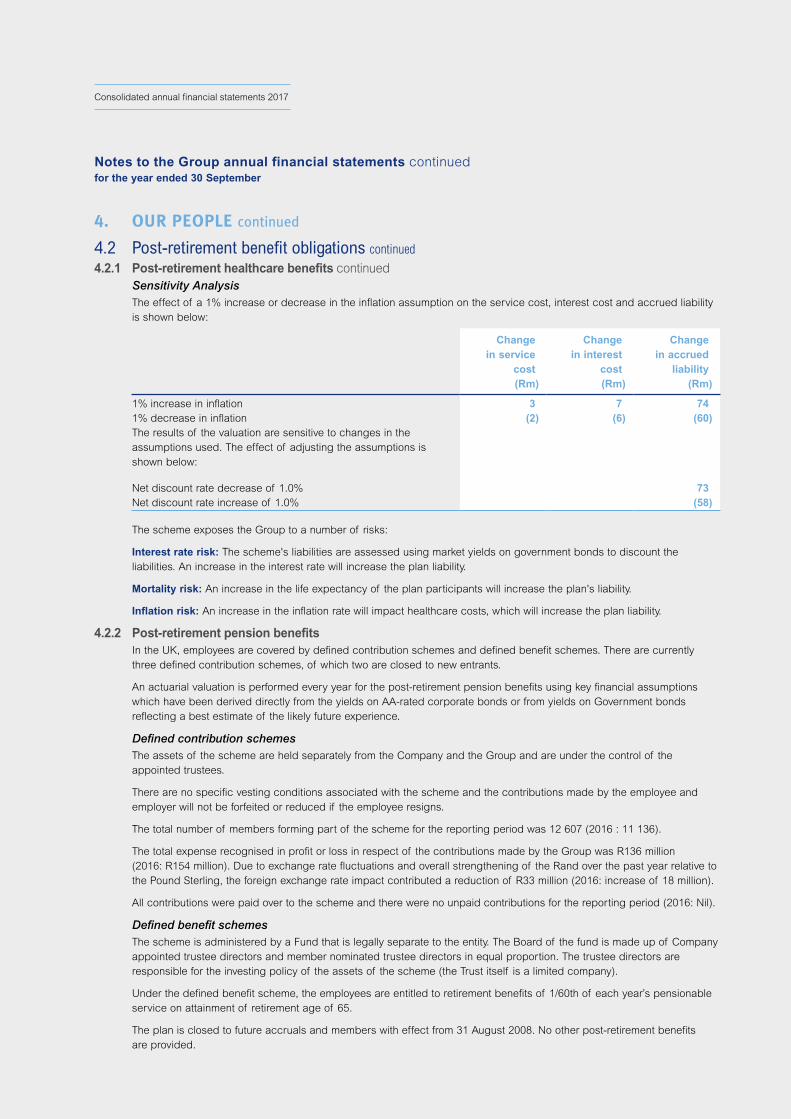
58NETCARE LIMITED
Consolidated annual financial statements 2017
4. OUR PEOPLE continued
4.2 Post-retirement benefit obligations continued
4.2.1 Post-retirement healthcare benefits continued Sensitivity Analysis The effect of a 1% increase or decrease in the inflation assumption on the service cost, interest cost and accrued liability
is shown below:
Change in service
cost (Rm)
Change in interest
cost (Rm)
Change in accrued
liability (Rm)
1% increase in inflation 3 7 74 1% decrease in inflation (2) (6) (60)The results of the valuation are sensitive to changes in the assumptions used. The effect of adjusting the assumptions is shown below:
Net discount rate decrease of 1.0% 73 Net discount rate increase of 1.0% (58)
The scheme exposes the Group to a number of risks:
Interest rate risk: The scheme's liabilities are assessed using market yields on government bonds to discount the liabilities. An increase in the interest rate will increase the plan liability.
Mortality risk: An increase in the life expectancy of the plan participants will increase the plan's liability.
Inflation risk: An increase in the inflation rate will impact healthcare costs, which will increase the plan liability.
4.2.2 Post-retirement pension benefits In the UK, employees are covered by defined contribution schemes and defined benefit schemes. There are currently
three defined contribution schemes, of which two are closed to new entrants.
An actuarial valuation is performed every year for the post-retirement pension benefits using key financial assumptions which have been derived directly from the yields on AA-rated corporate bonds or from yields on Government bonds reflecting a best estimate of the likely future experience.
Defined contribution schemes The assets of the scheme are held separately from the Company and the Group and are under the control of the
appointed trustees.
There are no specific vesting conditions associated with the scheme and the contributions made by the employee and employer will not be forfeited or reduced if the employee resigns.
The total number of members forming part of the scheme for the reporting period was 12 607 (2016 : 11 136).
The total expense recognised in profit or loss in respect of the contributions made by the Group was R136 million (2016: R154 million). Due to exchange rate fluctuations and overall strengthening of the Rand over the past year relative to the Pound Sterling, the foreign exchange rate impact contributed a reduction of R33 million (2016: increase of 18 million).
All contributions were paid over to the scheme and there were no unpaid contributions for the reporting period (2016: Nil).
Defined benefit schemes The scheme is administered by a Fund that is legally separate to the entity. The Board of the fund is made up of Company
appointed trustee directors and member nominated trustee directors in equal proportion. The trustee directors are responsible for the investing policy of the assets of the scheme (the Trust itself is a limited company).
Under the defined benefit scheme, the employees are entitled to retirement benefits of 1/60th of each year’s pensionable service on attainment of retirement age of 65.
The plan is closed to future accruals and members with effect from 31 August 2008. No other post-retirement benefits are provided.
Notes to the Group annual financial statements continuedfor the year ended 30 September
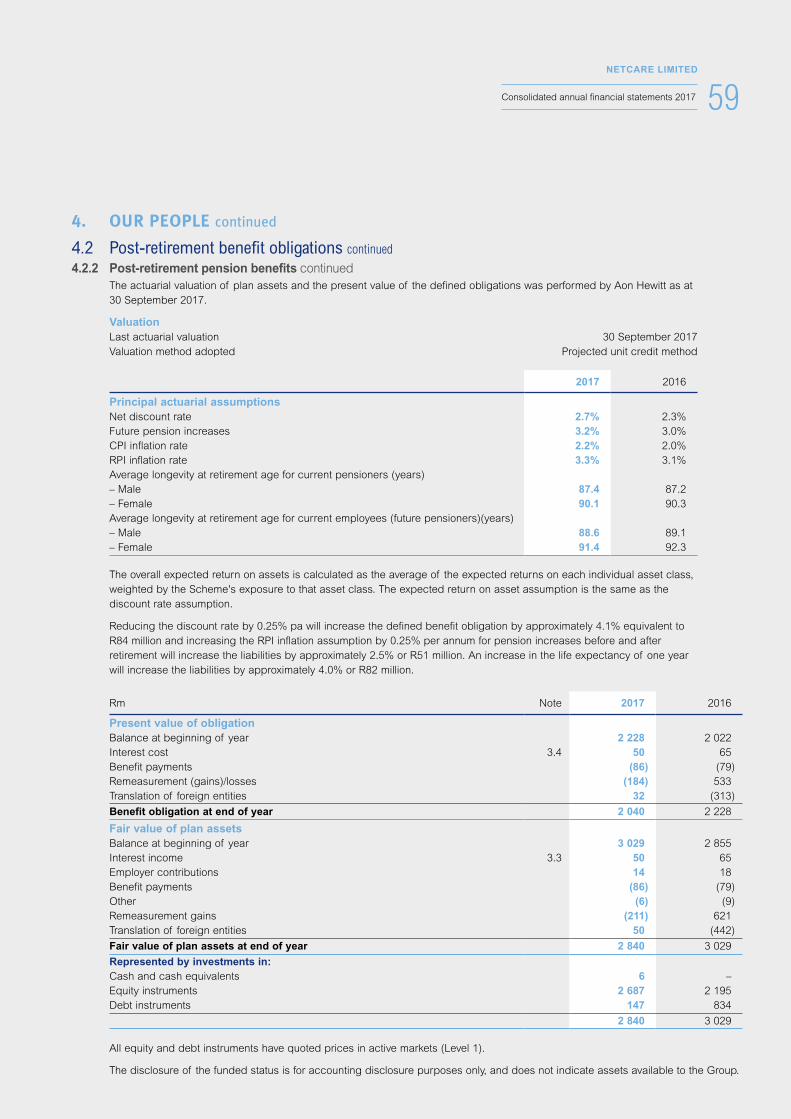
59NETCARE LIMITED
Consolidated annual financial statements 2017
4. OUR PEOPLE continued
4.2 Post-retirement benefit obligations continued
4.2.2 Post-retirement pension benefits continued The actuarial valuation of plan assets and the present value of the defined obligations was performed by Aon Hewitt as at
30 September 2017.
Valuation Last actuarial valuation 30 September 2017 Valuation method adopted Projected unit credit method
2017 2016
Principal actuarial assumptionsNet discount rate 2.7% 2.3%Future pension increases 3.2% 3.0%CPI inflation rate 2.2% 2.0%RPI inflation rate 3.3% 3.1%Average longevity at retirement age for current pensioners (years)– Male 87.4 87.2 – Female 90.1 90.3 Average longevity at retirement age for current employees (future pensioners)(years)– Male 88.6 89.1 – Female 91.4 92.3
The overall expected return on assets is calculated as the average of the expected returns on each individual asset class, weighted by the Scheme's exposure to that asset class. The expected return on asset assumption is the same as the discount rate assumption.
Reducing the discount rate by 0.25% pa will increase the defined benefit obligation by approximately 4.1% equivalent to R84 million and increasing the RPI inflation assumption by 0.25% per annum for pension increases before and after retirement will increase the liabilities by approximately 2.5% or R51 million. An increase in the life expectancy of one year will increase the liabilities by approximately 4.0% or R82 million.
Rm Note 2017 2016
Present value of obligationBalance at beginning of year 2 228 2 022 Interest cost 3.4 50 65 Benefit payments (86) (79)Remeasurement (gains)/losses (184) 533 Translation of foreign entities 32 (313)
Benefit obligation at end of year 2 040 2 228
Fair value of plan assetsBalance at beginning of year 3 029 2 855 Interest income 3.3 50 65 Employer contributions 14 18 Benefit payments (86) (79)Other (6) (9)Remeasurement gains (211) 621 Translation of foreign entities 50 (442)
Fair value of plan assets at end of year 2 840 3 029
Represented by investments in:Cash and cash equivalents 6 –Equity instruments 2 687 2 195 Debt instruments 147 834
2 840 3 029
All equity and debt instruments have quoted prices in active markets (Level 1).
The disclosure of the funded status is for accounting disclosure purposes only, and does not indicate assets available to the Group.
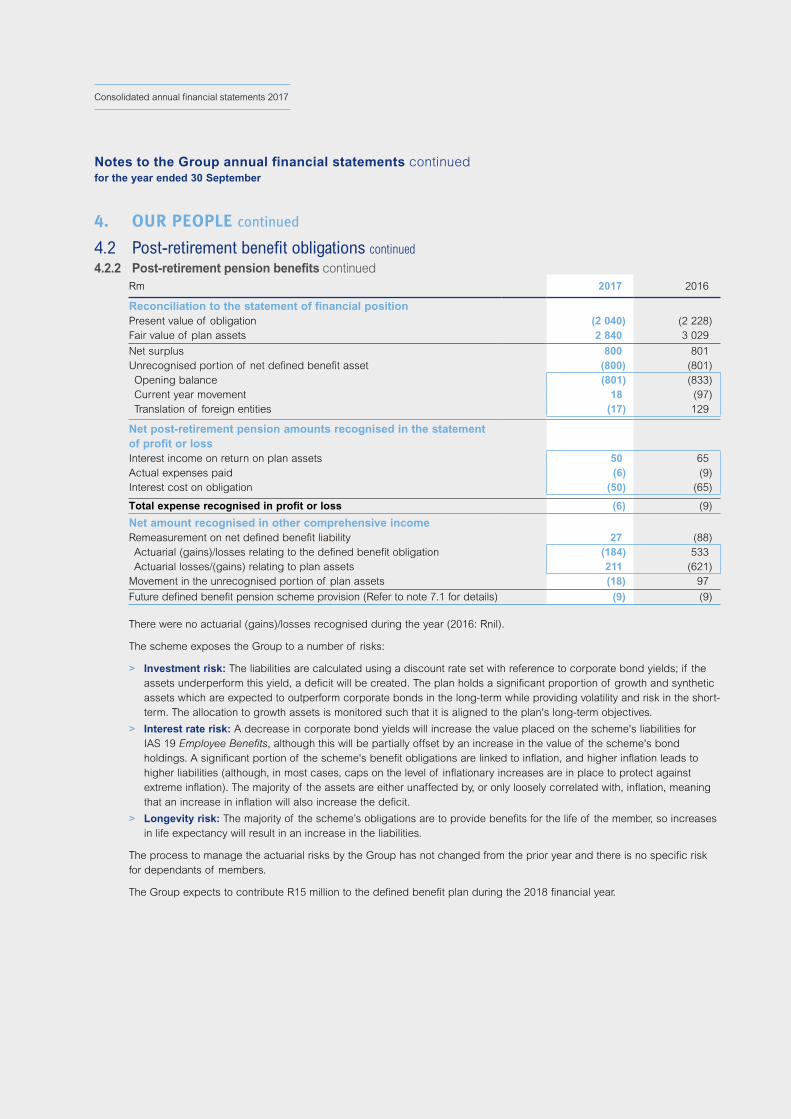
60NETCARE LIMITED
Consolidated annual financial statements 2017
4. OUR PEOPLE continued
4.2 Post-retirement benefit obligations continued
4.2.2 Post-retirement pension benefits continuedRm 2017 2016
Reconciliation to the statement of financial positionPresent value of obligation (2 040) (2 228)Fair value of plan assets 2 840 3 029
Net surplus 800 801 Unrecognised portion of net defined benefit asset (800) (801) Opening balance (801) (833) Current year movement 18 (97) Translation of foreign entities (17) 129
Net post-retirement pension amounts recognised in the statement of profit or lossInterest income on return on plan assets 50 65 Actual expenses paid (6) (9)Interest cost on obligation (50) (65)
Total expense recognised in profit or loss (6) (9)
Net amount recognised in other comprehensive incomeRemeasurement on net defined benefit liability 27 (88) Actuarial (gains)/losses relating to the defined benefit obligation (184) 533 Actuarial losses/(gains) relating to plan assets 211 (621)Movement in the unrecognised portion of plan assets (18) 97
Future defined benefit pension scheme provision (Refer to note 7.1 for details) (9) (9)
There were no actuarial (gains)/losses recognised during the year (2016: Rnil).
The scheme exposes the Group to a number of risks:
> Investment risk: The liabilities are calculated using a discount rate set with reference to corporate bond yields; if the assets underperform this yield, a deficit will be created. The plan holds a significant proportion of growth and synthetic assets which are expected to outperform corporate bonds in the long-term while providing volatility and risk in the short-term. The allocation to growth assets is monitored such that it is aligned to the plan's long-term objectives.
> Interest rate risk: A decrease in corporate bond yields will increase the value placed on the scheme's liabilities for IAS 19 Employee Benefits, although this will be partially offset by an increase in the value of the scheme's bond holdings. A significant portion of the scheme's benefit obligations are linked to inflation, and higher inflation leads to higher liabilities (although, in most cases, caps on the level of inflationary increases are in place to protect against extreme inflation). The majority of the assets are either unaffected by, or only loosely correlated with, inflation, meaning that an increase in inflation will also increase the deficit.
> Longevity risk: The majority of the scheme’s obligations are to provide benefits for the life of the member, so increases in life expectancy will result in an increase in the liabilities.
The process to manage the actuarial risks by the Group has not changed from the prior year and there is no specific risk for dependants of members.
The Group expects to contribute R15 million to the defined benefit plan during the 2018 financial year.
Notes to the Group annual financial statements continuedfor the year ended 30 September

61NETCARE LIMITED
Consolidated annual financial statements 2017
4. OUR PEOPLE continued
4.3 Share-based payments The Group has three equity settled share schemes, namely the Netcare Share Incentive Scheme, Netcare Limited
Forfeitable Share Plan (FSP) and Health Partners for Life (B-BBEE transaction).
The fair value of options granted in terms of the Netcare Share Incentive Scheme and the Trust units issued in terms of the Health Partners for Life initiative are determined using the Trinomial model. The fair value of forfeitable shares granted in terms of the Forfeitable Share Plan is determined by using the weighted average traded share price on grant date. Additional details regarding the assumptions used to value the share options and trust units are shown below.
The following amounts relating to share-based payments were included, before tax in the statement of profit or loss during the year.
Rm Notes 2017 2016
Equity-settledNetcare Share Incentive Scheme1 4.3.1 – 1 The Group grants share options to certain employees under the Netcare Share Incentive Scheme. The fair value of the employee services received in exchange for the grant of options is recognised as an expense with a corresponding increase in equity. The total amount to be expensed over the vesting period is determined with reference to the fair value of the options granted on grant date and is expensed on a straight-line basis over the vesting period. The fair value is determined by using the Trinomial model and the assumptions used to determine the fair value are detailed in note 4.3.1
Netcare Limited Forfeitable Share Plan 4.3.2 44 29 The Group awards forfeitable shares to certain employees subject to performance (performance shares) and retention (retention shares) conditions. The total amount to be expensed over the vesting period is determined with reference to the fair value of the units at grant date and is expensed on a straight-line basis over the vesting period. The fair value is determined by using the weighted average traded share price on grant date and the assumptions to determine the fair value are detailed in note 4.3.2. For the performance shares, the probability of achieving the performance condition is used to determine the expense in each reporting period. Vesting conditions, including performance conditions, are taken into account by adjusting the number of forfeitable shares so that the amount recognised for services received as consideration for the forfeitable shares granted, will be based on the number of forfeitable shares that eventually vest. The fair value model and the assumptions used to determine the fair value are detailed in note 4.3.2
Health Partners for Life (B-BBEE transaction) 4.3.3 2 3 The beneficiaries of the Health Partners for Life Trusts hold Trust units which entitle them to the economic benefits of a specified number of Netcare shares over a vesting period. The total amount to be expensed over the vesting period is determined with reference to the fair value of the units at grant date and is expensed on a straight-line basis over the vesting period. The fair value is determined by using the Trinomial model and the assumptions used to determine the fair value are detailed in note 4.3.3.
46 33
1. No further awards are being made under this scheme.
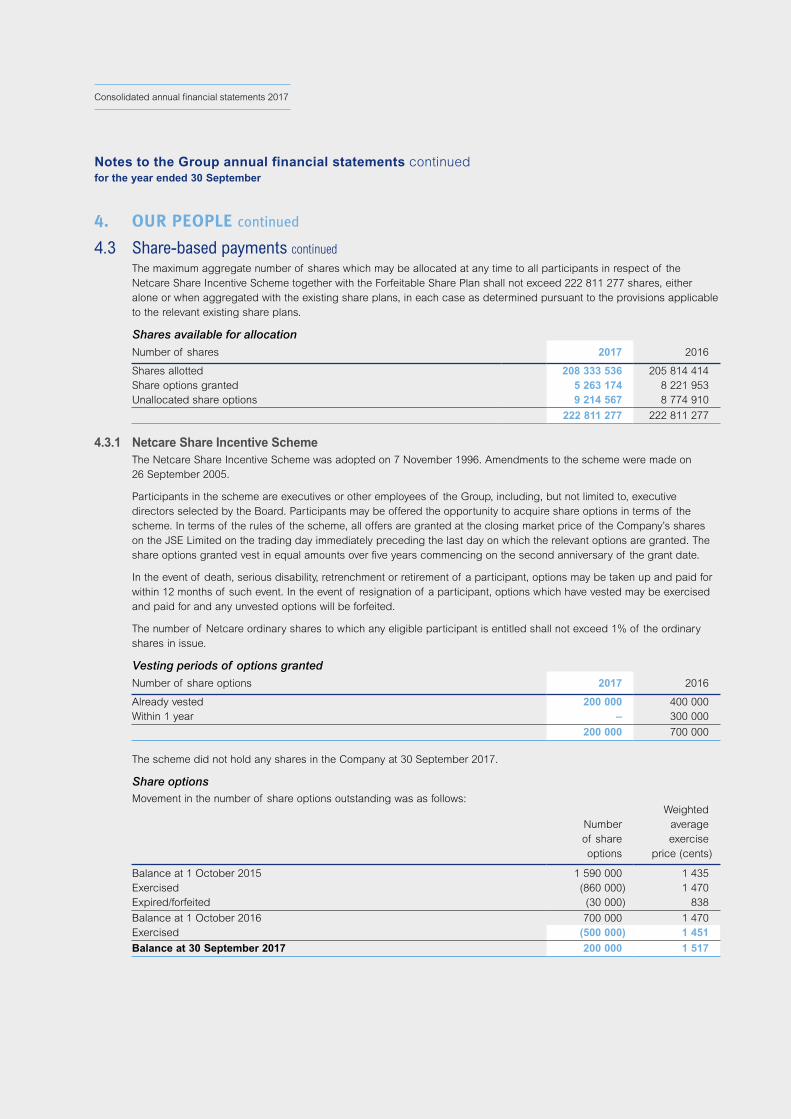
62NETCARE LIMITED
Consolidated annual financial statements 2017
4. OUR PEOPLE continued
4.3 Share-based payments continued The maximum aggregate number of shares which may be allocated at any time to all participants in respect of the
Netcare Share Incentive Scheme together with the Forfeitable Share Plan shall not exceed 222 811 277 shares, either alone or when aggregated with the existing share plans, in each case as determined pursuant to the provisions applicable to the relevant existing share plans.
Shares available for allocationNumber of shares 2017 2016
Shares allotted 208 333 536 205 814 414 Share options granted 5 263 174 8 221 953 Unallocated share options 9 214 567 8 774 910
222 811 277 222 811 277
4.3.1 Netcare Share Incentive Scheme The Netcare Share Incentive Scheme was adopted on 7 November 1996. Amendments to the scheme were made on
26 September 2005.
Participants in the scheme are executives or other employees of the Group, including, but not limited to, executive directors selected by the Board. Participants may be offered the opportunity to acquire share options in terms of the scheme. In terms of the rules of the scheme, all offers are granted at the closing market price of the Company’s shares on the JSE Limited on the trading day immediately preceding the last day on which the relevant options are granted. The share options granted vest in equal amounts over five years commencing on the second anniversary of the grant date.
In the event of death, serious disability, retrenchment or retirement of a participant, options may be taken up and paid for within 12 months of such event. In the event of resignation of a participant, options which have vested may be exercised and paid for and any unvested options will be forfeited.
The number of Netcare ordinary shares to which any eligible participant is entitled shall not exceed 1% of the ordinary shares in issue.
Vesting periods of options grantedNumber of share options 2017 2016
Already vested 200 000 400 000 Within 1 year – 300 000
200 000 700 000
The scheme did not hold any shares in the Company at 30 September 2017.
Share optionsMovement in the number of share options outstanding was as follows:
Number of share options
Weighted average exercise
price (cents)
Balance at 1 October 2015 1 590 000 1 435 Exercised (860 000) 1 470 Expired/forfeited (30 000) 838
Balance at 1 October 2016 700 000 1 470 Exercised (500 000) 1 451
Balance at 30 September 2017 200 000 1 517
Notes to the Group annual financial statements continuedfor the year ended 30 September
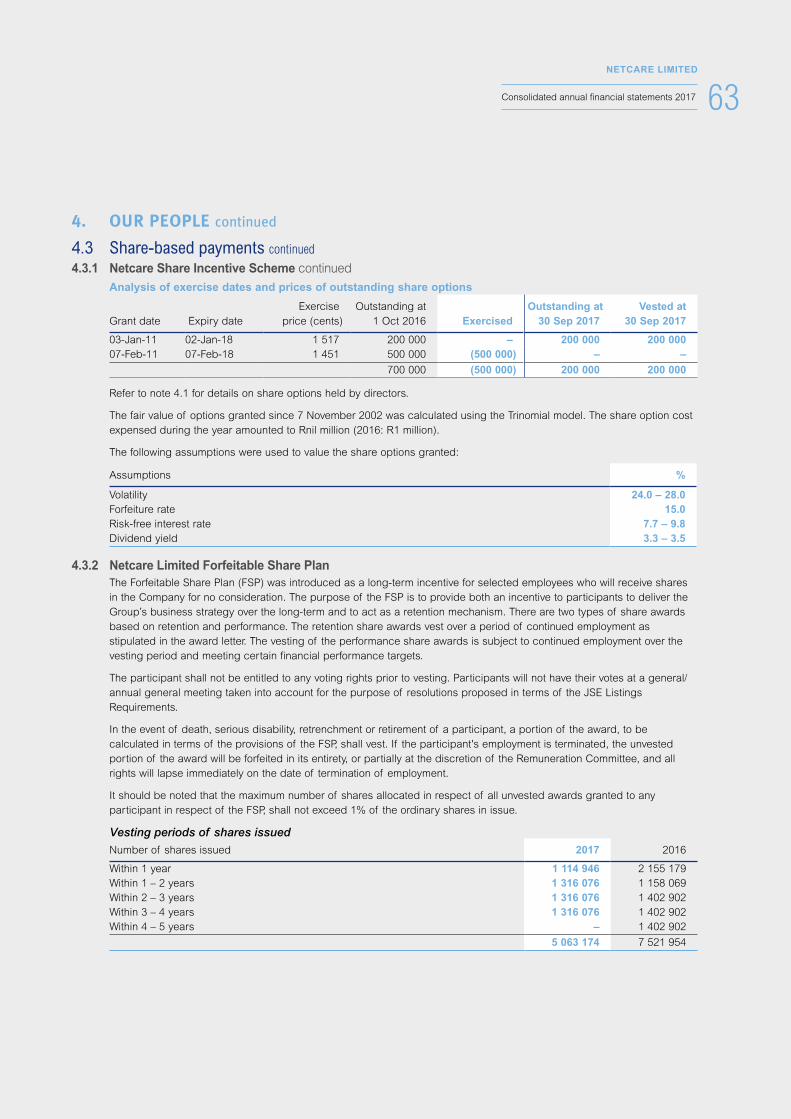
63NETCARE LIMITED
Consolidated annual financial statements 2017
4. OUR PEOPLE continued
4.3 Share-based payments continued
4.3.1 Netcare Share Incentive Scheme continued Analysis of exercise dates and prices of outstanding share options
Grant date Expiry date Exercise
price (cents) Outstanding at
1 Oct 2016 Exercised Outstanding at
30 Sep 2017 Vested at
30 Sep 2017
03-Jan-11 02-Jan-18 1 517 200 000 – 200 000 200 000 07-Feb-11 07-Feb-18 1 451 500 000 (500 000) – –
700 000 (500 000) 200 000 200 000
Refer to note 4.1 for details on share options held by directors.
The fair value of options granted since 7 November 2002 was calculated using the Trinomial model. The share option cost expensed during the year amounted to Rnil million (2016: R1 million).
The following assumptions were used to value the share options granted:
Assumptions %
Volatility 24.0 – 28.0 Forfeiture rate 15.0 Risk-free interest rate 7.7 – 9.8 Dividend yield 3.3 – 3.5
4.3.2 Netcare Limited Forfeitable Share Plan The Forfeitable Share Plan (FSP) was introduced as a long-term incentive for selected employees who will receive shares
in the Company for no consideration. The purpose of the FSP is to provide both an incentive to participants to deliver the Group’s business strategy over the long-term and to act as a retention mechanism. There are two types of share awards based on retention and performance. The retention share awards vest over a period of continued employment as stipulated in the award letter. The vesting of the performance share awards is subject to continued employment over the vesting period and meeting certain financial performance targets.
The participant shall not be entitled to any voting rights prior to vesting. Participants will not have their votes at a general/annual general meeting taken into account for the purpose of resolutions proposed in terms of the JSE Listings Requirements.
In the event of death, serious disability, retrenchment or retirement of a participant, a portion of the award, to be calculated in terms of the provisions of the FSP, shall vest. If the participant's employment is terminated, the unvested portion of the award will be forfeited in its entirety, or partially at the discretion of the Remuneration Committee, and all rights will lapse immediately on the date of termination of employment.
It should be noted that the maximum number of shares allocated in respect of all unvested awards granted to any participant in respect of the FSP, shall not exceed 1% of the ordinary shares in issue.
Vesting periods of shares issuedNumber of shares issued 2017 2016
Within 1 year 1 114 946 2 155 179 Within 1 – 2 years 1 316 076 1 158 069 Within 2 – 3 years 1 316 076 1 402 902 Within 3 – 4 years 1 316 076 1 402 902 Within 4 – 5 years – 1 402 902
5 063 174 7 521 954
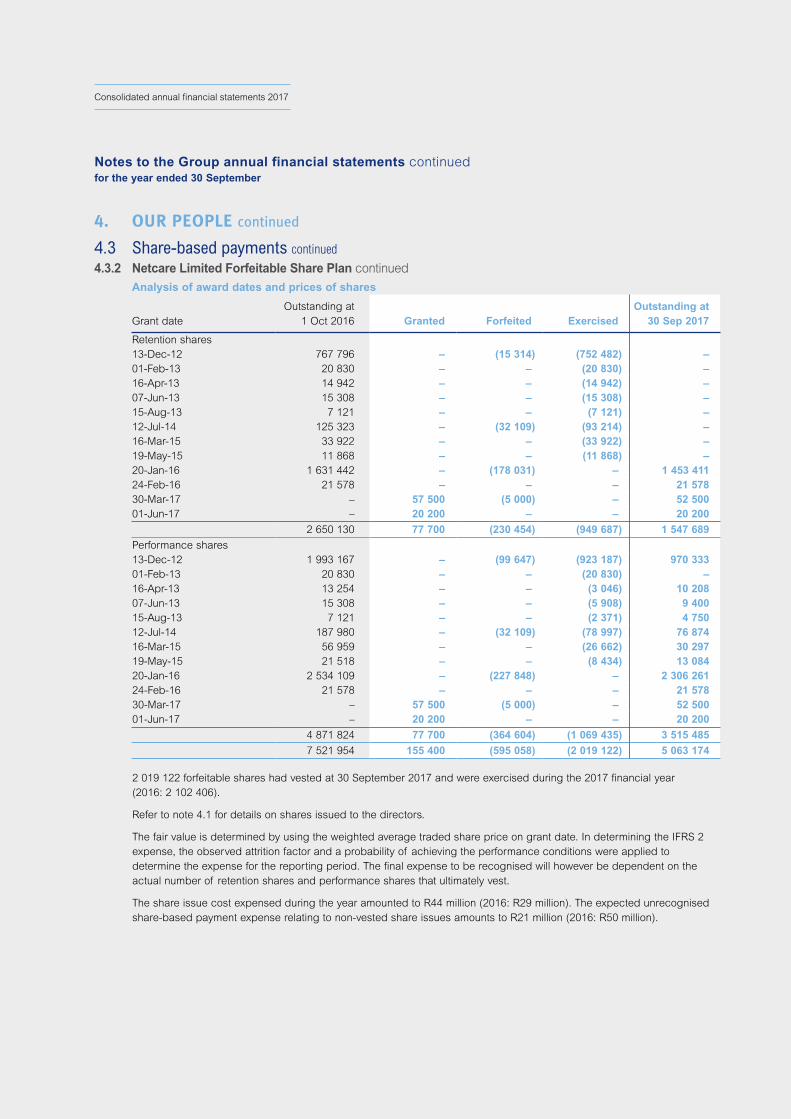
64NETCARE LIMITED
Consolidated annual financial statements 2017
4. OUR PEOPLE continued
4.3 Share-based payments continued
4.3.2 Netcare Limited Forfeitable Share Plan continued Analysis of award dates and prices of shares
Grant date Outstanding at
1 Oct 2016 Granted Forfeited Exercised Outstanding at
30 Sep 2017
Retention shares13-Dec-12 767 796 – (15 314) (752 482) – 01-Feb-13 20 830 – – (20 830) – 16-Apr-13 14 942 – – (14 942) – 07-Jun-13 15 308 – – (15 308) – 15-Aug-13 7 121 – – (7 121) – 12-Jul-14 125 323 – (32 109) (93 214) – 16-Mar-15 33 922 – – (33 922) – 19-May-15 11 868 – – (11 868) – 20-Jan-16 1 631 442 – (178 031) – 1 453 411 24-Feb-16 21 578 – – – 21 578 30-Mar-17 – 57 500 (5 000) – 52 500 01-Jun-17 – 20 200 – – 20 200
2 650 130 77 700 (230 454) (949 687) 1 547 689
Performance shares13-Dec-12 1 993 167 – (99 647) (923 187) 970 333 01-Feb-13 20 830 – – (20 830) – 16-Apr-13 13 254 – – (3 046) 10 208 07-Jun-13 15 308 – – (5 908) 9 400 15-Aug-13 7 121 – – (2 371) 4 750 12-Jul-14 187 980 – (32 109) (78 997) 76 874 16-Mar-15 56 959 – – (26 662) 30 297 19-May-15 21 518 – – (8 434) 13 084 20-Jan-16 2 534 109 – (227 848) – 2 306 261 24-Feb-16 21 578 – – – 21 578 30-Mar-17 – 57 500 (5 000) – 52 500 01-Jun-17 – 20 200 – – 20 200
4 871 824 77 700 (364 604) (1 069 435) 3 515 485
7 521 954 155 400 (595 058) (2 019 122) 5 063 174
2 019 122 forfeitable shares had vested at 30 September 2017 and were exercised during the 2017 financial year (2016: 2 102 406).
Refer to note 4.1 for details on shares issued to the directors.
The fair value is determined by using the weighted average traded share price on grant date. In determining the IFRS 2 expense, the observed attrition factor and a probability of achieving the performance conditions were applied to determine the expense for the reporting period. The final expense to be recognised will however be dependent on the actual number of retention shares and performance shares that ultimately vest.
The share issue cost expensed during the year amounted to R44 million (2016: R29 million). The expected unrecognised share-based payment expense relating to non-vested share issues amounts to R21 million (2016: R50 million).
Notes to the Group annual financial statements continuedfor the year ended 30 September
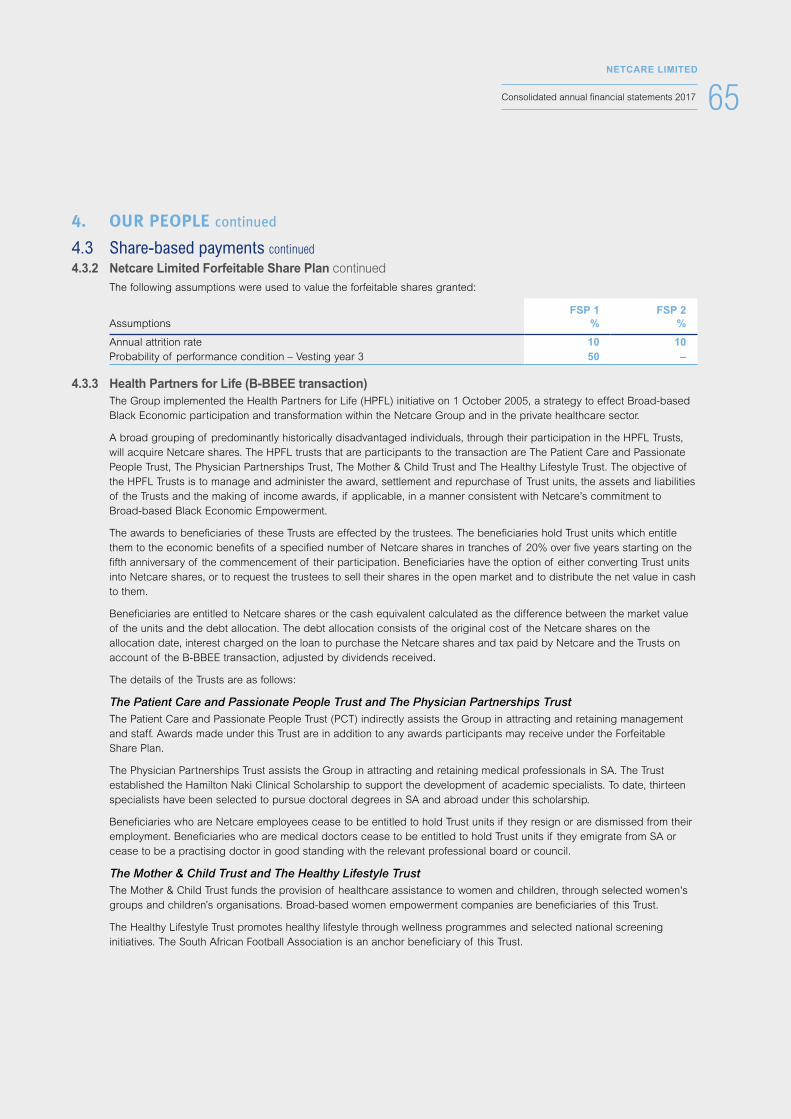
65NETCARE LIMITED
Consolidated annual financial statements 2017
4. OUR PEOPLE continued
4.3 Share-based payments continued
4.3.2 Netcare Limited Forfeitable Share Plan continued The following assumptions were used to value the forfeitable shares granted:
Assumptions FSP 1
% FSP 2
%
Annual attrition rate 10 10 Probability of performance condition – Vesting year 3 50 –
4.3.3 Health Partners for Life (B-BBEE transaction) The Group implemented the Health Partners for Life (HPFL) initiative on 1 October 2005, a strategy to effect Broad-based
Black Economic participation and transformation within the Netcare Group and in the private healthcare sector.
A broad grouping of predominantly historically disadvantaged individuals, through their participation in the HPFL Trusts, will acquire Netcare shares. The HPFL trusts that are participants to the transaction are The Patient Care and Passionate People Trust, The Physician Partnerships Trust, The Mother & Child Trust and The Healthy Lifestyle Trust. The objective of the HPFL Trusts is to manage and administer the award, settlement and repurchase of Trust units, the assets and liabilities of the Trusts and the making of income awards, if applicable, in a manner consistent with Netcare’s commitment to Broad-based Black Economic Empowerment.
The awards to beneficiaries of these Trusts are effected by the trustees. The beneficiaries hold Trust units which entitle them to the economic benefits of a specified number of Netcare shares in tranches of 20% over five years starting on the fifth anniversary of the commencement of their participation. Beneficiaries have the option of either converting Trust units into Netcare shares, or to request the trustees to sell their shares in the open market and to distribute the net value in cash to them.
Beneficiaries are entitled to Netcare shares or the cash equivalent calculated as the difference between the market value of the units and the debt allocation. The debt allocation consists of the original cost of the Netcare shares on the allocation date, interest charged on the loan to purchase the Netcare shares and tax paid by Netcare and the Trusts on account of the B-BBEE transaction, adjusted by dividends received.
The details of the Trusts are as follows:
The Patient Care and Passionate People Trust and The Physician Partnerships Trust The Patient Care and Passionate People Trust (PCT) indirectly assists the Group in attracting and retaining management
and staff. Awards made under this Trust are in addition to any awards participants may receive under the Forfeitable Share Plan.
The Physician Partnerships Trust assists the Group in attracting and retaining medical professionals in SA. The Trust established the Hamilton Naki Clinical Scholarship to support the development of academic specialists. To date, thirteen specialists have been selected to pursue doctoral degrees in SA and abroad under this scholarship.
Beneficiaries who are Netcare employees cease to be entitled to hold Trust units if they resign or are dismissed from their employment. Beneficiaries who are medical doctors cease to be entitled to hold Trust units if they emigrate from SA or cease to be a practising doctor in good standing with the relevant professional board or council.
The Mother & Child Trust and The Healthy Lifestyle Trust The Mother & Child Trust funds the provision of healthcare assistance to women and children, through selected women's
groups and children’s organisations. Broad-based women empowerment companies are beneficiaries of this Trust.
The Healthy Lifestyle Trust promotes healthy lifestyle through wellness programmes and selected national screening initiatives. The South African Football Association is an anchor beneficiary of this Trust.

66NETCARE LIMITED
Consolidated annual financial statements 2017
4. OUR PEOPLE continued
4.3 Share-based payments continued
4.3.3 Health Partners for Life (B-BBEE transaction) continued Details of the Trust units at 30 September 2017 are:
Trust
Shares allocated
to trust 1 Oct 2016
Disposals during the
year
Shares allocated
to trust 30 Sep 2017
Units in issue Available
The Patient Care and Passionate People Trust 48 308 657 (1 102 579) 47 206 078 9 940 345 37 265 733 The Physician Partnerships Trust 34 941 696 (459 214) 34 482 482 13 029 200 21 453 282 The Mother & Child Trust 9 916 737 – 9 916 737 – 9 916 737 The Healthy Lifestyle Trust 5 282 061 (21 684) 5 260 377 556 944 4 703 433
98 449 151 (1 583 477) 96 865 674 23 526 489 73 339 185
Movement in the number of units was as follows:
The PatientCare and
PassionatePeople Trust
The PhysicianPartnerships
Trust
The Mother and
Child Trust The Healthy
Lifestyle Trust Total
Balance at 1 October 2016 13 242 630 14 030 879 4 000 000 600 000 31 873 509 Exercised (2 925 876) (991 679) (1 200 000) (43 056) (5 160 611)Forfeited (376 409) (10 000) (2 800 000) – (3 186 409)
Balance at 30 September 2017 9 940 345 13 029 200 – 556 944 23 526 489
The fair value of the units issued was calculated using the Trinomial model. The fair value of units expensed during 2017 was R2 million (2016: R3 million). The expected unrecognised share-based payment expense relating to non-vested share options amounts to R1 million (2016: R3 million).
The following assumptions were used to value the units issued:
Assumptions %
Volatility 30.0 Forfeiture rate 15.0 Risk-free interest rate 7.1 – 8.7 Dividend yield 2.0 – 4.0
Notes to the Group annual financial statements continuedfor the year ended 30 September
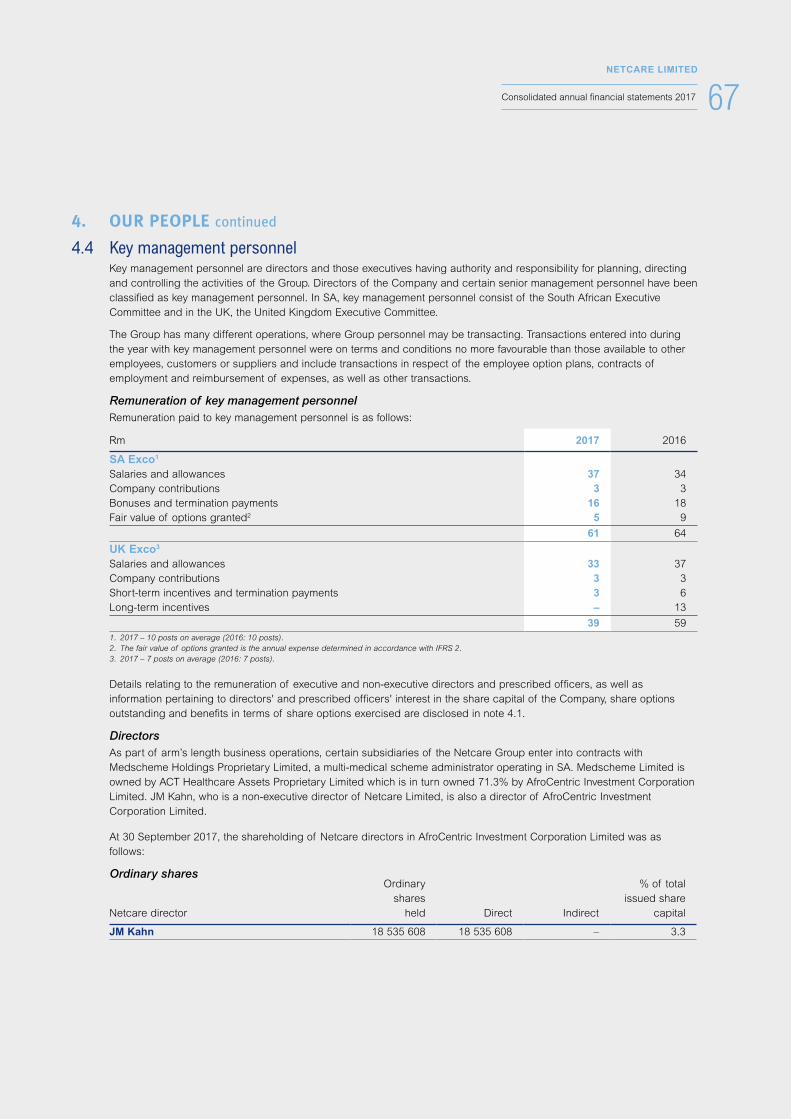
67NETCARE LIMITED
Consolidated annual financial statements 2017
4. OUR PEOPLE continued
4.4 Key management personnel Key management personnel are directors and those executives having authority and responsibility for planning, directing
and controlling the activities of the Group. Directors of the Company and certain senior management personnel have been classified as key management personnel. In SA, key management personnel consist of the South African Executive Committee and in the UK, the United Kingdom Executive Committee.
The Group has many different operations, where Group personnel may be transacting. Transactions entered into during the year with key management personnel were on terms and conditions no more favourable than those available to other employees, customers or suppliers and include transactions in respect of the employee option plans, contracts of employment and reimbursement of expenses, as well as other transactions.
Remuneration of key management personnel Remuneration paid to key management personnel is as follows:
Rm 2017 2016
SA Exco1
Salaries and allowances 37 34 Company contributions 3 3 Bonuses and termination payments 16 18 Fair value of options granted2 5 9
61 64
UK Exco3
Salaries and allowances 33 37 Company contributions 3 3 Short-term incentives and termination payments 3 6 Long-term incentives – 13
39 59 1. 2017 – 10 posts on average (2016: 10 posts).2. The fair value of options granted is the annual expense determined in accordance with IFRS 2.3. 2017 – 7 posts on average (2016: 7 posts).
Details relating to the remuneration of executive and non-executive directors and prescribed officers, as well as information pertaining to directors' and prescribed officers' interest in the share capital of the Company, share options outstanding and benefits in terms of share options exercised are disclosed in note 4.1.
DirectorsAs part of arm’s length business operations, certain subsidiaries of the Netcare Group enter into contracts with Medscheme Holdings Proprietary Limited, a multi-medical scheme administrator operating in SA. Medscheme Limited is owned by ACT Healthcare Assets Proprietary Limited which is in turn owned 71.3% by AfroCentric Investment Corporation Limited. JM Kahn, who is a non-executive director of Netcare Limited, is also a director of AfroCentric Investment Corporation Limited.
At 30 September 2017, the shareholding of Netcare directors in AfroCentric Investment Corporation Limited was as follows:
Ordinary shares
Netcare director
Ordinaryshares
held Direct Indirect
% of totalissued share
capital
JM Kahn 18 535 608 18 535 608 – 3.3
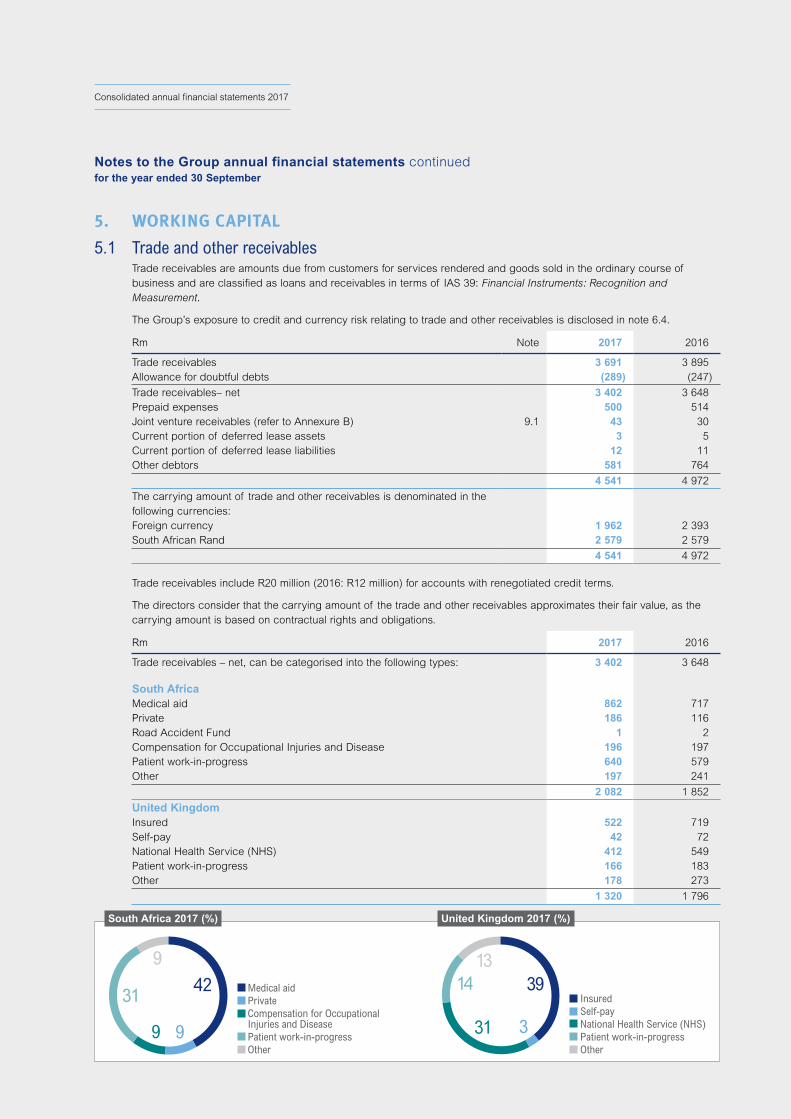
68NETCARE LIMITED
Consolidated annual financial statements 2017
5. WORKING CAPITAL
5.1 Trade and other receivables Trade receivables are amounts due from customers for services rendered and goods sold in the ordinary course of
business and are classified as loans and receivables in terms of IAS 39: Financial Instruments: Recognition and Measurement.
The Group’s exposure to credit and currency risk relating to trade and other receivables is disclosed in note 6.4.
Rm Note 2017 2016
Trade receivables 3 691 3 895 Allowance for doubtful debts (289) (247)
Trade receivables– net 3 402 3 648 Prepaid expenses 500 514 Joint venture receivables (refer to Annexure B) 9.1 43 30 Current portion of deferred lease assets 3 5 Current portion of deferred lease liabilities 12 11 Other debtors 581 764
4 541 4 972
The carrying amount of trade and other receivables is denominated in the following currencies:Foreign currency 1 962 2 393 South African Rand 2 579 2 579
4 541 4 972
Trade receivables include R20 million (2016: R12 million) for accounts with renegotiated credit terms.
The directors consider that the carrying amount of the trade and other receivables approximates their fair value, as the carrying amount is based on contractual rights and obligations.
Rm 2017 2016
Trade receivables – net, can be categorised into the following types: 3 402 3 648
South AfricaMedical aid 862 717 Private 186 116 Road Accident Fund 1 2 Compensation for Occupational Injuries and Disease 196 197 Patient work-in-progress 640 579 Other 197 241
2 082 1 852
United KingdomInsured 522 719 Self-pay 42 72 National Health Service (NHS) 412 549 Patient work-in-progress 166 183 Other 178 273
1 320 1 796
9
42
9
Insured Self-pay National Health Service (NHS) Patient work-in-progress Other
Medical aid Private Compensation for Occupational Injuries and Disease Patient work-in-progress Other
31
9
3
39
31
1413
South Africa 2017 (%) United Kingdom 2017 (%)
Notes to the Group annual financial statements continuedfor the year ended 30 September
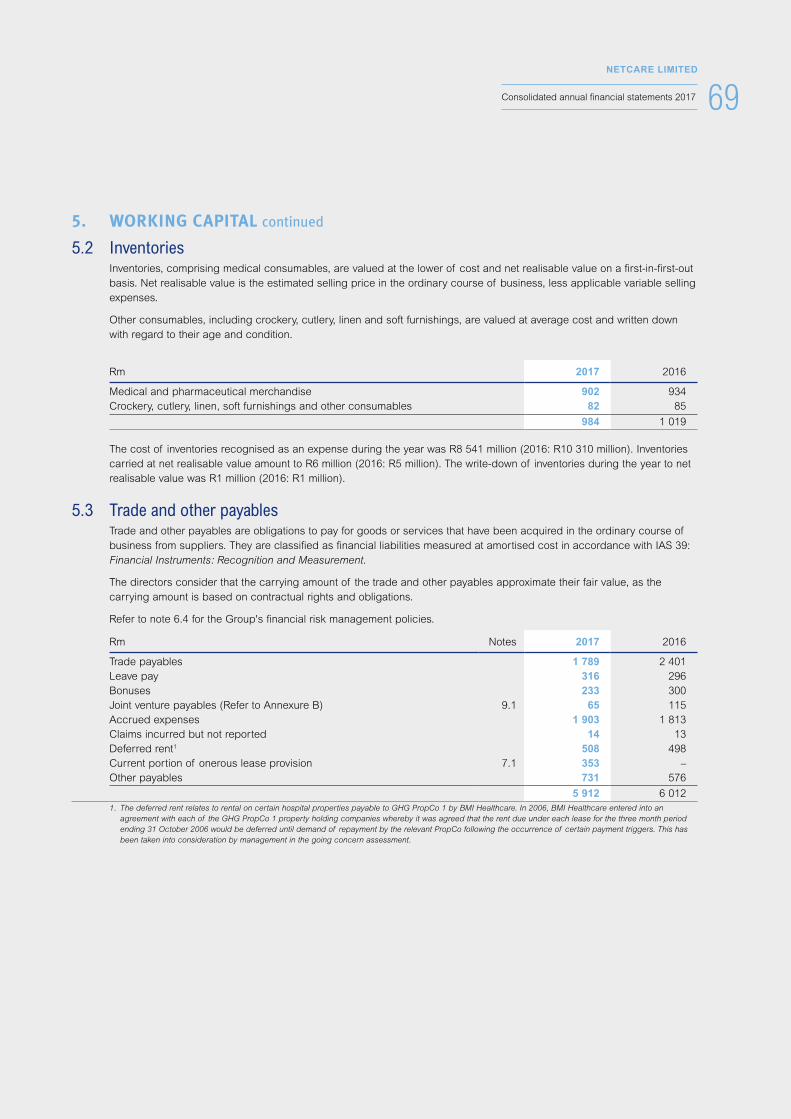
69NETCARE LIMITED
Consolidated annual financial statements 2017
5. WORKING CAPITAL continued
5.2 Inventories Inventories, comprising medical consumables, are valued at the lower of cost and net realisable value on a first-in-first-out
basis. Net realisable value is the estimated selling price in the ordinary course of business, less applicable variable selling expenses.
Other consumables, including crockery, cutlery, linen and soft furnishings, are valued at average cost and written down with regard to their age and condition.
Rm 2017 2016
Medical and pharmaceutical merchandise 902 934 Crockery, cutlery, linen, soft furnishings and other consumables 82 85
984 1 019
The cost of inventories recognised as an expense during the year was R8 541 million (2016: R10 310 million). Inventories carried at net realisable value amount to R6 million (2016: R5 million). The write-down of inventories during the year to net realisable value was R1 million (2016: R1 million).
5.3 Trade and other payables Trade and other payables are obligations to pay for goods or services that have been acquired in the ordinary course of
business from suppliers. They are classified as financial liabilities measured at amortised cost in accordance with IAS 39: Financial Instruments: Recognition and Measurement.
The directors consider that the carrying amount of the trade and other payables approximate their fair value, as the carrying amount is based on contractual rights and obligations.
Refer to note 6.4 for the Group's financial risk management policies.
Rm Notes 2017 2016
Trade payables 1 789 2 401 Leave pay 316 296 Bonuses 233 300 Joint venture payables (Refer to Annexure B) 9.1 65 115 Accrued expenses 1 903 1 813 Claims incurred but not reported 14 13 Deferred rent1 508 498 Current portion of onerous lease provision 7.1 353 –Other payables 731 576
5 912 6 012 1. The deferred rent relates to rental on certain hospital properties payable to GHG PropCo 1 by BMI Healthcare. In 2006, BMI Healthcare entered into an
agreement with each of the GHG PropCo 1 property holding companies whereby it was agreed that the rent due under each lease for the three month period ending 31 October 2006 would be deferred until demand of repayment by the relevant PropCo following the occurrence of certain payment triggers. This has been taken into consideration by management in the going concern assessment.
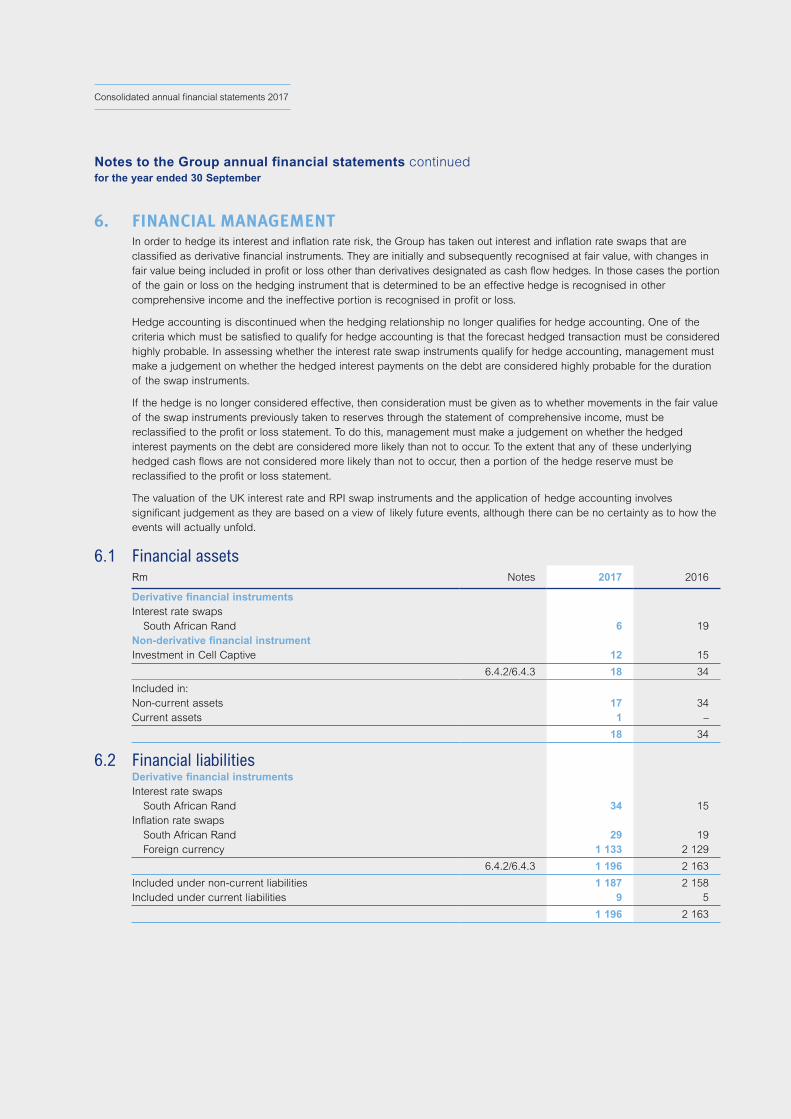
70NETCARE LIMITED
Consolidated annual financial statements 2017
6. FINANCIAL MANAGEMENT In order to hedge its interest and inflation rate risk, the Group has taken out interest and inflation rate swaps that are
classified as derivative financial instruments. They are initially and subsequently recognised at fair value, with changes in fair value being included in profit or loss other than derivatives designated as cash flow hedges. In those cases the portion of the gain or loss on the hedging instrument that is determined to be an effective hedge is recognised in other comprehensive income and the ineffective portion is recognised in profit or loss.
Hedge accounting is discontinued when the hedging relationship no longer qualifies for hedge accounting. One of the criteria which must be satisfied to qualify for hedge accounting is that the forecast hedged transaction must be considered highly probable. In assessing whether the interest rate swap instruments qualify for hedge accounting, management must make a judgement on whether the hedged interest payments on the debt are considered highly probable for the duration of the swap instruments.
If the hedge is no longer considered effective, then consideration must be given as to whether movements in the fair value of the swap instruments previously taken to reserves through the statement of comprehensive income, must be reclassified to the profit or loss statement. To do this, management must make a judgement on whether the hedged interest payments on the debt are considered more likely than not to occur. To the extent that any of these underlying hedged cash flows are not considered more likely than not to occur, then a portion of the hedge reserve must be reclassified to the profit or loss statement.
The valuation of the UK interest rate and RPI swap instruments and the application of hedge accounting involves significant judgement as they are based on a view of likely future events, although there can be no certainty as to how the events will actually unfold.
6.1 Financial assetsRm Notes 2017 2016
Derivative financial instrumentsInterest rate swaps
South African Rand 6 19 Non-derivative financial instrumentInvestment in Cell Captive 12 15
6.4.2/6.4.3 18 34
Included in: Non-current assets 17 34 Current assets 1 –
18 34
6.2 Financial liabilitiesDerivative financial instrumentsInterest rate swaps
South African Rand 34 15 Inflation rate swaps
South African Rand 29 19 Foreign currency 1 133 2 129
6.4.2/6.4.3 1 196 2 163
Included under non-current liabilities 1 187 2 158 Included under current liabilities 9 5
1 196 2 163
Notes to the Group annual financial statements continuedfor the year ended 30 September
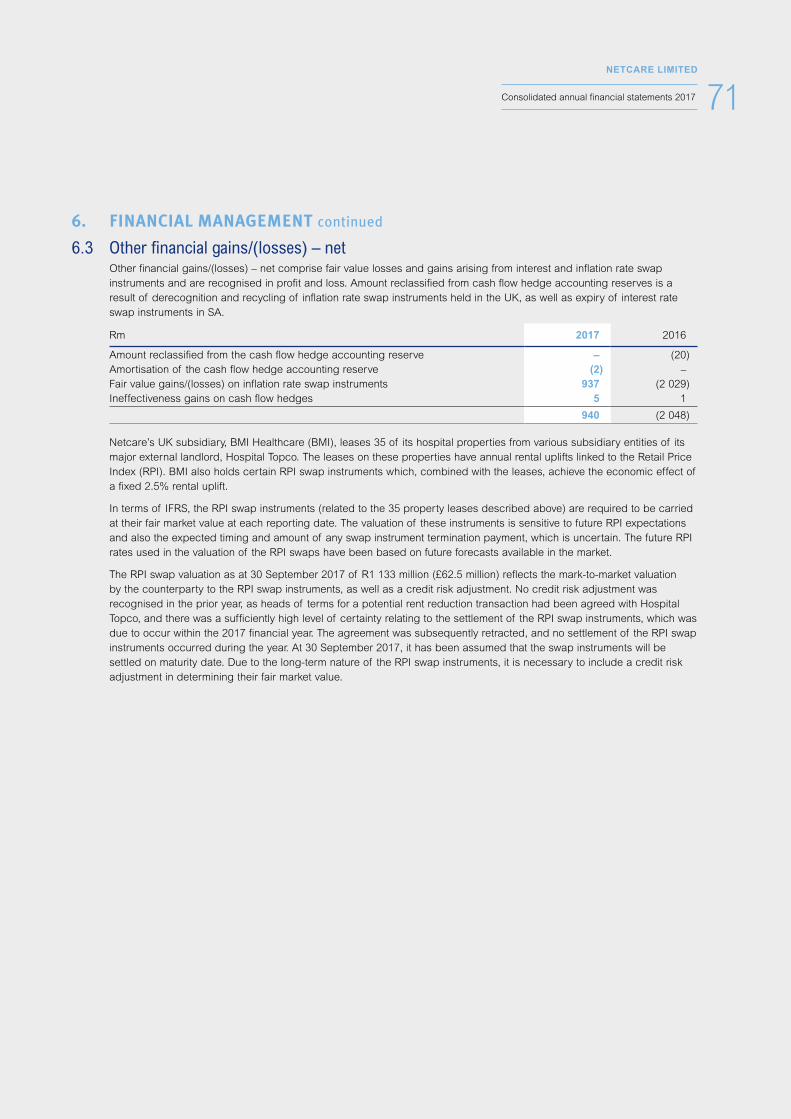
71NETCARE LIMITED
Consolidated annual financial statements 2017
6. FINANCIAL MANAGEMENT continued
6.3 Other financial gains/(losses) – net Other financial gains/(losses) – net comprise fair value losses and gains arising from interest and inflation rate swap
instruments and are recognised in profit and loss. Amount reclassified from cash flow hedge accounting reserves is a result of derecognition and recycling of inflation rate swap instruments held in the UK, as well as expiry of interest rate swap instruments in SA.
Rm 2017 2016
Amount reclassified from the cash flow hedge accounting reserve – (20)Amortisation of the cash flow hedge accounting reserve (2) – Fair value gains/(losses) on inflation rate swap instruments 937 (2 029)Ineffectiveness gains on cash flow hedges 5 1
940 (2 048)
Netcare’s UK subsidiary, BMI Healthcare (BMI), leases 35 of its hospital properties from various subsidiary entities of its major external landlord, Hospital Topco. The leases on these properties have annual rental uplifts linked to the Retail Price Index (RPI). BMI also holds certain RPI swap instruments which, combined with the leases, achieve the economic effect of a fixed 2.5% rental uplift.
In terms of IFRS, the RPI swap instruments (related to the 35 property leases described above) are required to be carried at their fair market value at each reporting date. The valuation of these instruments is sensitive to future RPI expectations and also the expected timing and amount of any swap instrument termination payment, which is uncertain. The future RPI rates used in the valuation of the RPI swaps have been based on future forecasts available in the market.
The RPI swap valuation as at 30 September 2017 of R1 133 million (£62.5 million) reflects the mark-to-market valuation by the counterparty to the RPI swap instruments, as well as a credit risk adjustment. No credit risk adjustment was recognised in the prior year, as heads of terms for a potential rent reduction transaction had been agreed with Hospital Topco, and there was a sufficiently high level of certainty relating to the settlement of the RPI swap instruments, which was due to occur within the 2017 financial year. The agreement was subsequently retracted, and no settlement of the RPI swap instruments occurred during the year. At 30 September 2017, it has been assumed that the swap instruments will be settled on maturity date. Due to the long-term nature of the RPI swap instruments, it is necessary to include a credit risk adjustment in determining their fair market value.
72NETCARE LIMITED
Consolidated annual financial statements 2017
6. FINANCIAL MANAGEMENT continued
6.4 Financial instruments and risk management6.4.1 Fair value measurement There is no material difference between the fair values of financial instruments and the amounts recognised in the
statement of financial position.
The valuation of derivative financial instruments is based on the market situation at the reporting date. The value of the derivative instruments fluctuates on a daily basis and the actual amounts realised may differ materially from their value at the reporting date. The fair value of the inflation and interest rate swap instruments is calculated based on a discounted cash flow model using a number of key assumptions.
The following methods are used by the Group to determine the fair value of financial instruments:
Financial assets Cell captive Cell captive is recognised at fair value through profit and loss.
Derivative financial assets The fair values of the interest rate and inflation rate swap instruments are calculated based on a discounted cash flow
model using a number of key assumptions. There are no enforceable master netting off arrangements existing within the Group to allow for set-off.
Financial liabilities Derivative financial liabilities The fair values of the interest rate and inflation rate swap instruments is calculated based on a discounted cash flow
model using a number of key assumptions. There are no enforceable master netting off arrangements existing within the Group to allow for set-off.
Other financial liabilities Other financial liabilities are recognised at amortised cost. The carrying amounts included in the statement of financial
position approximate the fair values.
Notes to the Group annual financial statements continuedfor the year ended 30 September
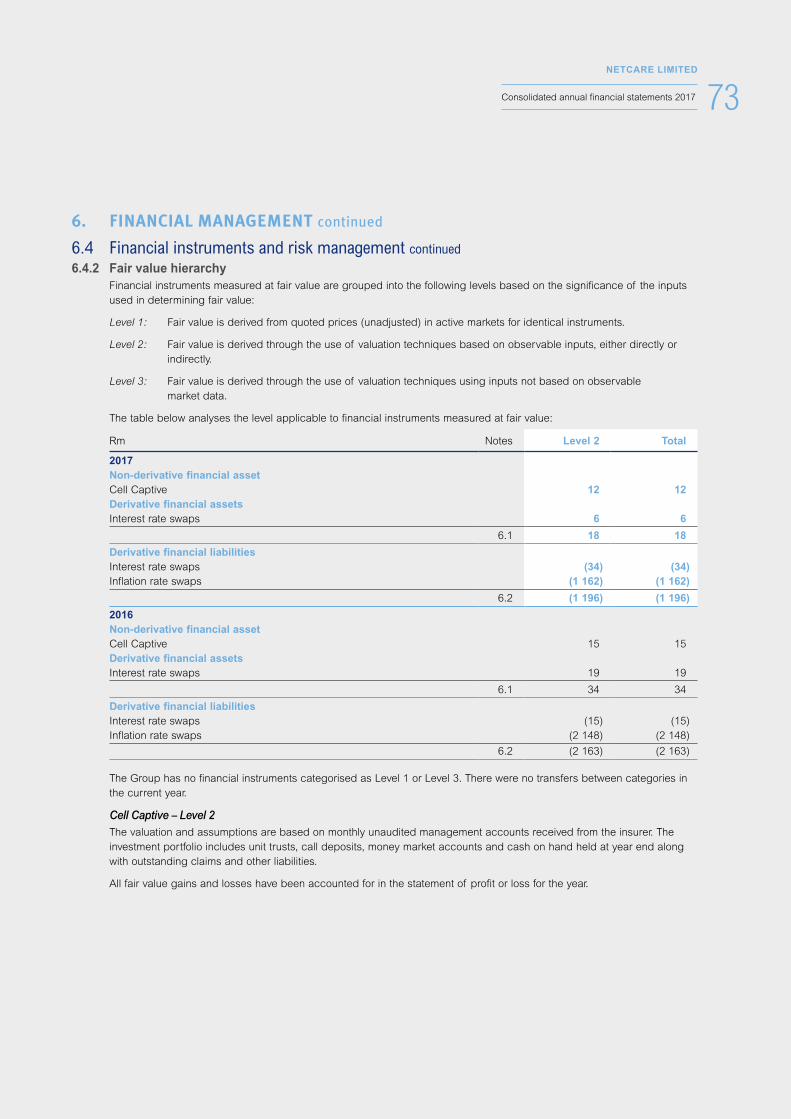
73NETCARE LIMITED
Consolidated annual financial statements 2017
6. FINANCIAL MANAGEMENT continued
6.4 Financial instruments and risk management continued6.4.2 Fair value hierarchy Financial instruments measured at fair value are grouped into the following levels based on the significance of the inputs
used in determining fair value:
Level 1: Fair value is derived from quoted prices (unadjusted) in active markets for identical instruments.
Level 2: Fair value is derived through the use of valuation techniques based on observable inputs, either directly or indirectly.
Level 3: Fair value is derived through the use of valuation techniques using inputs not based on observable market data.
The table below analyses the level applicable to financial instruments measured at fair value:
Rm Notes Level 2 Total
2017Non-derivative financial assetCell Captive 12 12 Derivative financial assetsInterest rate swaps 6 6
6.1 18 18
Derivative financial liabilities Interest rate swaps (34) (34)Inflation rate swaps (1 162) (1 162)
6.2 (1 196) (1 196)
2016Non-derivative financial assetCell Captive 15 15 Derivative financial assetsInterest rate swaps 19 19
6.1 34 34
Derivative financial liabilities Interest rate swaps (15) (15)Inflation rate swaps (2 148) (2 148)
6.2 (2 163) (2 163)
The Group has no financial instruments categorised as Level 1 or Level 3. There were no transfers between categories in the current year.
Cell Captive – Level 2 The valuation and assumptions are based on monthly unaudited management accounts received from the insurer. The
investment portfolio includes unit trusts, call deposits, money market accounts and cash on hand held at year end along with outstanding claims and other liabilities.
All fair value gains and losses have been accounted for in the statement of profit or loss for the year.

74NETCARE LIMITED
Consolidated annual financial statements 2017
6. FINANCIAL MANAGEMENT continued
6.4 Financial instruments and risk management continued6.4.2 Fair value hierarchy continued Derivative financial assets and derivative financial liabilities – Level 2 The analyses of the levels applicable to financial instruments measured at fair value are presented and performed by
qualified independent experts. The effectiveness test and valuations were performed as at 30 September 2017.
Ratio Offset and Regression Analysis methods were used and modelled the hedged items as interest rate or inflation-linked swap instruments, with the notional terms based on the terms of the underlying hedged item provided.
The valuation inputs and assumptions South Africa
Interest rate swaps > Zero coupon perfect fit swap curve as at 30 September 2017 to determine the relevant floating interest rates.
> Standard interest rate swap instrument valuation methodology was used.
The fair value results exclude the estimated impact of non-performance risk due to counterparty risk (Credit Valuation Adjustment CVA) and our own risk (Debit Valuation Adjustment DVA).
The probability of default was estimated for debt instruments issued by relevant parties, and the potential exposure of default was estimated by applying a swap valuation model.
Inflation rate swaps > Forecast and historical Consumer Price Index (CPI) metrics were provided by independent sources.
> Zero coupon perfect fit swap instruments curve as at 30 September 2017 was used to discount the net cash flows.
> Standard CPI-linked rate swap instrument valuation methodology was used, incorporating the specific terms in the swap.
The fair value results exclude the estimated impact of non-performance risk due to counterparty risk (Credit Valuation Adjustment CVA) and our own risk (Debit Valuation Adjustment DVA).
Foreign Inflation rate swaps
> Discounting future fixed and floating cashflows, applying relevant risk free rates until the valuation date.
> The variability of the swap instruments forecast was generated using Monte Carlo simulation within the prime series analysis which suited the Auto Regressive Moving Average model. The approach is consistent with Cliff Speed: Inflation Modelling.
The fair value results exclude the estimated impact of non-performance risk due to counterparty risk (Credit Valuation Adjustment CVA) but include the estimated impact of our own risk (Debit Valuation Adjustment DVA).
All gains and losses for the ineffective portion for the period have been accounted for in profit and loss, and in other comprehensive income for the effective portion.
Notes to the Group annual financial statements continuedfor the year ended 30 September

75NETCARE LIMITED
Consolidated annual financial statements 2017
6. FINANCIAL MANAGEMENT continued
6.4 Financial instruments and risk management continued6.4.3 Financial instruments by category The carrying amounts recognised in the statement of financial position relate to the following categories of assets and
liabilities:
Rm NotesLoans and
receivablesAmortised
cost
Fair value through profit or
loss
Derivatives designated as hedging
instruments Total
2017Financial assetsAssociate loans and receivables 9.2 450 450 Loans and receivables 9.3 1 884 – – – 1 884 Financial assets 6.1 – – 12 6 18 Trade and other receivables1 3 908 – – – 3 908 Cash and cash equivalents 3.2 2 531 – – – 2 531
Total 8 773 – 12 6 8 791
Financial liabilitiesAssociate loans and payables 9.2 – 1 – – 1 Long-term debt 3.1.1 – 7 232 – – 7 232 Financial liabilities 6.2 – – 1 133 63 1 196 Trade and other payables2 – 5 323 – – 5 323 Short-term debt 3.1.2 – 1 678 – – 1 678 Bank overdrafts 3.2 – 6 – – 6
Total – 14 240 1 133 63 15 436
Financial assets and financial liabilities are classified as Level 2 or Level 3 in accordance with the contractual rights and obligations assigned to the balances. The fair values of these financial assets and financial liabilities are set out below:
Rm Notes Level 2 Level 3 Total
2017Financial assetsAssociate loans and receivables 9.2 – 450 450 Loans and receivables 9.3 – 1 884 1 884 Trade and other receivables1 – 3 908 3 908 Cash and cash equivalents 3.2 2 531 – 2 531
Total 2 531 6 242 8 773
Financial liabilitiesAssociate loans and payables 9.2 – 1 1 Long-term debt 3.1.1 – 7 232 7 232 Trade and other payables2 – 5 323 5 323 Short-term debt 3.1.2 – 1 678 1 678 Bank overdrafts 3.2 6 – 6
Total 6 14 234 14 240 1. Prepaid expense and Value Added Tax are not defined as financial instruments and have been excluded from trade and other receivables.2. Value Added Tax is not defined as a financial instrument and has been excluded from trade and other payables.
The Group has no Level 1 financial assets and financial liabilities.
The fair value of the financial assets and financial liabilities included in Level 2 and Level 3 categories have been determined in accordance with the contractual rights and obligations assigned to the balance.
There has been no transfer between levels during the financial year 30 September 2017 (2016: No transfer occurred between categories).

76NETCARE LIMITED
Consolidated annual financial statements 2017
6. FINANCIAL MANAGEMENT continued
6.4 Financial instruments and risk management continued
6.4.3 Financial instruments by category continued
Rm NotesLoans and
receivablesAmortised
cost
Fair value through profit or
loss
Derivatives designated as hedging instruments Total
2016Financial assetsAssociate loans and receivables 9.2 380 – – – 380 Loans and receivables 9.3 1 710 – – – 1 710 Financial assets 6.1 – – 15 19 34 Trade and other receivables1 4 323 – – – 4 323 Cash and cash equivalents 3.2 1 980 – – – 1 980
Total 8 393 – 15 19 8 427
Financial liabilitiesAssociate loans and payables 9.2 – 15 – – 15 Long-term debt 3.1.1 – 6 132 – – 6 132 Financial liabilities 6.2 – – 2 129 34 2 163 Trade and other payables2 – 5 810 – – 5 810 Short-term debt 3.1.2 – 1 390 – – 1 390 Bank overdrafts 3.2 – 1 – – 1
Total – 13 348 2 129 34 15 511
Financial assets and financial liabilities are classified as Level 2 or Level 3 in accordance with the contractual rights and obligations assigned to the balances. The fair values of these financial assets and financial liabilities are set out below:
Rm Notes Level 2 Level 3 Total
2016Financial assetsAssociate loans and receivables 9.2 – 380 380 Loans and receivables 9.3 – 1 710 1 710 Trade and other receivables1 – 4 323 4 323 Cash and cash equivalents 3.2 1 980 – 1 980
Total 1 980 6 413 8 393
Financial liabilitiesAssociate loans and payables 9.2 – 15 15 Long-term debt 3.1.1 – 6 132 6 132 Trade and other payables2 – 5 810 5 810 Short-term debt 3.1.2 – 1 390 1 390 Bank overdrafts 3.2 1 – 1
Total 1 13 347 13 348
1. Prepaid expense and Value Added Tax are not defined as financial instruments and have been excluded from trade and other receivables.2. Value Added Tax is not defined as a financial instrument and has been excluded from trade and other payables.
Notes to the Group annual financial statements continuedfor the year ended 30 September
77NETCARE LIMITED
Consolidated annual financial statements 2017
6. FINANCIAL MANAGEMENT continued
6.4 Financial instruments and risk management continued
6.4.4 Financial risk management The Group is exposed to a number of financial risks arising from the use of financial instruments in the ordinary course of
business. These risks are monitored continuously and where appropriate derivative instruments are used by the Group for hedging purposes. The Group does not speculate in the trading of derivative instruments.
The Group has a central treasury function that manages the funding and financial risks relating to the Group’s operations. The treasury function is also responsible for adding value by reducing costs without unduly increasing risk and providing specialist financing advice to the business. Key functions are managed from the head office in SA and the UK, but due authority is obtained from central treasury. The treasury function is a subsection of the Finance and Investment Committee which meets at regular intervals to discuss treasury risks.
Risks to which the Group is exposed can be classified into the following major categories:
6.4.4.1 Interest rate risk Borrowings issued at floating rates expose the Group to cash flow interest rate risk, while fixed rate borrowings expose the
Group to fair value interest rate risk.
Cash flow interest rate risk arises from movements in market rates relative to the agreed lending rates on contractual debt instruments. The Group enters into derivative interest rate swap instruments in order to mitigate risk and applies hedge accounting where the effectiveness criteria are met.
Local interest rate swap instruments have been entered into on a funds pool approach as the Group seeks to fix the interest on 50% of local debt at any given time.
Interest rate sensitivity If interest rates had been 0.5% higher/lower and all other variables were held constant, the Group’s profit or loss would
decrease/increase by R25 million (2016: R20 million). This is attributable to the Group’s exposure to interest rates on its variable rate borrowings which have not been fixed through the use of fixed-for-floating interest rate swap instruments.
This analysis was prepared on the assumption that the amount outstanding at the end of the year was outstanding for the entire year.
Interest and inflation rate derivatives Under interest rate swap instrument contracts, the Group agrees to exchange the differences between fixed and floating
interest amounts calculated on agreed notional principal amounts. Such contracts enable the Group to mitigate the risk of changing interest rates on the fair value of issued fixed rate debt held and the cash flow exposures on the issued variable rate debt held. The fair value of interest rate swap instruments at the reporting date is determined by regression analysis and by dynamic hedging strategy, with the change in the hedged item being based on the hypothetical derivative approach. As at 30 September 2017, the Group had 10 (2016: 10) fixed-for-floating interest rate swap instrument contracts and 2 (2016: 2) inflation rate swap instrument contracts.
The inflation rate swap instruments hedge the inflationary increases in certain lease contracts. The fair value of the inflation rate swap instruments is determined at each reporting date.

78NETCARE LIMITED
Consolidated annual financial statements 2017
6. FINANCIAL MANAGEMENT continued
6.4 Financial instruments and risk management continued
6.4.4 Financial risk management continued6.4.4.1 Interest rate risk continued
Rm Notional
amount Rate
(%) Maturity
date Fair valuegain/(loss)
2017Interest rate swapsSouth Africa 3 550 7.6 2018 – 2022 1
1
Inflation rate swapsSouth Africa 3 0.0 2017 1 BMI Healthcare 2 101 2.5 20311 937
938
2016Interest rate swapsSouth Africa 3 150 7.4 2018 – 2021 –
–
Inflation rate swapsSouth Africa 3 0.0 2017 2 BMI Healthcare 2 059 2.5 20311 (2 029)
(2 027)1. The valuation of these instruments is sensitive to future RPI expectations. The future RPI rates used in the valuation of the RPI swap instruments have been
based on future forecasts available in the market.
The fair value gain or loss recognised in the statement of profit or loss is reflected above.
In addition to the above, losses of R43 million (2016: R15 million) resulting from the fair value movement in the interest rate swap instruments designated as cash flow hedges, as well as amortisation of a portion of the cash flow hedge reserve in the inflation rate swap instruments, were recognised in other comprehensive income and included in the cash flow hedge accounting reserve. The Group’s ability to apply hedge accounting is determined on a year-by-year basis and is subject to developments in the financial markets.
The impact on the fair value of derivative financial liabilities resulting from a 1% change in the interest or inflation rate is presented below:
Derivative financial liabilities
Movement in theinterest /inflation
rate(%)
Increase/ (decrease)
equityRm
2017Interest rate swapsSouth Africa Increase of 1% 71
Decrease of 1% (73)
Inflation rate swapsSouth Africa Increase of 1% 7
Decrease of 1% (6)
United Kingdom Increase of 0.25% 403 Decrease of 0.25% (404)
2016Interest rate swapsSouth Africa Increase of 1% 67
Decrease of 1% (70)
Inflation rate swapsSouth Africa Increase of 1% 9
Decrease of 1% (10)
United Kingdom Increase of 0.25% 905 Decrease of 0.25% (884)
Notes to the Group annual financial statements continuedfor the year ended 30 September

79NETCARE LIMITED
Consolidated annual financial statements 2017
6. FINANCIAL MANAGEMENT continued
6.4 Financial instruments and risk management continued
6.4.4 Financial risk management continued6.4.4.2 Foreign exchange risk Exchange rate risk arises from adverse movements in the exchange rate with reference to major currencies.
The SA operations have limited trading with foreign markets, and are not particularly susceptible to either an appreciation or depreciation of the Rand. SA based capital expenditure is rarely, if ever, denominated in foreign currency.
The Group is exposed to translational foreign exchange risk. The Group has investments in foreign subsidiaries whose net assets are exposed to foreign currency translation risk.
The UK debt of BMI Healthcare provides a natural hedge against the assets of that subsidiary.
During the year, a loss of R44 million (2016: gain R90 million) was made on the currency translation arising from the consolidation of BMI Healthcare and was recognised in the statement of other comprehensive income and included in the foreign currency translation reserve in equity.
Foreign exchange sensitivity The impact of a R1 increase/decrease in the Rand/Pound Sterling exchange rate at year-end would result in an increase/
decrease of R261 million in equity (2016: R31 million).
6.4.4.3 Credit risk Credit risk arises from cash and cash equivalents, trade and other receivables and derivative financial instruments as a
result of non-performance or default. The Group’s maximum exposure to credit risk is equal to the carrying amount of these assets. Considerable resources, expertise and controls are in place to ensure efficient and effective management of credit risk. The Group has a comprehensive credit risk policy which is updated on a regular basis. Our credit risk arises predominantly from settlement risk which stems from transactions involving the non-simultaneous exchange of value where the Group honours its obligations to deliver value, and the counterparty does not.
The Group only deposits short-term cash surpluses and enters into derivative contracts with major banks of high quality credit standing. Information as to the creditworthiness of customers is supplied by independent rating agencies where available and, if not available, the Group uses other publicly available information and its own trading records to rate its customers and counterparties.
In SA, trade receivables consist mainly of medical aid funders acting as agents for their customers (patients). These funds are regulated by the Medical Schemes Act and are monitored and controlled by the Registrar of Medical Schemes. The Act stipulates minimum reserves for the funders which mitigates the Group’s credit risk.
In the UK, trade receivables consist mainly of amounts owed by private medical insurers and the National Health Service (NHS). Medical insurance companies are registered insurers, and are subject to liquidity ratios. The NHS is backed by the UK government.
Credit risk for customers who do not have medical insurance is mitigated by taking an appropriate deposit calculated with specific regard to the services being provided.
The Group also experiences concentration risk in that a significant proportion of trade and other receivables relate to a small number of debtors. In SA, the Group is exposed to concentration risk in the Compensation for Occupational Injuries and Diseases Fund. The amount due by the Commissioner as at 30 September 2017 was R196 million (2016: R197 million). The level of risk associated with this funder is low due to its strong financial position and low risk or incidence of repudiation of accounts. In the UK, the Group is exposed to five customers namely Kuwait Health Office, BUPA, Axa, Aviva and the NHS. The risk of non-payment from these debtors is low as a result of the good credit rating of these organisations. Due to the sensitivity and nature of these debtors, the outstanding amounts at year-end are not disclosed.
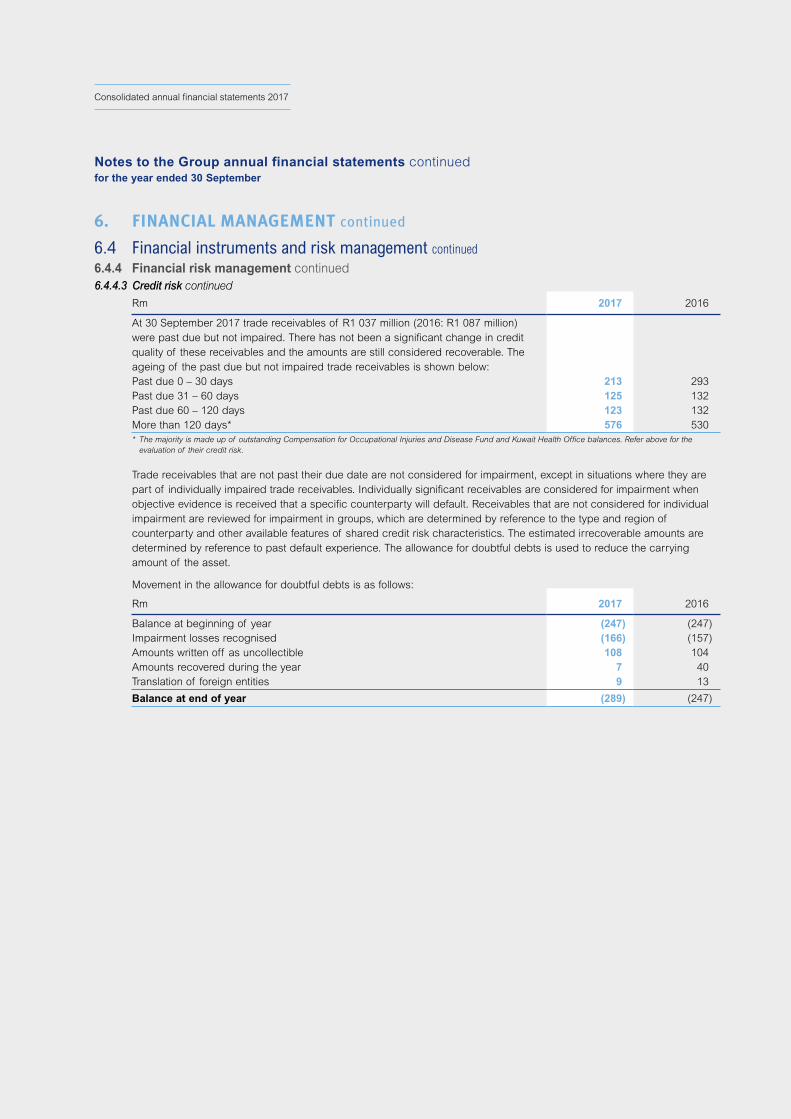
80NETCARE LIMITED
Consolidated annual financial statements 2017
6. FINANCIAL MANAGEMENT continued
6.4 Financial instruments and risk management continued
6.4.4 Financial risk management continued6.4.4.3 Credit risk continued
Rm 2017 2016
At 30 September 2017 trade receivables of R1 037 million (2016: R1 087 million) were past due but not impaired. There has not been a significant change in credit quality of these receivables and the amounts are still considered recoverable. The ageing of the past due but not impaired trade receivables is shown below:Past due 0 – 30 days 213 293 Past due 31 – 60 days 125 132 Past due 60 – 120 days 123 132 More than 120 days* 576 530 * The majority is made up of outstanding Compensation for Occupational Injuries and Disease Fund and Kuwait Health Office balances. Refer above for the
evaluation of their credit risk.
Trade receivables that are not past their due date are not considered for impairment, except in situations where they are part of individually impaired trade receivables. Individually significant receivables are considered for impairment when objective evidence is received that a specific counterparty will default. Receivables that are not considered for individual impairment are reviewed for impairment in groups, which are determined by reference to the type and region of counterparty and other available features of shared credit risk characteristics. The estimated irrecoverable amounts are determined by reference to past default experience. The allowance for doubtful debts is used to reduce the carrying amount of the asset.
Movement in the allowance for doubtful debts is as follows:
Rm 2017 2016
Balance at beginning of year (247) (247)Impairment losses recognised (166) (157)Amounts written off as uncollectible 108 104 Amounts recovered during the year 7 40 Translation of foreign entities 9 13
Balance at end of year (289) (247)
Notes to the Group annual financial statements continuedfor the year ended 30 September
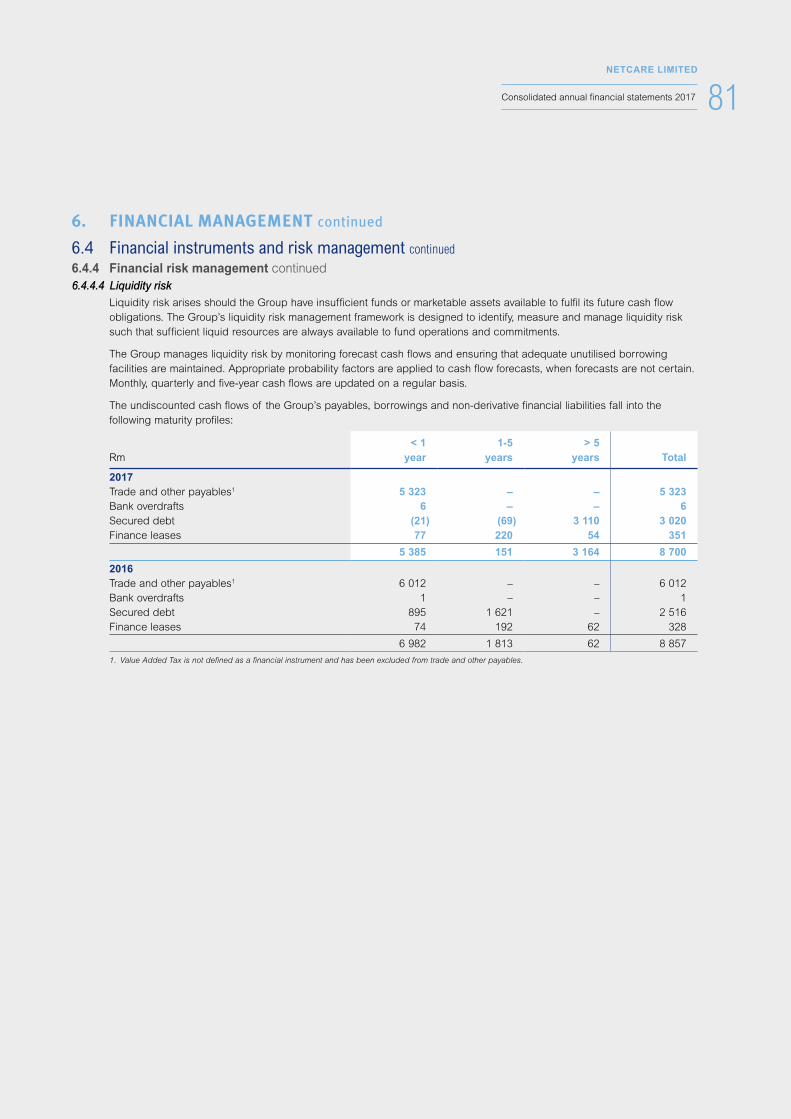
81NETCARE LIMITED
Consolidated annual financial statements 2017
6. FINANCIAL MANAGEMENT continued
6.4 Financial instruments and risk management continued
6.4.4 Financial risk management continued6.4.4.4 Liquidity risk Liquidity risk arises should the Group have insufficient funds or marketable assets available to fulfil its future cash flow
obligations. The Group’s liquidity risk management framework is designed to identify, measure and manage liquidity risk such that sufficient liquid resources are always available to fund operations and commitments.
The Group manages liquidity risk by monitoring forecast cash flows and ensuring that adequate unutilised borrowing facilities are maintained. Appropriate probability factors are applied to cash flow forecasts, when forecasts are not certain. Monthly, quarterly and five-year cash flows are updated on a regular basis.
The undiscounted cash flows of the Group’s payables, borrowings and non-derivative financial liabilities fall into the following maturity profiles:
Rm < 1
year 1-5
years > 5
years Total
2017Trade and other payables1 5 323 – – 5 323 Bank overdrafts 6 – – 6 Secured debt (21) (69) 3 110 3 020 Finance leases 77 220 54 351
5 385 151 3 164 8 700
2016Trade and other payables1 6 012 – – 6 012 Bank overdrafts 1 – – 1 Secured debt 895 1 621 – 2 516 Finance leases 74 192 62 328
6 982 1 813 62 8 857
1. Value Added Tax is not defined as a financial instrument and has been excluded from trade and other payables.

82NETCARE LIMITED
Consolidated annual financial statements 2017
6. FINANCIAL MANAGEMENT continued
6.4 Financial instruments and risk management continued
6.4.4 Financial risk management continued
6.4.4.5 Capital management The Group’s objective when managing capital is to maintain an optimal capital structure to ensure that there is sufficient
capital available to support funding requirements, while optimising the cost of capital to safeguard the Group’s ability to continue as a going concern and to maximise the return to its stakeholders.
The Group manages its capital and adjusts it in view of changes in economic conditions and the needs of the Group. In order to maintain the capital structure, the Group may adjust the amount of dividends paid to shareholders, return capital to shareholders, repurchase shares currently in issue, issue new shares, raise new debt or sell assets to reduce existing debt.
Opportunities in the market are monitored closely to ensure that the most efficient funding solution is implemented.
The net debt to EBITDA ratio for the year is as follows:
Rm 2017 2016
South AfricaDebt 5 490 4 535 Cash and cash equivalents (1 582) (948)
Net debt 3 908 3 587 EBITDA – before profit on sale of old Netcare CBMH land and buildings1 3 975 4 147 Net debt to EBITDA (times) 1.0 0.9
£m
United KingdomDebt 188.5 167.9 Cash and cash equivalents (52.0) (57.9)
Net debt 136.5 110.0 EBITDA – before impairments and onerous lease charge1 18.0 66.4 Net debt to EBITDA (times) 7.6 1.7 1 These transactions are non-recurring and are not considered by management when monitoring our capital. BMI Healthcare considers its available facilities to be sufficient to meet the cash flow needs of the business.
The Group ensures that any share repurchases or payments to shareholders are duly authorised by the Board who are suitably advised and reasonably assured that the assets of the Group exceed its liabilities and the Group is able to pay its debts when they fall due, thereby complying with the solvency and liquidity requirements of the South African Companies Act. The Group is partially restricted by covenants in respect of certain borrowing obligations.
Notes to the Group annual financial statements continuedfor the year ended 30 September
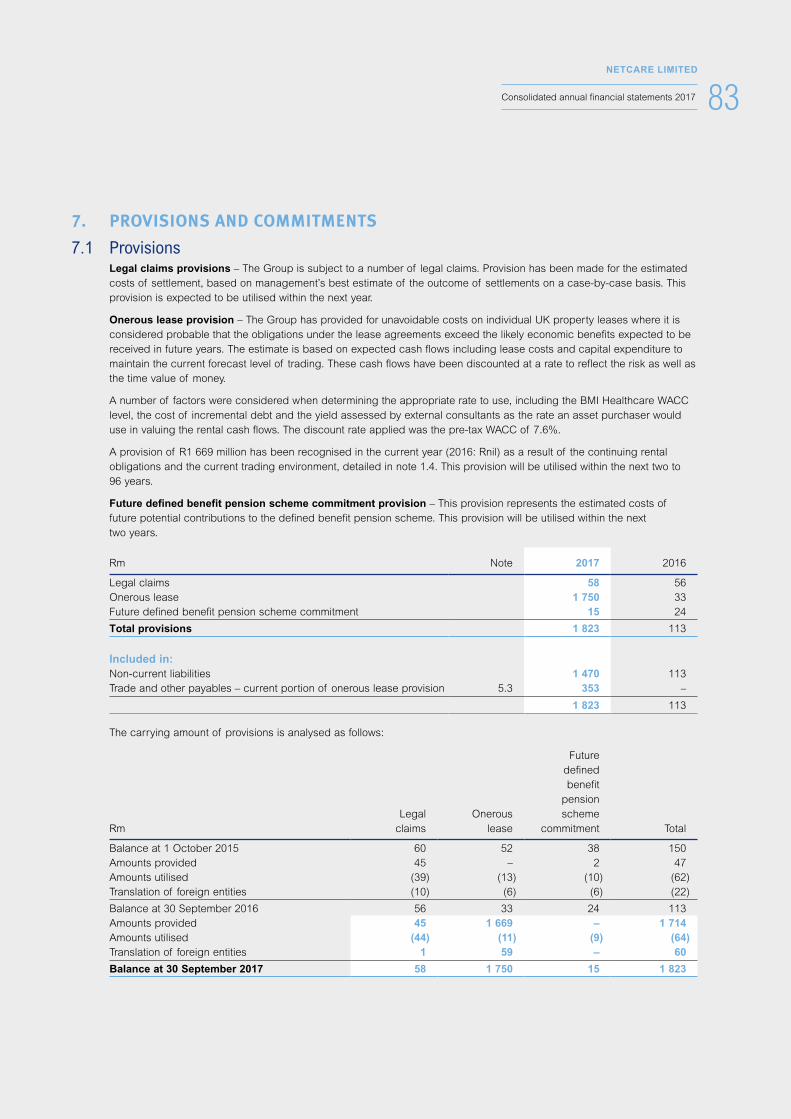
83NETCARE LIMITED
Consolidated annual financial statements 2017
7. PROVISIONS AND COMMITMENTS
7.1 Provisions Legal claims provisions – The Group is subject to a number of legal claims. Provision has been made for the estimated
costs of settlement, based on management’s best estimate of the outcome of settlements on a case-by-case basis. This provision is expected to be utilised within the next year.
Onerous lease provision – The Group has provided for unavoidable costs on individual UK property leases where it is considered probable that the obligations under the lease agreements exceed the likely economic benefits expected to be received in future years. The estimate is based on expected cash flows including lease costs and capital expenditure to maintain the current forecast level of trading. These cash flows have been discounted at a rate to reflect the risk as well as the time value of money.
A number of factors were considered when determining the appropriate rate to use, including the BMI Healthcare WACC level, the cost of incremental debt and the yield assessed by external consultants as the rate an asset purchaser would use in valuing the rental cash flows. The discount rate applied was the pre-tax WACC of 7.6%.
A provision of R1 669 million has been recognised in the current year (2016: Rnil) as a result of the continuing rental obligations and the current trading environment, detailed in note 1.4. This provision will be utilised within the next two to 96 years.
Future defined benefit pension scheme commitment provision – This provision represents the estimated costs of future potential contributions to the defined benefit pension scheme. This provision will be utilised within the next two years.
Rm Note 2017 2016
Legal claims 58 56 Onerous lease 1 750 33 Future defined benefit pension scheme commitment 15 24
Total provisions 1 823 113
Included in: Non-current liabilities 1 470 113 Trade and other payables – current portion of onerous lease provision 5.3 353 –
1 823 113
The carrying amount of provisions is analysed as follows:
RmLegal
claimsOnerous
lease
Future defined benefit
pension scheme
commitment Total
Balance at 1 October 2015 60 52 38 150 Amounts provided 45 – 2 47 Amounts utilised (39) (13) (10) (62)Translation of foreign entities (10) (6) (6) (22)
Balance at 30 September 2016 56 33 24 113 Amounts provided 45 1 669 – 1 714 Amounts utilised (44) (11) (9) (64)Translation of foreign entities 1 59 – 60
Balance at 30 September 2017 58 1 750 15 1 823
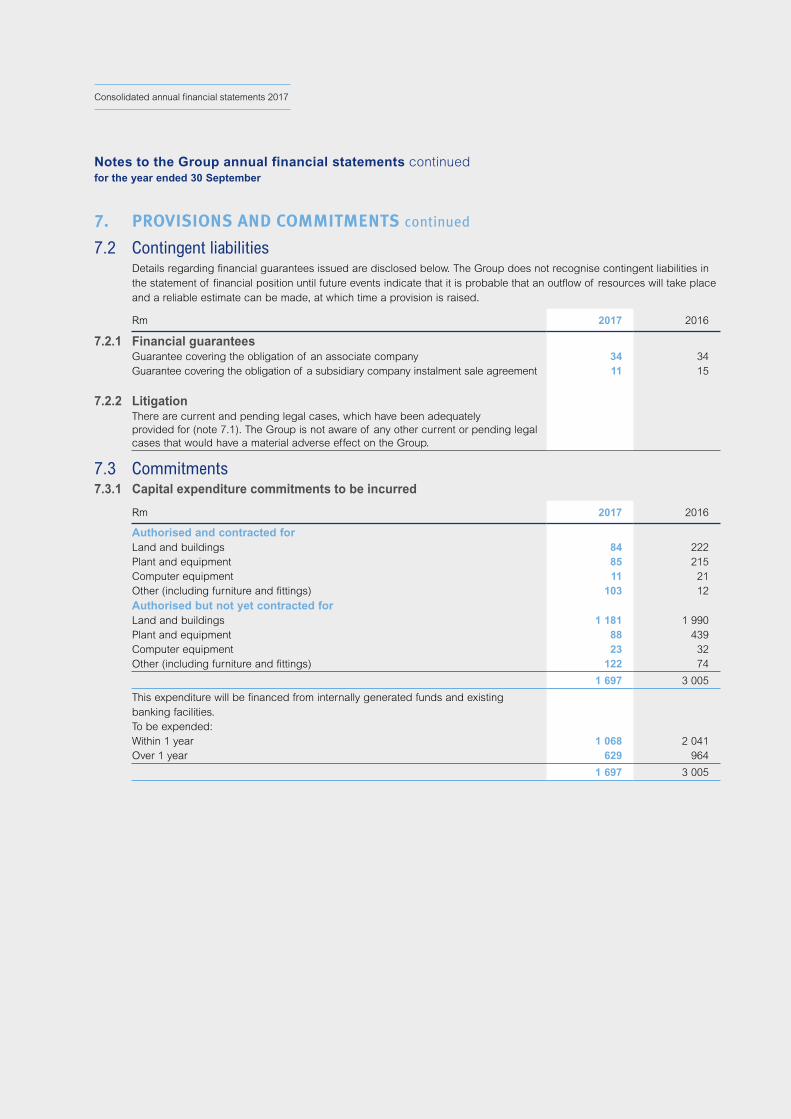
84NETCARE LIMITED
Consolidated annual financial statements 2017
7. PROVISIONS AND COMMITMENTS continued
7.2 Contingent liabilities Details regarding financial guarantees issued are disclosed below. The Group does not recognise contingent liabilities in
the statement of financial position until future events indicate that it is probable that an outflow of resources will take place and a reliable estimate can be made, at which time a provision is raised.
Rm 2017 2016
7.2.1 Financial guaranteesGuarantee covering the obligation of an associate company 34 34 Guarantee covering the obligation of a subsidiary company instalment sale agreement 11 15
7.2.2 LitigationThere are current and pending legal cases, which have been adequately provided for (note 7.1). The Group is not aware of any other current or pending legal cases that would have a material adverse effect on the Group.
7.3 Commitments 7.3.1 Capital expenditure commitments to be incurred
Rm 2017 2016
Authorised and contracted forLand and buildings 84 222 Plant and equipment 85 215 Computer equipment 11 21 Other (including furniture and fittings) 103 12 Authorised but not yet contracted forLand and buildings 1 181 1 990 Plant and equipment 88 439 Computer equipment 23 32 Other (including furniture and fittings) 122 74
1 697 3 005
This expenditure will be financed from internally generated funds and existing banking facilities.To be expended:Within 1 year 1 068 2 041 Over 1 year 629 964
1 697 3 005
Notes to the Group annual financial statements continuedfor the year ended 30 September
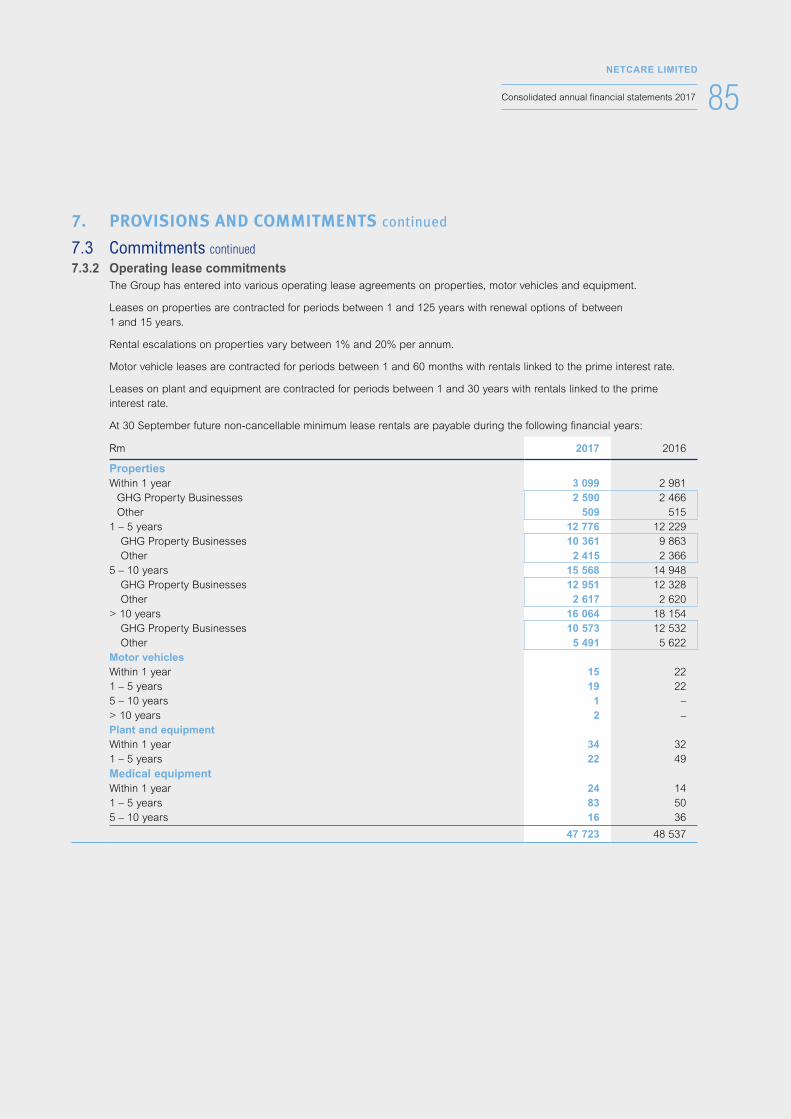
85NETCARE LIMITED
Consolidated annual financial statements 2017
7. PROVISIONS AND COMMITMENTS continued
7.3 Commitments continued
7.3.2 Operating lease commitments The Group has entered into various operating lease agreements on properties, motor vehicles and equipment.
Leases on properties are contracted for periods between 1 and 125 years with renewal options of between 1 and 15 years.
Rental escalations on properties vary between 1% and 20% per annum.
Motor vehicle leases are contracted for periods between 1 and 60 months with rentals linked to the prime interest rate.
Leases on plant and equipment are contracted for periods between 1 and 30 years with rentals linked to the prime interest rate.
At 30 September future non-cancellable minimum lease rentals are payable during the following financial years:
Rm 2017 2016
PropertiesWithin 1 year 3 099 2 981
GHG Property Businesses 2 590 2 466 Other 509 515
1 – 5 years 12 776 12 229 GHG Property Businesses 10 361 9 863 Other 2 415 2 366
5 – 10 years 15 568 14 948 GHG Property Businesses 12 951 12 328 Other 2 617 2 620
> 10 years 16 064 18 154 GHG Property Businesses 10 573 12 532 Other 5 491 5 622
Motor vehiclesWithin 1 year 15 22 1 – 5 years 19 22 5 – 10 years 1 – > 10 years 2 – Plant and equipmentWithin 1 year 34 32 1 – 5 years 22 49 Medical equipmentWithin 1 year 24 14 1 – 5 years 83 50 5 – 10 years 16 36
47 723 48 537
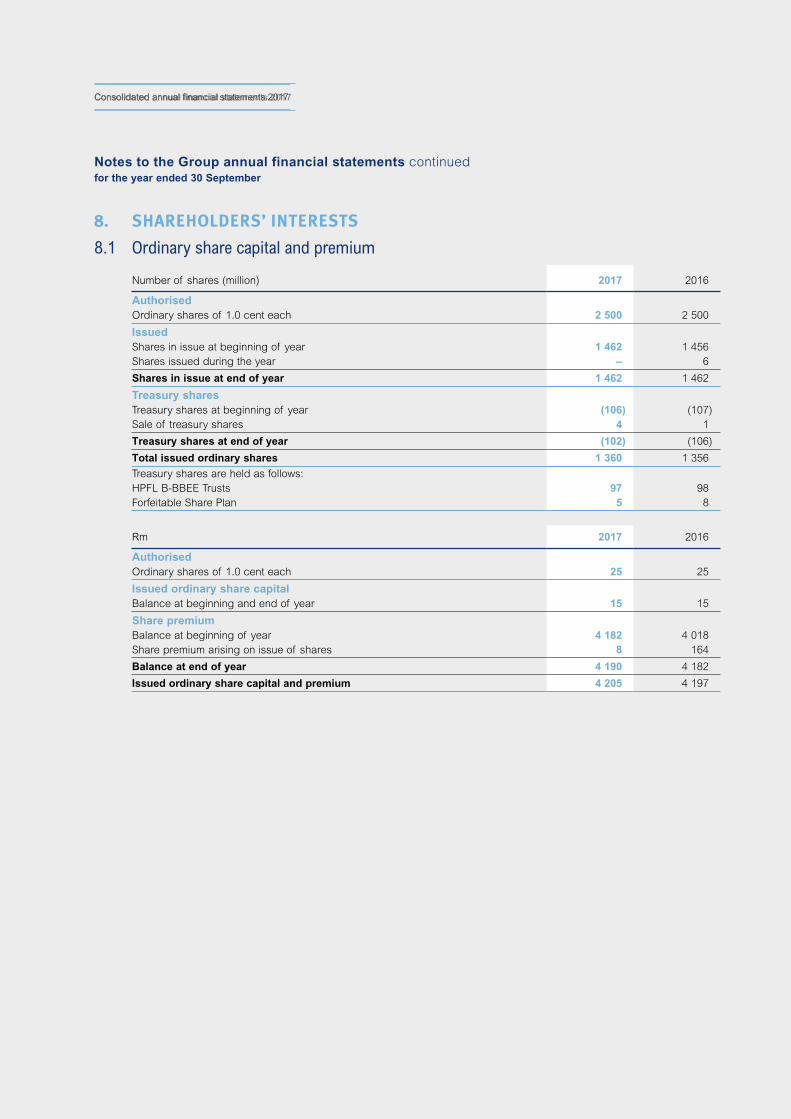
86NETCARE LIMITED
Consolidated annual financial statements 2017Consolidated annual financial statements 2017
8. SHAREHOLDERS’ INTERESTS
8.1 Ordinary share capital and premium
Number of shares (million) 2017 2016
AuthorisedOrdinary shares of 1.0 cent each 2 500 2 500
IssuedShares in issue at beginning of year 1 462 1 456 Shares issued during the year – 6
Shares in issue at end of year 1 462 1 462
Treasury sharesTreasury shares at beginning of year (106) (107)Sale of treasury shares 4 1
Treasury shares at end of year (102) (106)
Total issued ordinary shares 1 360 1 356
Treasury shares are held as follows:HPFL B-BBEE Trusts 97 98 Forfeitable Share Plan 5 8
Rm 2017 2016
AuthorisedOrdinary shares of 1.0 cent each 25 25
Issued ordinary share capitalBalance at beginning and end of year 15 15
Share premiumBalance at beginning of year 4 182 4 018 Share premium arising on issue of shares 8 164
Balance at end of year 4 190 4 182
Issued ordinary share capital and premium 4 205 4 197
Notes to the Group annual financial statements continuedfor the year ended 30 September

87NETCARE LIMITED
Consolidated annual financial statements 2017
8. SHAREHOLDERS’ INTERESTS continued
8.2 Treasury shares Rm 2017 2016
Balance at beginning of year (3 768) (3 713)Issue of treasury shares held by Forfeitable Share Plan – (141)Sale of treasury shares 48 86
Balance at end of year (3 720) (3 768)
The HPFL Trusts are special purpose entities of which Netcare is not a beneficiary. They are consolidated in terms of IFRS 10: Consolidated Financial Statements. Treasury shares held by the HPFL B-BBEE Trusts carry voting rights. Treasury shares are deducted from the number of shares in issue for the purpose of calculating earnings per share.
During the year 2 million (2016: 1 million) treasury shares held by the HPFL Trusts were sold on the open market.
The Forfeitable Share Plan is an incentive scheme which issues share awards. The scheme issued 155 400 shares (2016: 4 261 537 shares) during the year for allocation to employees of Netcare. Treasury shares held by the employees do not carry voting rights prior to vesting. Treasury shares are deducted from the number of shares in issue and the dividends paid to employees on these shares are deducted from the earnings used in the calculation of earnings per share.
Unissued ordinary shares The number of unissued ordinary shares at 30 September 2017 is 1 038 million (2016: 1 038 million).
Share-based payments Details of options under the Netcare Share Incentive Scheme, trust units issued by the HPFL Trusts and share awards
issued in terms of the Forfeitable Share Plan are disclosed in note 4.3.
8.3 Preference share capital and premium The preference shares earn dividends on the issue price at 75% of the prime rate. Although the rights to receive dividends
are cumulative, declaration of such dividends is at the discretion of the directors.
Rm 2017 2016
Authorised10 million (2016: 10 million) variable rate, cumulative, non-redeemable, non-convertible preference shares of 50.0 cents each 5 5
Issued7 million (2016: 7 million) preference shares in issue at beginning and end of year 3 3
Share premiumBalance at beginning and end of year 641 641
Total issued preference share capital and premium 644 644
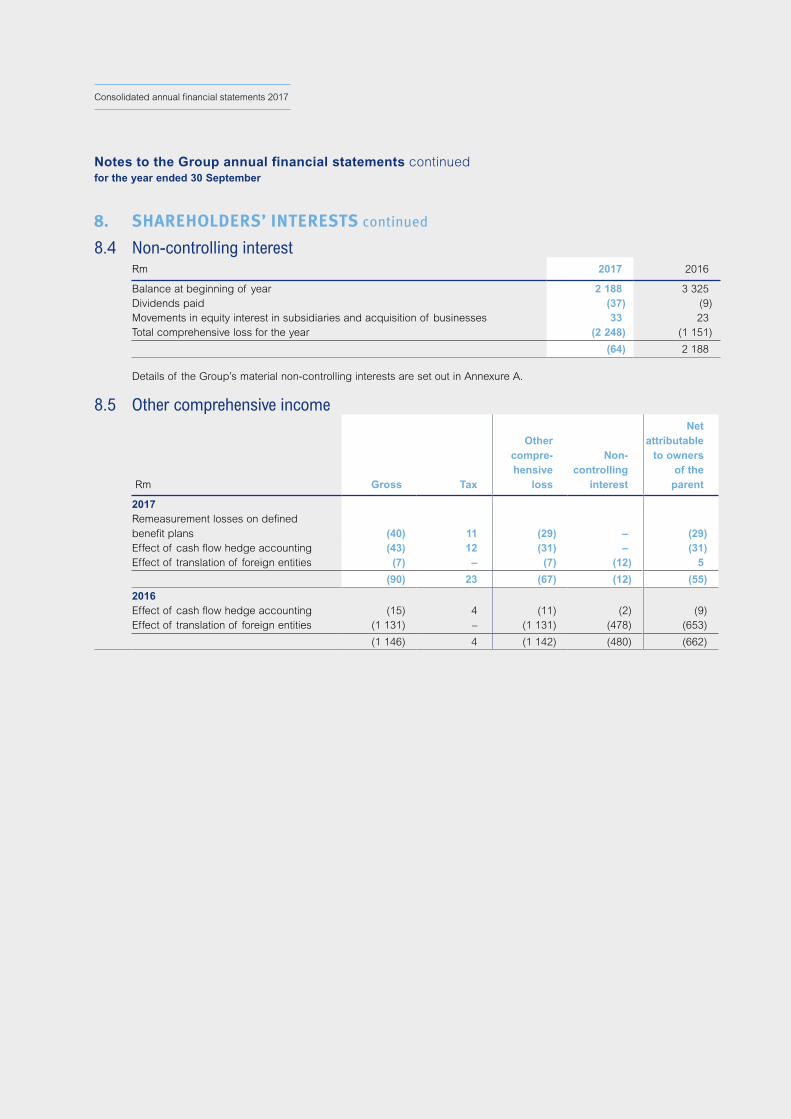
88NETCARE LIMITED
Consolidated annual financial statements 2017
8. SHAREHOLDERS’ INTERESTS continued
8.4 Non-controlling interest Rm 2017 2016
Balance at beginning of year 2 188 3 325 Dividends paid (37) (9)Movements in equity interest in subsidiaries and acquisition of businesses 33 23 Total comprehensive loss for the year (2 248) (1 151)
(64) 2 188
Details of the Group’s material non-controlling interests are set out in Annexure A.
8.5 Other comprehensive income
Rm Gross Tax
Other compre-hensive
loss
Non-controlling
interest
Net attributable
to owners of the
parent
2017Remeasurement losses on defined benefit plans (40) 11 (29) – (29)Effect of cash flow hedge accounting (43) 12 (31) – (31)Effect of translation of foreign entities (7) – (7) (12) 5
(90) 23 (67) (12) (55)
2016Effect of cash flow hedge accounting (15) 4 (11) (2) (9)Effect of translation of foreign entities (1 131) – (1 131) (478) (653)
(1 146) 4 (1 142) (480) (662)
Notes to the Group annual financial statements continuedfor the year ended 30 September
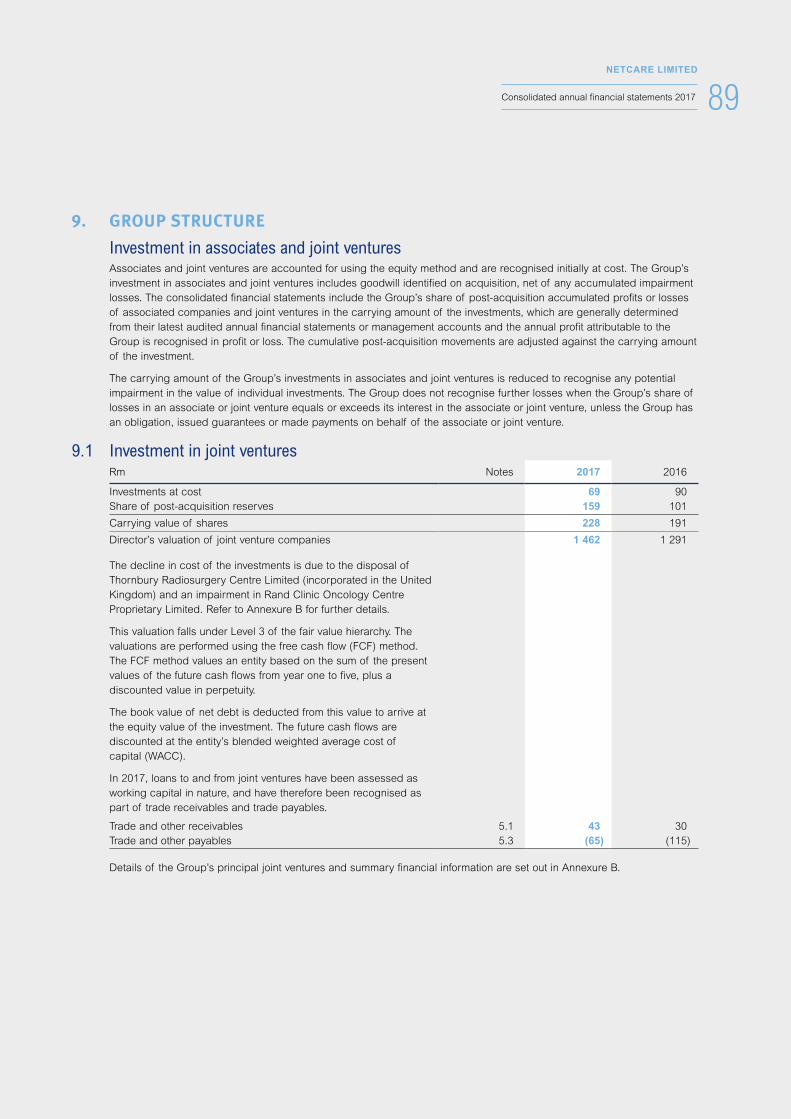
89NETCARE LIMITED
Consolidated annual financial statements 2017
9. GROUP STRUCTURE
Investment in associates and joint ventures Associates and joint ventures are accounted for using the equity method and are recognised initially at cost. The Group’s
investment in associates and joint ventures includes goodwill identified on acquisition, net of any accumulated impairment losses. The consolidated financial statements include the Group’s share of post-acquisition accumulated profits or losses of associated companies and joint ventures in the carrying amount of the investments, which are generally determined from their latest audited annual financial statements or management accounts and the annual profit attributable to the Group is recognised in profit or loss. The cumulative post-acquisition movements are adjusted against the carrying amount of the investment.
The carrying amount of the Group’s investments in associates and joint ventures is reduced to recognise any potential impairment in the value of individual investments. The Group does not recognise further losses when the Group’s share of losses in an associate or joint venture equals or exceeds its interest in the associate or joint venture, unless the Group has an obligation, issued guarantees or made payments on behalf of the associate or joint venture.
9.1 Investment in joint venturesRm Notes 2017 2016
Investments at cost 69 90 Share of post-acquisition reserves 159 101
Carrying value of shares 228 191
Director’s valuation of joint venture companies 1 462 1 291
The decline in cost of the investments is due to the disposal of Thornbury Radiosurgery Centre Limited (incorporated in the United Kingdom) and an impairment in Rand Clinic Oncology Centre Proprietary Limited. Refer to Annexure B for further details.
This valuation falls under Level 3 of the fair value hierarchy. The valuations are performed using the free cash flow (FCF) method. The FCF method values an entity based on the sum of the present values of the future cash flows from year one to five, plus a discounted value in perpetuity.
The book value of net debt is deducted from this value to arrive at the equity value of the investment. The future cash flows are discounted at the entity’s blended weighted average cost of capital (WACC).
In 2017, loans to and from joint ventures have been assessed as working capital in nature, and have therefore been recognised as part of trade receivables and trade payables.
Trade and other receivables 5.1 43 30 Trade and other payables 5.3 (65) (115)
Details of the Group’s principal joint ventures and summary financial information are set out in Annexure B.
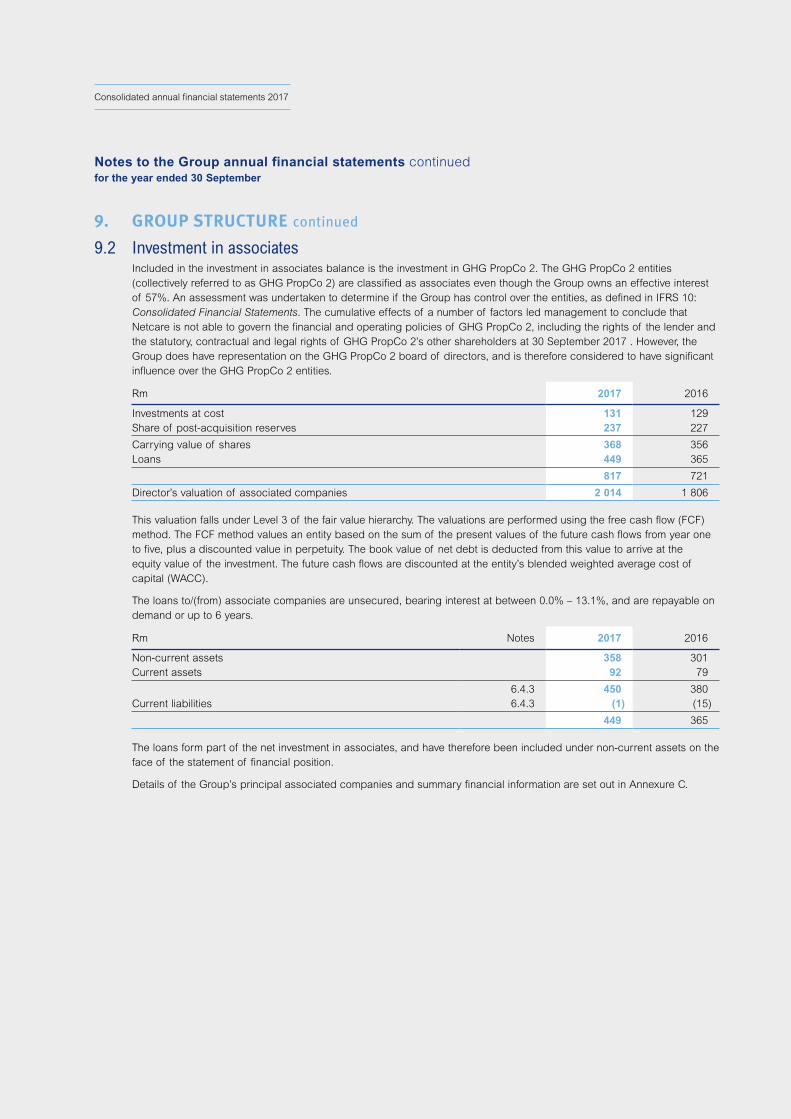
90NETCARE LIMITED
Consolidated annual financial statements 2017
9. GROUP STRUCTURE continued
9.2 Investment in associates Included in the investment in associates balance is the investment in GHG PropCo 2. The GHG PropCo 2 entities
(collectively referred to as GHG PropCo 2) are classified as associates even though the Group owns an effective interest of 57%. An assessment was undertaken to determine if the Group has control over the entities, as defined in IFRS 10: Consolidated Financial Statements. The cumulative effects of a number of factors led management to conclude that Netcare is not able to govern the financial and operating policies of GHG PropCo 2, including the rights of the lender and the statutory, contractual and legal rights of GHG PropCo 2’s other shareholders at 30 September 2017 . However, the Group does have representation on the GHG PropCo 2 board of directors, and is therefore considered to have significant influence over the GHG PropCo 2 entities.
Rm 2017 2016
Investments at cost 131 129 Share of post-acquisition reserves 237 227
Carrying value of shares 368 356 Loans 449 365
817 721
Director’s valuation of associated companies 2 014 1 806
This valuation falls under Level 3 of the fair value hierarchy. The valuations are performed using the free cash flow (FCF) method. The FCF method values an entity based on the sum of the present values of the future cash flows from year one to five, plus a discounted value in perpetuity. The book value of net debt is deducted from this value to arrive at the equity value of the investment. The future cash flows are discounted at the entity’s blended weighted average cost of capital (WACC).
The loans to/(from) associate companies are unsecured, bearing interest at between 0.0% – 13.1%, and are repayable on demand or up to 6 years.
Rm Notes 2017 2016
Non-current assets 358 301 Current assets 92 79
6.4.3 450 380 Current liabilities 6.4.3 (1) (15)
449 365
The loans form part of the net investment in associates, and have therefore been included under non-current assets on the face of the statement of financial position.
Details of the Group’s principal associated companies and summary financial information are set out in Annexure C.
Notes to the Group annual financial statements continuedfor the year ended 30 September
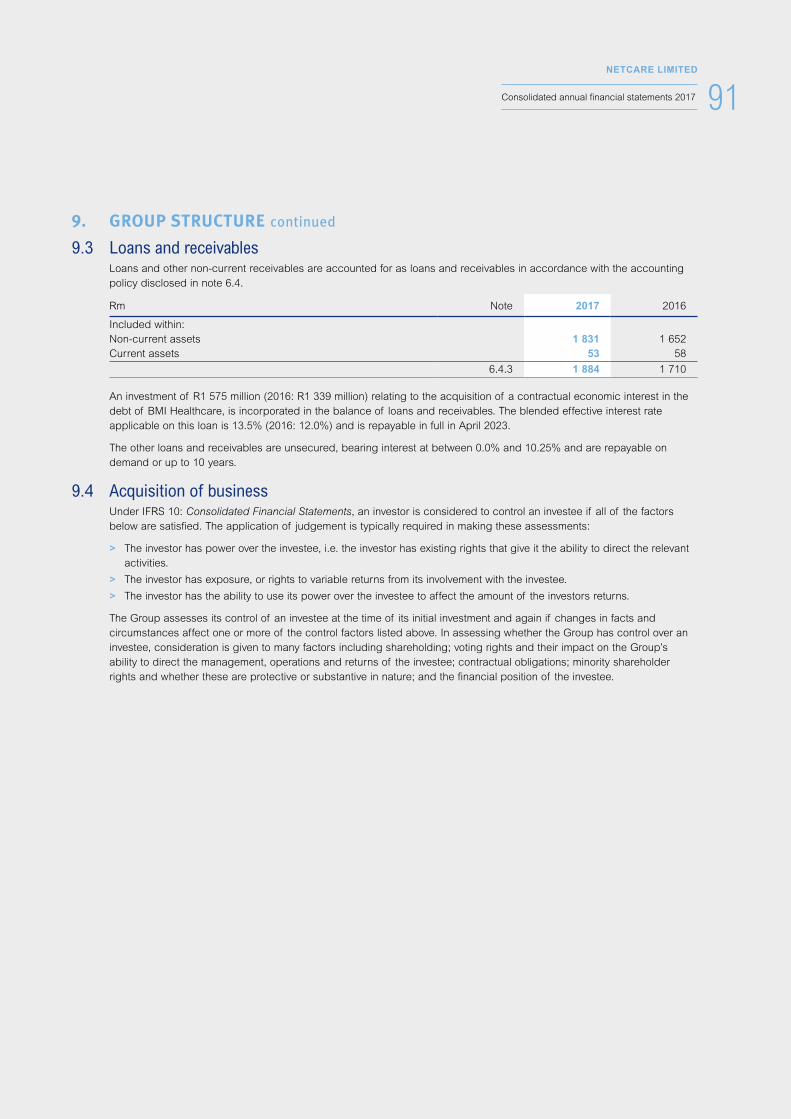
91NETCARE LIMITED
Consolidated annual financial statements 2017
9. GROUP STRUCTURE continued
9.3 Loans and receivables Loans and other non-current receivables are accounted for as loans and receivables in accordance with the accounting
policy disclosed in note 6.4.
Rm Note 2017 2016
Included within:Non-current assets 1 831 1 652 Current assets 53 58
6.4.3 1 884 1 710
An investment of R1 575 million (2016: R1 339 million) relating to the acquisition of a contractual economic interest in the debt of BMI Healthcare, is incorporated in the balance of loans and receivables. The blended effective interest rate applicable on this loan is 13.5% (2016: 12.0%) and is repayable in full in April 2023.
The other loans and receivables are unsecured, bearing interest at between 0.0% and 10.25% and are repayable on demand or up to 10 years.
9.4 Acquisition of business Under IFRS 10: Consolidated Financial Statements, an investor is considered to control an investee if all of the factors
below are satisfied. The application of judgement is typically required in making these assessments:
> The investor has power over the investee, i.e. the investor has existing rights that give it the ability to direct the relevant activities.
> The investor has exposure, or rights to variable returns from its involvement with the investee.
> The investor has the ability to use its power over the investee to affect the amount of the investors returns.
The Group assesses its control of an investee at the time of its initial investment and again if changes in facts and circumstances affect one or more of the control factors listed above. In assessing whether the Group has control over an investee, consideration is given to many factors including shareholding; voting rights and their impact on the Group’s ability to direct the management, operations and returns of the investee; contractual obligations; minority shareholder rights and whether these are protective or substantive in nature; and the financial position of the investee.
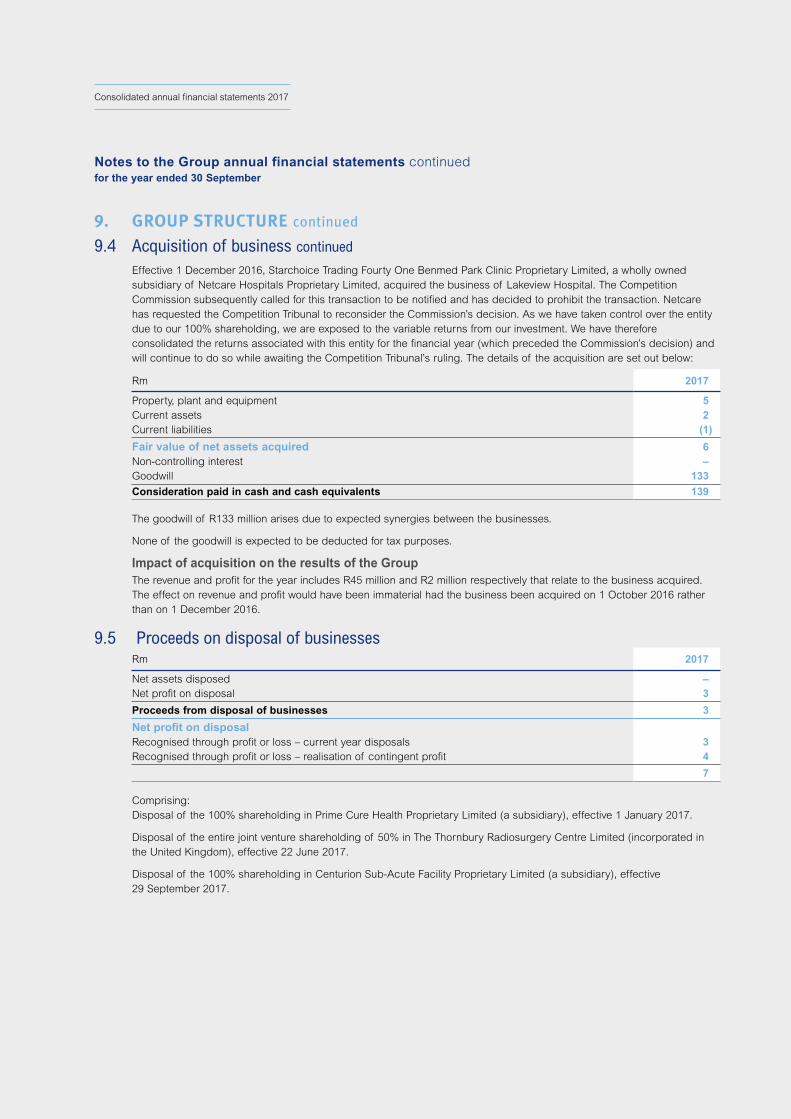
92NETCARE LIMITED
Consolidated annual financial statements 2017
9. GROUP STRUCTURE continued
9.4 Acquisition of business continued
Effective 1 December 2016, Starchoice Trading Fourty One Benmed Park Clinic Proprietary Limited, a wholly owned subsidiary of Netcare Hospitals Proprietary Limited, acquired the business of Lakeview Hospital. The Competition Commission subsequently called for this transaction to be notified and has decided to prohibit the transaction. Netcare has requested the Competition Tribunal to reconsider the Commission’s decision. As we have taken control over the entity due to our 100% shareholding, we are exposed to the variable returns from our investment. We have therefore consolidated the returns associated with this entity for the financial year (which preceded the Commission’s decision) and will continue to do so while awaiting the Competition Tribunal’s ruling. The details of the acquisition are set out below:
Rm 2017
Property, plant and equipment 5 Current assets 2 Current liabilities (1)
Fair value of net assets acquired 6 Non-controlling interest –Goodwill 133
Consideration paid in cash and cash equivalents 139
The goodwill of R133 million arises due to expected synergies between the businesses.
None of the goodwill is expected to be deducted for tax purposes.
Impact of acquisition on the results of the Group The revenue and profit for the year includes R45 million and R2 million respectively that relate to the business acquired.
The effect on revenue and profit would have been immaterial had the business been acquired on 1 October 2016 rather than on 1 December 2016.
9.5 Proceeds on disposal of businesses Rm 2017
Net assets disposed –Net profit on disposal 3
Proceeds from disposal of businesses 3
Net profit on disposal Recognised through profit or loss – current year disposals 3 Recognised through profit or loss – realisation of contingent profit 4
7
Comprising: Disposal of the 100% shareholding in Prime Cure Health Proprietary Limited (a subsidiary), effective 1 January 2017.
Disposal of the entire joint venture shareholding of 50% in The Thornbury Radiosurgery Centre Limited (incorporated in the United Kingdom), effective 22 June 2017.
Disposal of the 100% shareholding in Centurion Sub-Acute Facility Proprietary Limited (a subsidiary), effective 29 September 2017.
Notes to the Group annual financial statements continuedfor the year ended 30 September
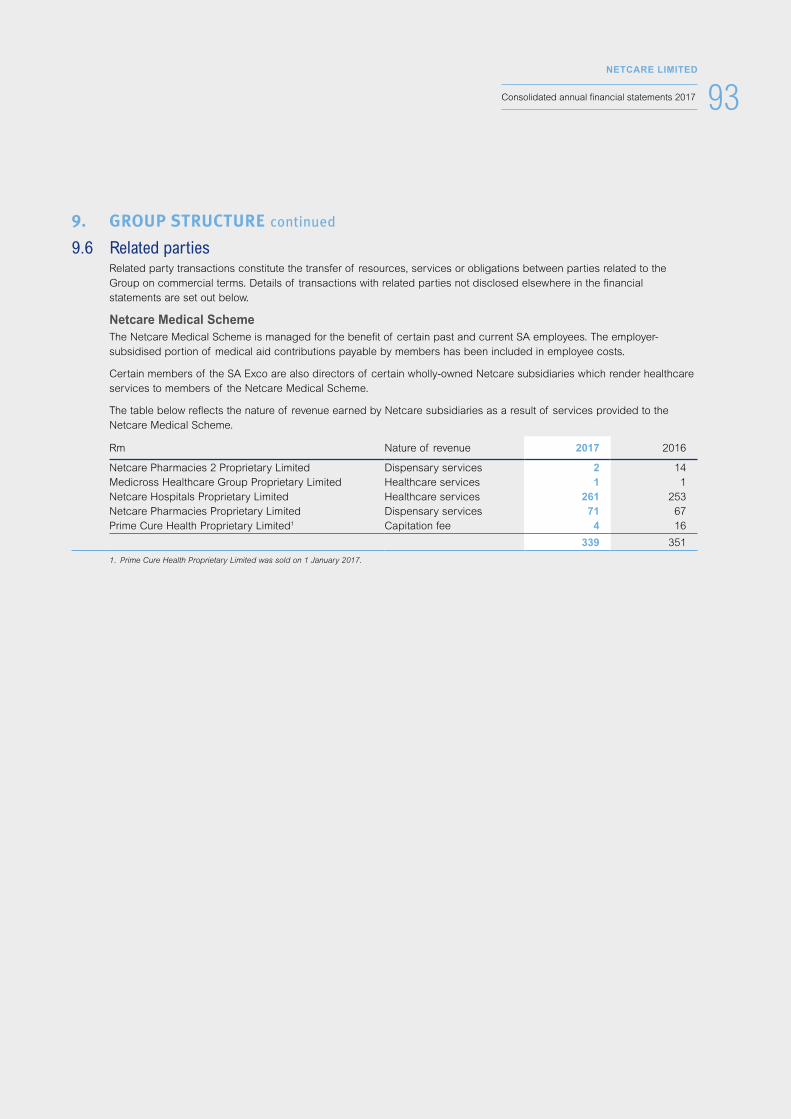
93NETCARE LIMITED
Consolidated annual financial statements 2017
9. GROUP STRUCTURE continued
9.6 Related parties Related party transactions constitute the transfer of resources, services or obligations between parties related to the
Group on commercial terms. Details of transactions with related parties not disclosed elsewhere in the financial statements are set out below.
Netcare Medical Scheme The Netcare Medical Scheme is managed for the benefit of certain past and current SA employees. The employer-
subsidised portion of medical aid contributions payable by members has been included in employee costs.
Certain members of the SA Exco are also directors of certain wholly-owned Netcare subsidiaries which render healthcare services to members of the Netcare Medical Scheme.
The table below reflects the nature of revenue earned by Netcare subsidiaries as a result of services provided to the Netcare Medical Scheme.
Rm Nature of revenue 2017 2016
Netcare Pharmacies 2 Proprietary Limited Dispensary services 2 14 Medicross Healthcare Group Proprietary Limited Healthcare services 1 1 Netcare Hospitals Proprietary Limited Healthcare services 261 253 Netcare Pharmacies Proprietary Limited Dispensary services 71 67 Prime Cure Health Proprietary Limited1 Capitation fee 4 16
339 351
1. Prime Cure Health Proprietary Limited was sold on 1 January 2017.
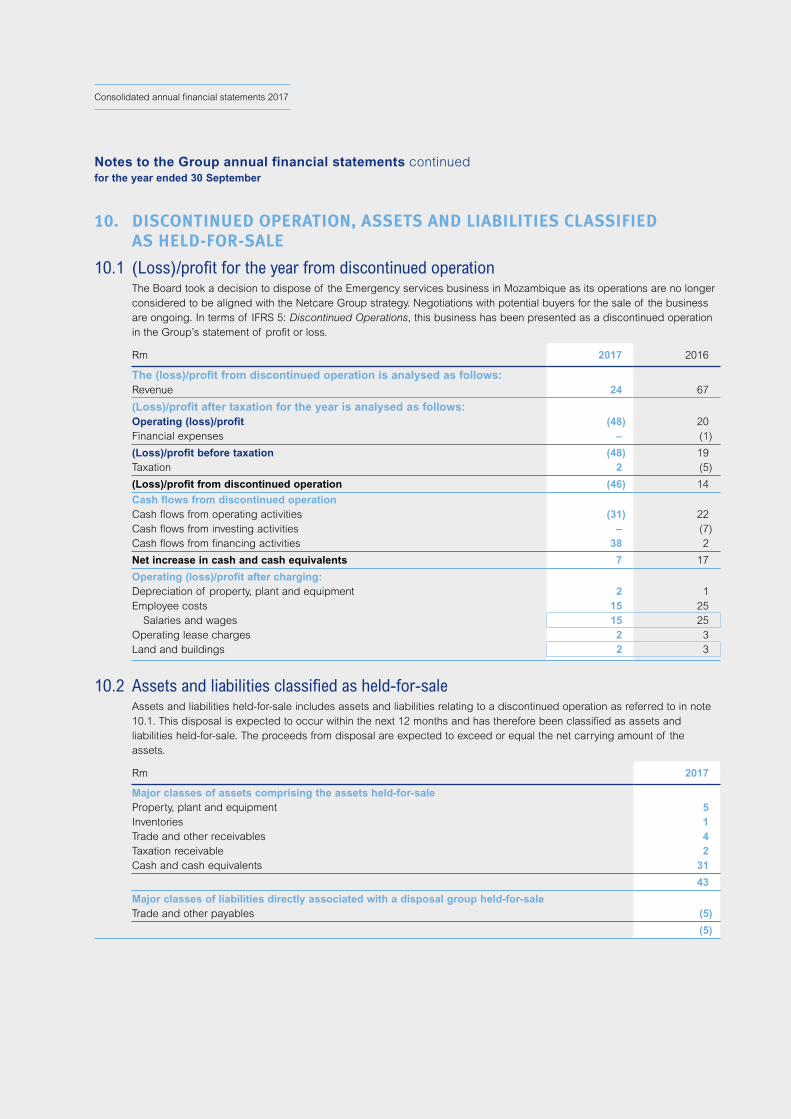
94NETCARE LIMITED
Consolidated annual financial statements 2017
10. DISCONTINUED OPERATION, ASSETS AND LIABILITIES CLASSIFIED AS HELD-FOR-SALE
10.1 (Loss)/profit for the year from discontinued operation The Board took a decision to dispose of the Emergency services business in Mozambique as its operations are no longer
considered to be aligned with the Netcare Group strategy. Negotiations with potential buyers for the sale of the business are ongoing. In terms of IFRS 5: Discontinued Operations, this business has been presented as a discontinued operation in the Group’s statement of profit or loss.
Rm 2017 2016
The (loss)/profit from discontinued operation is analysed as follows: Revenue 24 67
(Loss)/profit after taxation for the year is analysed as follows: Operating (loss)/profit (48) 20 Financial expenses – (1)
(Loss)/profit before taxation (48) 19 Taxation 2 (5)
(Loss)/profit from discontinued operation (46) 14
Cash flows from discontinued operationCash flows from operating activities (31) 22 Cash flows from investing activities – (7)Cash flows from financing activities 38 2
Net increase in cash and cash equivalents 7 17
Operating (loss)/profit after charging:Depreciation of property, plant and equipment 2 1 Employee costs 15 25
Salaries and wages 15 25 Operating lease charges 2 3 Land and buildings 2 3
10.2 Assets and liabilities classified as held-for-sale Assets and liabilities held-for-sale includes assets and liabilities relating to a discontinued operation as referred to in note
10.1. This disposal is expected to occur within the next 12 months and has therefore been classified as assets and liabilities held-for-sale. The proceeds from disposal are expected to exceed or equal the net carrying amount of the assets.
Rm 2017
Major classes of assets comprising the assets held-for-sale Property, plant and equipment 5 Inventories 1 Trade and other receivables 4 Taxation receivable 2 Cash and cash equivalents 31
43
Major classes of liabilities directly associated with a disposal group held-for-sale Trade and other payables (5)
(5)
Notes to the Group annual financial statements continuedfor the year ended 30 September
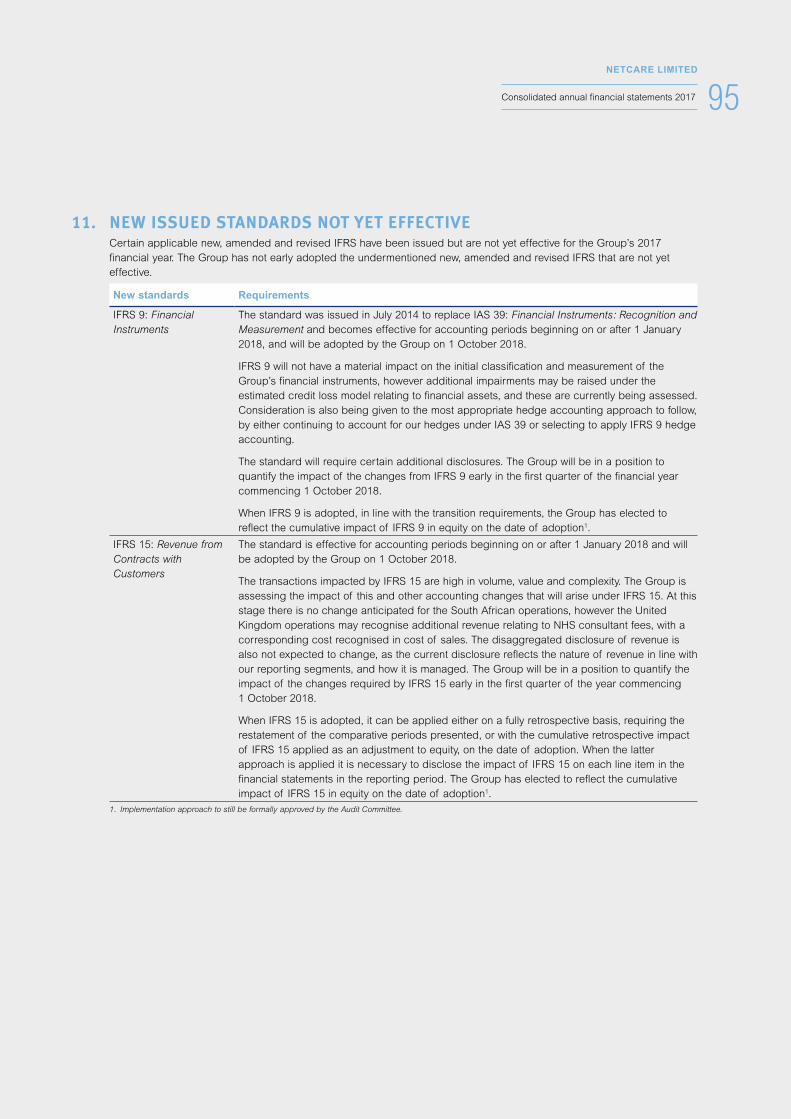
95NETCARE LIMITED
Consolidated annual financial statements 2017
11. NEW ISSUED STANDARDS NOT YET EFFECTIVE Certain applicable new, amended and revised IFRS have been issued but are not yet effective for the Group’s 2017
financial year. The Group has not early adopted the undermentioned new, amended and revised IFRS that are not yet effective.
New standards Requirements
IFRS 9: Financial Instruments
The standard was issued in July 2014 to replace IAS 39: Financial Instruments: Recognition and Measurement and becomes effective for accounting periods beginning on or after 1 January 2018, and will be adopted by the Group on 1 October 2018.
IFRS 9 will not have a material impact on the initial classification and measurement of the Group’s financial instruments, however additional impairments may be raised under the estimated credit loss model relating to financial assets, and these are currently being assessed. Consideration is also being given to the most appropriate hedge accounting approach to follow, by either continuing to account for our hedges under IAS 39 or selecting to apply IFRS 9 hedge accounting.
The standard will require certain additional disclosures. The Group will be in a position to quantify the impact of the changes from IFRS 9 early in the first quarter of the financial year commencing 1 October 2018.
When IFRS 9 is adopted, in line with the transition requirements, the Group has elected to reflect the cumulative impact of IFRS 9 in equity on the date of adoption1.
IFRS 15: Revenue from Contracts with Customers
The standard is effective for accounting periods beginning on or after 1 January 2018 and will be adopted by the Group on 1 October 2018.
The transactions impacted by IFRS 15 are high in volume, value and complexity. The Group is assessing the impact of this and other accounting changes that will arise under IFRS 15. At this stage there is no change anticipated for the South African operations, however the United Kingdom operations may recognise additional revenue relating to NHS consultant fees, with a corresponding cost recognised in cost of sales. The disaggregated disclosure of revenue is also not expected to change, as the current disclosure reflects the nature of revenue in line with our reporting segments, and how it is managed. The Group will be in a position to quantify the impact of the changes required by IFRS 15 early in the first quarter of the year commencing 1 October 2018.
When IFRS 15 is adopted, it can be applied either on a fully retrospective basis, requiring the restatement of the comparative periods presented, or with the cumulative retrospective impact of IFRS 15 applied as an adjustment to equity, on the date of adoption. When the latter approach is applied it is necessary to disclose the impact of IFRS 15 on each line item in the financial statements in the reporting period. The Group has elected to reflect the cumulative impact of IFRS 15 in equity on the date of adoption1.
1. Implementation approach to still be formally approved by the Audit Committee.
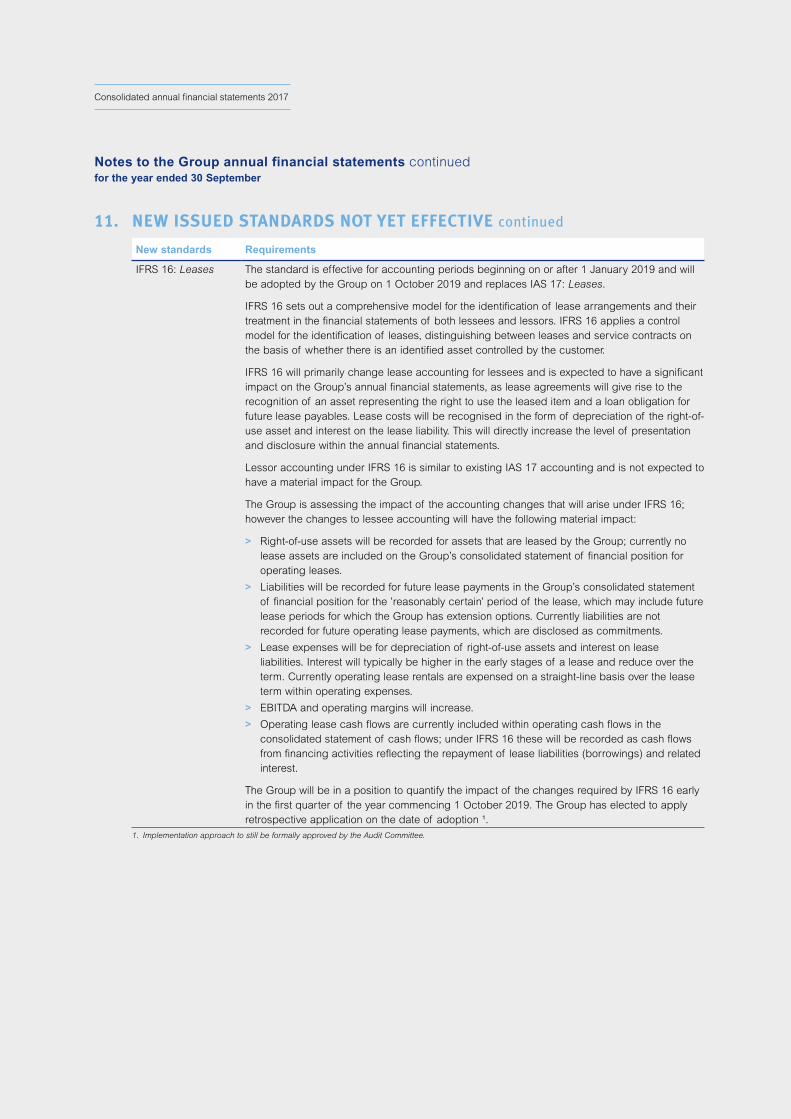
96NETCARE LIMITED
Consolidated annual financial statements 2017
11. NEW ISSUED STANDARDS NOT YET EFFECTIVE continued
New standards Requirements
IFRS 16: Leases The standard is effective for accounting periods beginning on or after 1 January 2019 and will be adopted by the Group on 1 October 2019 and replaces IAS 17: Leases.
IFRS 16 sets out a comprehensive model for the identification of lease arrangements and their treatment in the financial statements of both lessees and lessors. IFRS 16 applies a control model for the identification of leases, distinguishing between leases and service contracts on the basis of whether there is an identified asset controlled by the customer.
IFRS 16 will primarily change lease accounting for lessees and is expected to have a significant impact on the Group’s annual financial statements, as lease agreements will give rise to the recognition of an asset representing the right to use the leased item and a loan obligation for future lease payables. Lease costs will be recognised in the form of depreciation of the right-of-use asset and interest on the lease liability. This will directly increase the level of presentation and disclosure within the annual financial statements.
Lessor accounting under IFRS 16 is similar to existing IAS 17 accounting and is not expected to have a material impact for the Group.
The Group is assessing the impact of the accounting changes that will arise under IFRS 16; however the changes to lessee accounting will have the following material impact:
> Right-of-use assets will be recorded for assets that are leased by the Group; currently no lease assets are included on the Group’s consolidated statement of financial position for operating leases.
> Liabilities will be recorded for future lease payments in the Group’s consolidated statement of financial position for the ’reasonably certain’ period of the lease, which may include future lease periods for which the Group has extension options. Currently liabilities are not recorded for future operating lease payments, which are disclosed as commitments.
> Lease expenses will be for depreciation of right-of-use assets and interest on lease liabilities. Interest will typically be higher in the early stages of a lease and reduce over the term. Currently operating lease rentals are expensed on a straight-line basis over the lease term within operating expenses.
> EBITDA and operating margins will increase.
> Operating lease cash flows are currently included within operating cash flows in the consolidated statement of cash flows; under IFRS 16 these will be recorded as cash flows from financing activities reflecting the repayment of lease liabilities (borrowings) and related interest.
The Group will be in a position to quantify the impact of the changes required by IFRS 16 early in the first quarter of the year commencing 1 October 2019. The Group has elected to apply retrospective application on the date of adoption ¹.
1. Implementation approach to still be formally approved by the Audit Committee.
Notes to the Group annual financial statements continuedfor the year ended 30 September
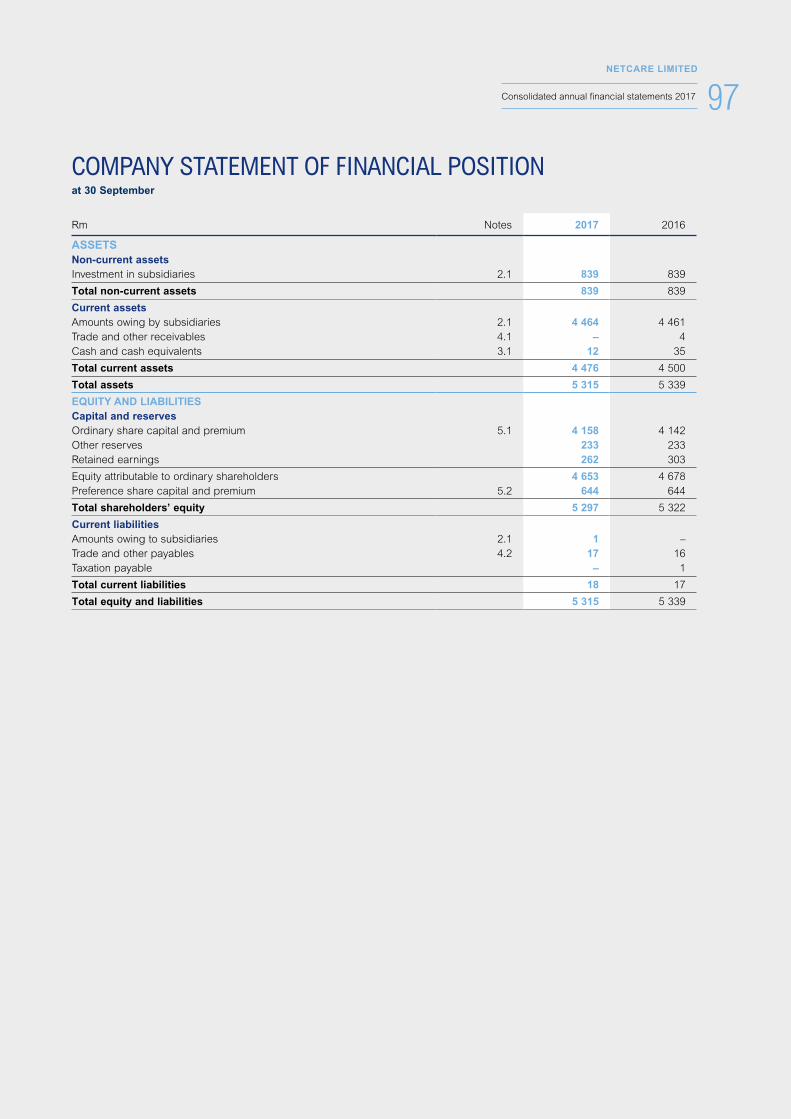
97NETCARE LIMITED
Consolidated annual financial statements 2017
COMPANY STATEMENT OF FINANCIAL POSITIONat 30 September
Rm Notes 2017 2016
ASSETSNon-current assetsInvestment in subsidiaries 2.1 839 839
Total non-current assets 839 839
Current assetsAmounts owing by subsidiaries 2.1 4 464 4 461 Trade and other receivables 4.1 – 4 Cash and cash equivalents 3.1 12 35
Total current assets 4 476 4 500
Total assets 5 315 5 339
EQUITY AND LIABILITIESCapital and reservesOrdinary share capital and premium 5.1 4 158 4 142 Other reserves 233 233 Retained earnings 262 303
Equity attributable to ordinary shareholders 4 653 4 678 Preference share capital and premium 5.2 644 644
Total shareholders’ equity 5 297 5 322
Current liabilitiesAmounts owing to subsidiaries 2.1 1 – Trade and other payables 4.2 17 16 Taxation payable – 1
Total current liabilities 18 17
Total equity and liabilities 5 315 5 339
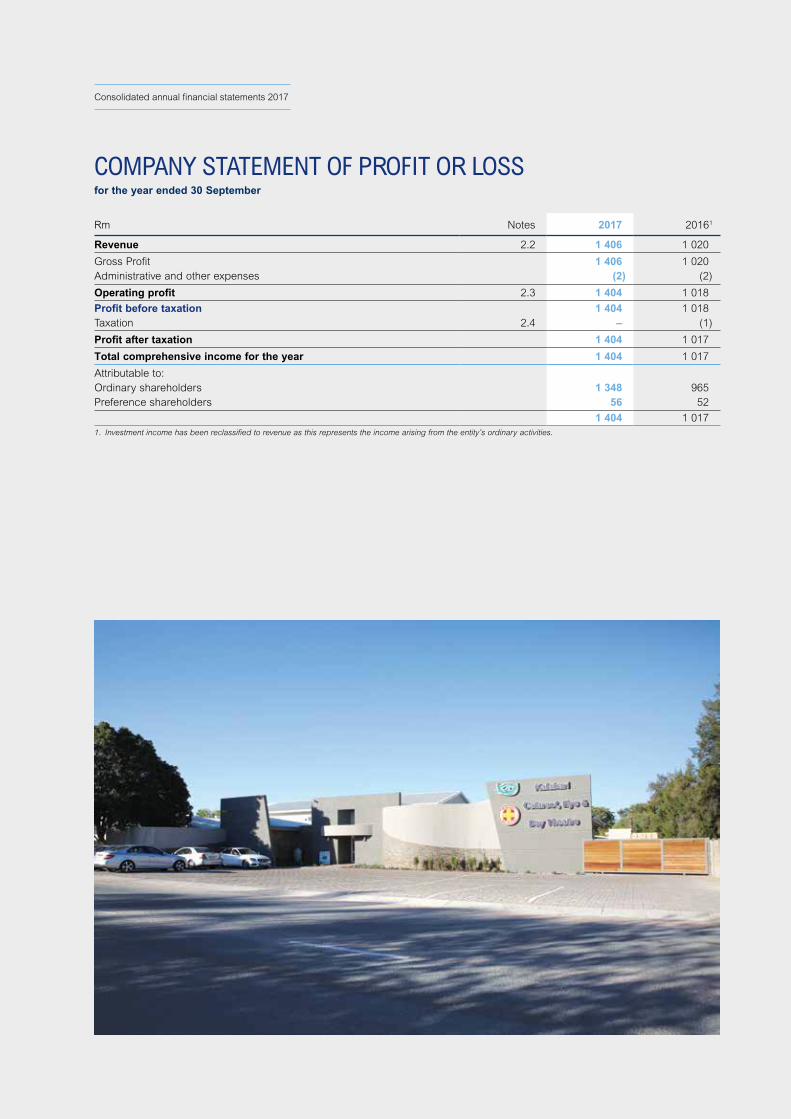
98NETCARE LIMITED
Consolidated annual financial statements 2017
Rm Notes 2017 20161
Revenue 2.2 1 406 1 020
Gross Profit 1 406 1 020 Administrative and other expenses (2) (2)
Operating profit 2.3 1 404 1 018
Profit before taxation 1 404 1 018 Taxation 2.4 – (1)
Profit after taxation 1 404 1 017
Total comprehensive income for the year 1 404 1 017
Attributable to: Ordinary shareholders 1 348 965 Preference shareholders 56 52
1 404 1 017 1. Investment income has been reclassified to revenue as this represents the income arising from the entity’s ordinary activities.
COMPANY STATEMENT OF PROFIT OR LOSSfor the year ended 30 September

99NETCARE LIMITED
Consolidated annual financial statements 2017
Rm Notes 2017 2016
Cash flows from operating activities Cash generated by operations 2.5 1 409 1 013 Taxation paid 2.6 (1) – Dividends paid (1 389) (1 345)Preference dividends paid (56) (52)
Net cash from operating activities (37) (384)
Cash flows from investing activities (Increase)/decrease in investments and loans (2) 166
Net cash from investing activities (2) 166
Cash flows from financing activities Proceeds from issue of ordinary shares 16 218
Net cash from financing activities 16 218
Net decrease in cash and cash equivalents (23) – Cash and cash equivalents at beginning of year 35 35
Cash and cash equivalents at end of year 3.1 12 35
COMPANY STATEMENT OF CASH FLOWSfor the year ended 30 September
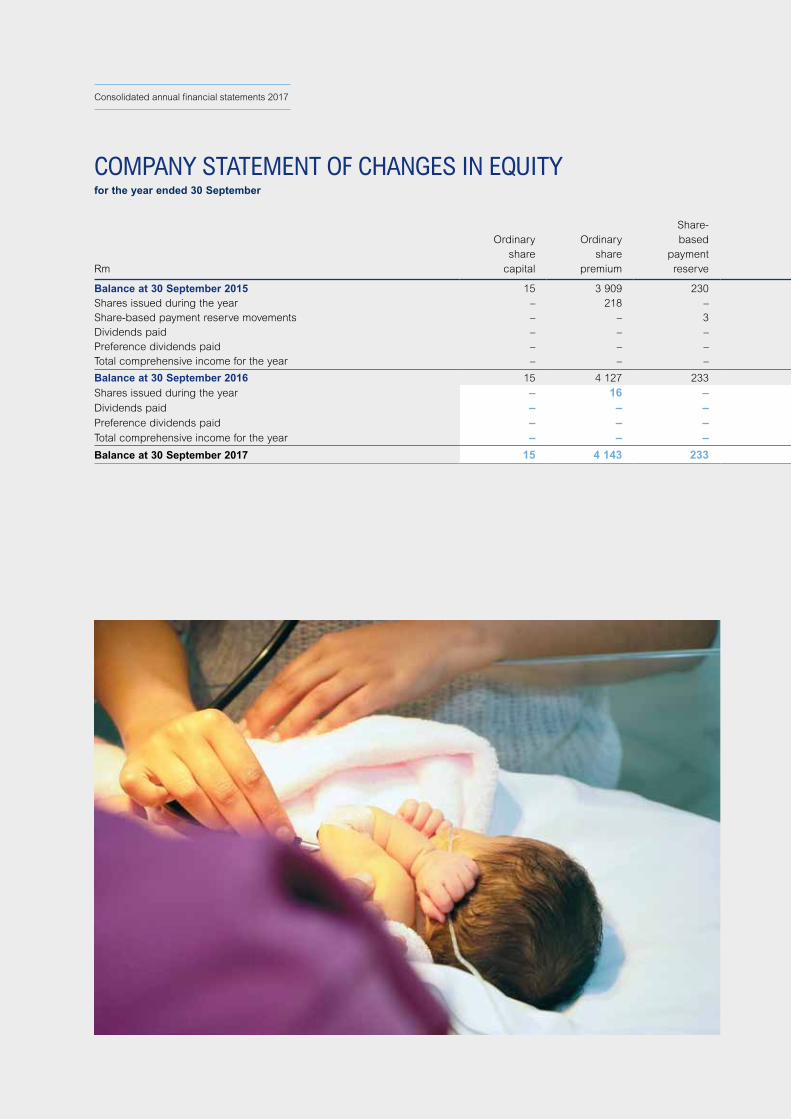
100NETCARE LIMITED
Consolidated annual financial statements 2017
Rm
Ordinary share
capital
Ordinary share
premium
Share-based
payment reserve
Retained earnings
Equity attributable to ordinary
shareholders
Preference share
capital and premium
Total shareholders’
equity
Balance at 30 September 2015 15 3 909 230 683 4 837 644 5 481 Shares issued during the year – 218 – – 218 – 218 Share-based payment reserve movements – – 3 – 3 – 3 Dividends paid – – – (1 345) (1 345) – (1 345)Preference dividends paid – – – – – (52) (52)Total comprehensive income for the year – – – 965 965 52 1 017
Balance at 30 September 2016 15 4 127 233 303 4 678 644 5 322 Shares issued during the year – 16 – – 16 – 16 Dividends paid – – – (1 389) (1 389) – (1 389)Preference dividends paid – – – – – (56) (56)Total comprehensive income for the year – – – 1 348 1 348 56 1 404
Balance at 30 September 2017 15 4 143 233 262 4 653 644 5 297
COMPANY STATEMENT OF CHANGES IN EQUITYfor the year ended 30 September

101NETCARE LIMITED
Consolidated annual financial statements 2017
Rm
Ordinary share
capital
Ordinary share
premium
Share-based
payment reserve
Retained earnings
Equity attributable to ordinary
shareholders
Preference share
capital and premium
Total shareholders’
equity
Balance at 30 September 2015 15 3 909 230 683 4 837 644 5 481 Shares issued during the year – 218 – – 218 – 218 Share-based payment reserve movements – – 3 – 3 – 3 Dividends paid – – – (1 345) (1 345) – (1 345)Preference dividends paid – – – – – (52) (52)Total comprehensive income for the year – – – 965 965 52 1 017
Balance at 30 September 2016 15 4 127 233 303 4 678 644 5 322 Shares issued during the year – 16 – – 16 – 16 Dividends paid – – – (1 389) (1 389) – (1 389)Preference dividends paid – – – – – (56) (56)Total comprehensive income for the year – – – 1 348 1 348 56 1 404
Balance at 30 September 2017 15 4 143 233 262 4 653 644 5 297
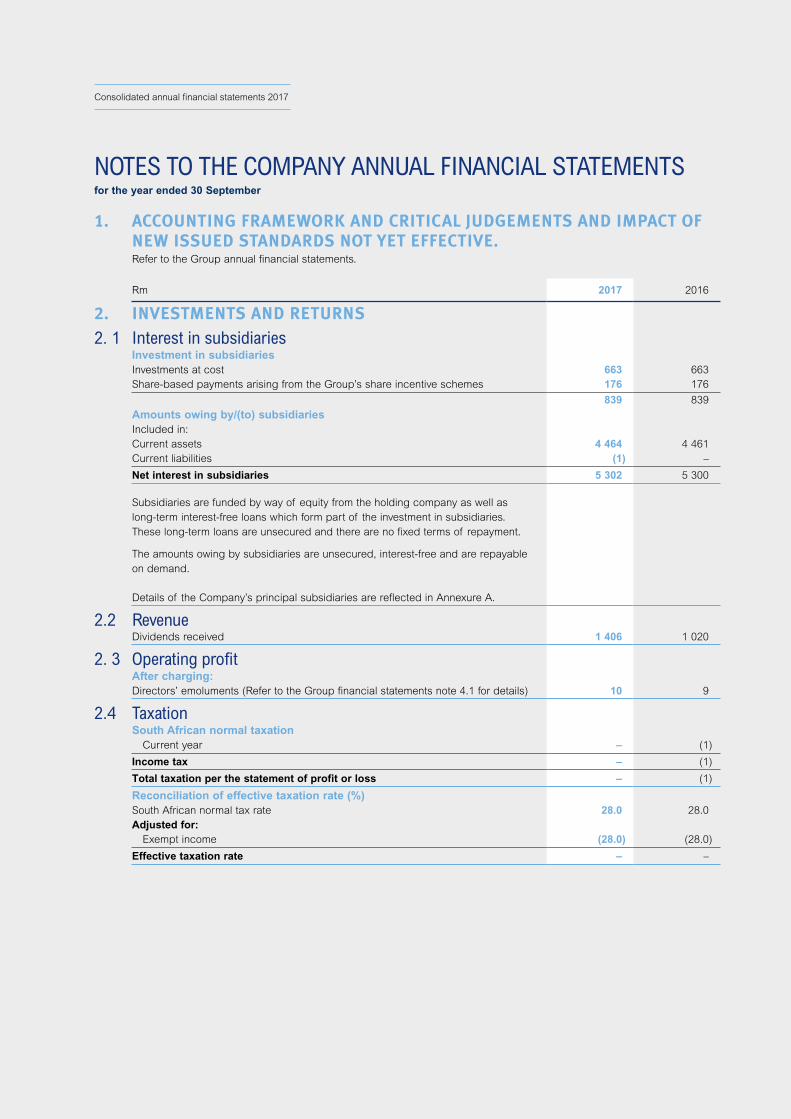
102NETCARE LIMITED
Consolidated annual financial statements 2017
1. ACCOUNTING FRAMEWORK AND CRITICAL JUDGEMENTS AND IMPACT OF NEW ISSUED STANDARDS NOT YET EFFECTIVE.Refer to the Group annual financial statements.
Rm 2017 2016
2. INVESTMENTS AND RETURNS2. 1 Interest in subsidiaries
Investment in subsidiariesInvestments at cost 663 663 Share-based payments arising from the Group’s share incentive schemes 176 176
839 839 Amounts owing by/(to) subsidiariesIncluded in:Current assets 4 464 4 461 Current liabilities (1) –
Net interest in subsidiaries 5 302 5 300
Subsidiaries are funded by way of equity from the holding company as well as long-term interest-free loans which form part of the investment in subsidiaries. These long-term loans are unsecured and there are no fixed terms of repayment.
The amounts owing by subsidiaries are unsecured, interest-free and are repayable on demand.
Details of the Company’s principal subsidiaries are reflected in Annexure A.
2.2 Revenue Dividends received 1 406 1 020
2. 3 Operating profitAfter charging:Directors’ emoluments (Refer to the Group financial statements note 4.1 for details) 10 9
2.4 TaxationSouth African normal taxation Current year – (1)
Income tax – (1)
Total taxation per the statement of profit or loss – (1)
Reconciliation of effective taxation rate (%)South African normal tax rate 28.0 28.0 Adjusted for: Exempt income (28.0) (28.0)
Effective taxation rate – –
NOTES TO THE COMPANY ANNUAL FINANCIAL STATEMENTSfor the year ended 30 September
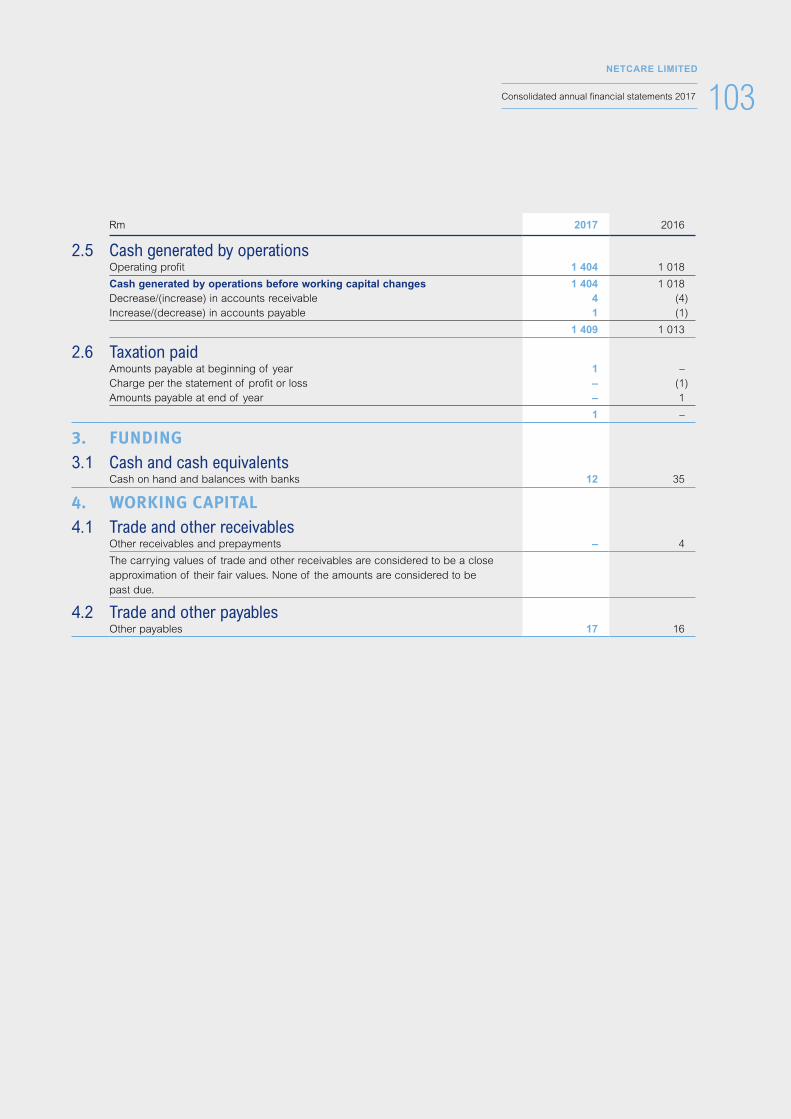
103NETCARE LIMITED
Consolidated annual financial statements 2017
Rm 2017 2016
2.5 Cash generated by operationsOperating profit 1 404 1 018
Cash generated by operations before working capital changes 1 404 1 018 Decrease/(increase) in accounts receivable 4 (4)Increase/(decrease) in accounts payable 1 (1)
1 409 1 013
2.6 Taxation paidAmounts payable at beginning of year 1 – Charge per the statement of profit or loss – (1)Amounts payable at end of year – 1
1 –
3. FUNDING3.1 Cash and cash equivalents
Cash on hand and balances with banks 12 35
4. WORKING CAPITAL4.1 Trade and other receivables
Other receivables and prepayments – 4
The carrying values of trade and other receivables are considered to be a close approximation of their fair values. None of the amounts are considered to be past due.
4.2 Trade and other payablesOther payables 17 16
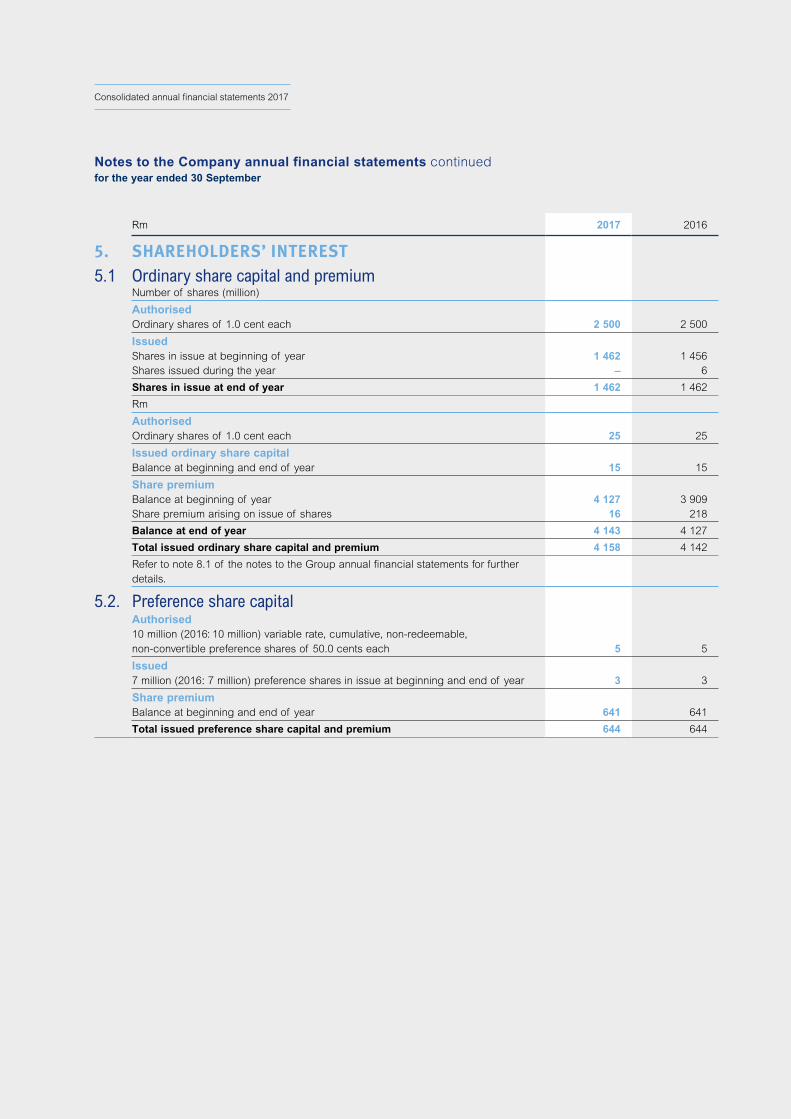
104NETCARE LIMITED
Consolidated annual financial statements 2017
Rm 2017 2016
5. SHAREHOLDERS’ INTEREST5.1 Ordinary share capital and premium
Number of shares (million)
AuthorisedOrdinary shares of 1.0 cent each 2 500 2 500
IssuedShares in issue at beginning of year 1 462 1 456 Shares issued during the year – 6
Shares in issue at end of year 1 462 1 462
Rm
AuthorisedOrdinary shares of 1.0 cent each 25 25
Issued ordinary share capitalBalance at beginning and end of year 15 15
Share premiumBalance at beginning of year 4 127 3 909 Share premium arising on issue of shares 16 218
Balance at end of year 4 143 4 127
Total issued ordinary share capital and premium 4 158 4 142
Refer to note 8.1 of the notes to the Group annual financial statements for further details.
5.2. Preference share capitalAuthorised10 million (2016: 10 million) variable rate, cumulative, non-redeemable, non-convertible preference shares of 50.0 cents each 5 5
Issued7 million (2016: 7 million) preference shares in issue at beginning and end of year 3 3
Share premiumBalance at beginning and end of year 641 641
Total issued preference share capital and premium 644 644
Notes to the Company annual financial statements continuedfor the year ended 30 September
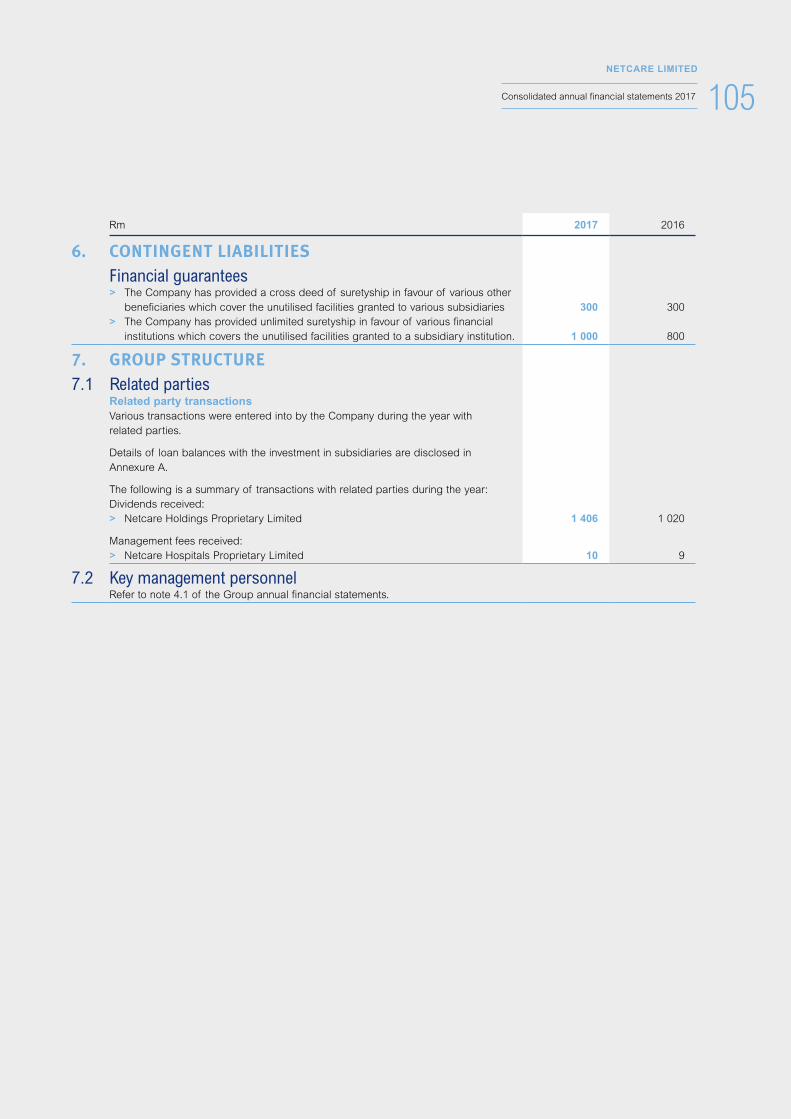
105NETCARE LIMITED
Consolidated annual financial statements 2017
Rm 2017 2016
6. CONTINGENT LIABILITIESFinancial guarantees
> The Company has provided a cross deed of suretyship in favour of various other beneficiaries which cover the unutilised facilities granted to various subsidiaries 300 300
> The Company has provided unlimited suretyship in favour of various financial institutions which covers the unutilised facilities granted to a subsidiary institution. 1 000 800
7. GROUP STRUCTURE7.1 Related parties
Related party transactionsVarious transactions were entered into by the Company during the year with related parties.
Details of loan balances with the investment in subsidiaries are disclosed in Annexure A.
The following is a summary of transactions with related parties during the year:Dividends received:
> Netcare Holdings Proprietary Limited 1 406 1 020
Management fees received: > Netcare Hospitals Proprietary Limited 10 9
7.2 Key management personnelRefer to note 4.1 of the Group annual financial statements.
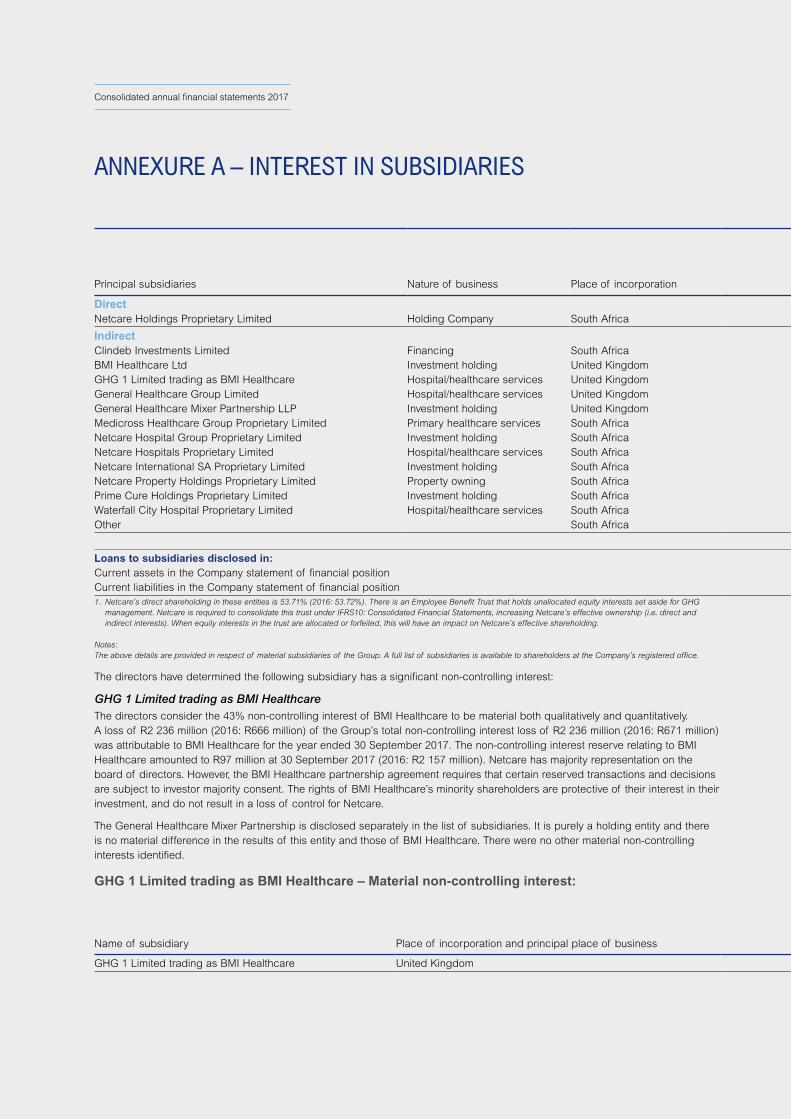
106NETCARE LIMITED
Consolidated annual financial statements 2017
Effective Group holding % Investment (Rm) Loans to subsidiaries
Principal subsidiaries Nature of business Place of incorporation
Issued ordinary
share capital (Thousands) 2017 2016 2017 2016 2017 2016
DirectNetcare Holdings Proprietary Limited Holding Company South Africa R120 100 100 663 663 4 422 4 428
IndirectClindeb Investments Limited Financing South Africa R1 100 100 – – 38 18 BMI Healthcare Ltd Investment holding United Kingdom £17 600 57¹ 57¹ – – – – GHG 1 Limited trading as BMI Healthcare Hospital/healthcare services United Kingdom 57¹ 57¹ – – – – General Healthcare Group Limited Hospital/healthcare services United Kingdom £10 000 57¹ 57¹ – – – – General Healthcare Mixer Partnership LLP Investment holding United Kingdom £540 000 57¹ 57¹ – – – – Medicross Healthcare Group Proprietary Limited Primary healthcare services South Africa R2 100 100 13 13 – – Netcare Hospital Group Proprietary Limited Investment holding South Africa R4 100 100 – – – – Netcare Hospitals Proprietary Limited Hospital/healthcare services South Africa 100 100 151 151 – – Netcare International SA Proprietary Limited Investment holding South Africa 100 100 – – – – Netcare Property Holdings Proprietary Limited Property owning South Africa 100 100 – – – – Prime Cure Holdings Proprietary Limited Investment holding South Africa 100 100 2 2 – – Waterfall City Hospital Proprietary Limited Hospital/healthcare services South Africa 85 80 – – – – Other South Africa 10 10 3 15
839 839 4 463 4 461
Loans to subsidiaries disclosed in:Current assets in the Company statement of financial position 4 464 4 461Current liabilities in the Company statement of financial position (1) –1. Netcare’s direct shareholding in these entities is 53.71% (2016: 53.72%). There is an Employee Benefit Trust that holds unallocated equity interests set aside for GHG
management. Netcare is required to consolidate this trust under IFRS10: Consolidated Financial Statements, increasing Netcare’s effective ownership (i.e. direct and indirect interests). When equity interests in the trust are allocated or forfeited, this will have an impact on Netcare’s effective shareholding.
Notes: The above details are provided in respect of material subsidiaries of the Group. A full list of subsidiaries is available to shareholders at the Company’s registered office.
The directors have determined the following subsidiary has a significant non-controlling interest:
GHG 1 Limited trading as BMI HealthcareThe directors consider the 43% non-controlling interest of BMI Healthcare to be material both qualitatively and quantitatively. A loss of R2 236 million (2016: R666 million) of the Group’s total non-controlling interest loss of R2 236 million (2016: R671 million) was attributable to BMI Healthcare for the year ended 30 September 2017. The non-controlling interest reserve relating to BMI Healthcare amounted to R97 million at 30 September 2017 (2016: R2 157 million). Netcare has majority representation on the board of directors. However, the BMI Healthcare partnership agreement requires that certain reserved transactions and decisions are subject to investor majority consent. The rights of BMI Healthcare’s minority shareholders are protective of their interest in their investment, and do not result in a loss of control for Netcare.
The General Healthcare Mixer Partnership is disclosed separately in the list of subsidiaries. It is purely a holding entity and there is no material difference in the results of this entity and those of BMI Healthcare. There were no other material non-controlling interests identified.
ANNEXURE A – INTEREST IN SUBSIDIARIES
GHG 1 Limited trading as BMI Healthcare – Material non-controlling interest: Proportion of ownership
interests and voting rights heldby non-controlling interests
Loss allocated to non-controlling interests (Rm)
Accumulated non-controlling interest (Rm)
Name of subsidiary Place of incorporation and principal place of business 2017 2016 2017 2016 2017 2016
GHG 1 Limited trading as BMI Healthcare United Kingdom 43% 43% (2 236) (666) (97) 2 157
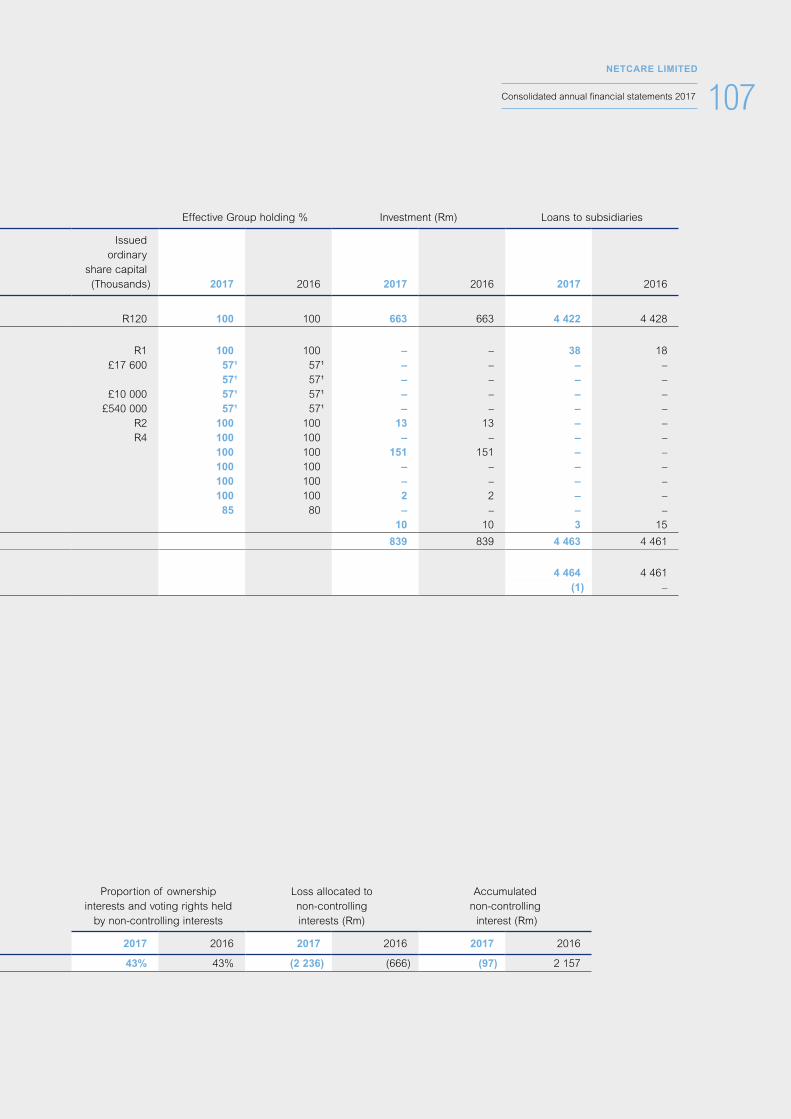
107NETCARE LIMITED
Consolidated annual financial statements 2017
Effective Group holding % Investment (Rm) Loans to subsidiaries
Principal subsidiaries Nature of business Place of incorporation
Issued ordinary
share capital (Thousands) 2017 2016 2017 2016 2017 2016
DirectNetcare Holdings Proprietary Limited Holding Company South Africa R120 100 100 663 663 4 422 4 428
IndirectClindeb Investments Limited Financing South Africa R1 100 100 – – 38 18 BMI Healthcare Ltd Investment holding United Kingdom £17 600 57¹ 57¹ – – – – GHG 1 Limited trading as BMI Healthcare Hospital/healthcare services United Kingdom 57¹ 57¹ – – – – General Healthcare Group Limited Hospital/healthcare services United Kingdom £10 000 57¹ 57¹ – – – – General Healthcare Mixer Partnership LLP Investment holding United Kingdom £540 000 57¹ 57¹ – – – – Medicross Healthcare Group Proprietary Limited Primary healthcare services South Africa R2 100 100 13 13 – – Netcare Hospital Group Proprietary Limited Investment holding South Africa R4 100 100 – – – – Netcare Hospitals Proprietary Limited Hospital/healthcare services South Africa 100 100 151 151 – – Netcare International SA Proprietary Limited Investment holding South Africa 100 100 – – – – Netcare Property Holdings Proprietary Limited Property owning South Africa 100 100 – – – – Prime Cure Holdings Proprietary Limited Investment holding South Africa 100 100 2 2 – – Waterfall City Hospital Proprietary Limited Hospital/healthcare services South Africa 85 80 – – – – Other South Africa 10 10 3 15
839 839 4 463 4 461
Loans to subsidiaries disclosed in:Current assets in the Company statement of financial position 4 464 4 461Current liabilities in the Company statement of financial position (1) –1. Netcare’s direct shareholding in these entities is 53.71% (2016: 53.72%). There is an Employee Benefit Trust that holds unallocated equity interests set aside for GHG
management. Netcare is required to consolidate this trust under IFRS10: Consolidated Financial Statements, increasing Netcare’s effective ownership (i.e. direct and indirect interests). When equity interests in the trust are allocated or forfeited, this will have an impact on Netcare’s effective shareholding.
Notes: The above details are provided in respect of material subsidiaries of the Group. A full list of subsidiaries is available to shareholders at the Company’s registered office.
The directors have determined the following subsidiary has a significant non-controlling interest:
GHG 1 Limited trading as BMI HealthcareThe directors consider the 43% non-controlling interest of BMI Healthcare to be material both qualitatively and quantitatively. A loss of R2 236 million (2016: R666 million) of the Group’s total non-controlling interest loss of R2 236 million (2016: R671 million) was attributable to BMI Healthcare for the year ended 30 September 2017. The non-controlling interest reserve relating to BMI Healthcare amounted to R97 million at 30 September 2017 (2016: R2 157 million). Netcare has majority representation on the board of directors. However, the BMI Healthcare partnership agreement requires that certain reserved transactions and decisions are subject to investor majority consent. The rights of BMI Healthcare’s minority shareholders are protective of their interest in their investment, and do not result in a loss of control for Netcare.
The General Healthcare Mixer Partnership is disclosed separately in the list of subsidiaries. It is purely a holding entity and there is no material difference in the results of this entity and those of BMI Healthcare. There were no other material non-controlling interests identified.
GHG 1 Limited trading as BMI Healthcare – Material non-controlling interest: Proportion of ownership
interests and voting rights heldby non-controlling interests
Loss allocated to non-controlling interests (Rm)
Accumulated non-controlling interest (Rm)
Name of subsidiary Place of incorporation and principal place of business 2017 2016 2017 2016 2017 2016
GHG 1 Limited trading as BMI Healthcare United Kingdom 43% 43% (2 236) (666) (97) 2 157
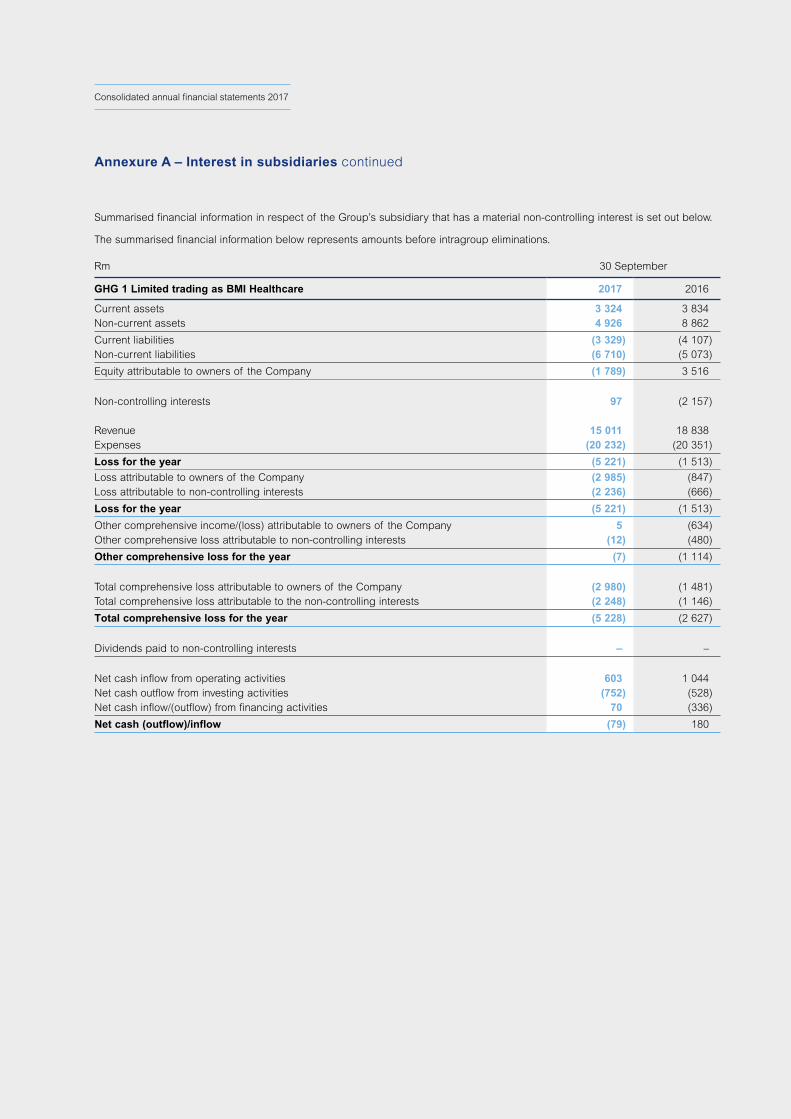
108NETCARE LIMITED
Consolidated annual financial statements 2017
Summarised financial information in respect of the Group’s subsidiary that has a material non-controlling interest is set out below.
The summarised financial information below represents amounts before intragroup eliminations.
Rm 30 September
GHG 1 Limited trading as BMI Healthcare 2017 2016
Current assets 3 324 3 834 Non-current assets 4 926 8 862
Current liabilities (3 329) (4 107) Non-current liabilities (6 710) (5 073)
Equity attributable to owners of the Company (1 789) 3 516
Non-controlling interests 97 (2 157)
Revenue 15 011 18 838 Expenses (20 232) (20 351)
Loss for the year (5 221) (1 513)
Loss attributable to owners of the Company (2 985) (847) Loss attributable to non-controlling interests (2 236) (666)
Loss for the year (5 221) (1 513)
Other comprehensive income/(loss) attributable to owners of the Company 5 (634) Other comprehensive loss attributable to non-controlling interests (12) (480)
Other comprehensive loss for the year (7) (1 114)
Total comprehensive loss attributable to owners of the Company (2 980) (1 481) Total comprehensive loss attributable to the non-controlling interests (2 248) (1 146)
Total comprehensive loss for the year (5 228) (2 627)
Dividends paid to non-controlling interests – –
Net cash inflow from operating activities 603 1 044 Net cash outflow from investing activities (752) (528) Net cash inflow/(outflow) from financing activities 70 (336)
Net cash (outflow)/inflow (79) 180
Annexure A – Interest in subsidiaries continued

109NETCARE LIMITED
Consolidated annual financial statements 2017
Acquisition of subsidiaries during the yearDuring the current year, the Group acquired the following subsidiaries:
> Acquired 100% in Starchoice Trading Fourty One Benmed Park Clinic Proprietary Limited – effective 1 December 2016.
> Acquired 100% in Netcare Occupational Health Proprietary Limited – effective 14 December 2016.
> Acquired 100% in Netcare CBMH Cancer Care Centre Proprietary Limited – effective 1 January 2017.
> Acquired 100% in Netcare Milpark Intraop Proprietary Limited – effective 1 January 2017.
> Acquired 100% in Netcare Pinehaven Cancer Centre Proprietary Limited – effective 1 January 2017.
> Acquired 100% in Netcare Southern Cape Cancer Centre Proprietary Limited – effective 1 January 2017.
> Acquired 100% in Medicross Constantia Park Day Theatre Proprietary Limited – effective 1 March 2017.
> Acquired 100% in Medicross Boksburg Day Theatre Proprietary Limited – effective 1 March 2017.
> Acquired 100% in Medicross Germiston Day Theatre Proprietary Limited – effective 1 March 2017.
> Acquired 100% in Medicross Silverton Day Theatre Proprietary Limited – effective 1 March 2017.
> Acquired 52% in Seteclass Proprietary Limited – effective 1 March 2017.
> Acquired 100% in Netcare Olivedale Investment Company (RF) Proprietary Limited – effective 10 April 2017.
> Acquired 100% in Netcare Garden City Hospital Investment Company (RF) Proprietary Limited – effective 21 April 2017.
> Acquired 100% in Netcare Montana Investment Company (RF) Proprietary Limited – effective 12 May 2017.
> Acquired 100% in Netcare N1 City Investment Company (RF) Proprietary Limited – effective 19 May 2017.
> Acquired 100% in Netcare Pretoria East Investment Company (RF) Proprietary Limited – effective 19 May 2017.
> Acquired 100% in Netcare Sunninghill Investment Company (RF) Proprietary Limited – effective 13 July 2017.
> Acquired 100% in Aztowize Proprietary Limited – effective 31 July 2017.
> Acquired 100% in Netcare Loftus Park Hospital Opco Proprietary Limited – effective 10 August 2017.
> Acquired 100% in Netcare Moot Investment Company (RF) Proprietary Limited – effective 23 August 2017.
Disposal of subsidiaries during the yearDuring the current year, the Group disposed of the following subsidiaries:
> 100% shareholding in Prime Cure Health Proprietary Limited (a subsidiary), effective 1 January 2017.
> 50% shareholding in The Thornbury Radiosurgery Centre Limited (incorporated in the United Kingdom), effective 22 June 2017.
> 70% shareholding in Centurion Sub-Acute Facility Proprietary Limited (a subsidiary), effective 29 September 2017.
Change in the Group’s ownership interest in a subsidiary > Acquired an additional 5.0% shareholding in our subsidiary, Waterfall City Hospital Proprietary Limited, effective 1 March 2017.
> The Group entered into a share buyback arrangement and bought 22.0% shareholding in our subsidiary, Cancare Hospital Proprietary Limited, effective 1 April 2017.
> The Group disposed of 40% shareholding in BMI Syon Clinic Limited (incorporated in the United Kingdom), effective 6 July 2017, and still retains control.
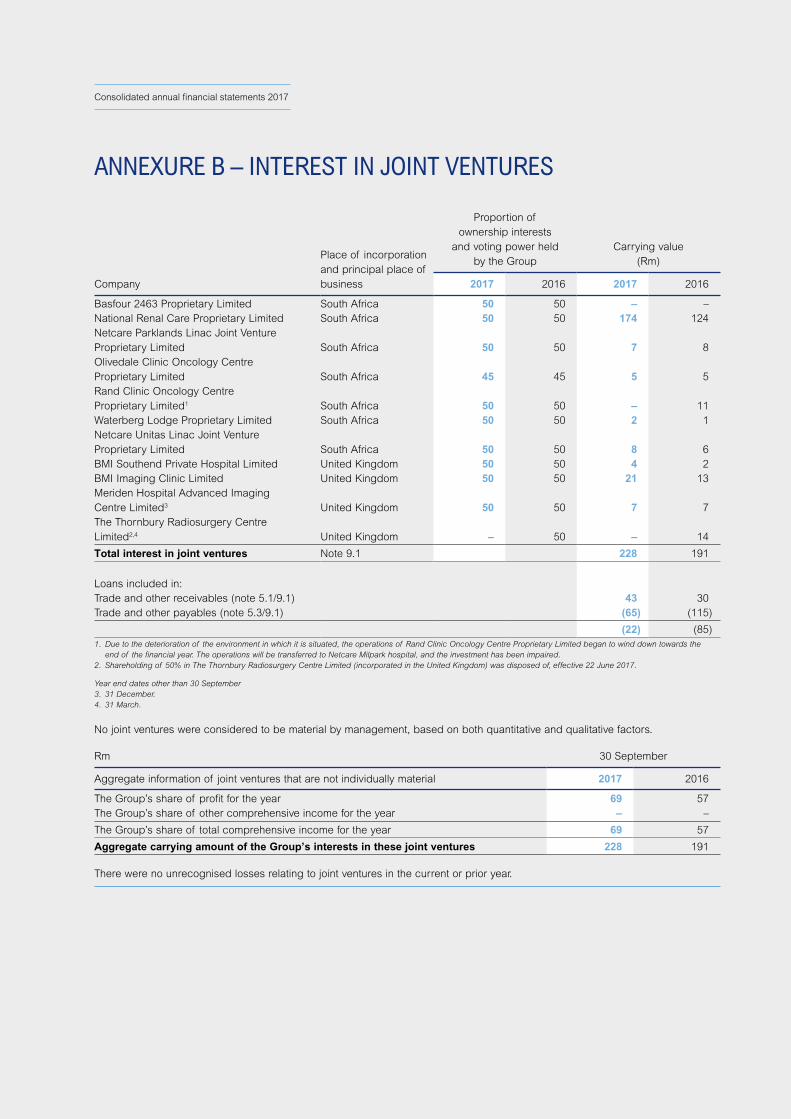
110NETCARE LIMITED
Consolidated annual financial statements 2017
Company
Place of incorporation and principal place of business
Proportion ofownership interests
and voting power heldby the Group
Carrying value (Rm)
2017 2016 2017 2016
Basfour 2463 Proprietary Limited South Africa 50 50 – – National Renal Care Proprietary Limited South Africa 50 50 174 124 Netcare Parklands Linac Joint Venture Proprietary Limited South Africa 50 50 7 8 Olivedale Clinic Oncology Centre Proprietary Limited South Africa 45 45 5 5 Rand Clinic Oncology Centre Proprietary Limited1 South Africa 50 50 – 11 Waterberg Lodge Proprietary Limited South Africa 50 50 2 1 Netcare Unitas Linac Joint Venture Proprietary Limited South Africa 50 50 8 6 BMI Southend Private Hospital Limited United Kingdom 50 50 4 2 BMI Imaging Clinic Limited United Kingdom 50 50 21 13 Meriden Hospital Advanced Imaging Centre Limited3 United Kingdom 50 50 7 7 The Thornbury Radiosurgery Centre Limited2,4 United Kingdom – 50 – 14
Total interest in joint ventures Note 9.1 228 191
Loans included in: Trade and other receivables (note 5.1/9.1) 43 30 Trade and other payables (note 5.3/9.1) (65) (115)
(22) (85) 1. Due to the deterioration of the environment in which it is situated, the operations of Rand Clinic Oncology Centre Proprietary Limited began to wind down towards the
end of the financial year. The operations will be transferred to Netcare Milpark hospital, and the investment has been impaired. 2. Shareholding of 50% in The Thornbury Radiosurgery Centre Limited (incorporated in the United Kingdom) was disposed of, effective 22 June 2017.
Year end dates other than 30 September 3. 31 December.4. 31 March.
No joint ventures were considered to be material by management, based on both quantitative and qualitative factors.
Rm 30 September
Aggregate information of joint ventures that are not individually material 2017 2016
The Group’s share of profit for the year 69 57 The Group’s share of other comprehensive income for the year – –
The Group’s share of total comprehensive income for the year 69 57
Aggregate carrying amount of the Group’s interests in these joint ventures 228 191
There were no unrecognised losses relating to joint ventures in the current or prior year.
ANNEXURE B – INTEREST IN JOINT VENTURES
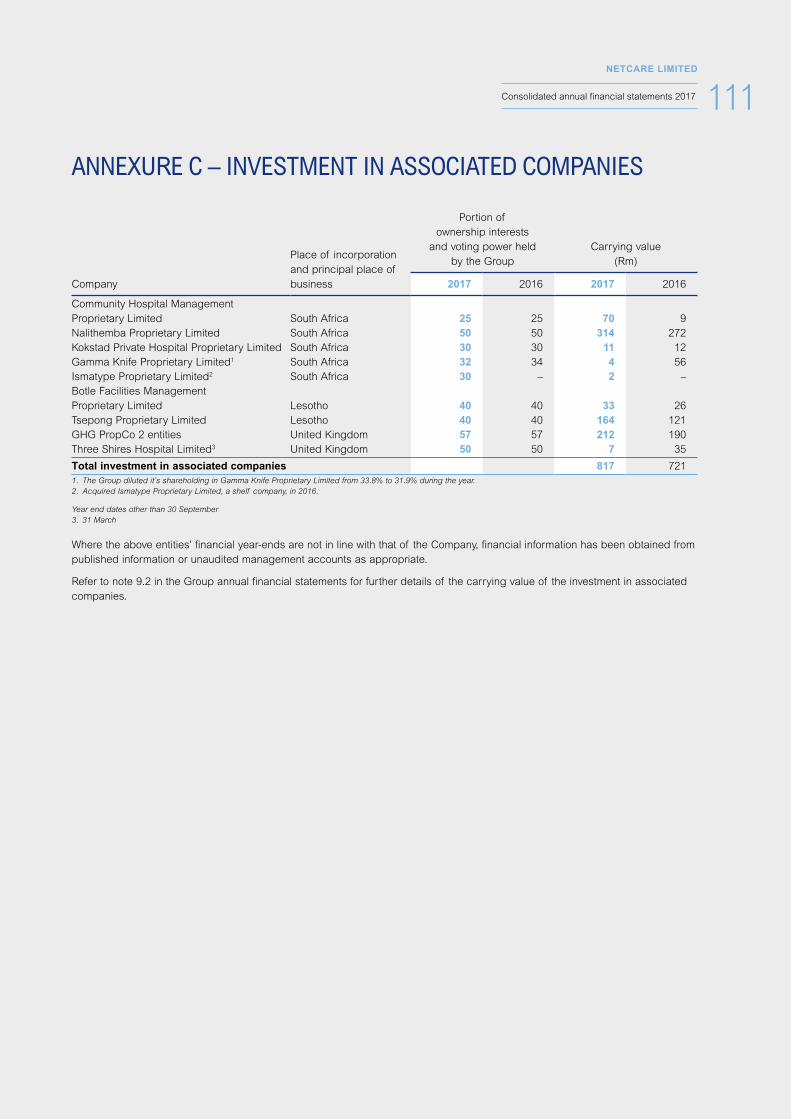
111NETCARE LIMITED
Consolidated annual financial statements 2017
Company
Place of incorporation and principal place of business
Portion ofownership interests
and voting power held by the Group
Carrying value (Rm)
2017 2016 2017 2016
Community Hospital Management Proprietary Limited South Africa 25 25 70 9 Nalithemba Proprietary Limited South Africa 50 50 314 272 Kokstad Private Hospital Proprietary Limited South Africa 30 30 11 12 Gamma Knife Proprietary Limited1 South Africa 32 34 4 56 Ismatype Proprietary Limited2 South Africa 30 – 2 – Botle Facilities Management Proprietary Limited Lesotho 40 40 33 26 Tsepong Proprietary Limited Lesotho 40 40 164 121 GHG PropCo 2 entities United Kingdom 57 57 212 190 Three Shires Hospital Limited3 United Kingdom 50 50 7 35
Total investment in associated companies 817 721 1. The Group diluted it’s shareholding in Gamma Knife Proprietary Limited from 33.8% to 31.9% during the year.2. Acquired Ismatype Proprietary Limited, a shelf company, in 2016.
Year end dates other than 30 September3. 31 March
Where the above entities’ financial year-ends are not in line with that of the Company, financial information has been obtained from published information or unaudited management accounts as appropriate.
Refer to note 9.2 in the Group annual financial statements for further details of the carrying value of the investment in associated companies.
ANNEXURE C – INVESTMENT IN ASSOCIATED COMPANIES
112NETCARE LIMITED
Consolidated annual financial statements 2017
Annexure C – Investment in associated companies continued
Material investment in associates The directors do not consider any of the investments in associates to be quantitatively material to the Group. The total equity accounted earnings for the year amounted to R77 million, and the value of the investment in associates at 30 September 2017 was R817 million.
GHG PropCo 2Based on past events, most notably the deconsolidation of GHG PropCo 2, the directors consider the investment in the entity to be qualitatively material. The entity is relevant to the users of the financial statements due to the specialised hospital assets that they own, the long-term lease obligations pursuant to which BMI Healthcare operates its business, and the secured debt funding attributable to these entities.
There are certain background facts and circumstances applicable to the GHG Property Businesses that require highlighting in order for users of the financial statements to fully understand the relevance of these entities to the Netcare Group. These are set out below.
In 2006, Netcare, together with private equity partners (“the GHG Investors”), acquired the General Healthcare Group (GHG) in the UK.
In 2008, GHG acquired eight additional hospitals from Nuffield (two of these hospital properties were sold in the 2011 financial year). These businesses were separated into two distinct enterprises, being the hospital operating company that was integrated into BMI Healthcare and a series of eight separate property and property holding companies (collectively GHG PropCo 2). The GHG PropCo 2 entities raised third party non-recourse debt under a separate borrowing facility (the GHG PropCo 2 facility) secured by the shares in the eight separate property and property holding companies and by the property asset held by each property company. The GHG PropCo 2 facility is ring-fenced from the BMI Healthcare facility.
The BMI Healthcare facility and the GHG PropCo 2 facility have no recourse to Netcare or any of Netcare’s South African subsidiaries or operations.
During the 2013 financial year, following careful consideration of certain changes and circumstances relating to Netcare’s interest in the GHG Property Businesses, the Netcare Board concluded that it was no longer appropriate to continue consolidating the GHG Property Businesses in Netcare’s Group financial statements.
With effect from 16 November 2012, Netcare has accounted for GHG PropCo 2 as investments in associates, as it still has significant influence over these entities. The information below has been provided to enable the users of the financial statements to obtain an understanding of the financial status of the GHG Property Businesses.
The information has been obtained from the unaudited management accounts as at 30 September 2017.
Name of associatePlace of incorporation and principal place of business Principal activity
Proportion of ownership interests and voting power
held by the Group
20171 20161
GHG PropCo 2 entities2 United Kingdom Property owning 57% 57%1. Netcare’s direct shareholding in these entities is 53.71% (2016: 53.72%). There is an Employee Benefit Trust that holds unallocated equity interests set aside for GHG
management. Netcare is required to consolidate this trust under IFRS10: Consolidated Financial Statements, increasing Netcare’s effective ownership (i.e. direct and indirect interests). When equity interests in the trust are allocated or forfeited, this will have an impact on Netcare’s effective shareholding.
2. Refer to note 9.2 in the Group annual financial statements, for the rationale surrounding accounting for GHG PropCo 2 as an associate even though Netcare holds 57% of the shares (2016: 57%).
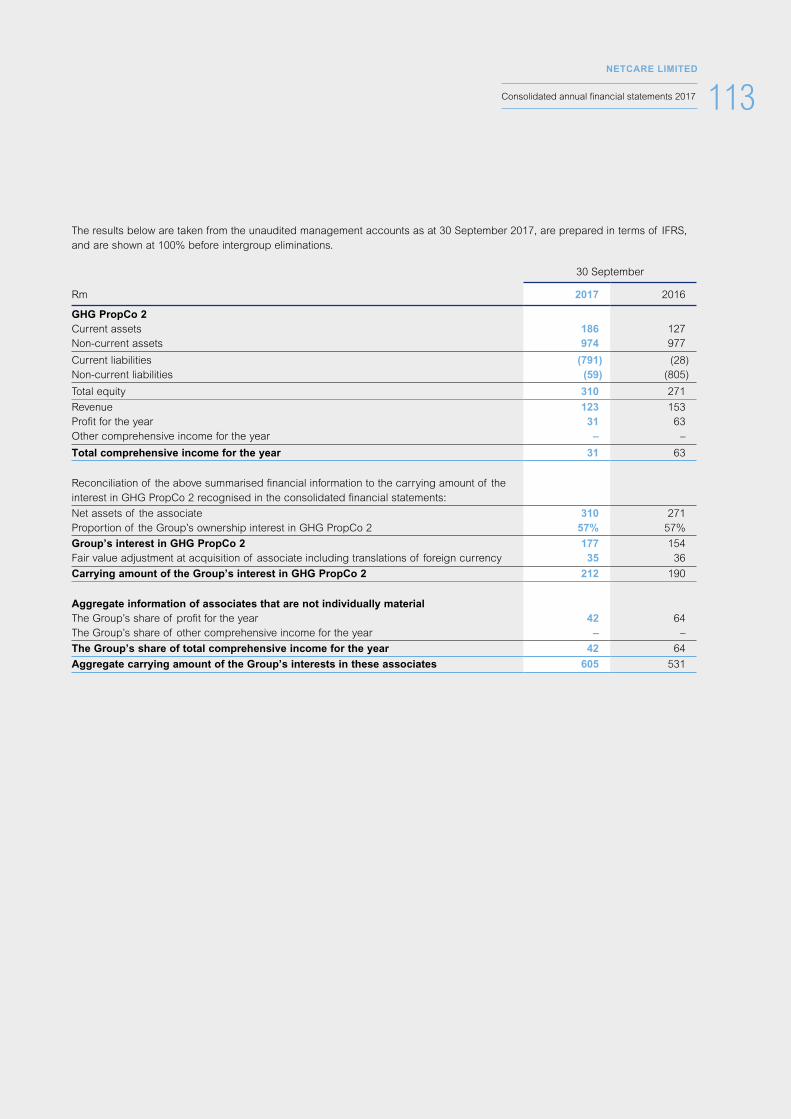
113NETCARE LIMITED
Consolidated annual financial statements 2017
The results below are taken from the unaudited management accounts as at 30 September 2017, are prepared in terms of IFRS, and are shown at 100% before intergroup eliminations.
30 September
Rm 2017 2016
GHG PropCo 2Current assets 186 127 Non-current assets 974 977
Current liabilities (791) (28) Non-current liabilities (59) (805)
Total equity 310 271
Revenue 123 153 Profit for the year 31 63 Other comprehensive income for the year – –
Total comprehensive income for the year 31 63
Reconciliation of the above summarised financial information to the carrying amount of the interest in GHG PropCo 2 recognised in the consolidated financial statements:
Net assets of the associate 310 271 Proportion of the Group’s ownership interest in GHG PropCo 2 57% 57%
Group’s interest in GHG PropCo 2 177 154 Fair value adjustment at acquisition of associate including translations of foreign currency 35 36
Carrying amount of the Group’s interest in GHG PropCo 2 212 190
Aggregate information of associates that are not individually material The Group’s share of profit for the year 42 64 The Group’s share of other comprehensive income for the year – –
The Group’s share of total comprehensive income for the year 42 64
Aggregate carrying amount of the Group’s interests in these associates 605 531

114NETCARE LIMITED
Consolidated annual financial statements 2017
Number of shareholders
Percentage of shareholders
Number of shares
in issue1
Percentage of issued share
capital
Shareholder Spread1 – 1 000 8 918 47.86 2 845 305 0.211 001 – 50 000 8 316 44.62 59 527 415 4.3850 001 – 100 000 378 2.03 27 013 662 1.98100 001 – 10 000 000 1 004 5.39 740 153 261 54.4110 000 001 and above 18 0.10 530 836 757 39.02Total 18 634 99.99 1 360 376 400 100.00 Distribution of shareholders per categoryIndividuals 15 381 82.54 80 890 653 5.95 Private Companies 281 1.51 12 199 201 0.90 Nominees and Trusts 1 130 6.06 26 884 260 1.98 Banks and Brokerage Firms 141 0.76 68 097 233 5.00 Insurance Companies 91 0.49 86 849 660 6.38 Pension Funds and Medical Aid Schemes 616 3.31 425 011 007 31.24 Collective Investment Schemes and Mutual Funds 994 5.33 660 444 386 48.55 Total 18 634 100.00 1 360 376 400 100.00 Public and non-public shareholdingsPublic 18 631 99.98 1 347 665 400 99.07 Non-public 3 0.02 12 711 000 0.93
Directors2 2 0.01 10 628 234 0.78 Retirement funds 1 0.01 2 082 766 0.15
Total 18 634 100.00 1 360 376 400 100.00 Beneficial shareholders holding 5% or morePublic Investment Corporation Limited 231 642 340 17.03 Allan Gray various funds 124 034 091 9.12 Total 355 676 431 26.15 Investment Manager Top 10 Allan Gray Proprietary Limited 222 672 835 16.37 Public Investment Corporation Group 182 828 418 13.44 Coronation Fund Managers Limited 106 550 108 7.83 Old Mutual plc 98 072 174 7.21 GIC Private Limited 56 904 946 4.18 The Vanguard Group, Inc. 52 894 895 3.89Prudential plc 49 346 196 3.63 Sanlam Limited 43 490 830 3.20 Visio Capital Management Proprietary Limited 41 399 997 3.04 BlackRock, Inc. 38 909 936 2.86 Total 893 070 335 65.65 Beneficial Owner Top 10 Public Investment Corporation Limited 231 642 340 17.03 Allan Gray Balanced Fund 58 231 738 4.28 GIC Private Limited 57 828 946 4.25Old Mutual Life Assurance Company SA 48 088 225 3.53 Alexander Forbes Investments 34 821 877 2.56 Allan Gray Equity Fund 29 955 312 2.20 Vanguard Emerging Markets Stock Index Fund (US) 27 646 994 2.03Government of Norway 23 916 722 1.76 Coronation Top 20 Fund 19 396 525 1.43 Vanguard Total International Stock Index Fund 18 611 350 1.37 Total 550 140 029 40.44Geographic Ownership South Africa 999 491 294 73.47 International 360 885 106 26.53 Total 1 360 376 400 100.001. Number of shares in issue net of treasury shares. 2. Beneficial shareholding of directors in the issued share capital of the Company.
ANNEXURE D – ANALYSIS OF SHAREHOLDERS
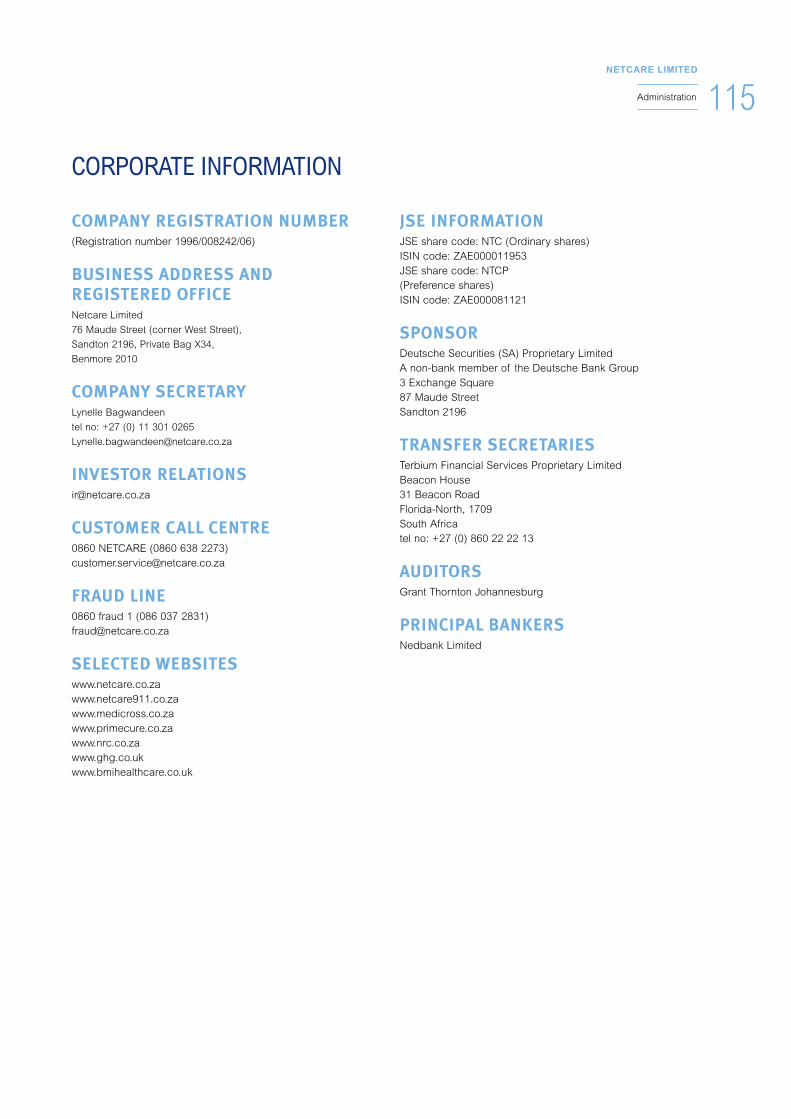
115NETCARE LIMITED
Administration
CORPORATE INFORMATION
COMPANY REGISTRATION NUMBER (Registration number 1996/008242/06)
BUSINESS ADDRESS AND REGISTERED OFFICENetcare Limited
76 Maude Street (corner West Street),
Sandton 2196, Private Bag X34,
Benmore 2010
COMPANY SECRETARYLynelle Bagwandeen
tel no: +27 (0) 11 301 0265
INVESTOR [email protected]
CUSTOMER CALL CENTRE0860 NETCARE (0860 638 2273) [email protected]
FRAUD LINE0860 fraud 1 (086 037 2831) [email protected]
SELECTED WEBSITESwww.netcare.co.za www.netcare911.co.za www.medicross.co.za www.primecure.co.za www.nrc.co.za www.ghg.co.uk www.bmihealthcare.co.uk
JSE INFORMATIONJSE share code: NTC (Ordinary shares) ISIN code: ZAE000011953 JSE share code: NTCP (Preference shares) ISIN code: ZAE000081121
SPONSORDeutsche Securities (SA) Proprietary Limited A non-bank member of the Deutsche Bank Group 3 Exchange Square 87 Maude Street Sandton 2196
TRANSFER SECRETARIESTerbium Financial Services Proprietary LimitedBeacon House31 Beacon RoadFlorida-North, 1709South Africatel no: +27 (0) 860 22 22 13
AUDITORSGrant Thornton Johannesburg
PRINCIPAL BANKERSNedbank Limited
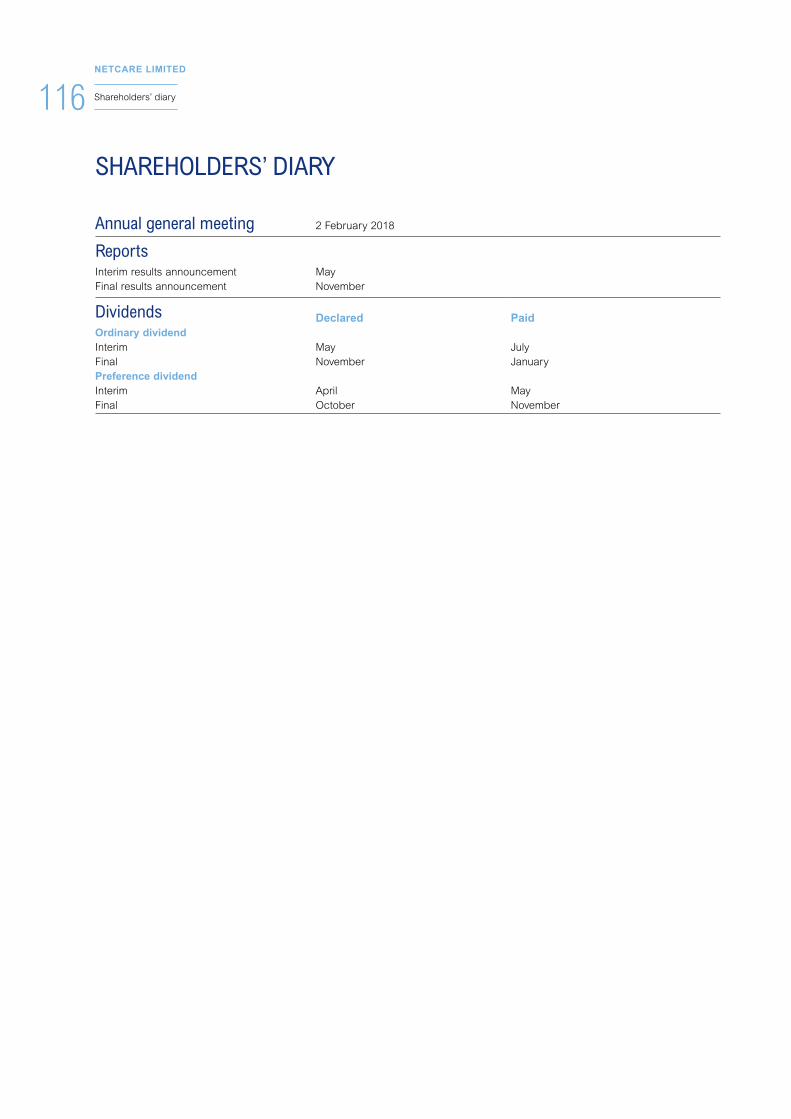
116NETCARE LIMITED
Shareholders’ diary
SHAREHOLDERS’ DIARY
Annual general meeting 2 February 2018
ReportsInterim results announcement MayFinal results announcement November
Dividends Declared PaidOrdinary dividendInterim May JulyFinal November JanuaryPreference dividendInterim April MayFinal October November

Certain statements in this document constitute ‘forward-looking statements’. Forward-looking statements may be identified by words such as ‘believe’, ‘anticipate’, ‘expect’, ‘plan’, ‘estimate’, ‘intend’, ‘project’, ‘target’, ‘predict’ and ‘hope’. By their nature, forward-looking statements are inherently predictive, speculative and involve risk and uncertainty because they relate to events and depend on circumstances that will occur in the future, involve known and unknown risks, uncertainties and other facts or factors which may cause the actual results, performance or achievements of the Group, or the healthcare sector to be materially different from any results, performance or achievement expressed or implied by such forward-looking statements. Forward-looking statements are not guarantees of future performance and are based on assumptions regarding the Group’s present and future business strategies and the environments in which it operates now and in the future. No assurance can be given that forward-looking statements will prove to be correct and undue reliance should not be placed on such statements.
Any forward-looking information contained in this announcement/presentation has not been reviewed or reported on by the company’s external auditors.
Forward-looking statements apply only as of the date on which they are made, and Netcare does not undertake other than in terms of the Listings Requirements of the JSE Limited, to update or revise any statement, whether as a result of new information, future events or otherwise.
DISCLAIMER