
NETA POWERPOINT PRESENTATIONS TO ACCOMPANY VOLUME 2 Accounting Second Canadian Edition BY...
119
NETA POWERPOINT PRESENTATIONS TO ACCOMPANY VOLUME 2 Accounting Second Canadian Edition BY WARREN/REEVE/DUCHAC/ELWORTHY/KRISTJANSON/TO BER Adapted by Sheila Elworthy and Tana Kristjanson Copyright © 2014 by Nelson Education Ltd. 1
-
Upload
loren-marjorie-fields -
Category
Documents
-
view
244 -
download
2
Transcript of NETA POWERPOINT PRESENTATIONS TO ACCOMPANY VOLUME 2 Accounting Second Canadian Edition BY...
NETA POWERPOINT PRESENTATIONS TO ACCOMPANY
VOLUME 2
Accounting Second Canadian Edition
BY WARREN/REEVE/DUCHAC/ELWORTHY/KRISTJANSON/TOBER
Adapted by Sheila Elworthy and Tana Kristjanson
Copyright © 2014 by Nelson Education Ltd. 1
CHAPTER 17
Financial Statement Analysis
Copyright © 2014 by Nelson Education Ltd. 2

After studying this chapter, you should be able to:
1. Describe basic financial statement analytical methods.
2. Use ratio analysis to assess the liquidity of a business.
3. Use ratio analysis to assess the efficiency of a business.
Financial Statement Analysis
Copyright © 2014 by Nelson Education Ltd. 3

After studying this chapter, you should be able to:
4. Use ratio analysis to assess the solvency of a business.
5. Use ratio analysis to assess the profitability of a business.
6. Describe the contents of corporate annual reports.
Financial Statement Analysis
Copyright © 2014 by Nelson Education Ltd. 4

Describe basic financial statement analytical methods.
1
Copyright © 2014 by Nelson Education Ltd. 5
Basic Analytical Methods
Users analyze a company’s financial statements using a variety of analytical methods. Three such methods are as follows:1.Horizontal analysis2.Vertical analysis3.Common-sized statements4.Ratio analysis
Copyright © 2014 by Nelson Education Ltd. 6
Horizontal Analysis
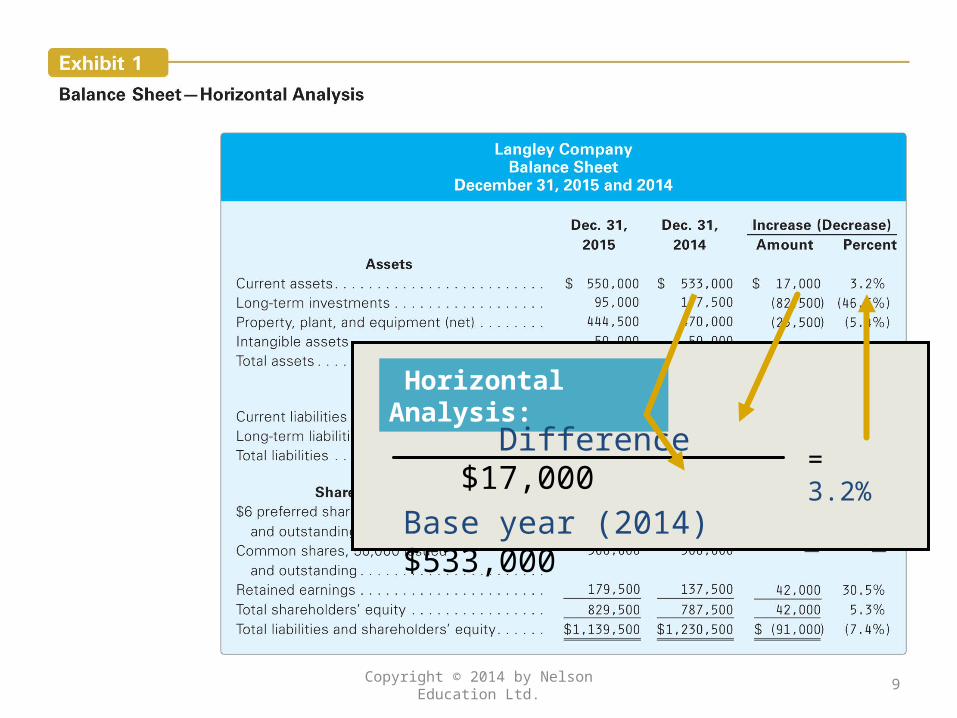
The percentage analysis of increases and decreases in related items using comparative financial statements is called horizontal analysis.
Copyright © 2014 by Nelson Education Ltd. 7

Copyright © 2014 by Nelson Education Ltd. 8
Copyright © 2014 by Nelson Education Ltd. 9
Horizontal Analysis:
Difference $17,000Base year (2014) $533,000
= 3.2%

Copyright © 2014 by Nelson Education Ltd. 10
Copyright © 2014 by Nelson Education Ltd. 11
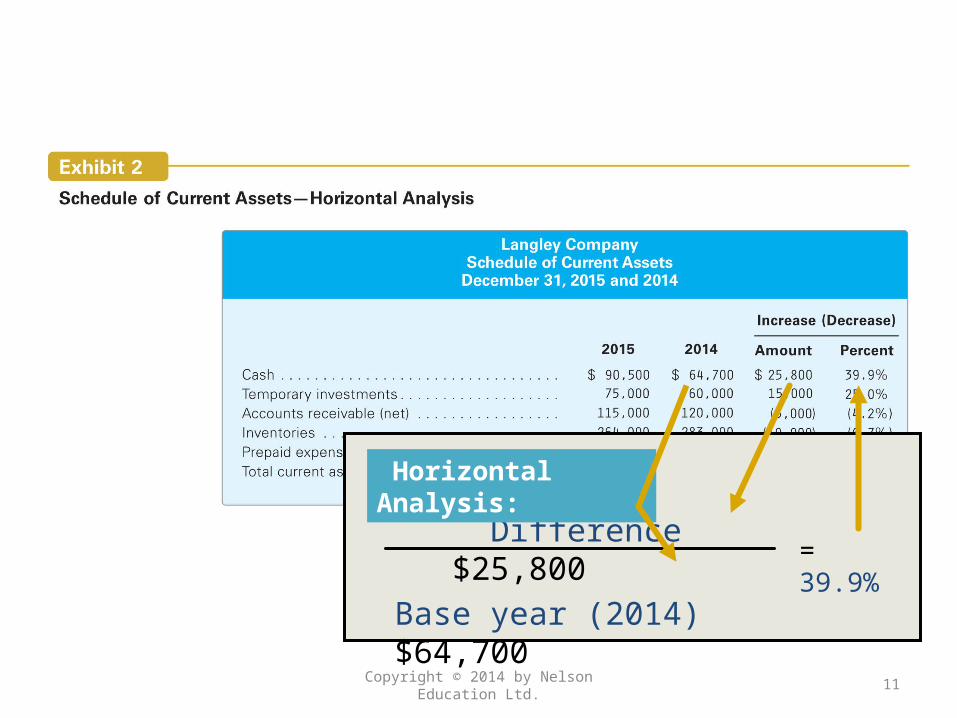
Difference $25,800Base year (2014) $64,700
= 39.9%
Horizontal Analysis:

Copyright © 2014 by Nelson Education Ltd. 12

Copyright © 2014 by Nelson Education Ltd. 13
Difference $296,500Base year (2014) $1,234,000
= 24.0%
Horizontal Analysis:
EXAMPLE EXERCISE 17-1
Horizontal Analysis
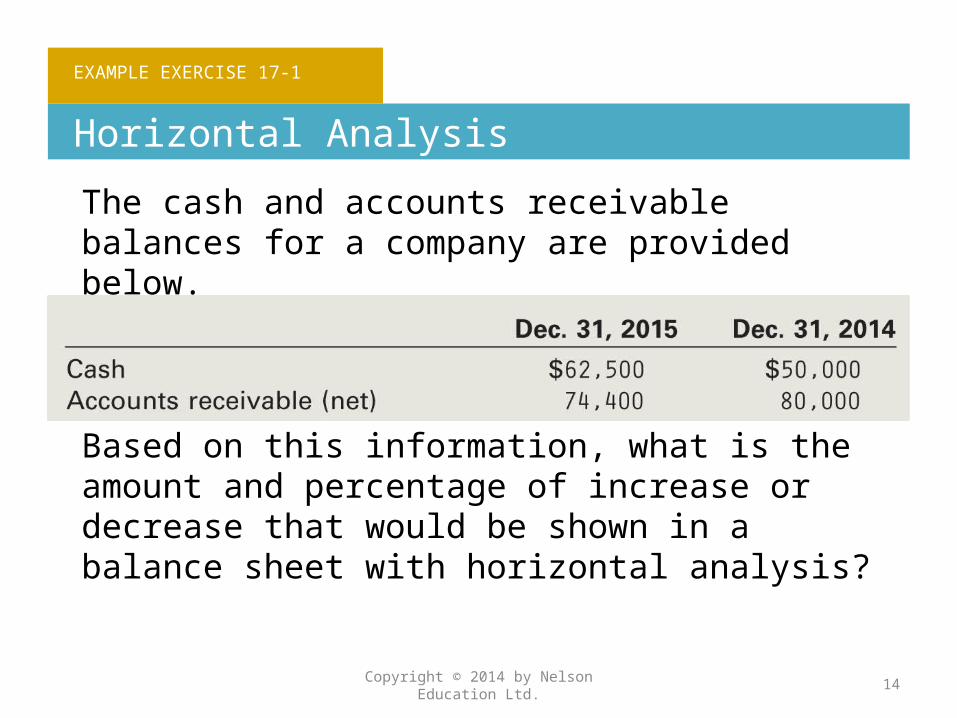
The cash and accounts receivable balances for a company are provided below.
Based on this information, what is the amount and percentage of increase or decrease that would be shown in a balance sheet with horizontal analysis?
Copyright © 2014 by Nelson Education Ltd. 14
FOLLOW MY EXAMPLE 17-1
Horizontal Analysis
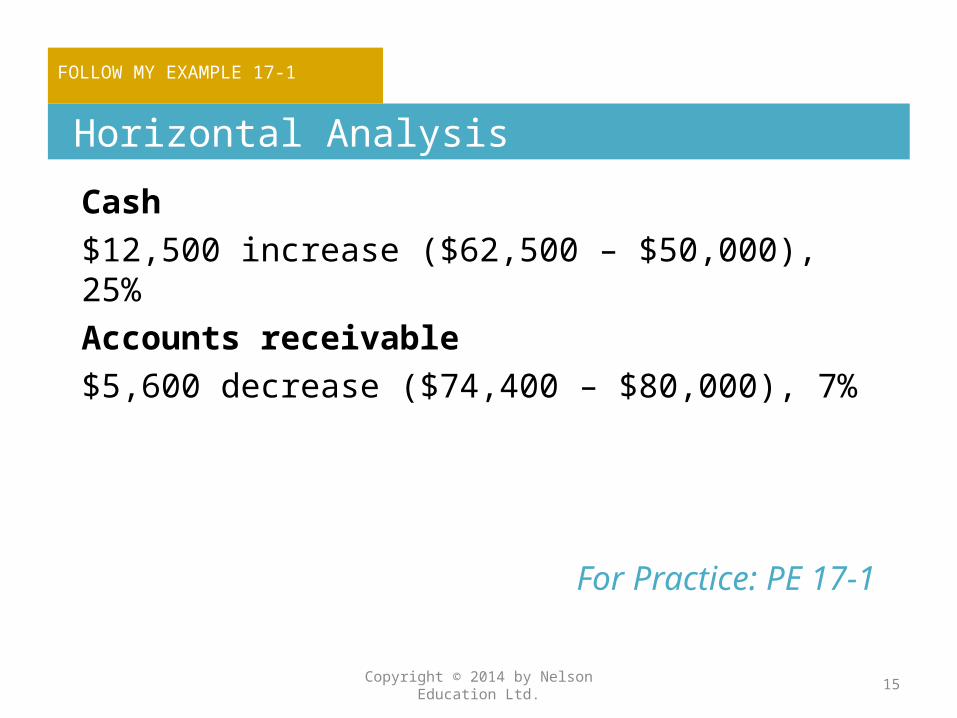
Cash $12,500 increase ($62,500 – $50,000), 25%Accounts receivable $5,600 decrease ($74,400 – $80,000), 7%
For Practice: PE 17-1
Copyright © 2014 by Nelson Education Ltd. 15

Vertical Analysis
A percentage analysis used to show the relationship of each component to the total within a single statement is called vertical analysis.
Copyright © 2014 by Nelson Education Ltd. 16
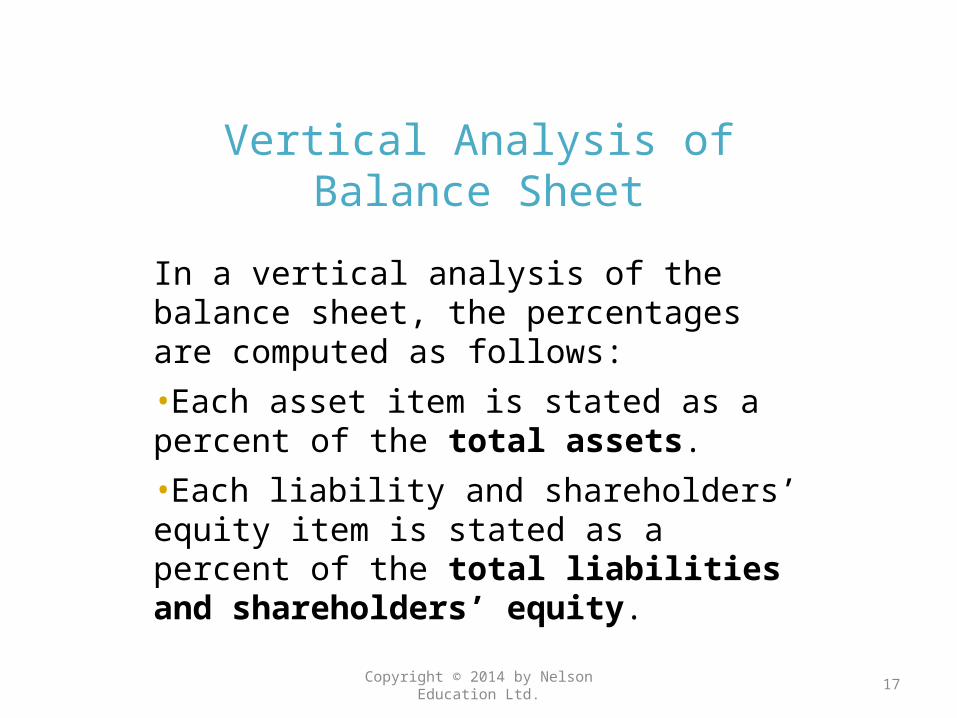
Vertical Analysis of Balance Sheet
In a vertical analysis of the balance sheet, the percentages are computed as follows:•Each asset item is stated as a percent of the total assets. •Each liability and shareholders’ equity item is stated as a percent of the total liabilities and shareholders’ equity.
Copyright © 2014 by Nelson Education Ltd. 17
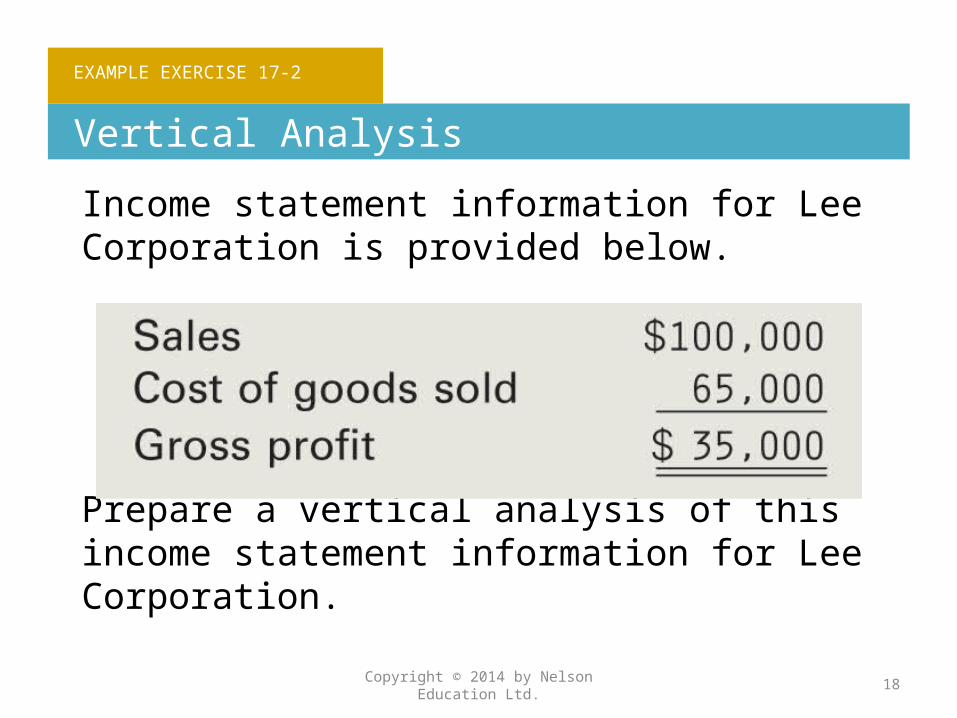
EXAMPLE EXERCISE 17-2
Vertical Analysis
Income statement information for Lee Corporation is provided below.
Prepare a vertical analysis of this income statement information for Lee Corporation.
Copyright © 2014 by Nelson Education Ltd. 18

FOLLOW MY EXAMPLE 17-2
Vertical Analysis
Copyright © 2014 by Nelson Education Ltd. 19
For Practice: PE 17-2

Copyright © 2014 by Nelson Education Ltd. 20
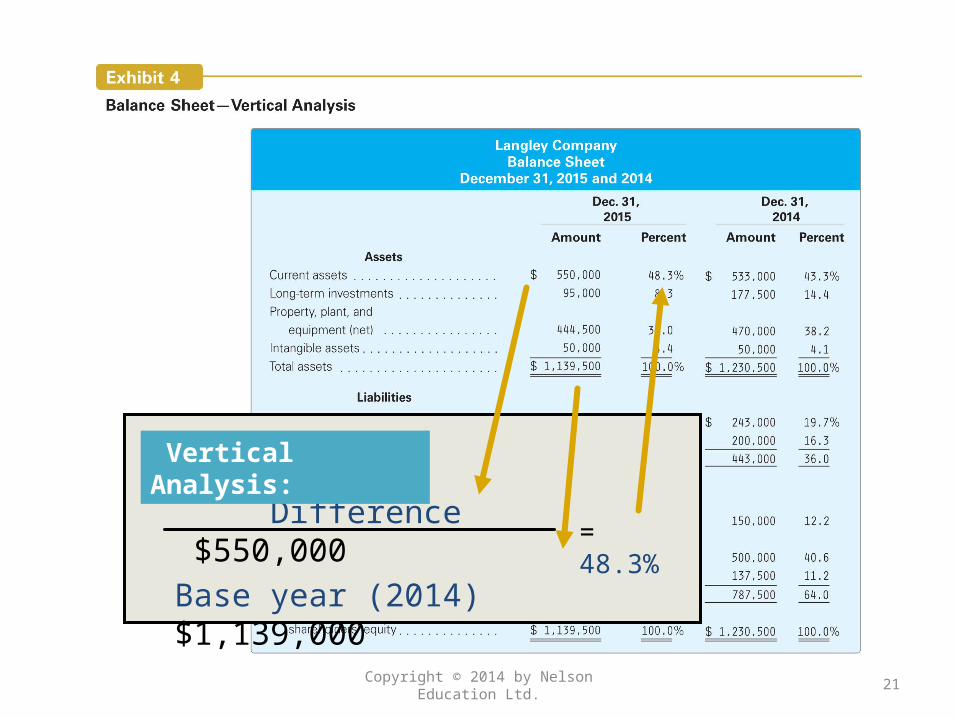
Copyright © 2014 by Nelson Education Ltd. 21
Difference $550,000Base year (2014) $1,139,000
= 48.3%
Vertical Analysis:
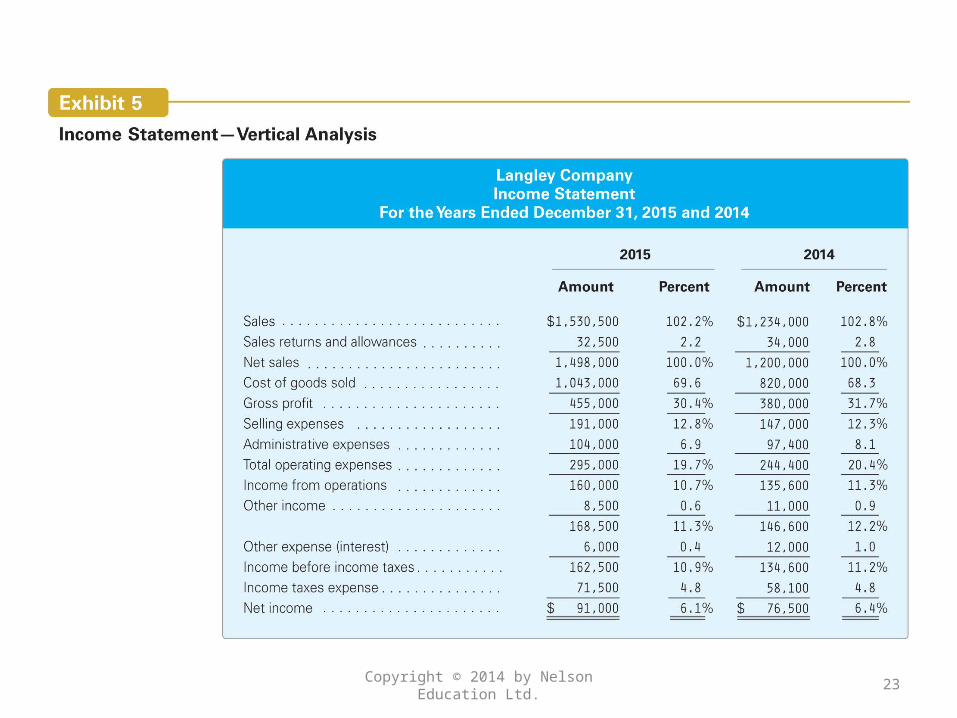
Vertical Analysis of the Income Statement
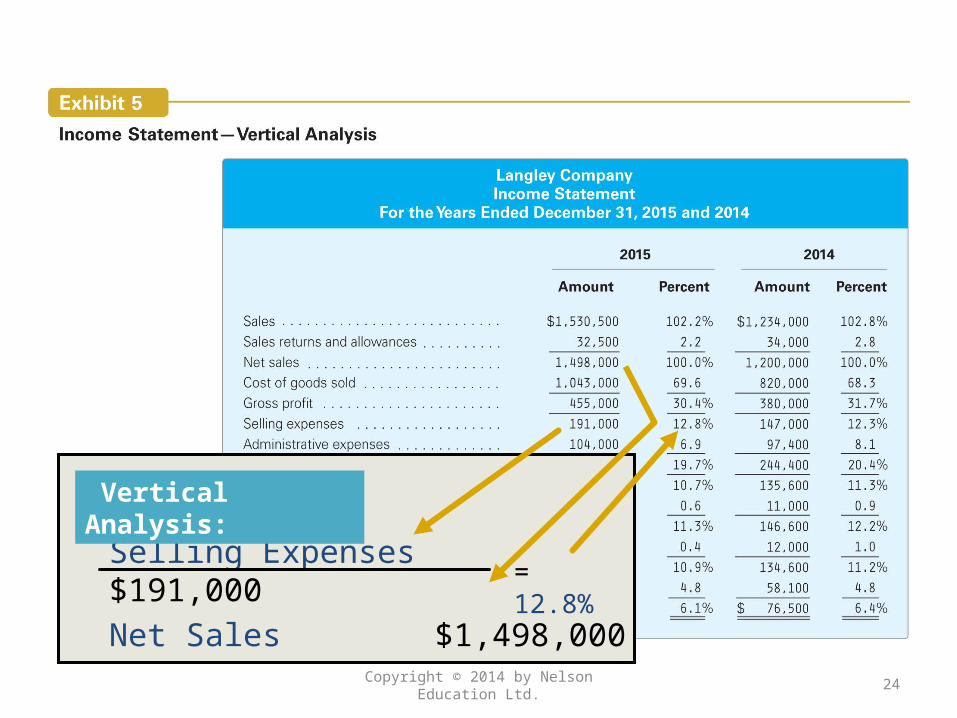
In a vertical analysis of the income statement, each item is stated as a percent of net sales.
Copyright © 2014 by Nelson Education Ltd. 22
Copyright © 2014 by Nelson Education Ltd. 23
Copyright © 2014 by Nelson Education Ltd. 24
Selling Expenses $191,000Net Sales $1,498,000
= 12.8%
Vertical Analysis:

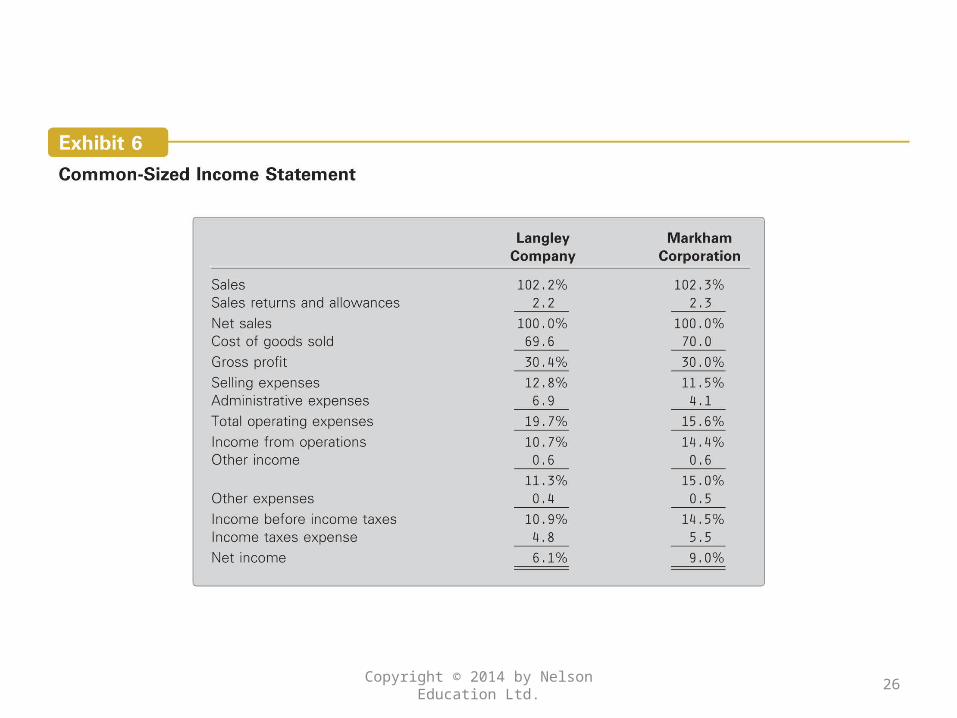
Common-Size Statements
In a common-sized statement, a presentation form of vertical analysis, all items are expressed as a percentage. Common-sized statements are useful for comparing one company with another or for comparing a company with industry averages.
Copyright © 2014 by Nelson Education Ltd. 25
Copyright © 2014 by Nelson Education Ltd. 26
Ratio Analysis
Users of financial statements are interested in the ability of a company to do the following:•Meet its short-term financial obligations (debts), known as liquidity.•Use its assets to the best of its ability, known as efficiency.
Copyright © 2014 by Nelson Education Ltd. 27
Ratio Analysis
• Meet its long-term financial obligations (debts), or solvency.
• Earn income, known as profitability. Ratio analysis helps provide this
information.
Copyright © 2014 by Nelson Education Ltd. 28
The Langley Company financial statements presented earlier are used to illustrate the following ratio analyses.
Copyright © 2014 by Nelson Education Ltd. 29

Use ratio analysis to assess the liquidity of a business.
2
Copyright © 2014 by Nelson Education Ltd. 30

Liquidity Analysis
Evaluating a company’s ability to pay its current liabilities is called liquidity analysis.
Copyright © 2014 by Nelson Education Ltd. 31
Liquidity Analysis
Such analysis is of special interest to short-term creditors and includes the following:•Working capital•Current ratio•Quick ratio
Copyright © 2014 by Nelson Education Ltd. 32
Working Capital
Working Capital = Current Assets – Current Liabilities
The excess of current assets of a business over its current liabilities is called working capital.
The working capital is often used in evaluating a company’s ability to pay current liabilities.
Copyright © 2014 by Nelson Education Ltd. 33

The working capital for Langley Company is computed below:
Copyright © 2014 by Nelson Education Ltd. 34
2015 2014Current assets $550,000 $533,000Current liabilities –210,000 –243,000Working capital $340,000 $290,000
Working Capital = Current Assets – Current Liabilities
Current Ratio
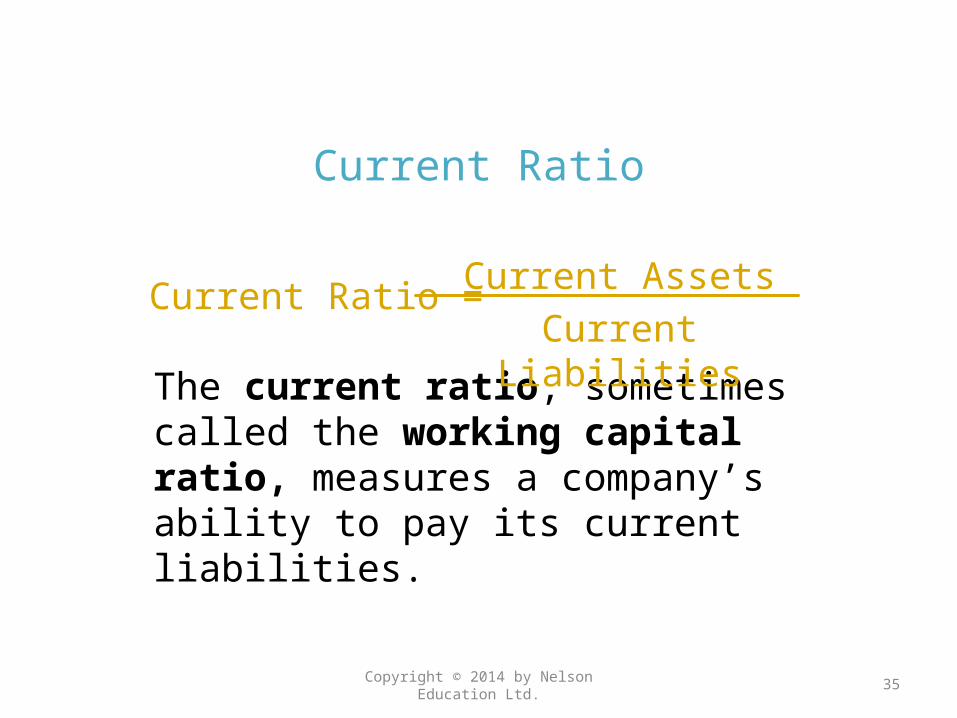
The current ratio, sometimes called the working capital ratio, measures a company’s ability to pay its current liabilities.
Copyright © 2014 by Nelson Education Ltd. 35
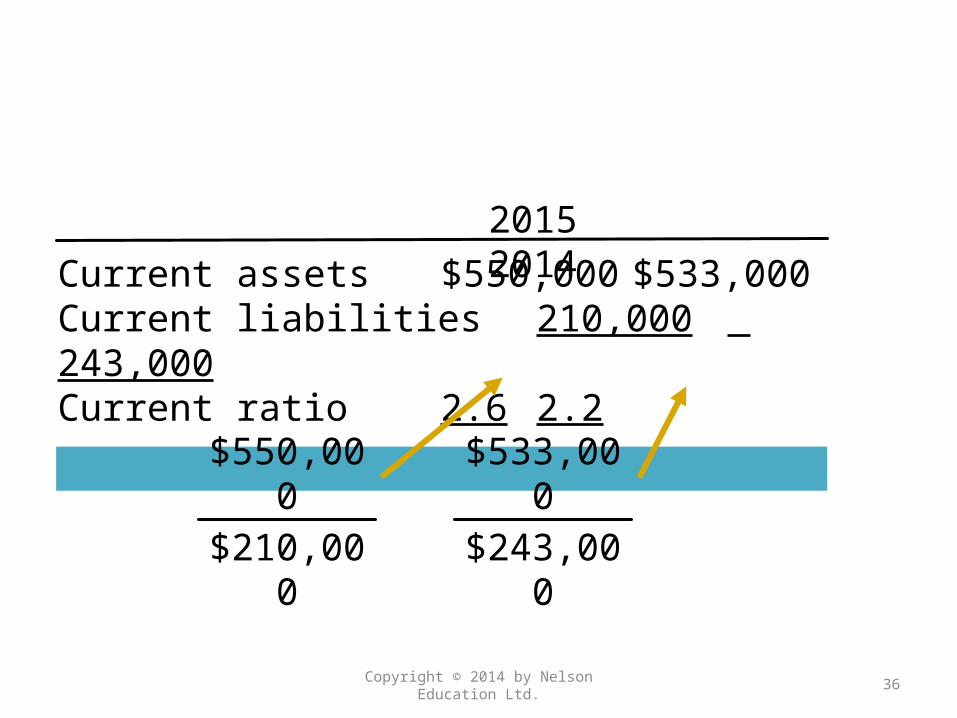
Current Ratio = Current AssetsCurrent Liabilities
Copyright © 2014 by Nelson Education Ltd. 36
2015 2014Current assets $550,000 $533,000Current liabilities 210,000 243,000Current ratio 2.6 2.2
$550,000$210,000
$533,000$243,000
Quick Ratio
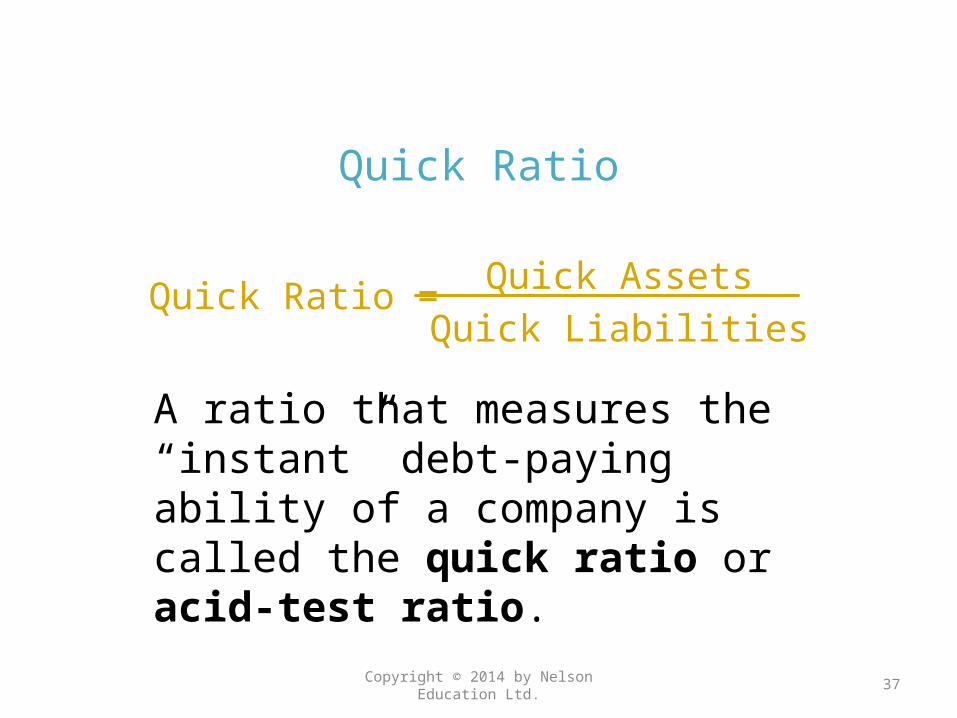
A ratio that measures the “instant” debt-paying ability of a company is called the quick ratio or acid-test ratio.
Copyright © 2014 by Nelson Education Ltd. 37
Quick Ratio = Quick AssetsQuick Liabilities
Copyright © 2014 by Nelson Education Ltd. 38
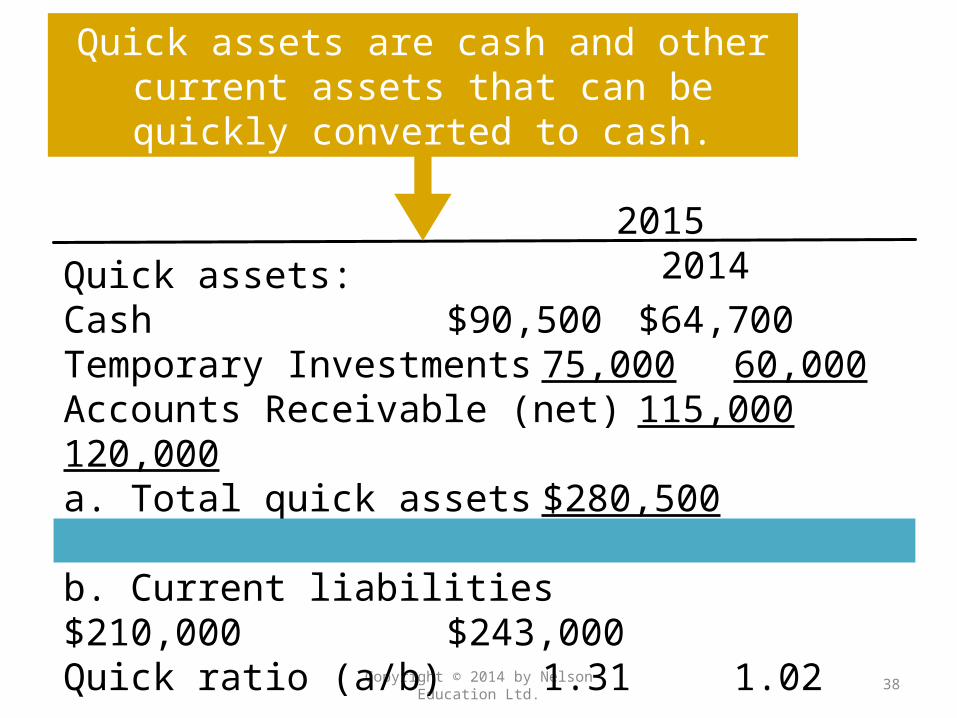
2015 2014Quick assets:Cash $90,500 $64,700Temporary Investments 75,000 60,000Accounts Receivable (net) 115,000 120,000a. Total quick assets $280,500 $244,700 b. Current liabilities $210,000 $243,000Quick ratio (a/b) 1.31 1.02
Quick assets are cash and other current assets that can be quickly converted to cash.

EXAMPLE EXERCISE 17-3
Liquidity Analysis
The following items are reported on a company’s balance sheet:
Cash $300,000Temporary investments 100,000Accounts receivable (net) 200,000Inventories 200,000Accounts payable 400,000
Determine (a) the current ratio and (b) the quick ratio.
Copyright © 2014 by Nelson Education Ltd. 39
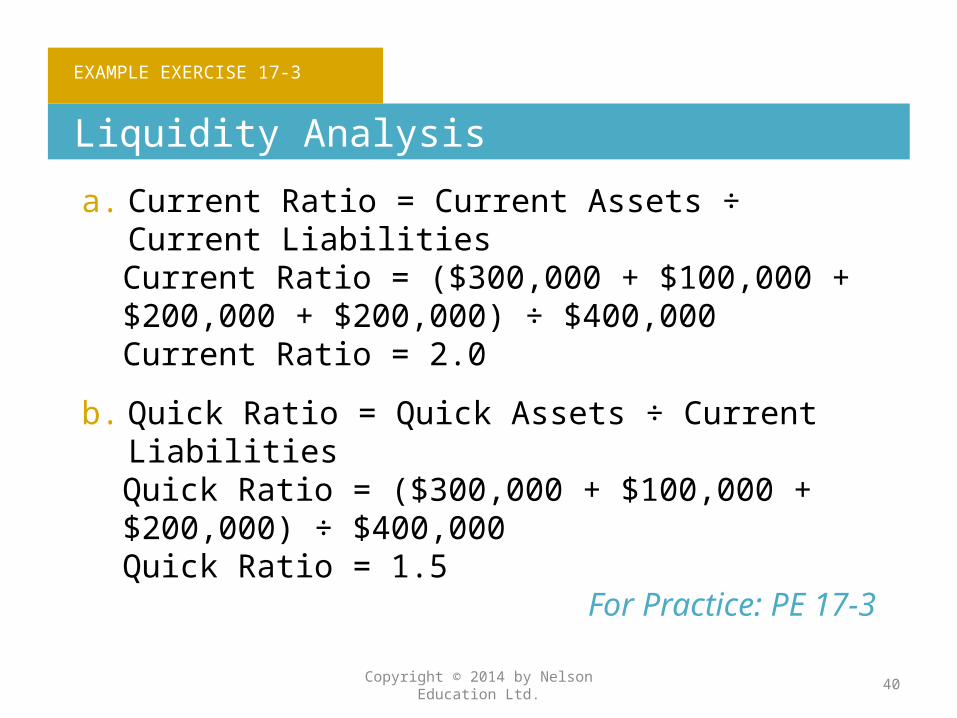
EXAMPLE EXERCISE 17-3
Liquidity Analysis
Copyright © 2014 by Nelson Education Ltd. 40
a. Current Ratio = Current Assets ÷ Current LiabilitiesCurrent Ratio = ($300,000 + $100,000 + $200,000 + $200,000) ÷ $400,000Current Ratio = 2.0
b. Quick Ratio = Quick Assets ÷ Current LiabilitiesQuick Ratio = ($300,000 + $100,000 + $200,000) ÷ $400,000Quick Ratio = 1.5
For Practice: PE 17-3
Use ratio analysis to assess the efficiency of a business.
3
Copyright © 2014 by Nelson Education Ltd. 41
Efficiency Analysis
Efficiency ratios focus on the ability of a business to use its assets efficiently. The following ratios are included in this analysis:
Copyright © 2014 by Nelson Education Ltd. 42
Efficiency Analysis
• Accounts receivable turnover• Days’ sales in receivables• Inventory turnover• Days’ sales in inventory• Total asset turnover
Copyright © 2014 by Nelson Education Ltd. 43
Accounts Receivable
Analysis
Inventory Analysis

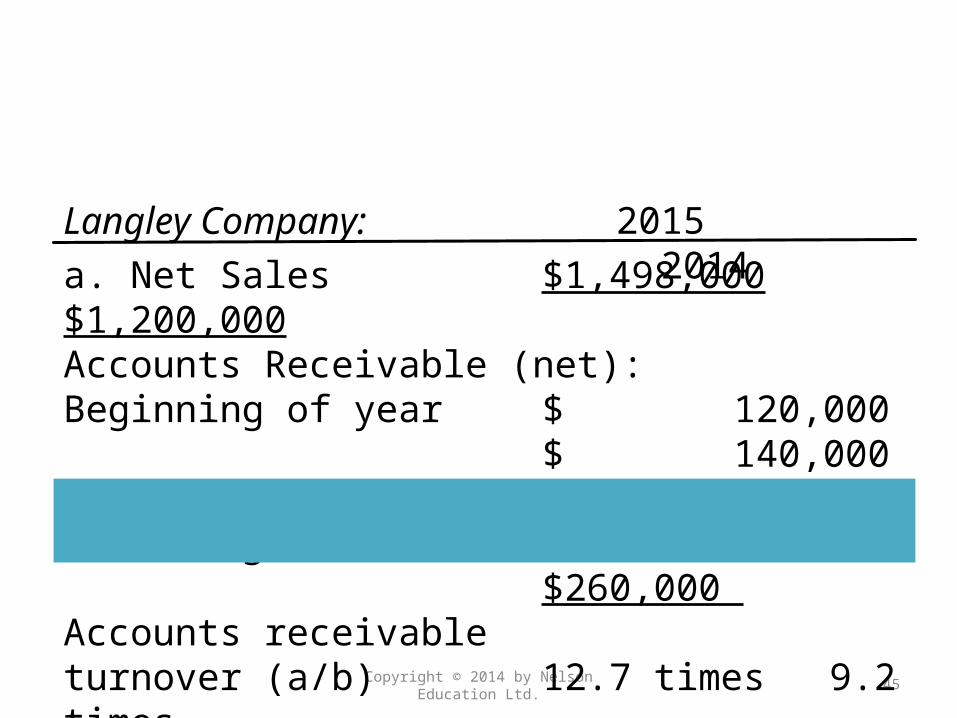
Accounts Receivable Turnover
The relationship between sales and accounts receivable may be stated as the accounts receivable turnover.
Collecting accounts receivable as quickly as possible improves a company’s liquidity.
Copyright © 2014 by Nelson Education Ltd. 44
Accounts Receivable Turnover
Net Sales
Average Net Accounts Receivable
=
Copyright © 2014 by Nelson Education Ltd. 45
2015 2014a. Net Sales $1,498,000 $1,200,000Accounts Receivable (net):Beginning of year $ 120,000
$ 140,000End of year 115,000 120,000b. Average (Total/2) $ 235,000
$260,000 Accounts receivable turnover (a/b) 12.7 times 9.2 times
Langley Company:

Days’ Sales in Receivables
The days’ sales in receivables is an estimate of the length of time (in days) the accounts receivable have been outstanding.
Copyright © 2014 by Nelson Education Ltd. 46
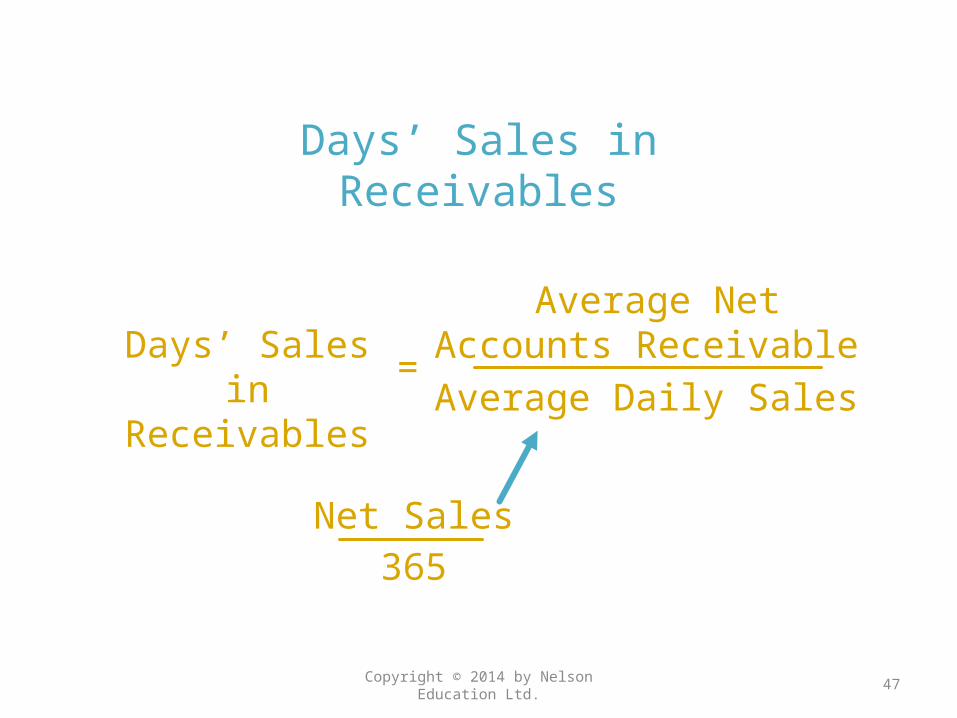
Days’ Sales in Receivables
Average Net Accounts Receivable
Average Daily Sales=
Days’ Sales in Receivables
Copyright © 2014 by Nelson Education Ltd. 47
Net Sales365

Copyright © 2014 by Nelson Education Ltd. 48
2015 2014a. Average accounts receivable (net)(Total accounts
receivable/2) $117,500 $
130,000Net sales $1,498,000 $1,200,000b. Average daily sales(Sales/365) $ 4,104 $
3,288Days’ sales in Receivables (a/b) 28.6 days 39.5 days
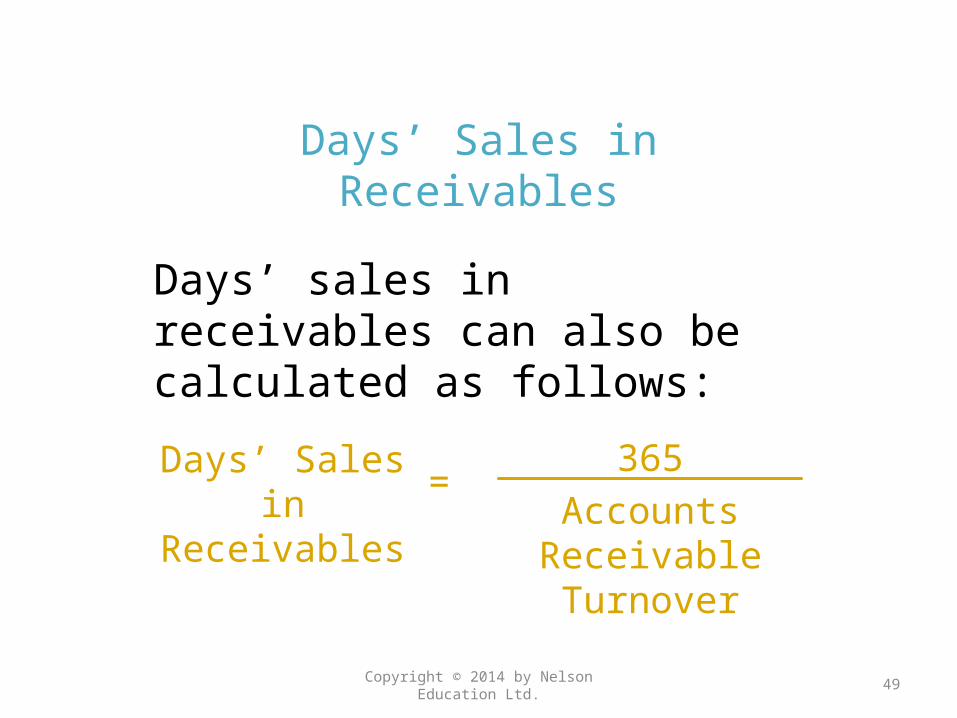
Days’ Sales in Receivables
Days’ sales in receivables can also be calculated as follows:
Copyright © 2014 by Nelson Education Ltd. 49
Days’ Sales in Receivables
365Accounts Receivable
Turnover
=
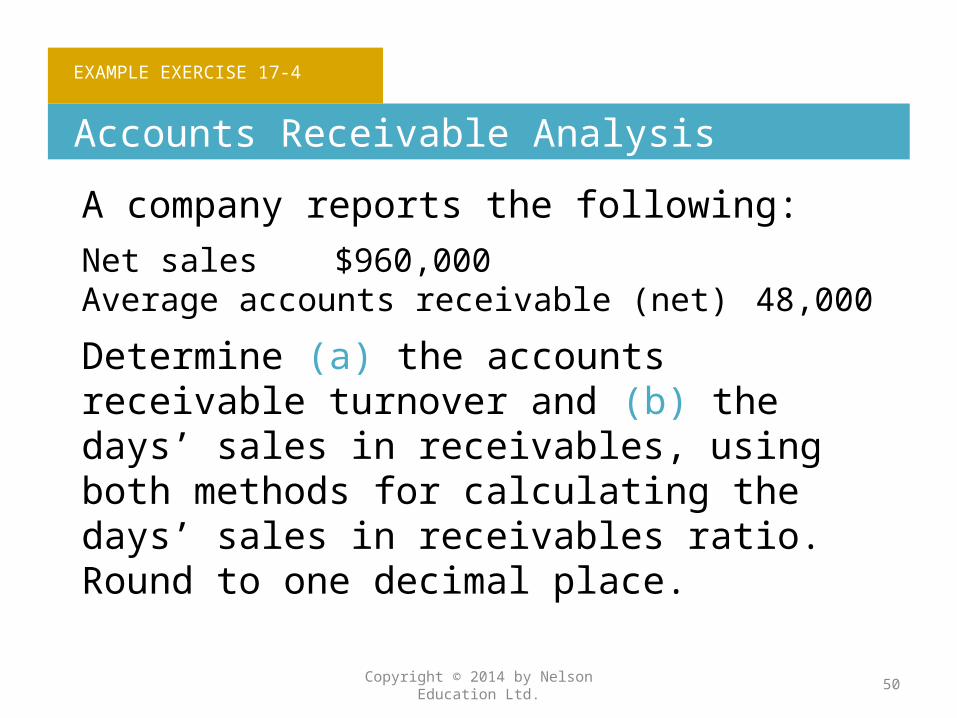
EXAMPLE EXERCISE 17-4
Accounts Receivable Analysis
A company reports the following:Net sales $960,000Average accounts receivable (net) 48,000
Determine (a) the accounts receivable turnover and (b) the days’ sales in receivables, using both methods for calculating the days’ sales in receivables ratio. Round to one decimal place.
Copyright © 2014 by Nelson Education Ltd. 50
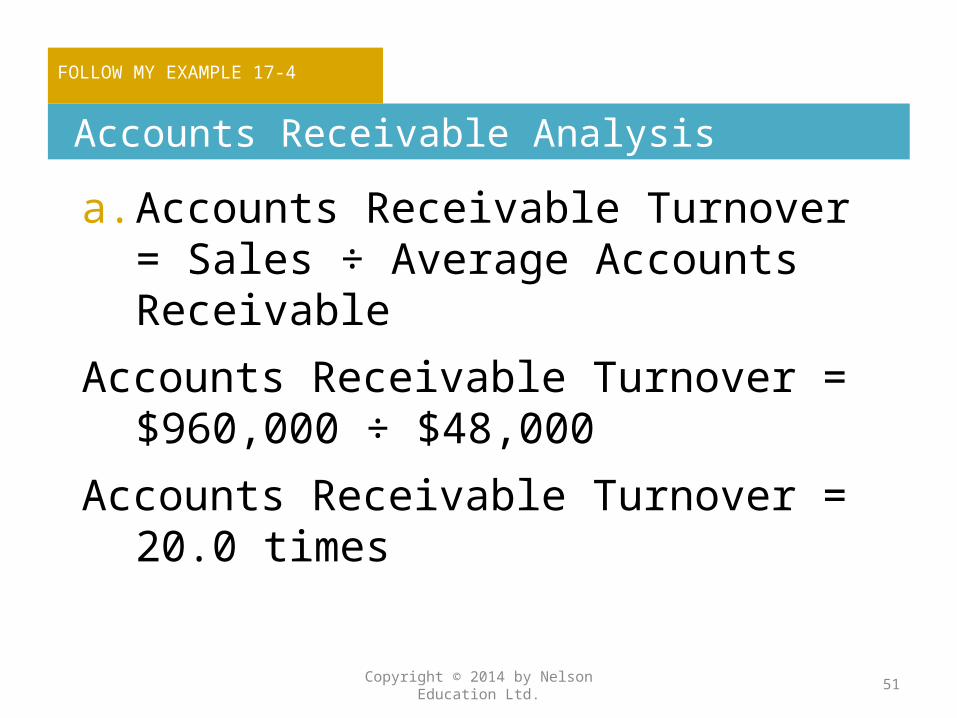
FOLLOW MY EXAMPLE 17-4
Accounts Receivable Analysis
a. Accounts Receivable Turnover = Sales ÷ Average Accounts Receivable
Accounts Receivable Turnover = $960,000 ÷ $48,000
Accounts Receivable Turnover = 20.0 times
Copyright © 2014 by Nelson Education Ltd. 51
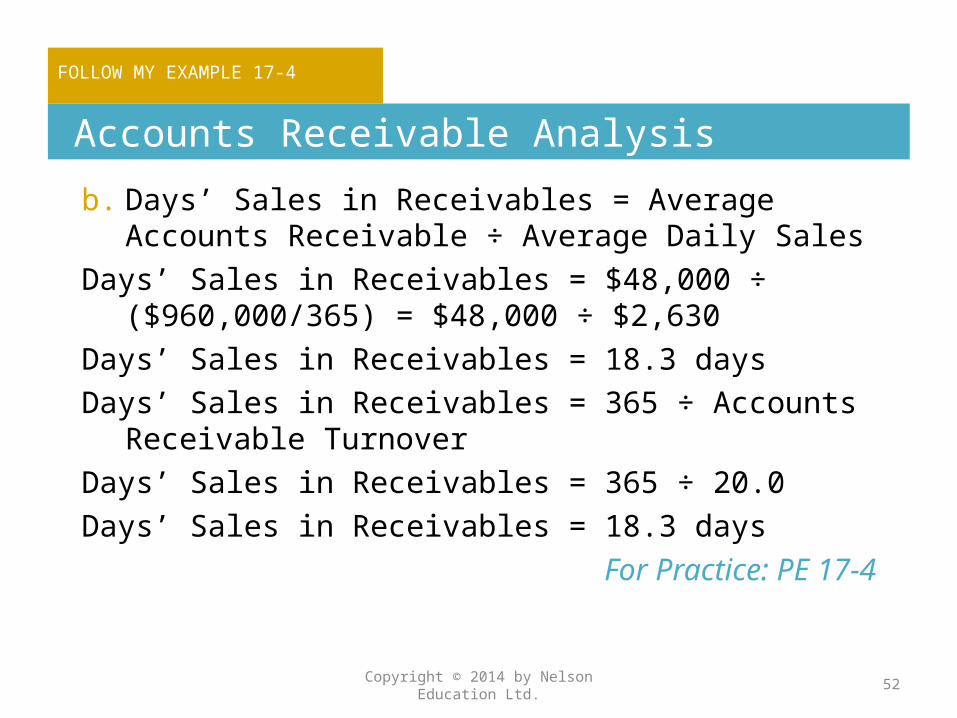
FOLLOW MY EXAMPLE 17-4
Accounts Receivable Analysis
b. Days’ Sales in Receivables = Average Accounts Receivable ÷ Average Daily Sales
Days’ Sales in Receivables = $48,000 ÷ ($960,000/365) = $48,000 ÷ $2,630
Days’ Sales in Receivables = 18.3 daysDays’ Sales in Receivables = 365 ÷ Accounts Receivable
TurnoverDays’ Sales in Receivables = 365 ÷ 20.0Days’ Sales in Receivables = 18.3 days
For Practice: PE 17-4
Copyright © 2014 by Nelson Education Ltd. 52

Inventory Analysis
The following help to evaluate a company’s ability to manage its inventory effectively:•Inventory turnover•Days’ sales in inventory
Copyright © 2014 by Nelson Education Ltd. 53
Inventory Analysis
While a company should keep enough inventory in stock so that it doesn’t lose sales, excess inventory decreases working capital, increases inventory related expenses, and increases the risk of losses due to price declines or obsolescence.
Copyright © 2014 by Nelson Education Ltd. 54
Inventory Turnover
The relationship between the volume of goods (merchandise) sold and inventory may be stated as the inventory turnover. The purpose of this ratio is to assess the efficiency of the firm in managing its inventory.
Copyright © 2014 by Nelson Education Ltd. 55
Inventory Turnover = Cost of Goods SoldAverage Inventory
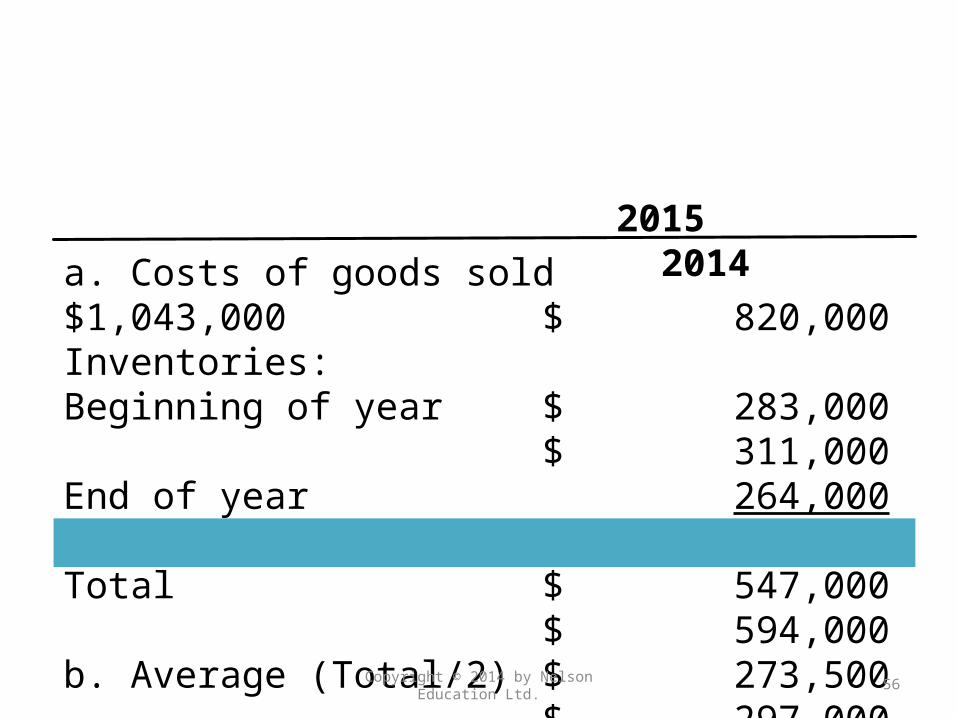
a. Costs of goods sold $1,043,000 $ 820,000Inventories:Beginning of year $ 283,000
$ 311,000End of year 264,000
283,000Total $ 547,000
$ 594,000b. Average (Total/2) $ 273,500
$ 297,000Inventory turnover (a/b) 3.8 times
2.8 times
Copyright © 2014 by Nelson Education Ltd. 56
2015 2014
Days’ Sales in Inventory
Copyright © 2014 by Nelson Education Ltd. 57
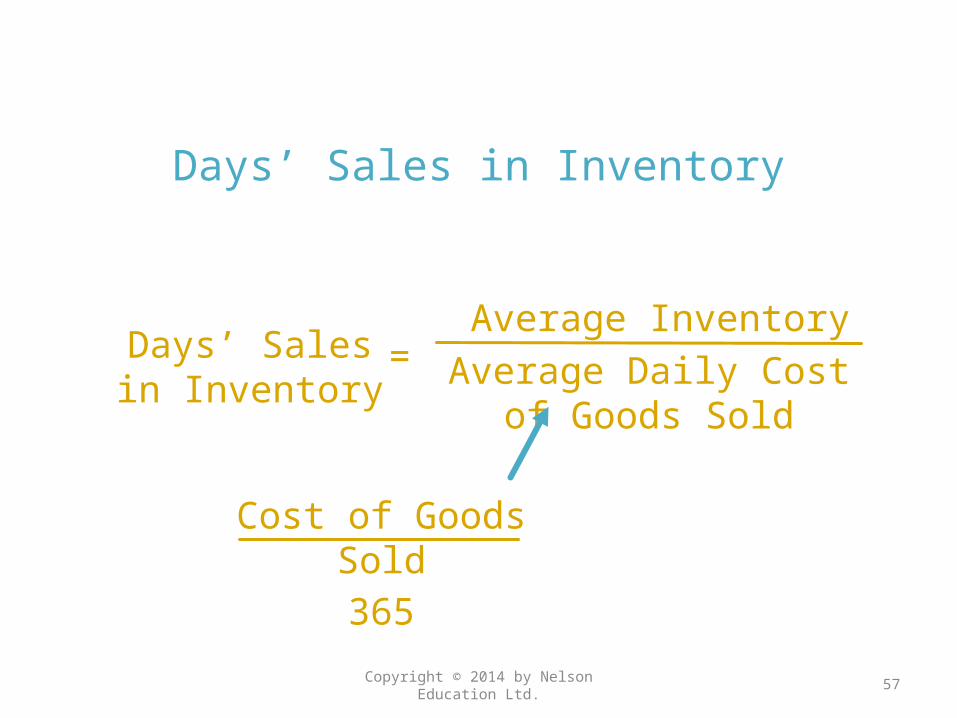
Days’ Sales in Inventory
Average InventoryAverage Daily Cost of Goods
Sold
=
Cost of Goods Sold365
Days’ Sales in Inventory
The days’ sales in inventory is a rough measure of the length of time it takes to purchase, sell, and replace the inventory.
Copyright © 2014 by Nelson Education Ltd. 58

Copyright © 2014 by Nelson Education Ltd. 59
a. Average inventory(Total/2) $ 273,500
$ 297,000Cost of goods sold $1,043,000 $ 820,000b. Average daily cost of goodssold (COGS/365 days) $ 2,858 $
2,247Days’ sales in inventory (a/b) 95.7 days 132.2 days
2015 2014

Days’ Sales in Inventory
The days’ sales in inventory can also be calculated from the inventory turnover ratio as follows:
Copyright © 2014 by Nelson Education Ltd. 60
Days’ Sales in Inventory
365Inventory Turnover
=
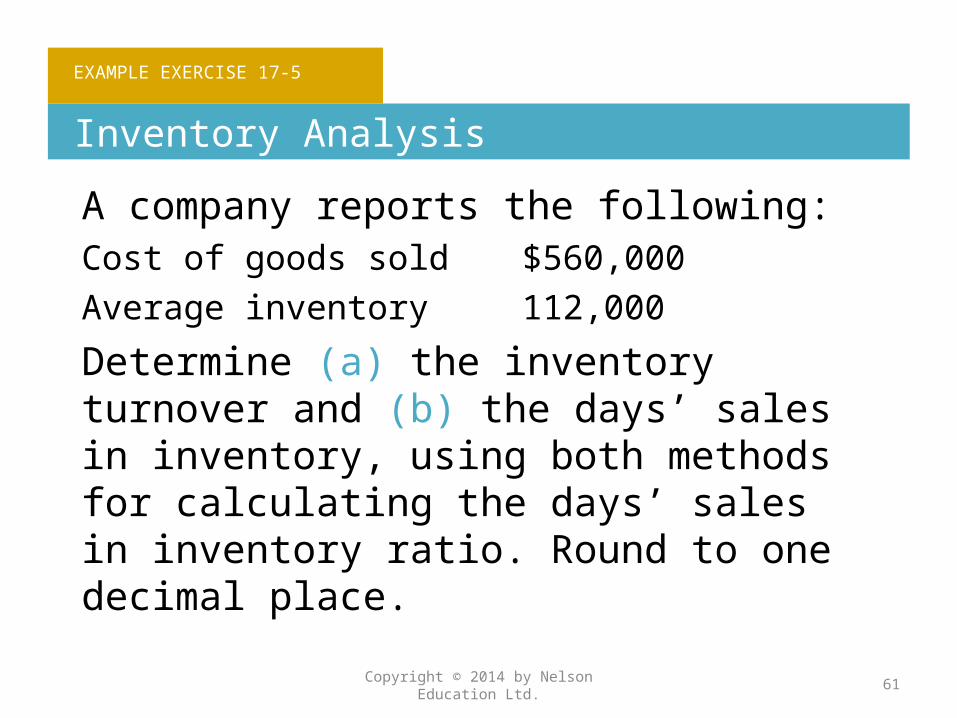
EXAMPLE EXERCISE 17-5
Inventory Analysis
A company reports the following:Cost of goods sold $560,000Average inventory 112,000
Determine (a) the inventory turnover and (b) the days’ sales in inventory, using both methods for calculating the days’ sales in inventory ratio. Round to one decimal place.
Copyright © 2014 by Nelson Education Ltd. 61
FOLLOW MY EXAMPLE 17-5
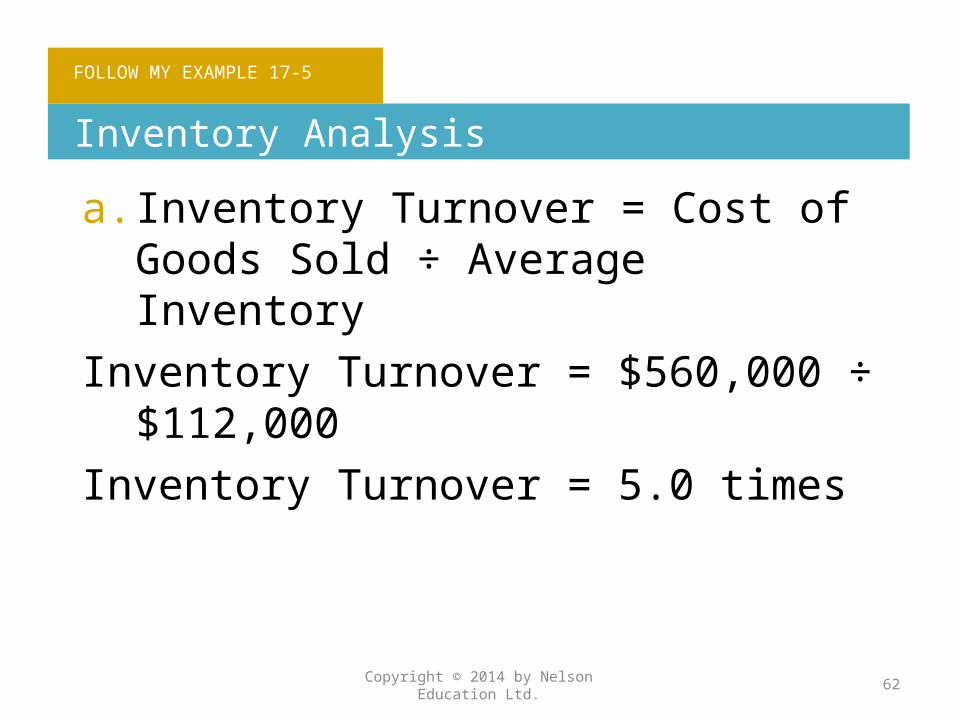
Inventory Analysis
a. Inventory Turnover = Cost of Goods Sold ÷ Average Inventory
Inventory Turnover = $560,000 ÷ $112,000Inventory Turnover = 5.0 times
Copyright © 2014 by Nelson Education Ltd. 62
FOLLOW MY EXAMPLE 17-5
Inventory Analysis
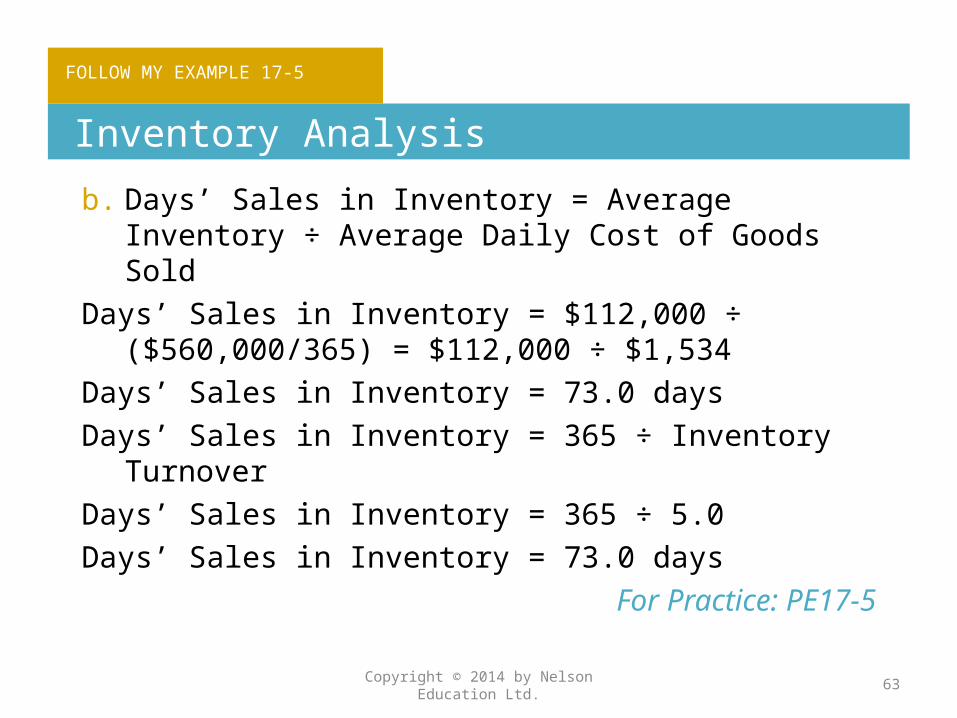
b. Days’ Sales in Inventory = Average Inventory ÷ Average Daily Cost of Goods Sold
Days’ Sales in Inventory = $112,000 ÷ ($560,000/365) = $112,000 ÷ $1,534
Days’ Sales in Inventory = 73.0 daysDays’ Sales in Inventory = 365 ÷ Inventory TurnoverDays’ Sales in Inventory = 365 ÷ 5.0Days’ Sales in Inventory = 73.0 days
For Practice: PE17-5
Copyright © 2014 by Nelson Education Ltd. 63

Total Asset Turnover
The total asset turnover measures how effectively a company uses its assets.
Copyright © 2014 by Nelson Education Ltd. 64
Total Asset Turnover =
Net SalesAverage Total
Assets

Copyright © 2014 by Nelson Education Ltd. 65
a. Net sales $1,498,000 $1,200,000Total Assets:Beginning of year $1,230,500 $1,187,500End of year 1,139.500 1,230,500Total $2,370,000 $2,418,000b. Average (Total/2) $1,185,000 $2,418,000 Total asset turnover (a/b) 1.3 times 1.0 times
2015 2014

Use ratio analysis to assess the solvency of a business.
4
Copyright © 2014 by Nelson Education Ltd. 66
Solvency Analysis
Solvency analysis focuses on the ability of a company to pay its long-term liabilities. It is normally assessed using the following ratios:•Debt ratio•Times interest earned ratio
Copyright © 2014 by Nelson Education Ltd. 67

Debt Ratio
The debt ratio measures the percentage of assets that are financed with debt and is computed as follows:
Copyright © 2014 by Nelson Education Ltd. 68
Debt Ratio Total LiabilitiesTotal Assets
=
Copyright © 2014 by Nelson Education Ltd. 69
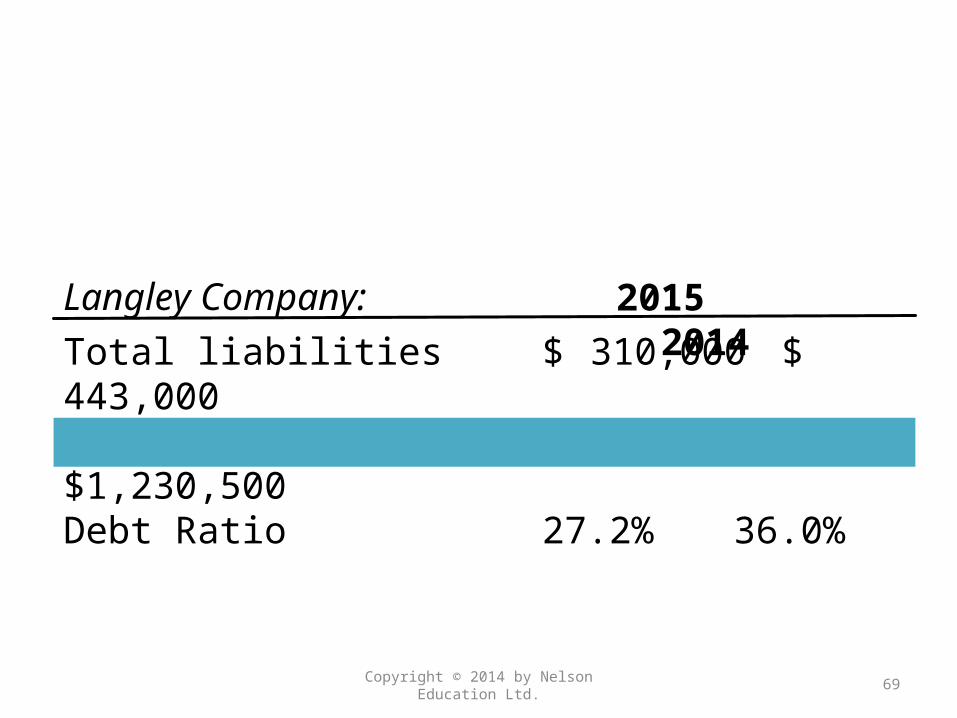
Total liabilities $ 310,000 $ 443,000Total assets $1,139,500 $1,230,500Debt Ratio 27.2% 36.0%
2015 2014Langley Company:
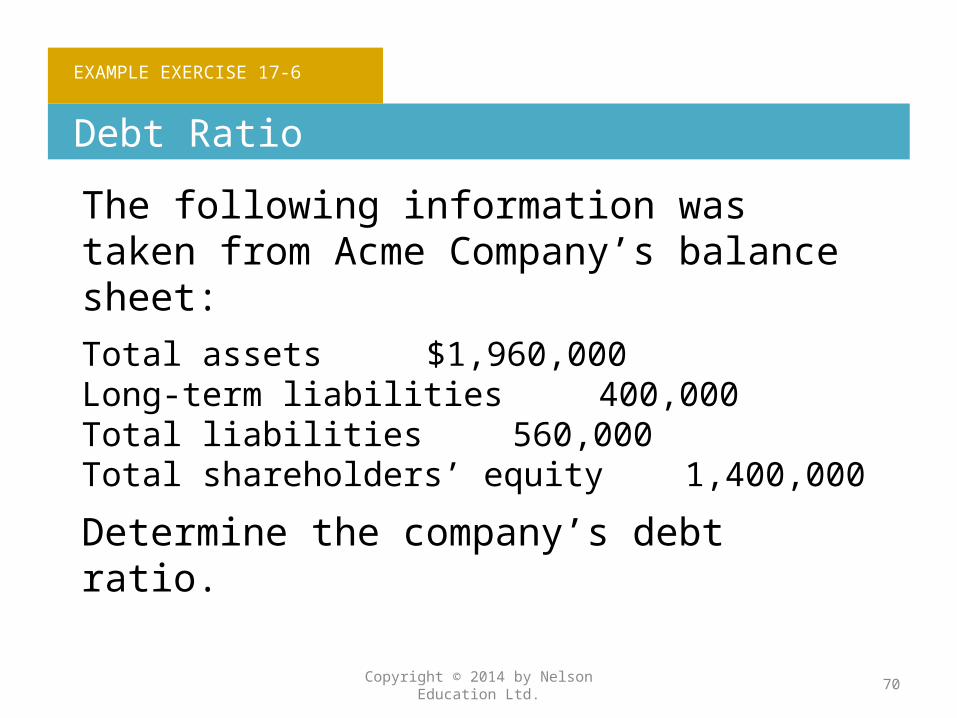
EXAMPLE EXERCISE 17-6
Debt Ratio
The following information was taken from Acme Company’s balance sheet:Total assets $1,960,000Long-term liabilities 400,000Total liabilities 560,000Total shareholders’ equity 1,400,000
Determine the company’s debt ratio.
Copyright © 2014 by Nelson Education Ltd. 70

FOLLOW MY EXAMPLE 17-6
Debt Ratio
Debt Ratio = Total Liabilities ÷ Total AssetsDebt Ratio = $560,000 ÷ $1,960,000Debt Ratio = 28.6%
For Practice: PE17-6
Copyright © 2014 by Nelson Education Ltd. 71

Times Interest Earned Ratio
The times interest earned ratio measures the risk that interest payments will not be made if earnings decrease. It is computed as follows:
Copyright © 2014 by Nelson Education Ltd. 72
Times Interest Earned
Income Before Income Taxes + Interest
ExpenseInterest Expense
=
Copyright © 2014 by Nelson Education Ltd. 73
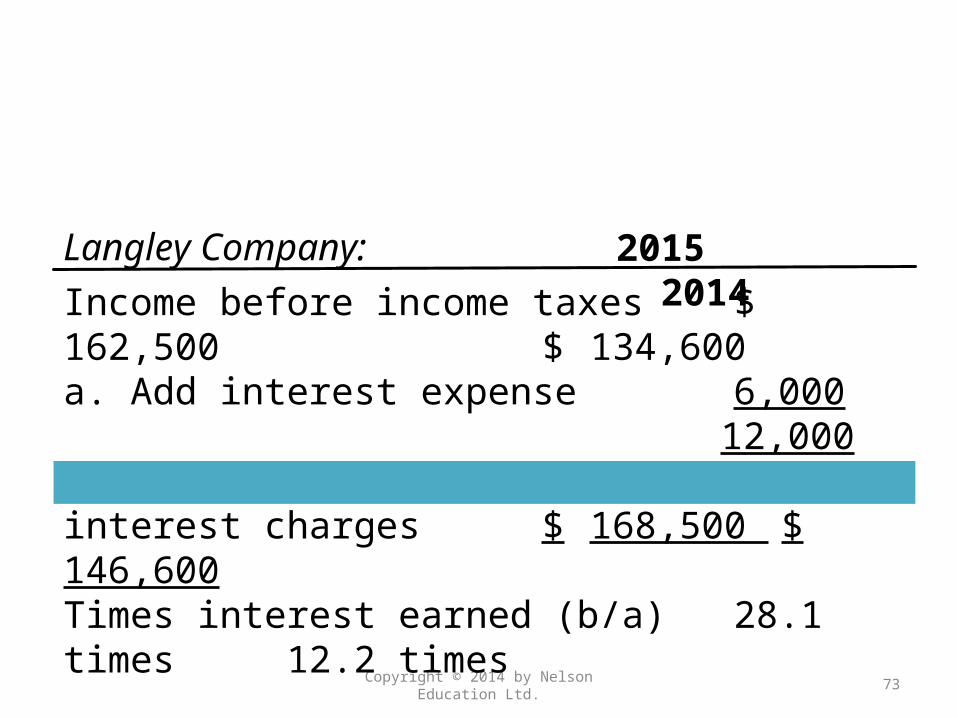
Income before income taxes $ 162,500 $ 134,600a. Add interest expense 6,000 12,000Amount available to meet interest charges $ 168,500 $ 146,600Times interest earned (b/a) 28.1 times 12.2 times
2015 2014Langley Company:
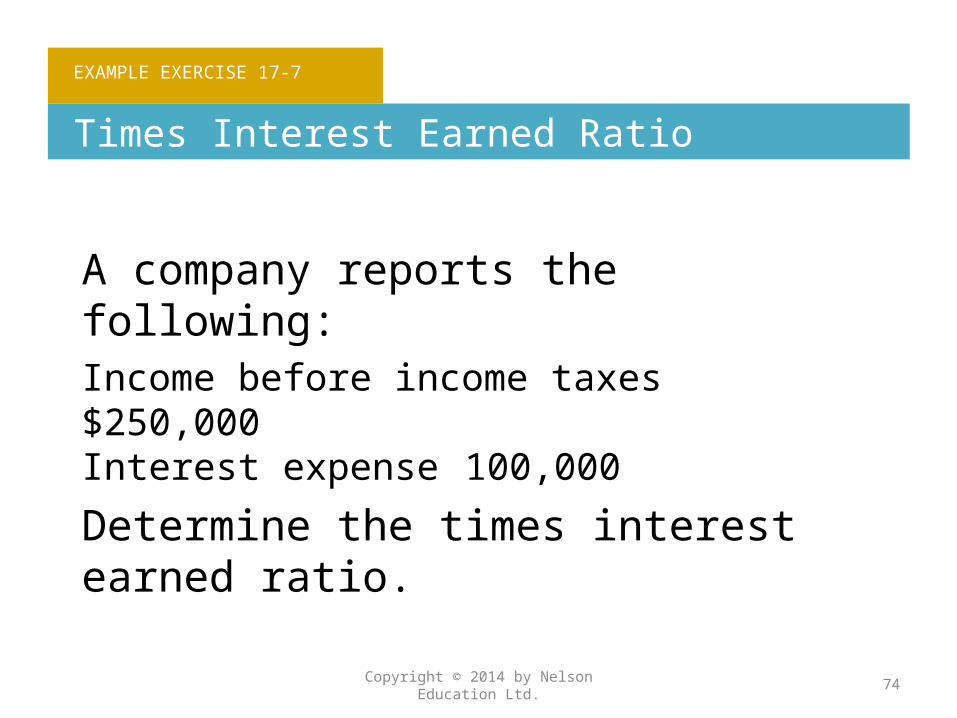
EXAMPLE EXERCISE 17-7
Times Interest Earned Ratio
A company reports the following:Income before income taxes $250,000Interest expense 100,000
Determine the times interest earned ratio.
Copyright © 2014 by Nelson Education Ltd. 74

FOLLOW MY EXAMPLE 17-7
Times Interest Earned Ratio
Times Interest Earned = (Income Before Income Taxes + Interest Expense) ÷ Interest ExpenseTimes Interest Earned = ($250,000 + $100,000) ÷ $100,000Times Interest Earned = 3.5 times
For Practice: PE 17-7
Copyright © 2014 by Nelson Education Ltd. 75
Use ratio analysis to assess the profitability of a business.
5
Copyright © 2014 by Nelson Education Ltd. 76
Profitability Analysis
Profitability analysis focuses primarily on the relationship between operating results and the resources available to a business. It includes the following:
Copyright © 2014 by Nelson Education Ltd. 77

Profitability Analysis
• Profit margin• Gross margin• Return on assets• Return on common shareholders’ equity• Earnings per share• Price-earnings ratio• Dividend yield
Copyright © 2014 by Nelson Education Ltd. 78

Profit Margin
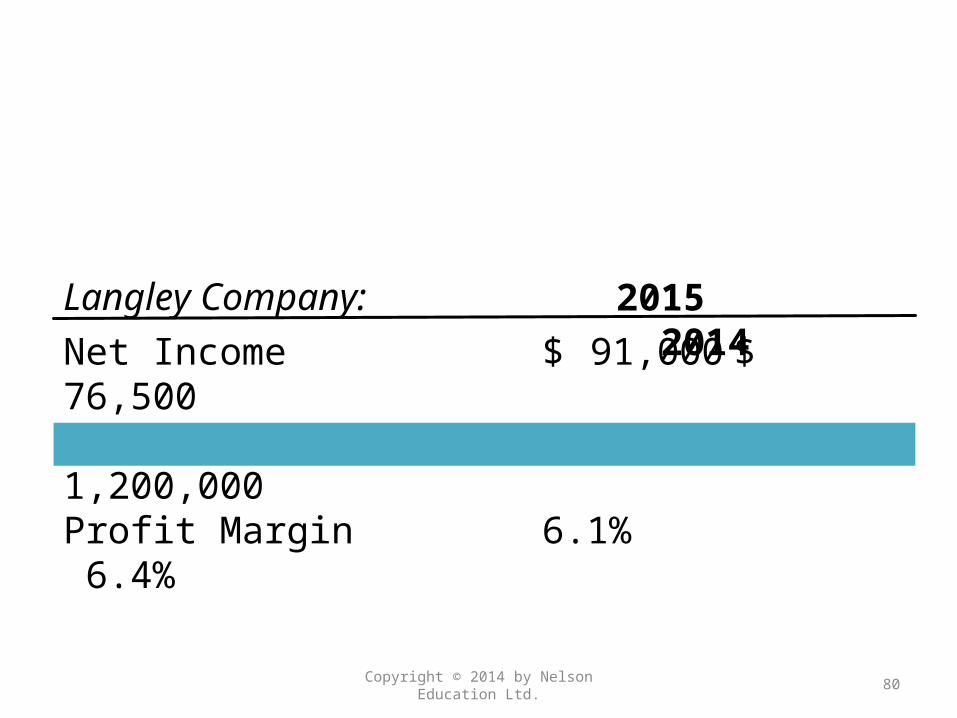
The profit margin measures the overall profitability of a company as a percentage of its sales.
Copyright © 2014 by Nelson Education Ltd. 79
Profit Margin Net IncomeNet Sales
=
Copyright © 2014 by Nelson Education Ltd. 80
Net Income $ 91,000 $ 76,500Net Sales 1,498,000 1,200,000Profit Margin 6.1% 6.4%
2015 2014Langley Company:
Gross Margin
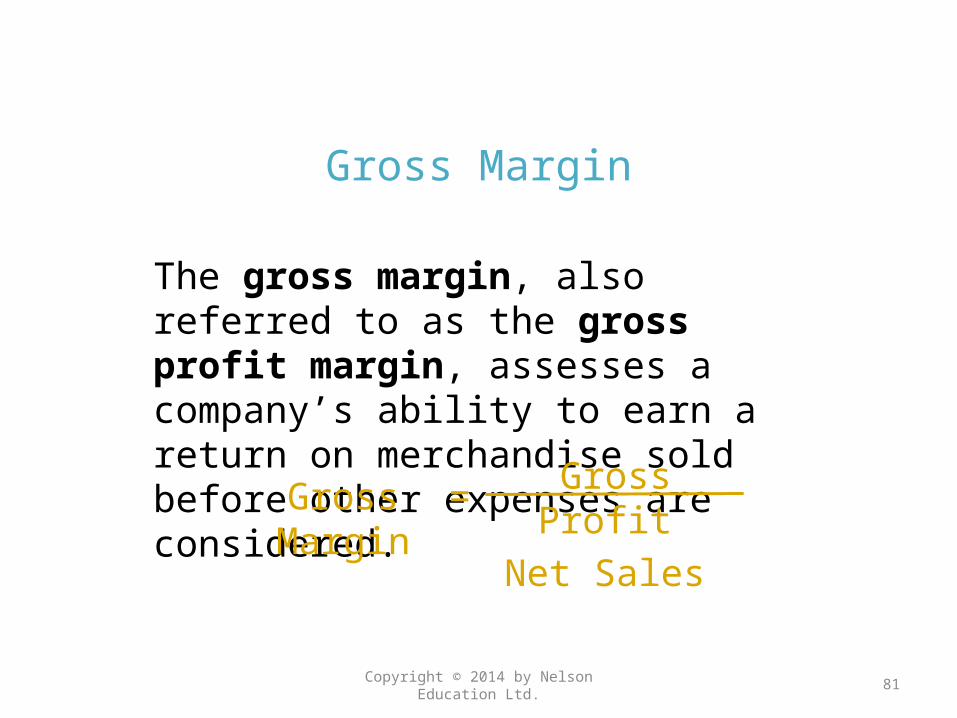
The gross margin, also referred to as the gross profit margin, assesses a company’s ability to earn a return on merchandise sold before other expenses are considered.
Copyright © 2014 by Nelson Education Ltd. 81
Gross Margin Gross ProfitNet Sales
=

Copyright © 2014 by Nelson Education Ltd. 82
Gross Profit $455,000 $380,000Net Sales 1,498,000 1,200,000Profit Margin 30.4% 31.7%
2015 2014
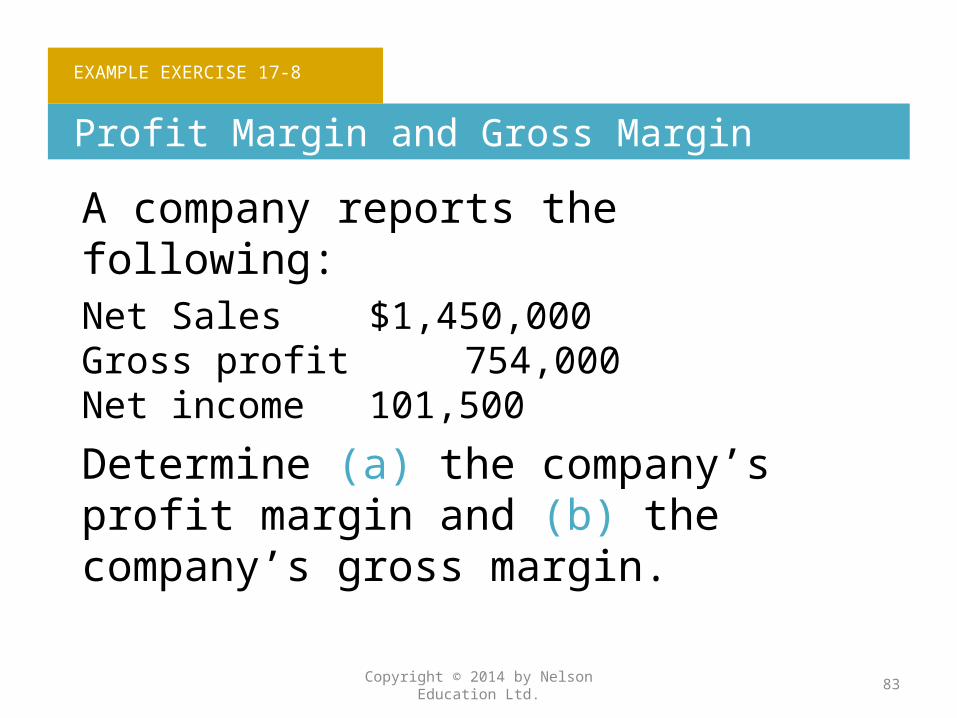
EXAMPLE EXERCISE 17-8
Profit Margin and Gross Margin
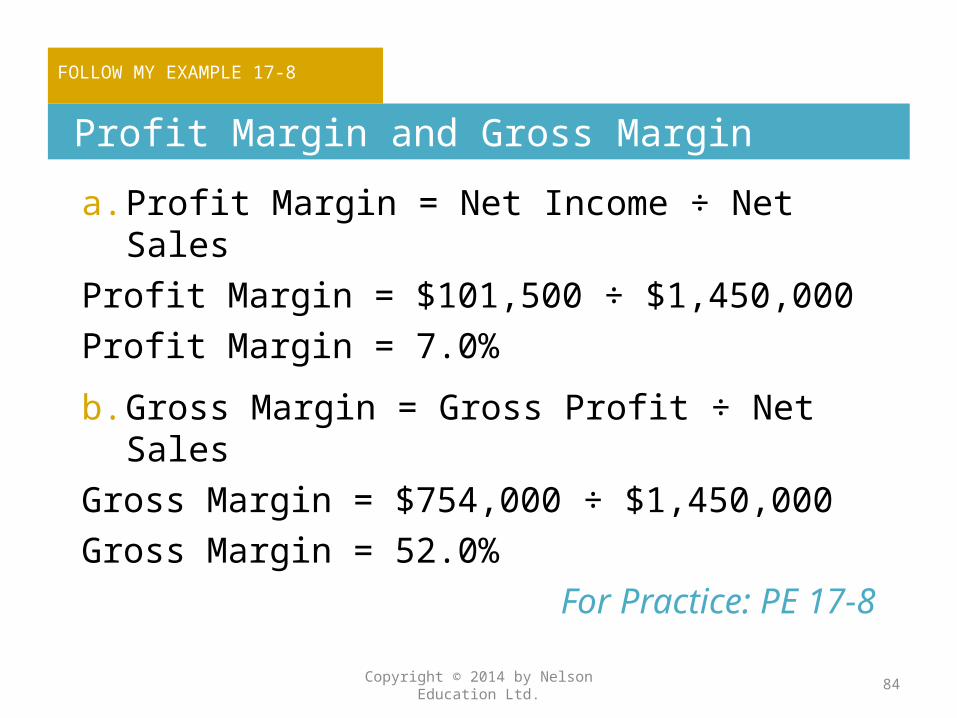
A company reports the following:Net Sales $1,450,000Gross profit 754,000Net income 101,500
Determine (a) the company’s profit margin and (b) the company’s gross margin.
Copyright © 2014 by Nelson Education Ltd. 83
FOLLOW MY EXAMPLE 17-8
Profit Margin and Gross Margin
a. Profit Margin = Net Income ÷ Net SalesProfit Margin = $101,500 ÷ $1,450,000Profit Margin = 7.0%
b. Gross Margin = Gross Profit ÷ Net SalesGross Margin = $754,000 ÷ $1,450,000Gross Margin = 52.0%
For Practice: PE 17-8
Copyright © 2014 by Nelson Education Ltd. 84
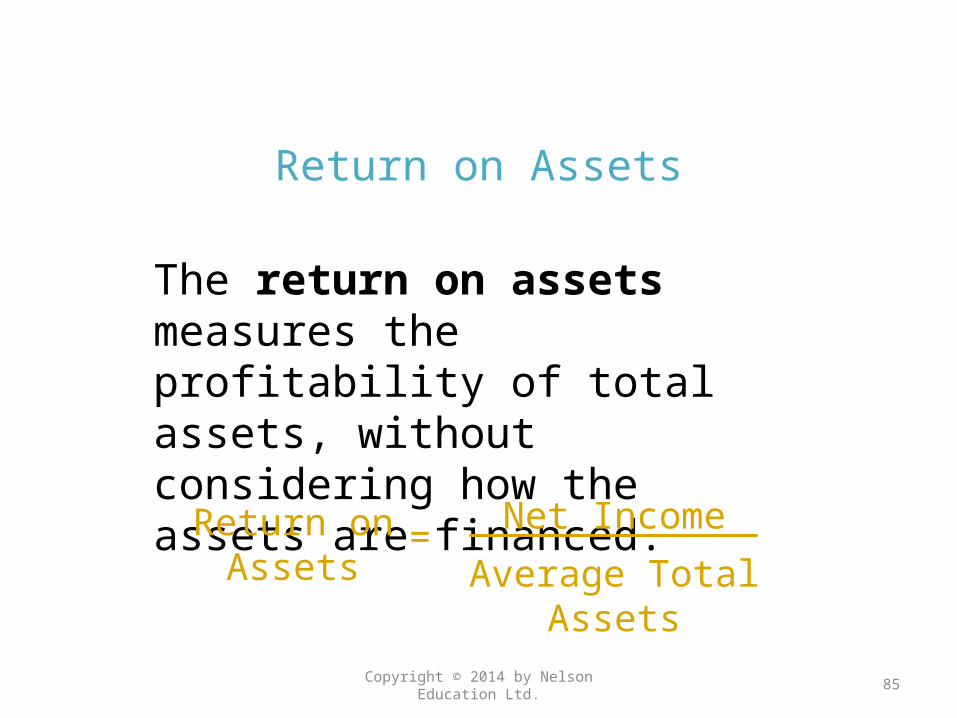
Return on Assets
The return on assets measures the profitability of total assets, without considering how the assets are financed.
Copyright © 2014 by Nelson Education Ltd. 85
Return on Assets
Net Income
Average Total Assets=
Copyright © 2014 by Nelson Education Ltd. 86
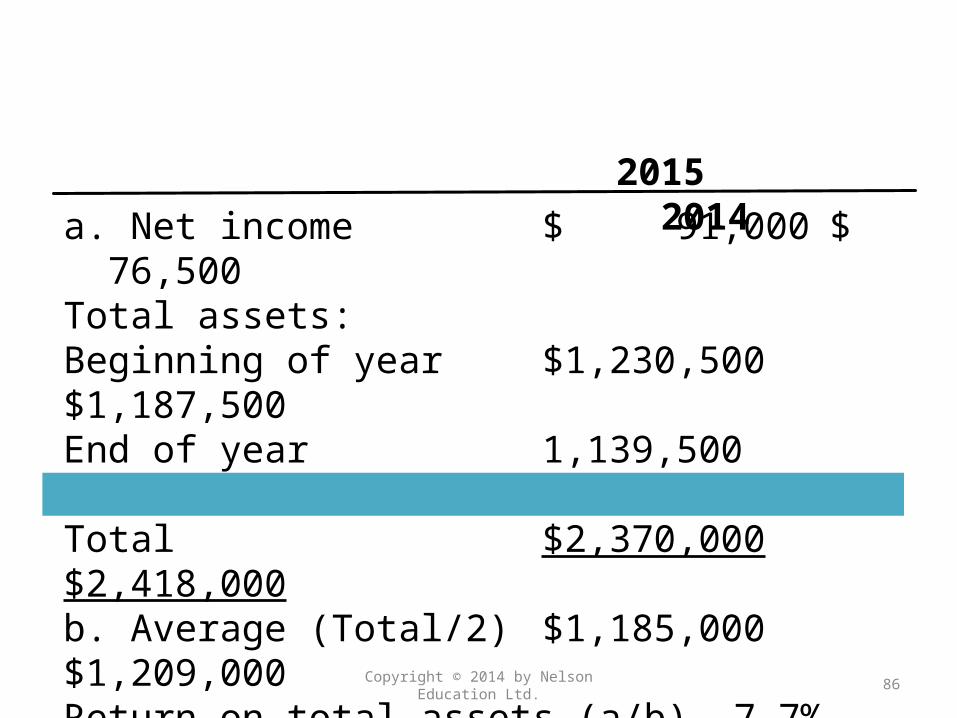
a. Net income $ 91,000 $ 76,500Total assets:Beginning of year $1,230,500 $1,187,500End of year 1,139,500 1,230,500Total $2,370,000 $2,418,000b. Average (Total/2) $1,185,000 $1,209,000Return on total assets (a/b) 7.7% 6.3%
2015 2014
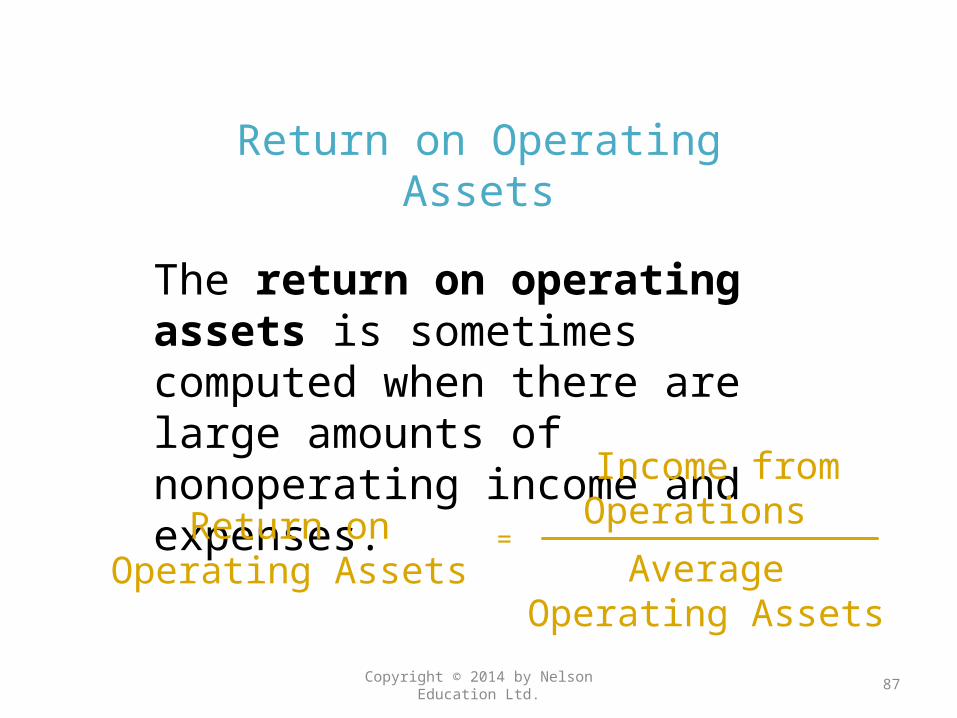
Return on Operating Assets
The return on operating assets is sometimes computed when there are large amounts of nonoperating income and expenses.
Copyright © 2014 by Nelson Education Ltd. 87
Return on Operating Assets
Income from Operations
Average Operating Assets
=
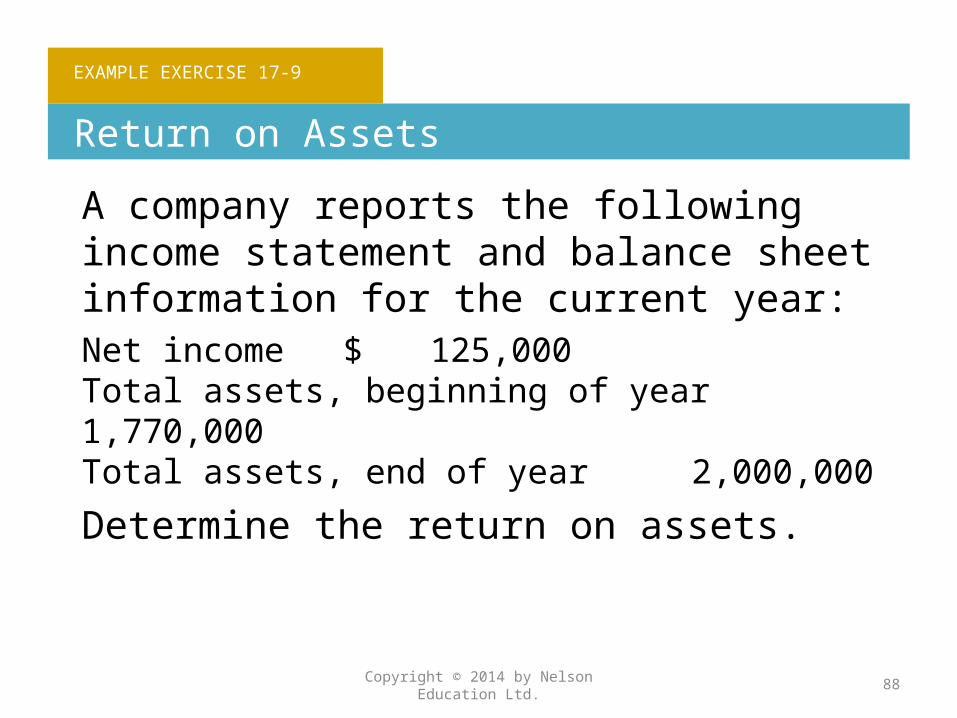
EXAMPLE EXERCISE 17-9
Return on Assets
A company reports the following income statement and balance sheet information for the current year:Net income $ 125,000Total assets, beginning of year 1,770,000Total assets, end of year 2,000,000
Determine the return on assets.
Copyright © 2014 by Nelson Education Ltd. 88
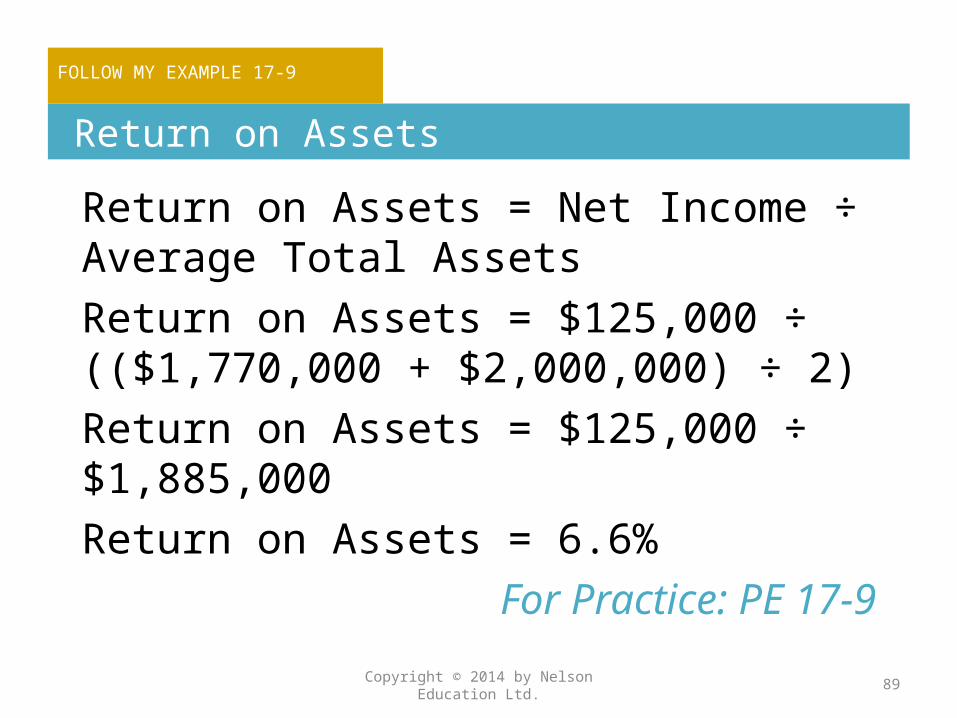
FOLLOW MY EXAMPLE 17-9
Return on Assets
Return on Assets = Net Income ÷ Average Total AssetsReturn on Assets = $125,000 ÷ (($1,770,000 + $2,000,000) ÷ 2)Return on Assets = $125,000 ÷ $1,885,000Return on Assets = 6.6%
For Practice: PE 17-9
Copyright © 2014 by Nelson Education Ltd. 89
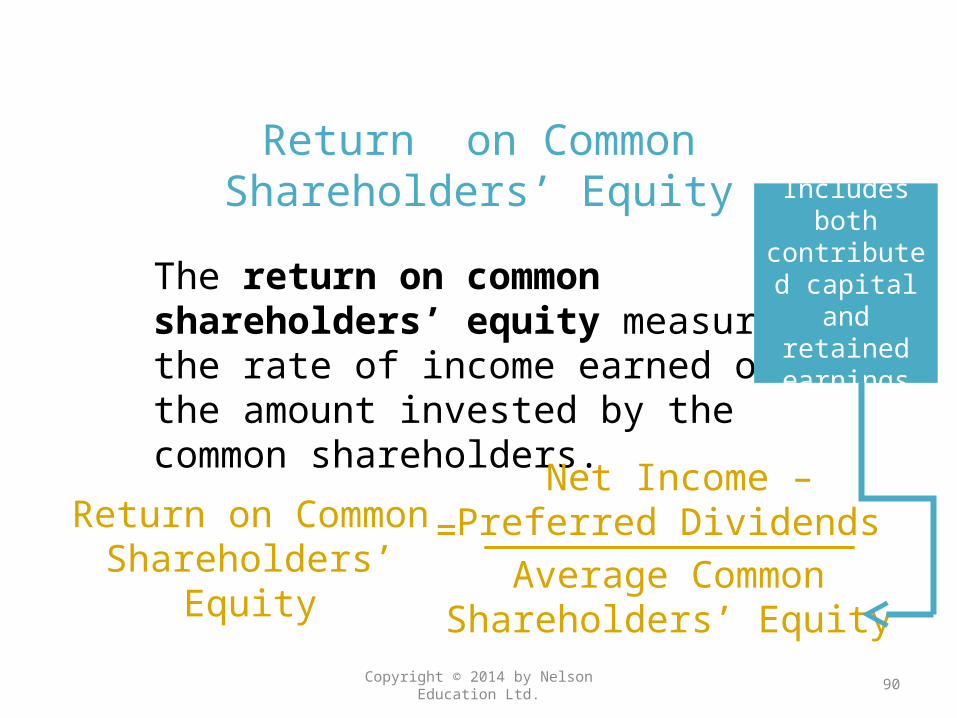
Return on Common Shareholders’ Equity
The return on common shareholders’ equity measures the rate of income earned on the amount invested by the common shareholders.
Copyright © 2014 by Nelson Education Ltd. 90
Return on Common Shareholders’ Equity
Net Income – Preferred Dividends
Average Common Shareholders’ Equity
=
Includes both contributed capital and
retained earnings
Copyright © 2014 by Nelson Education Ltd. 91
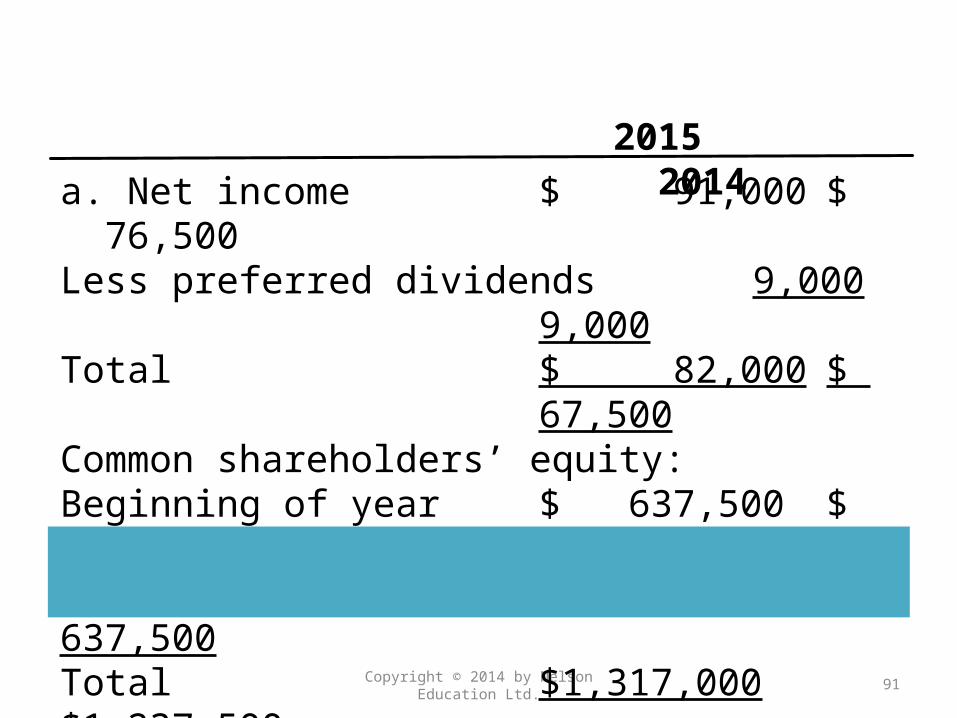
a. Net income $ 91,000 $ 76,500Less preferred dividends 9,000 9,000Total $ 82,000 $ 67,500Common shareholders’ equity:Beginning of year $ 637,500 $ 600,000End of year 679,500 637,500Total $1,317,000 $1,237,500b. Average (Total/2) $ 658,500 $ 618,750Return on common shareholders’ equity (a/b) 12.5% 10.9%
2015 2014
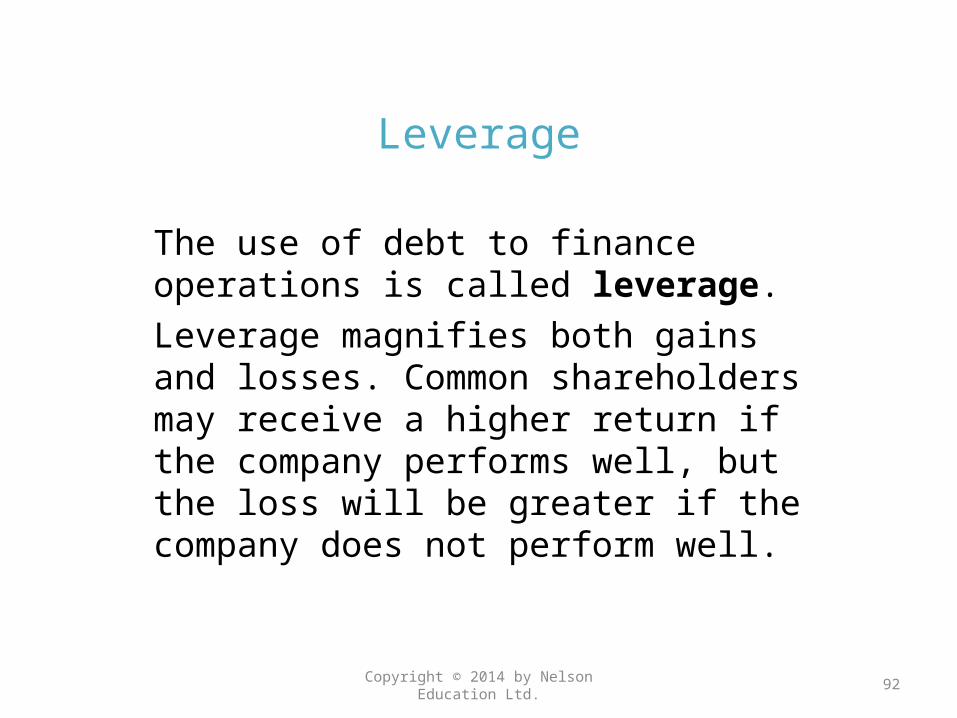
Leverage
The use of debt to finance operations is called leverage. Leverage magnifies both gains and losses. Common shareholders may receive a higher return if the company performs well, but the loss will be greater if the company does not perform well.
Copyright © 2014 by Nelson Education Ltd. 92

EXAMPLE EXERCISE 17-10
Return on Common Shareholders’ Equity
A company reports the following:
Net income $ 125,000Preferred dividends 5,000Average shareholders’ equity 1,000,000Average common shareholders’ equity 800,000
Determine the return on common shareholders’ equity.
Copyright © 2014 by Nelson Education Ltd. 93
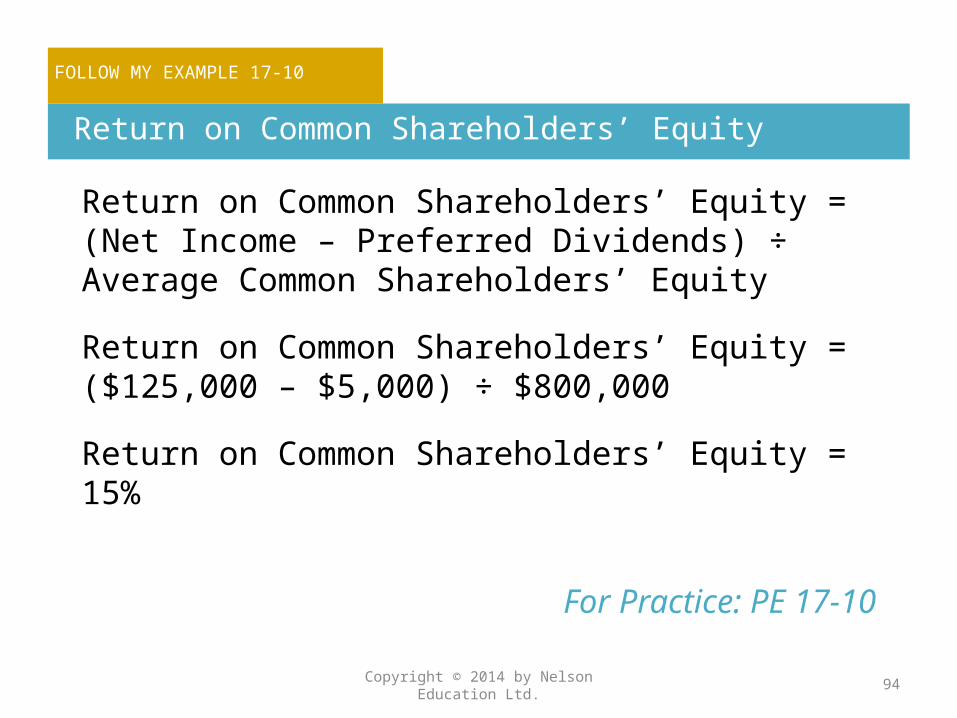
FOLLOW MY EXAMPLE 17-10
Return on Common Shareholders’ Equity
Return on Common Shareholders’ Equity = (Net Income – Preferred Dividends) ÷ Average Common Shareholders’ Equity
Return on Common Shareholders’ Equity = ($125,000 – $5,000) ÷ $800,000
Return on Common Shareholders’ Equity = 15%
For Practice: PE 17-10
Copyright © 2014 by Nelson Education Ltd. 94
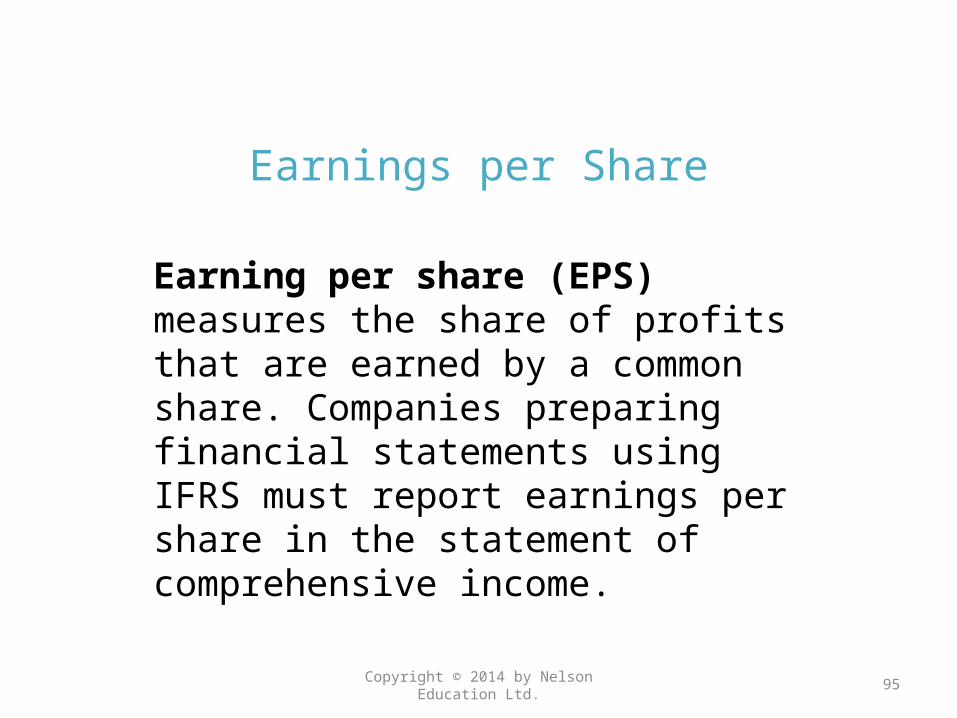
Earnings per Share
Earning per share (EPS) measures the share of profits that are earned by a common share. Companies preparing financial statements using IFRS must report earnings per share in the statement of comprehensive income.
Copyright © 2014 by Nelson Education Ltd. 95

Earnings per Share
Copyright © 2014 by Nelson Education Ltd. 96
Earnings per Share (EPS)
Net Income – Preferred Dividends
Weighted Average Number of Common Shares
=

Copyright © 2014 by Nelson Education Ltd. 97
Net income $ 91,000 $ 76,500Preferred dividends 9,000 9,000a. Total $ 82,000 $ 67,500b. Number of common shares 50,000 50,000
outstandingEarnings per share (a/b) $1.64 $1.35
2015 2014

Weighted Average Number of Common Shares
If there is a change in the number of common shares outstanding during the year, it is necessary to calculate the weighted average number of common shares for the EPS ratio.
Copyright © 2014 by Nelson Education Ltd. 98
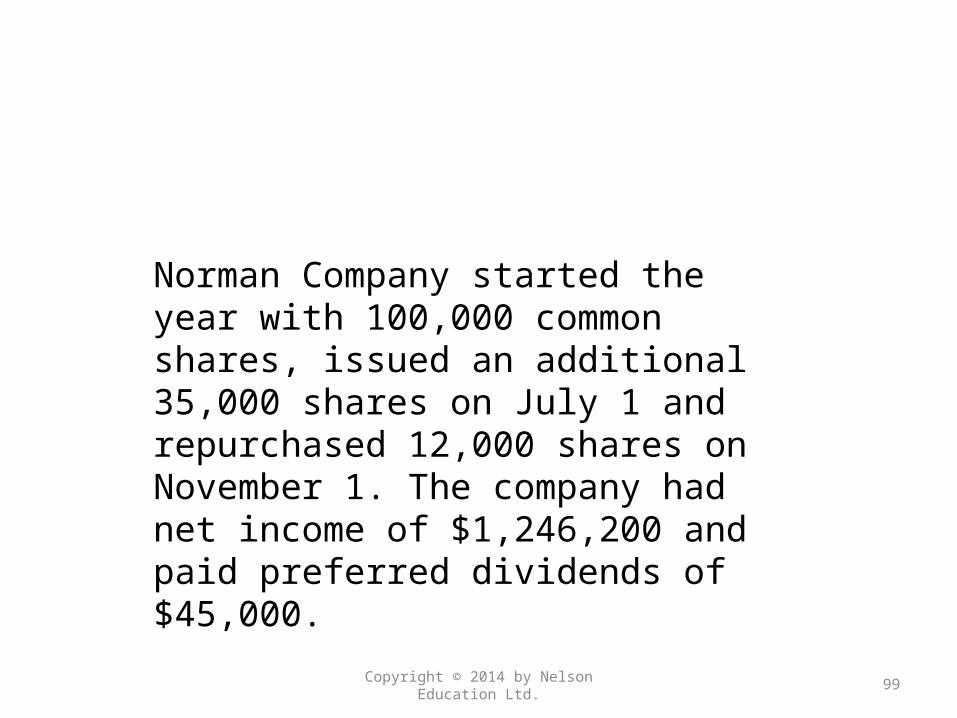
Norman Company started the year with 100,000 common shares, issued an additional 35,000 shares on July 1 and repurchased 12,000 shares on November 1. The company had net income of $1,246,200 and paid preferred dividends of $45,000.
Copyright © 2014 by Nelson Education Ltd. 99

Copyright © 2014 by Nelson Education Ltd. 100
EPS = $1,246,200 ‒ $45,000115,500 shares
= $10.40
EXAMPLE EXERCISE 17-11
Earnings per Share
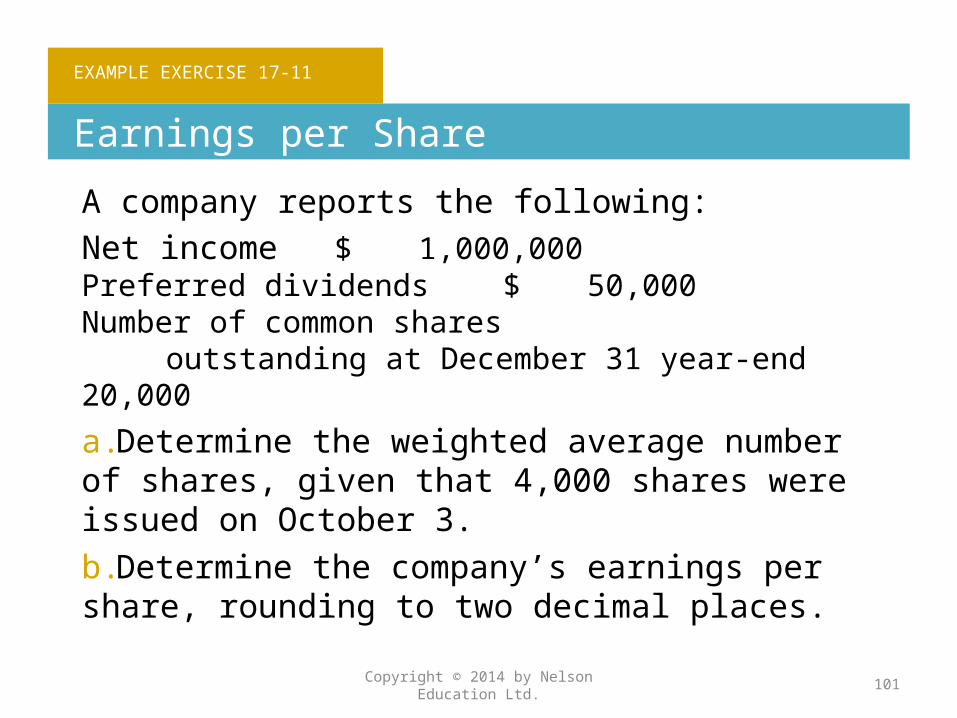
A company reports the following:Net income $ 1,000,000Preferred dividends $ 50,000Number of common shares
outstanding at December 31 year-end 20,000
a.Determine the weighted average number of shares, given that 4,000 shares were issued on October 3.b.Determine the company’s earnings per share, rounding to two decimal places.
Copyright © 2014 by Nelson Education Ltd. 101
FOLLOW MY EXAMPLE 17-11
Earnings per Share
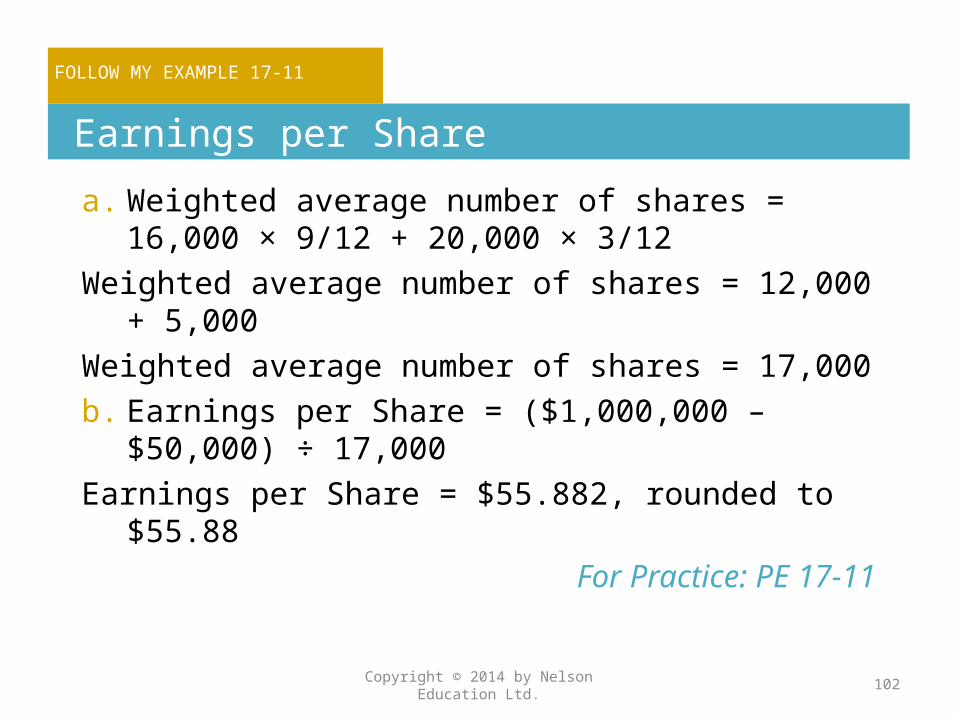
a. Weighted average number of shares = 16,000 × 9/12 + 20,000 × 3/12
Weighted average number of shares = 12,000 + 5,000
Weighted average number of shares = 17,000b. Earnings per Share = ($1,000,000 – $50,000) ÷
17,000Earnings per Share = $55.882, rounded to $55.88
For Practice: PE 17-11
Copyright © 2014 by Nelson Education Ltd. 102

Price-Earnings Ratio
Another profitability measure quoted by the financial press is the price-earnings (P/E) ratio on common shares. The price-earnings ratio on common shares measures a company’s future earnings prospects.
Copyright © 2014 by Nelson Education Ltd. 103
Price-Earnings (P/E) Ratio
Market Price per Common Share
Earnings per Share=
Copyright © 2014 by Nelson Education Ltd. 104
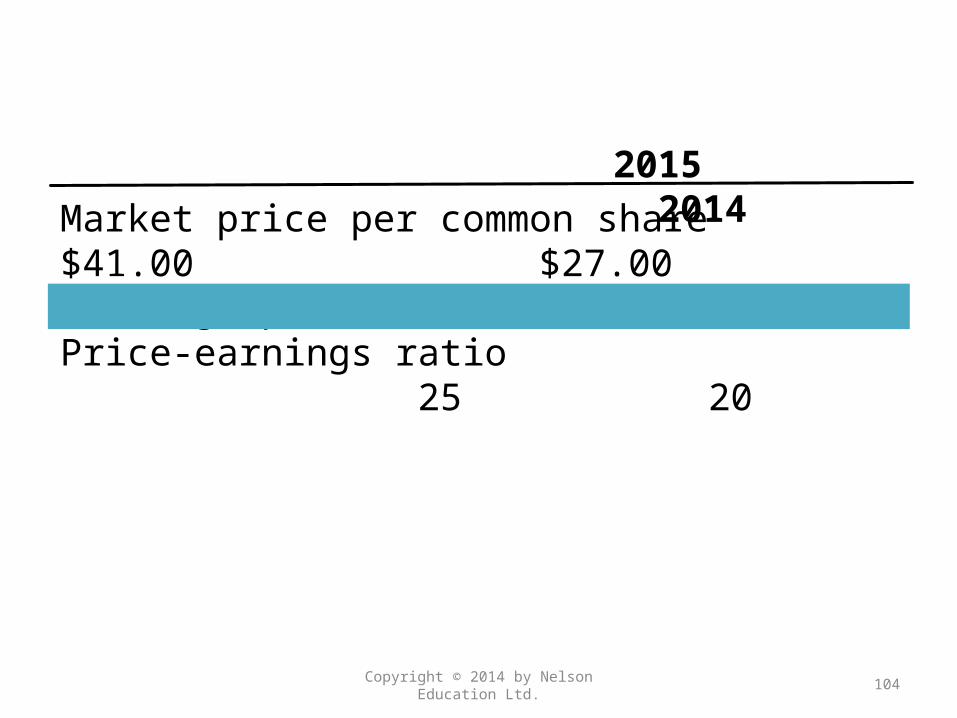
Market price per common share $41.00 $27.00Earnings per share ÷ $1.64 ÷$1.35Price-earnings ratio 25 20
2015 2014
EXAMPLE EXERCISE 17-12
Earnings per Share and Price-Earnings Ratio
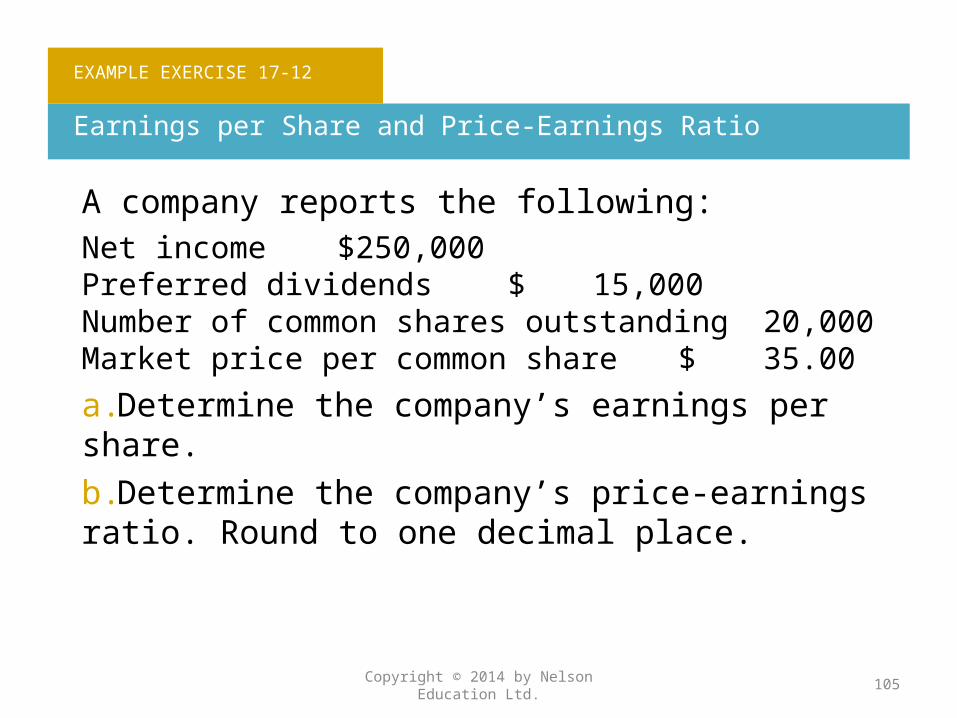
A company reports the following:Net income $250,000Preferred dividends $ 15,000Number of common shares outstanding 20,000Market price per common share $ 35.00
a.Determine the company’s earnings per share.b.Determine the company’s price-earnings ratio. Round to one decimal place.
Copyright © 2014 by Nelson Education Ltd. 105
FOLLOW MY EXAMPLE 17-12
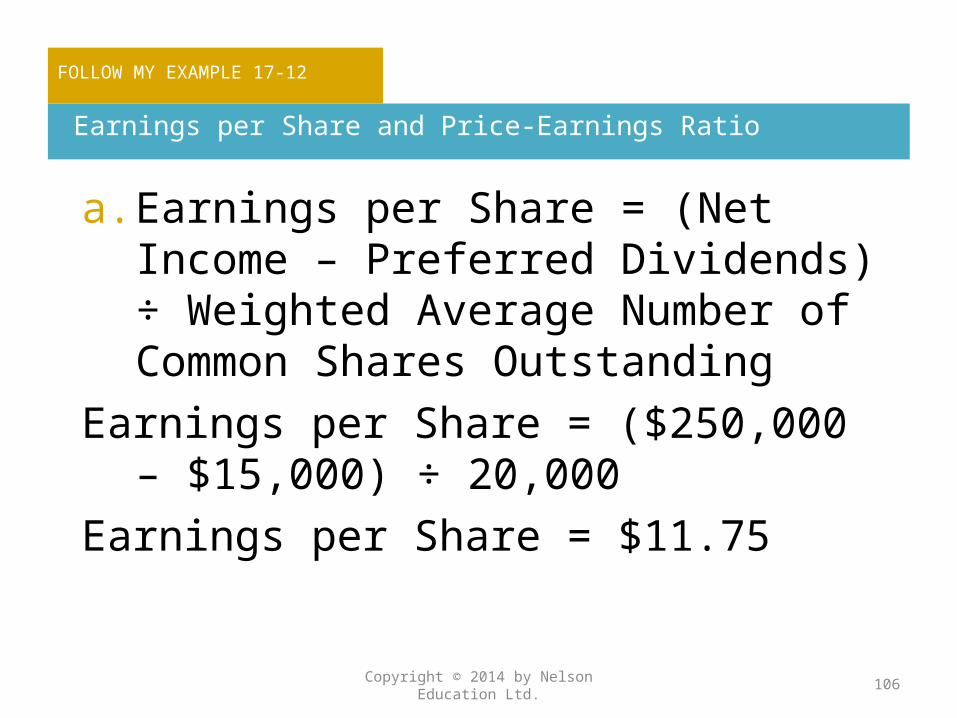
Earnings per Share and Price-Earnings Ratio
a. Earnings per Share = (Net Income – Preferred Dividends) ÷ Weighted Average Number of Common Shares Outstanding
Earnings per Share = ($250,000 – $15,000) ÷ 20,000
Earnings per Share = $11.75
Copyright © 2014 by Nelson Education Ltd. 106

FOLLOW MY EXAMPLE 17-12
Earnings per Share and Price-Earnings Ratio
b. Price-Earnings Ratio = Market Price per Share ÷ Earnings per Share
Price-Earnings Ratio = $35.00 ÷ $11.75Price-Earnings Ratio = 3.0
For Practice: PE 17-12
Copyright © 2014 by Nelson Education Ltd. 107

Dividend Yield
The dividend yield measures the rate of return to common shareholders from cash dividends.
Copyright © 2014 by Nelson Education Ltd. 108
Dividend Yield Annual Dividends per Share
Market Price per Share=

Copyright © 2014 by Nelson Education Ltd. 109
a. Dividends per share $ 0.80 $ 0.60b. Market price per share $41.00 $27.00Dividend yield 2.0% 2.2%
2015 2014

Copyright © 2014 by Nelson Education Ltd. 110
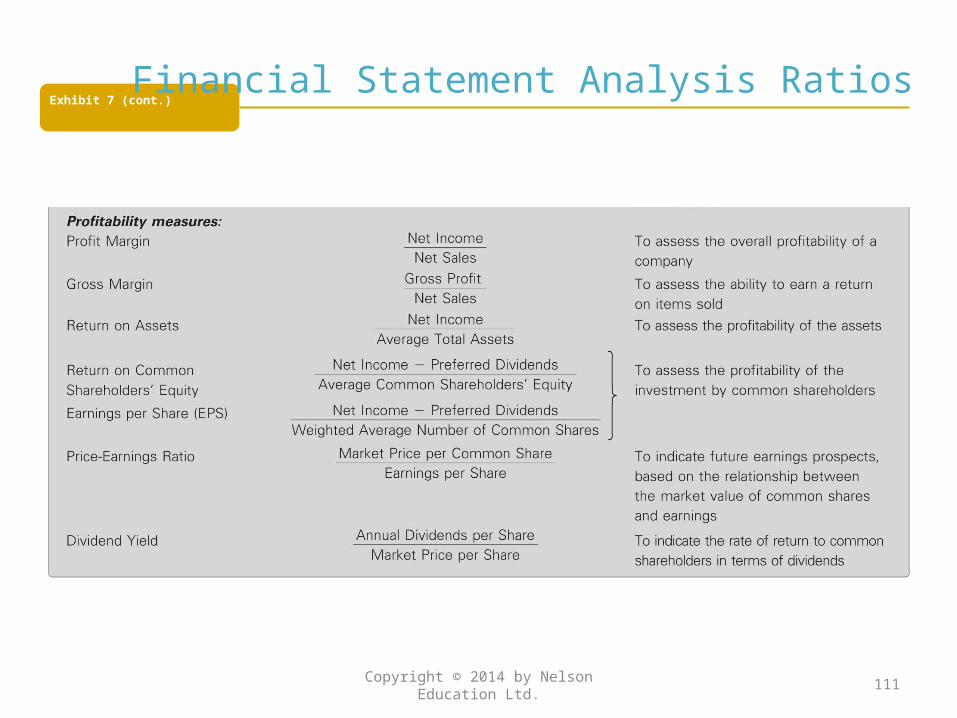
Exhibit 7 (cont.)
Copyright © 2014 by Nelson Education Ltd. 111
Financial Statement Analysis Ratios

Describe the contents of corporate annual reports.
6
Copyright © 2014 by Nelson Education Ltd. 112
Notes to the Financial Statements
Notes provide:•Additional detail. •Improved understandability of information contained in the statements. •Information on accounting policies choices.
Copyright © 2014 by Nelson Education Ltd. 113

Notes to the Financial Statements
• Information on items not shown on the statements.
• Better comparability between statements prepared by different companies.
(Understandability and comparability are two qualitative characteristics of the conceptual framework)
Copyright © 2014 by Nelson Education Ltd. 114

Corporate Annual Reports
In addition to the financial statements and the accompanying notes, corporate annual reports usually include the following sections:•Management discussion and analysis•Management letter•Auditor’s report
Copyright © 2014 by Nelson Education Ltd. 115

Management Discussion and Analysis
The Management Discussion and Analysis (MD&A) includes an analysis of the results of operations and discusses management’s opinion about future performance. It compares the prior year’s income statement with the current year’s. It also contains an analysis of the firm’s financial condition.
Copyright © 2014 by Nelson Education Ltd. 116
Management Letter
The report by management, entitled Management Responsibility for Financial Reporting, states management’s responsibility for establishing and maintaining internal control. In addition, management’s assessment of the effectiveness of internal controls over financial reporting is included in the report.
Copyright © 2014 by Nelson Education Ltd. 117
Auditor’s Report
All publicly held corporations are required to have an independent audit (examination) of their financial statements. The professional accounting firm that conducts the audit renders an opinion on the fairness of the statements called the Auditor’s Report.
Copyright © 2014 by Nelson Education Ltd. 118

The End
Copyright © 2014 by Nelson Education Ltd. 119


![K. D. Elworthy & Xue-Mei Li arXiv:math/0605089v1 [math.PR] 3 … · 2018-10-18 · K. D. Elworthy & Xue-Mei Li Abstract We consider versions of Malliavin calculus on path spaces of](https://static.fdocuments.us/doc/165x107/5e6c314affb414293558f2b7/k-d-elworthy-xue-mei-li-arxivmath0605089v1-mathpr-3-2018-10-18-k.jpg)

