Net Zero Economy Index 2020: The Pivotal Decade
25
Net Zero Economy Index 2020: The Pivotal Decade Tracking the progress G20 countries have made to reduce energy-related CO 2 emissions and decarbonise their economies. pwc.co.uk/netzeroeconomy
Transcript of Net Zero Economy Index 2020: The Pivotal Decade

Net Zero Economy Index 2020:
The Pivotal DecadeTracking the progress G20 countries have made to reduce energy-related CO2 emissions and decarbonise their economies.
pwc.co.uk/netzeroeconomy


PwC | 3
Foreword The Global Picture The Index 2020 Technical Annex Methodology Lead Authors
There are encouraging signs that the reality of the scale of transformation required is taking hold across both public and private sectors. Over the past 18 months there has been a surge of net zero pledges announced by countries, companies, investors, cities and regions. Net zero announcements made by governments now collectively amount to 51% of global emissions, and this would rise to 63% should President-elect Biden enact his proposed 2050 net zero target in the US.
The gap between ambition and action, however, remains substantial. While the underpinning analysis remains the same, the PwC Net Zero Economy Index brings into focus the need for scale, collaboration, investment and innovation to transform commitments into action.
Foreword
The landmark IPCC 1.5°C Special Report in 2018 stated that to avoid the worst impacts of climate change, global carbon emissions must be halved by 2030, and reduced to net zero by 2050. At present, the reverse is happening. Between 2009 and 2019, average global energy-related carbon emissions rose by 1.5% per year.
2020 is still set to be another record breaking year for global temperature increases, despite an expected pandemic-related fall in global emissions. It is clear that the 2020s will be pivotal in determining if we can bend the emissions curve fast enough, turning the COVID-related anomaly into a rapidly-falling emissions trajectory to limit warming to 1.5°C, the goal set out in the Paris Climate Agreement.
It is in that context that this year’s report, the Net Zero Economy Index replaces the Low Carbon Economy Index. It is a recognition of the ultimate goal business and society needs to achieve, and the growing focus and momentum behind commitments from business, governments, and investors to net zero. While our analysis here focuses on energy-related CO2 emissions, we will broaden that coverage when feasible.
“As COVID-19 continues to shape and influence our lives, the pressing challenge of climate change remains. With a view out beyond the current crisis, arguably the greatest transformation challenge humankind has faced is staring at us: we have just over two business cycles to transform every sector of the global economy to halve global emissions. Put simply, we are in the pivotal decade.
Dr Celine HerweijerPartner, PwC Global Climate Change Leader, PwC United Kingdom
The Net Zero Economy Index tracks the decarbonisation of energy-related CO2 emissions worldwide. The analysis is underpinned by the BP Statistical Review of World Energy, which provides carbon emissions based on the consumption of oil, gas and coal for combustion-related activities. The analysis does not consider emissions from other sectors or other types of greenhouse gases, and does not account for any carbon that is sequestered. As a result, it cannot be compared directly with national emissions inventories.
PwC | 4
Contents The Global Picture 05
The Index 2020 08
Technical Annex 15
Methodology 21
Lead Authors 23

The Global Picture

PwC | 6
Foreword The Global Picture The Index 2020 Technical Annex Methodology Lead Authors
to meet the 1.5°C targetDouble-digit decarbonisation is required
The scale of the decarbonisation challengeIn 2019, prior to the emergence of COVID-19, the rate of global decarbonisation was 2.4% – this is the reduction in carbon intensity or energy-related CO2 emissions per dollar of GDP. This rate has increased slightly since the previous year, against a backdrop of rising overall global emissions. Consistent with analyses by PwC and other agencies, it is far below the rate needed to deliver the Paris Agreement’s goal to limit warming to well below 2°C above pre-industrial levels, and to pursue efforts to limit the temperature increase even further to 1.5°C. Keeping warming to 1.5°C will now require a global rate of decarbonisation nearly five times greater than was seen in 2019.
The 2020s are the pivotal decadeAs the impacts of the COVID-19 pandemic persist globally, we cannot overlook the urgency and magnitude of the decarbonisation challenge. The 2020s are the pivotal decade for climate action. While the global response to the pandemic has brought an abrupt decrease in global emissions in 2020, the data is showing a fast rebound in emissions as economies and societies begin to open up. A return to 'business as usual' emissions post pandemic, however, is not an option if we are to achieve the emissions reductions required to limit global warming. This anomaly needs to be an inflection point that provides the opportunity for businesses and governments to reset and invest for the long-term. Achieving the necessary 11.7% per year global decarbonisation rate this decade will require wholescale transformation of every sector of the global economy, unprecedented innovation, and committed leadership.
Figure 1: Net Zero Economy Index 2020
* Global carbon budgets refer to the global estimated budget of fossil fuel emissions taken from the IPCC Special Report on Global Warming of 1.5°C. A series of assumptions underpin these carbon budgets, including the likelihood and uncertainties of staying within the temperature limits, and the use of carbon dioxide removal (CDR) technologies.Sources: BP, World Bank, IMF, UNFCCC, PwC data and analyticsNote: GDP is measured on a purchasing power parity (PPP) basis.
PwC | 7
Foreword The Global Picture The Index 2020 Technical Annex Methodology Lead Authors
The global picture in 2019
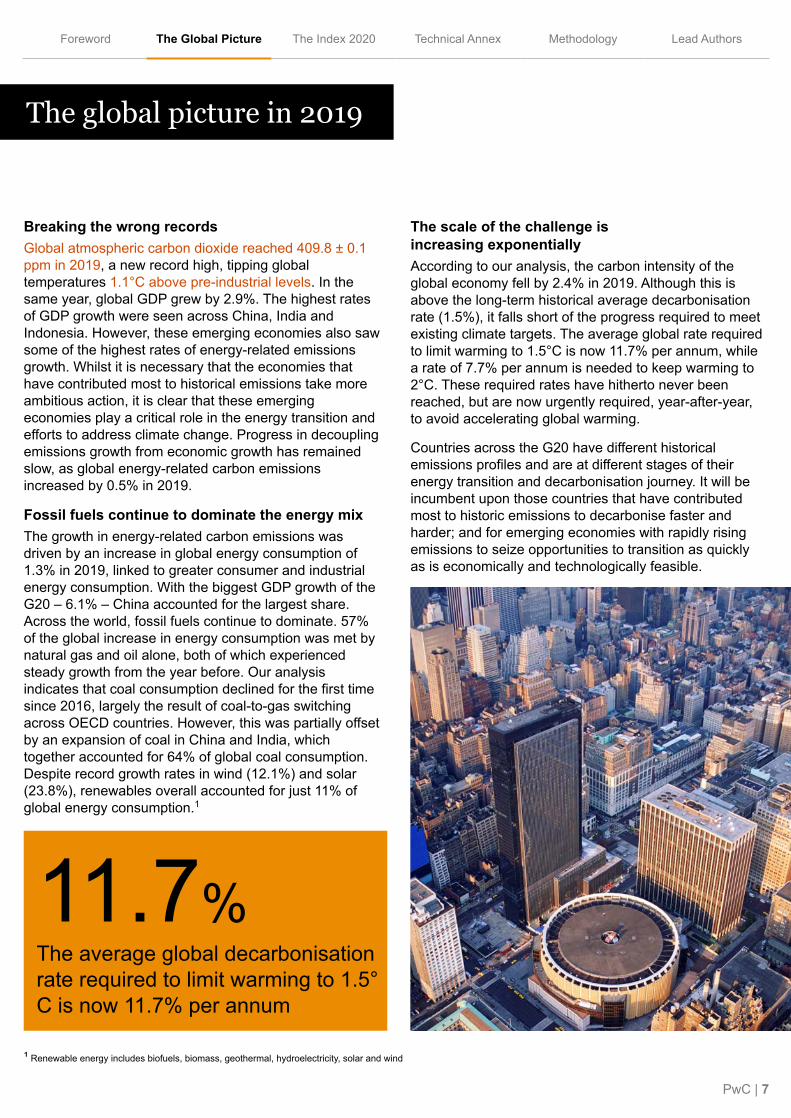
Breaking the wrong recordsGlobal atmospheric carbon dioxide reached 409.8 ± 0.1 ppm in 2019, a new record high, tipping global temperatures 1.1°C above pre-industrial levels. In the same year, global GDP grew by 2.9%. The highest rates of GDP growth were seen across China, India and Indonesia. However, these emerging economies also saw some of the highest rates of energy-related emissions growth. Whilst it is necessary that the economies that have contributed most to historical emissions take more ambitious action, it is clear that these emerging economies play a critical role in the energy transition and efforts to address climate change. Progress in decoupling emissions growth from economic growth has remained slow, as global energy-related carbon emissions increased by 0.5% in 2019.
Fossil fuels continue to dominate the energy mixThe growth in energy-related carbon emissions was driven by an increase in global energy consumption of 1.3% in 2019, linked to greater consumer and industrial energy consumption. With the biggest GDP growth of the G20 – 6.1% – China accounted for the largest share. Across the world, fossil fuels continue to dominate. 57% of the global increase in energy consumption was met by natural gas and oil alone, both of which experienced steady growth from the year before. Our analysis indicates that coal consumption declined for the first time since 2016, largely the result of coal-to-gas switching across OECD countries. However, this was partially offset by an expansion of coal in China and India, which together accounted for 64% of global coal consumption. Despite record growth rates in wind (12.1%) and solar (23.8%), renewables overall accounted for just 11% of global energy consumption.1
The scale of the challenge is increasing exponentiallyAccording to our analysis, the carbon intensity of the global economy fell by 2.4% in 2019. Although this is above the long-term historical average decarbonisation rate (1.5%), it falls short of the progress required to meet existing climate targets. The average global rate required to limit warming to 1.5°C is now 11.7% per annum, while a rate of 7.7% per annum is needed to keep warming to 2°C. These required rates have hitherto never been reached, but are now urgently required, year-after-year, to avoid accelerating global warming.
Countries across the G20 have different historical emissions profiles and are at different stages of their energy transition and decarbonisation journey. It will be incumbent upon those countries that have contributed most to historic emissions to decarbonise faster and harder; and for emerging economies with rapidly rising emissions to seize opportunities to transition as quickly as is economically and technologically feasible.
11.7%The average global decarbonisation rate required to limit warming to 1.5°C is now 11.7% per annum
¹ Renewable energy includes biofuels, biomass, geothermal, hydroelectricity, solar and wind

The Index 2020

PwC | 9
Foreword The Global Picture The Index 2020 Technical Annex Methodology Lead Authors
Note: Countries have been ordered in terms of percentage of global GDP, PPP (current international $). Countries with a net zero target under discussion or in law are based on those included in the Energy & Climate Intelligence Unit: Net Zero Tracker. Numbers in the table are based on energy-related CO2 emissions only for 2019 and do not include other greenhouse gases, including non-CO2 energy-related emissions. At the time of publication only national inventory GHG emission data for 2018 is available for all G20 countries.
Overall IndexOur Net Zero Economy Index tracks the rate of the net zero economy transition in each of the G20 economies across energy-related CO2 emissions.
Within the G20, Germany, Korea, the US and the UK achieved the highest rates of emissions reductions relative to their economic growth. However, these rates of decarbonisation fall far behind what is required to limit warming to 1.5°C.Germany recorded the highest rate of decarbonisation in 2019 but that rate would still need to nearly double to be consistent with a 1.5°C trajectory. At the other end of the spectrum, South Africa and Indonesia recorded an increase in carbon intensity for the second consecutive year.Across the board, progress is not enough. Even the countries with the highest rate of change in 2019 need to accelerate their efforts to 2x current decarbonisation rates, and those with the lowest rate of change may need up to a 10x improvement.
to meet global climate goalsAll countries need to accelerate progress
Country(Countries with a net zero target under discussion or in law)
Change in carbon intensity 2018-9
Annual average change in carbon
intensity 2000-2019
Change in energy- related carbon
emissions 2018-19
Real GDP growth (PPP) 2018-19
Carbon intensity (tCO2 / $m GDP)
2019
World -2.4% -1.5% 0.5% 2.9% 286G7 -4.3% -2.3% -2.7% 1.6% 215E7 -2.1% -1.6% 2.2% 4.4% 343China -2.8% -2.9% 3.2% 6.1% 443
US -4.7% -2.6% -2.5% 2.3% 256
EU -5.2% -2.4% -3.7% 1.5% 174
India -3.7% -1.5% 1.2% 5.0% 274
Japan -3.1% -1.2% -2.4% 0.7% 226
Germany -6.6% -2.4% -6.1% 0.6% 159
Russia -2.2% -2.6% -0.9% 1.3% 402
Indonesia 3.5% -0.9% 8.7% 5.0% 198
France -3.6% -2.5% -2.2% 1.5% 104
UK -4.0% -3.7% -2.6% 1.4% 126
Brazil -1.4% -0.5% -0.2% 1.1% 149
Italy -3.5% -1.8% -3.3% 0.3% 133
Mexico -2.6% -0.7% -2.8% -0.1% 181
Turkey -2.6% -1.4% -1.7% 0.9% 171
Korea -5.1% -1.5% -3.2% 2.0% 372
Canada -3.4% -2.2% -1.8% 1.7% 324
Saudi Arabia 0.7% 1.1% 1.0% 0.3% 440
Australia 2.3% -1.9% 4.3% 1.9% 321
Argentina -1.1% -0.1% -3.3% -2.2% 179
South Africa 1.3% -1.4% 1.5% 0.2% 599
Table 1: Net Zero Economy Index 2020 – G20 Performance Summary

PwC | 10
Foreword The Global Picture The Index 2020 Technical Annex Methodology Lead Authors
Figure 2: Global decarbonisation rates since 1990
as coal-gas switching across the UK and US – or unanticipated global crises that have temporarily shut down entire economies, have not driven decarbonisation anywhere close to the rate required to limit warming to 1.5°C (see Figure 2). Recoveries from past crises have invariably resulted in a return to the business as usual.
The Net Zero Economy Index 2020 is based on data up to the end of 2019, but in 2020 COVID-19 has had a massive impact on global emissions. Countries in full lockdown experienced on average a 25% decline in weekly energy demand, and it is expected that global emissions will fall by around 7% in 2020 as a result. However, emissions are already rebounding relatively quickly. Decarbonisation since the onset of COVID-19 largely occured in the first half of 2020 when most countries shutdown public life and large parts of their economy. Consistently achieving double-digit decarbonisation year-on-year will require more structural and transformational changes across all sectors of the economy.
No step-change in progress over the past three decadesThe average rate of annual global decarbonisation observed since 1990 – the earliest available data point – has been just 1.5% per year. Progress has been limited each decade: 1.6% in the 1990s, slowing down to 1.0% in the 2000s and marginally increasing to 2.0% in the 2010s (see Table 2 in the Technical Annex for further details). Although the most recent decade has seen marginally better decarbonisation than the previous two, there has been no noticeable acceleration or step change observed at any point. In comparison, the decarbonisation rate that would be needed each year to achieve the Paris Agreement goals has rapidly compounded, reaching 11.7% per year today.
require unprecedented actionRates of decarbonisation now needed
Even the most drastic historical emissions reductions have not been enough to close the decarbonisation rate gap
The impact of deliberate low carbon interventions – such

PwC | 11
Foreword The Global Picture The Index 2020 Technical Annex Methodology Lead Authors
a green industrial revolutionCOVID-19 recovery packages could ignite
COVID-19 has accelerated the energy transition in a disruptive wayThe energy industry has been on the front line of the impacts of COVID-19. In April 2020, the US oil market made headlines as the WTI futures oil price dipped below zero for the first time in history. The transport sector has seen a dramatic drop in energy use in 2020, particularly in aviation, where the number of commercial passengers is expected to be 35-65% lower in 2020, compared with 2019. The impact of global lockdowns on the transport sector – which represents 57% of global oil demand – has been a key factor in reduced demand for oil this year. In parallel, an increasing number of fossil fuel substitutes are becoming progressively more cost-competitive, with solar now the cheapest source of electricity in history, and green hydrogen expected to be competitive against blue hydrogen in a decade.
In 2020, several major fossil fuel-based energy companies have written off billions of dollars of assets in the aftermath of the initial crisis. In contrast, a number of green energy companies have performed well. Clean energy group NextEra surpassed the market capitalisation of ExxonMobil – once the US’s most valuable company – thought to be driven by increased demand for renewables. Tesla Inc. – the electric vehicle and clean energy company – also saw its market capitalisation value surpass $550bn in November 2020, and joined the S&P 500 in December 2020. However, these changes seen in energy – whilst partly accelerating the transition – will not collectively deliver the pace or scale of change needed over the medium-term.
Recovery packages offer an opportunity to stimulate green growth for the longer termCOVID-19 recovery packages present a unique opportunity to build cleaner and more secure energy systems and generate new employment opportunities. It is critical that policymakers use this moment to drive the wholescale structural changes needed to transition to a greener, more resilient economy. A number of government stimulus packages – set out in the Carbon Brief’s tracker – directly or indirectly support measures aimed at reducing emission, however many COVID-19 recovery packages are insufficient to stimulate green growth sufficiently, and all countries could reinforce this key element as the recovery unfolds in phases over the coming years.
Reinforcing enabling environments will be key to accelerate changeWhile recovery packages are important, governments need to be bold to create a comprehensive enabling environment for rapid decarbonisation, including policy, regulation and market creation. This could include, but is not limited to:● Market-based instruments to price carbon (e.g.
cap-and-trade and carbon taxes); ● Bans and phase outs of certain fossil fuels or uses of
those fuels (e.g. bans on Internal Combustion Engine vehicles and phasing out coal as a power source);
● Reforming fossil fuel subsidies to reflect the full cost of energy (e.g. reforming energy subsidies)
● Implementing mandatory disclosure of climate risks, including using the framework developed by the Taskforce on Climate-related Financial Disclosures (TCFD) (e.g. New Zealand & and the UK);
● Developing globally-aligned standards on non-financial reporting to create a level playing field across countries and regions (e.g. measures to develop common metrics and simplify the corporate reporting system).
Overall, it will take a comprehensive legislative, policy and market package to ensure the enabling environment is fit-for-purpose and increasingly aligned with net zero goals.

PwC | 12
Foreword The Global Picture The Index 2020 Technical Annex Methodology Lead Authors
needed to accelerate actionNew technologies will be
Breakthrough innovation can bolster conventional responsesMany of the technologies and solutions critical to enable net zero transformation across industries are already available at scale (e.g. electric vehicles, solar PV, offshore wind, smart energy grids and connected homes). But many more need rapid commercialisation, acceleration out of the lab or even to be conceptualised. Key technological challenge areas include next generation energy generation and storage, green hydrogen, innovations to decarbonise industrial materials including steel, cement, and plastics, material efficiency and circularity, and sustainable aviation fuels, and carbon capture and removal technologies. Powerful emerging technologies – like Artificial Intelligence (AI), cloud, blockchain, advanced sensors, and synthetic biology and chemistry – are not only enabling solutions to be optimised and scaled, but are offering entirely new business models.
Scaling the nascent climate tech ecosystem is vitalThe three areas that could be most helpful to accelerate and scale climate tech solutions would be to: first, increase funding for the early stage life-cycle of climate tech (from VC to later stage investors), second; foster and attract more talent to climate tech, and; third, increase government funding and policy incentives for climate tech innovation (see our The State of Climate Tech 2020 for further details).
Climate tech is an important part of the responseOur recent PwC report The State of Climate Tech 2020 showed that climate tech venture capital (VC), driven by many of the technologies above, is important and growing at five times the VC market average, across sectors – from agriculture through to the built environment. There are already over 1,200 such startups operating worldwide (see Figure 3), with corporate investors playing an increasingly critical role, representing 25% of investment. Notwithstanding this progress, circa $60bn of investment in 2019 is still much too small given the scale of the climate challenge.
$60BVC invested in climate tech between 2013-19
84%compound annual growth rate (approx. 3750% increase between 2013-19)
1200+climate tech startups identified
$16Bof VC was invested in 590 climate tech deals (representing 6¢ of every VC dollar in 2019)
In 2019
Regional findingsTop 3 Regions
1. North America:
$29B
3. Europe
$7B
2. China
$20B
Top investment hubs 1. San Francisco Bay2. Shanghai 3. Beijing (including mobility)
1. San Francisco Bay2. Boston 3. Berlin (excluding mobility)
Area with the most funding:Mobility and Transport
63%...of total climate tech investment
$37BTotal invested inthis area
151%Compound annual growth rate (CAGR)
Investors
2700Unique investors identified
10Investors with 3+ dealsper year on average
78%Investors with 2 or fewer climate tech deals in total
approx
Unicorns
43Unique investors identified
30...of which Mobility and Transport startups
(Figures have been rounded for brevity)
Figure 3: Headline early stage investing data from PwC’s inaugural State of Climate Tech Report 2020

PwC | 13
Foreword The Global Picture The Index 2020 Technical Annex Methodology Lead Authors
on climate is clearThe case for business action
Businesses are stating their intention to act on climateWhile governments have an important role to play, the tide on climate action is beginning to turn to businesses and financial institutions. Investors increasingly recognize the implications on investment performance and value creation and destruction: over US$45 trillion assets under management (AUM) – close to half of total AUM – is held by investors that have pledged to drive climate action. Over 320 global companies have now made so-called “net-zero before 2050” pledges since 2019, and over 1,000 companies have set science-based climate targets.
Spurred by pressure from investors, customers, regulators, consumers and employees alike, boards are increasingly recognising the imperative to act. It’s becoming clear that many levers to cut operational emissions present a good return; that failure to respond will erode long-term value in particular for higher emitters;
and that there is a considerable value creation opportunity around products and services, and strategic positioning, aligned with a net zero future.
But there is still much more to doOnly around 7% of the world’s largest companies represented by the Global Fortune 500 have pledged to become net zero to date.2 For those that have, there are varying levels of robustness. What we do know is that leading net zero commitments have certain attributes. They are science-based. They take responsibility for tackling value chain emissions including suppliers, products, services and investments. They also explicitly recognize that net zero requires a reshaping of corporate strategy and in turn a firm’s operating model. And they allocate substantial funding for skills, innovation and R&D to reflect the importance of new capabilities, technologies and business models.
Moving from Ambition to Business TransformationOur Low Carbon Economy Index shows the rapid transition that is needed to get to the Paris targets and ultimately to 1.5°C. Businesses need to play their part, by developing business models compatible with a net zero future.
Establishing a credible net zero ambition and strategy is critical to a company starting their net zero journey. Most companies are still at the very early stages of embedding net zero into business and supply chain strategy and transformation efforts. Our report with Microsoft on The Building Blocks for Net Zero Transformation provides a practical guide for functional heads across a business to embed the necessary actions to achieve net zero business transformation.
2 PwC calculations based on analysis from the PwC and Microsoft report: The Building Blocks for Net Zero Transformation.
AmbitionAligned to achieving global net zero by no later than 2050 & to limit warming to 1.5oC
1
EnterpriseKey operating model changes in support of transformation
4FinanceFinancing the net zero transformation
7
GovernanceAccountability driven from the top
2
Supply ChainsTransformed net zero supply chain
5TransparencyCommunicating action8
StrategyEmbedded and aligned net zero into company strategy
3
InnovationDeveloped innovation and technologies to deliver net zero
6EngagementEnhancing the pace and scale of net zero action
9

PwC | 14
Foreword The Global Picture The Index 2020 Technical Annex Methodology Lead Authors
Looking forward to 2021
The world knocked back by COVID-19Many were billing 2020 to be the year for supercharging climate ambition, with a pivotal COP26 in the UK* scheduled to accelerate the “race to net zero” by countries, cities, companies and investors alike. Unforeseeably, the COVID-19 crisis put the brakes on this pivotal political milestone (now set for November 2021) and has created immense social and economic disruption. Economies and societies continue to feel the impacts caused by the evolving COVID-19 crisis and it will take time for countries to readjust to a new economic and social equilibrium. Moreover, the crisis has served as a harsh reminder of the fragile systems upon which our economies and societies are built, and exposed our vulnerabilities to not only global pandemics but other systemic global shocks, including climate change.
Can climate action emerge stronger from the crisis? In response to the events of 2020, and the ongoing climate crises, there has been a resurgence of action on climate across the public and private sectors. Many countries have come forward with new climate pledges and vowed to make climate and the environment key pillars of their COVID-19 stimulus packages. Indeed, some of largest emitters and those with the fastest growing emissions have enhanced their commitments and made net zero pledges. This could be an historic tipping point. With President-elect Biden in office, the US*, China*, EU*, Japan and South Korea – representing two-thirds of the world economy and over 50 per cent of global greenhouse gas emissions – have pledged to go net zero by mid-century, or by 2060 in the case of China. Hundreds of global companies have set the ambition to go net zero, too.
Turning momentum on climate ambition into tangible and widespread actionIf this decade is to be the pivotal decade on climate change, ambition needs to turn to action, and rapidly. Governments need to turn their net zero aspirations and targets into clear roadmaps with supportive enabling environments to realise wholescale structural change across all sectors of the economy. It is clear that with countries, states and cities amounting to more than 50% of global GDP setting net zero targets, the pressure to act will grow quickly across the economy. Businesses will need to react quickly, transforming their strategies, operations and supply chains to a net zero trajectory as soon as possible, and investors will need to embed net zero into their risk management and portfolio allocation. The collective level of action that emerges at the start of this decade will determine if this is the pivotal decade of action that marks the turning point on the road to net zero.
Follow our views on climate change on @PwC_ClimateReady
>50%countries, states and cities amounting to more than 50% of global GDP have set net zero targets
* See Country Spotlight in Technical Annex

Technical Annex

PwC | 16
Foreword The Global Picture The Index 2020 Technical Annex Methodology Lead Authors
Spotlight on: China
China has passed a total of US$648 billion in fiscal stimulus which focuses on support for industry and infrastructure projects.
China has implemented specific policies for electric vehicle subsidies and charging infrastructure development. These make up a small proportion of the total package, which largely provides support for energy-intensive sectors including coal power generation and aviation.
COVID stimulus packages
Current: China aims to achieve carbon neutrality before 2060 and peak its emissions before 2030. It also plans to lower carbon dioxide emissions per unit of GDP by over 65% by 2030, compared with 2005. According to the Climate Action Tracker, should the commitment be met, it would lead to a reduction in global warming projections of 0.2 to 0.3°C by 2100.
Proposed: China has not yet announced an enhanced NDC for the period up to 2030.
Climate and energy
Biodiversity COP. China will host the 15th United Nations Convention on Biological Diversity (CBD) Conference of the Parties (COP15) in Kunming in 2021.
Five-year plan. The Chinese Government is currently developing the comprehensive 14th Five-Year Plan for the period 2021-2025, the outcomes of which will have implications for the make-up and trajectory of the energy industry.
Key international and national developments
28.1%Share of global energy-related CO2 emissions*
2.8%Decarbonisation of energy-related CO2 emissions 2018-2019*
17.3%Share of global GDP (PPP current international $)*
12.7%Energy consumption from renewables*
* Net Zero Economy Index 2020 analysis.

PwC | 17
Foreword The Global Picture The Index 2020 Technical Annex Methodology Lead Authors
Spotlight on: EU
The EU stimulus package totals €1.33 trillion, including its Next Generation EU package.
The package includes a variety of green measures of approximately €550bn value, covering green jobs creation, energy efficiency and sectoral measures. All spending is meant to be consistent with the Paris Agreement and the Green Deal’s ‘do no harm’ principle.
COVID stimulus packages
Current: The EU’s current NDC is to cut its emissions by at least 40% below 1990 levels, by 2030.
Proposed: The European Commission confirmed plans for the 2030 Climate Target Plan which raises the 2030 target to cut emissions by 55% compared with 1990 levels.
Climate and energy
The European Green Deal. Launched in December 2019, it is the centrepiece of the EU’s plans to reach net zero emissions by 2050. This deal includes major investments in new technologies, public transport and energy efficiency measures. Under the plan, the energy sector will transition to renewable energy, with hydrogen set to be widely deployed to decarbonise the otherwise hard-to-abate sectors.
European Investment Bank. European Governments have committed to turn the European Investment Bank into a “climate bank” with 1 trillion green investment package to be spent by 2030, including ending funding for fossil fuels and airport expansion by 2022.
9.8%Share of global energy-related CO2 emissions*
5.2%Decarbonisation of energy-related CO2 emissions 2018-2019*
15.3%Share of global GDP (PPP current international $)*
15.2%Energy consumption from renewables*
Key international and national developments
* Net Zero Economy Index 2020 analysis.

PwC | 18
Foreword The Global Picture The Index 2020 Technical Annex Methodology Lead Authors
Spotlight on: UK
The UK has passed US $628 billion in fiscal measures in response to COVID-19. This includes ‘green’ measures relating to energy, industry and transport, but these make up a small proportion of the total and the package also provides support to polluters.
UK Prime Minister Boris Johnson’s 10-point plan for a green recovery pledges £12bn in investment across a range of initiatives including wind power, hydrogen, nuclear and carbon capture, as well as targeting specific sectors including housing, transport and hard-to-abate aviation and maritime.
PwC analysis shows that an additional £400bn is required in green infrastructure over the next decade if the UK is to meet its net zero target.
COVID stimulus packages
Climate and energy
Current: The UK has so far been covered by the EU’s NDC and has set a long term goal of net zero by 2050.
Proposed: The UK recently announced a new plan to aim for at least a 68% reduction in GHG emissions by 2030, compared with 1990 levels.
COP26 presidency. The UK is serving as the President of the 26th Conference of Parties (COP26) of the United Nations Framework Convention on Climate Change, now due to meet in November 2021. COP26 is the most significant climate moment since COP21 in Paris, 2015. The world is looking to COP26 to raise global ambition on climate change to the level required to meet the Paris Agreement goals and complete the Paris Agreement Rulebook.
Key international and national developments
1.1%Share of global energy-related CO2 emissions*
4.0%Decarbonisation of energy-related CO2 emissions 2018-2019*
2.4%Share of global GDP (PPP current international $)*
14.5%Energy consumption from renewables*
* Net Zero Economy Index 2020 analysis.

PwC | 19
Foreword The Global Picture The Index 2020 Technical Annex Methodology Lead Authors
Spotlight on: US
The US has passed a US$2.98 trillion spending package for COVID recovery.
This includes support for airlines, transport infrastructure, shipping, trucking and agriculture. Whilst around US$250m went to clean energy industries, over US$3.5bn stimulus was assigned to carbon-intensive industries. Stimulus funding from some states has been more green focussed, particularly in the states of New York and California.
COVID stimulus packages
Current: Under the Paris Agreement, the US ratified a 2025 target of a 26-28% reduction from 2005 levels and a long-term goal of 80% below 2005 levels by 2050, however it has now withdrawn from the accord.
Proposed: The incoming administration has signalled its intention to rejoin the Paris Agreement and to bring to U.S. to net zero emissions no later than 2050. This is yet to be formalised. Upon re-entering the Paris Agreement the US will be required to submit an enhanced NDC for the period up to 2030
The Biden Plan for a Clean Energy Revolution and Environmental Justice. The incoming US administration has announced its intention to rejoin the Paris Agreement, pledging a $2 trillion clean energy revolution, and signalling more ambitious climate targets. The plan proposes a 100% clean energy economy, to reach net-zero emissions no later than 2050, and to ‘rally the rest of the world to meet the threat of climate change’.
14.8%Share of global energy-related CO2 emissions*
4.7%Decarbonisation of energy-related CO2 emissions 2018-2019*
15.8%Share of global GDP (PPP current international $)*
8.7%Energy consumption from renewables*
Climate and energy
Key international and national developments
* Net Zero Economy Index 2020 analysis.
PwC | 20
Foreword The Global Picture The Index 2020 Technical Annex Methodology Lead Authors
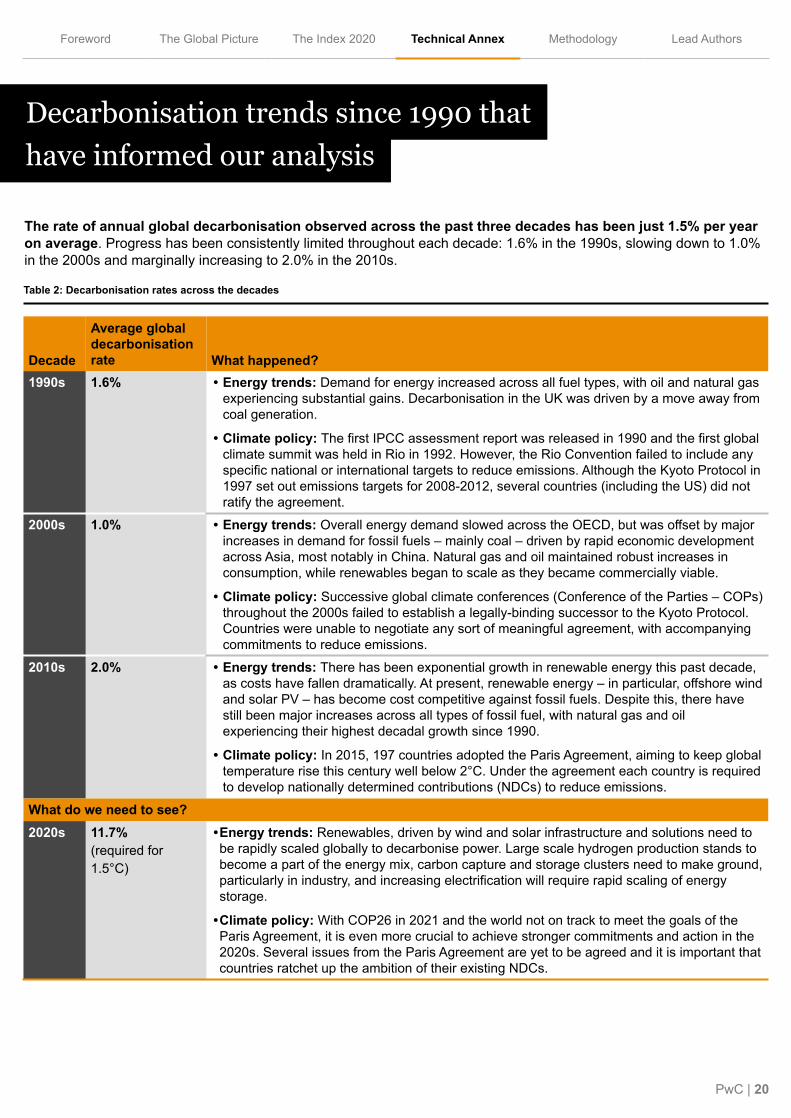
The rate of annual global decarbonisation observed across the past three decades has been just 1.5% per year on average. Progress has been consistently limited throughout each decade: 1.6% in the 1990s, slowing down to 1.0% in the 2000s and marginally increasing to 2.0% in the 2010s.
Decade
Average global decarbonisation rate What happened?
1990s 1.6% • Energy trends: Demand for energy increased across all fuel types, with oil and natural gas experiencing substantial gains. Decarbonisation in the UK was driven by a move away from coal generation.
• Climate policy: The first IPCC assessment report was released in 1990 and the first global climate summit was held in Rio in 1992. However, the Rio Convention failed to include any specific national or international targets to reduce emissions. Although the Kyoto Protocol in 1997 set out emissions targets for 2008-2012, several countries (including the US) did not ratify the agreement.
2000s 1.0% • Energy trends: Overall energy demand slowed across the OECD, but was offset by major increases in demand for fossil fuels – mainly coal – driven by rapid economic development across Asia, most notably in China. Natural gas and oil maintained robust increases in consumption, while renewables began to scale as they became commercially viable.
• Climate policy: Successive global climate conferences (Conference of the Parties – COPs) throughout the 2000s failed to establish a legally-binding successor to the Kyoto Protocol. Countries were unable to negotiate any sort of meaningful agreement, with accompanying commitments to reduce emissions.
2010s 2.0% • Energy trends: There has been exponential growth in renewable energy this past decade, as costs have fallen dramatically. At present, renewable energy – in particular, offshore wind and solar PV – has become cost competitive against fossil fuels. Despite this, there have still been major increases across all types of fossil fuel, with natural gas and oil experiencing their highest decadal growth since 1990.
• Climate policy: In 2015, 197 countries adopted the Paris Agreement, aiming to keep global temperature rise this century well below 2°C. Under the agreement each country is required to develop nationally determined contributions (NDCs) to reduce emissions.
What do we need to see? 2020s 11.7%
(required for1.5°C)
•Energy trends: Renewables, driven by wind and solar infrastructure and solutions need to be rapidly scaled globally to decarbonise power. Large scale hydrogen production stands to become a part of the energy mix, carbon capture and storage clusters need to make ground, particularly in industry, and increasing electrification will require rapid scaling of energy storage.
•Climate policy: With COP26 in 2021 and the world not on track to meet the goals of the Paris Agreement, it is even more crucial to achieve stronger commitments and action in the 2020s. Several issues from the Paris Agreement are yet to be agreed and it is important that countries ratchet up the ambition of their existing NDCs.
Table 2: Decarbonisation rates across the decades
have informed our analysisDecarbonisation trends since 1990 that

Methodology

PwC | 22
Foreword The Global Picture The Index 2020 Technical Annex Methodology Lead Authors
Methodology
The Net Zero Economy Index
The Net Zero Economy Index tracks the decarbonisation of energy-related CO2 emissions worldwide. The analysis is underpinned by the BP Statistical Review of World Energy, which reflects carbon emissions based on the consumption of oil, gas and coal for combustion related activities. The analysis does not consider emissions from other sectors (e.g. AFOLU) or from any other greenhouse gases, and does not allow for any carbon that is sequestered. As a result, this data cannot be compared directly with national emissions inventories.
The purpose of our model is to calculate carbon intensity (tCO2/$m GDP) for different countries and the world, and the rate of carbon intensity change needed in the future to limit warming to 2°C by 2100.
The countries the study focuses on are individual G20 economies, as well as world totals. The G20 is also portioned into 3 blocks: G7 economies (US, Japan, Germany, UK, France, Italy, Canada), E7 economies which covers the BRICs (Brazil, Russia, India and China), and Indonesia, Mexico and Turkey and other G20 (Australia, Korea, EU, South Africa, Saudi Arabia, Argentina).
For GDP data, the study draws on World Bank historical data. For long-term GDP projections the study draws on the latest version of PwC’s ‘World in 2050’ model. This was last published in February 2017 and details and a methodology summary can be found here: http://www.pwc.com/world2050. This year we used near-term economic forecasts from the IMF to account for the impact of the COVID-19 pandemic on GDP in 2021.
For emissions, the study considers energy-related CO2 emissions drawn from the BP Statistical Review (2020). This year we updated the emissions factors we use to align with those used by BP and the IPCC.
We use the Intergovernmental Panel on Climate Change global estimated carbon budget data on fossil fuel emissions taken from the IPCC Special Report on Global Warming of 1.5°C, to estimate the energy-related CO2 emissions associated with limiting warming to 1.5°C and 2°C by 2100.

The Index 2020Lead Authors

PwC | 24
Foreword The Global Picture The Index 2020 Technical Annex Methodology Lead Authors
Lead Authors
Acknowledgements:We would like to thank the following for their valued contributions to the report:Mary Davies (PwC UK), Adrian Del Maestro (PwC UK), Colm Kelly (PwC Global), Lit Ping Low (PwC HK), Brigham McNaughton (PwC US), Rowena Mearley (PwC UK), Ella Sexton (PwC UK), Andrew Thurley (PwC Middle East), John Tomac (PwC Australia)
Matt GilbertSenior Associate, Sustainability & Climate Change
PwC United [email protected]
Benjamin CombesAssistant Director, Innovation & Sustainability
PwC United [email protected]
Kiran SuraAssistant Director, Sustainability & Climate Change
PwC United [email protected]
Dr Celine HerweijerPartner, Global Climate Change Leader
PwC United [email protected]

This publication has been prepared for general guidance on matters of interest only, and does not constitute professional advice. You should not act upon the information contained in this publication without obtaining specific professional advice. No representation or warranty (express or implied) is given as to the accuracy or completeness of the information contained in this publication, and, to the extent permitted by law, PricewaterhouseCoopers LLP, its members, employees and agents do not accept or assume any liability, responsibility or duty of care for any consequences of you or anyone else acting, or refraining to act, in reliance on the information contained in this publication or for any decision based on it.
© 2020 PricewaterhouseCoopers LLP. All rights reserved. PwC refers to the UK member firm, and may sometimes refer to the PwC network. Each member firm is a separate legal entity. Please see www.pwc.com/structure for further details.
Mitie Design RITM3897746 (11/20).