Net Entertainment’s mission is to develop the best ... · a number of major bingo sites, which is...
60
Net Entertainment’s mission is to develop the best Internet based gaming solutions using cutting edge technology and expertise. With our many years of experience of casino operations, we deliver systems that are robust, scaleable, secure and cost-effective. ANNUAL REPORT 2007
Transcript of Net Entertainment’s mission is to develop the best ... · a number of major bingo sites, which is...

Net Entertainment’s mission is to develop the best Internet based gaming solutions using cutting edge technology and expertise. With our many years of experience of casino operations, we deliver systems that are robust, scaleable, secure and cost-effective.
AnnuAl RepoRt 2007

Content
1 Summary of the year 2 Net Entertainment in brief 4 CEO’s comments 6 Business concept, goals and strategy 7 Business and revenue model 8 Operations 14 Market 20 Employees 22 Five-year summary of results 23 Key figures and definitions 24 The Share 26 Board of Directors’ Report 33 Group’s financial reports 37 Parent Company’s financial reports 42 Notes 55 Auditor’s Report 56 Board of Directors
NET ENTERTAINMENT | 2007 1
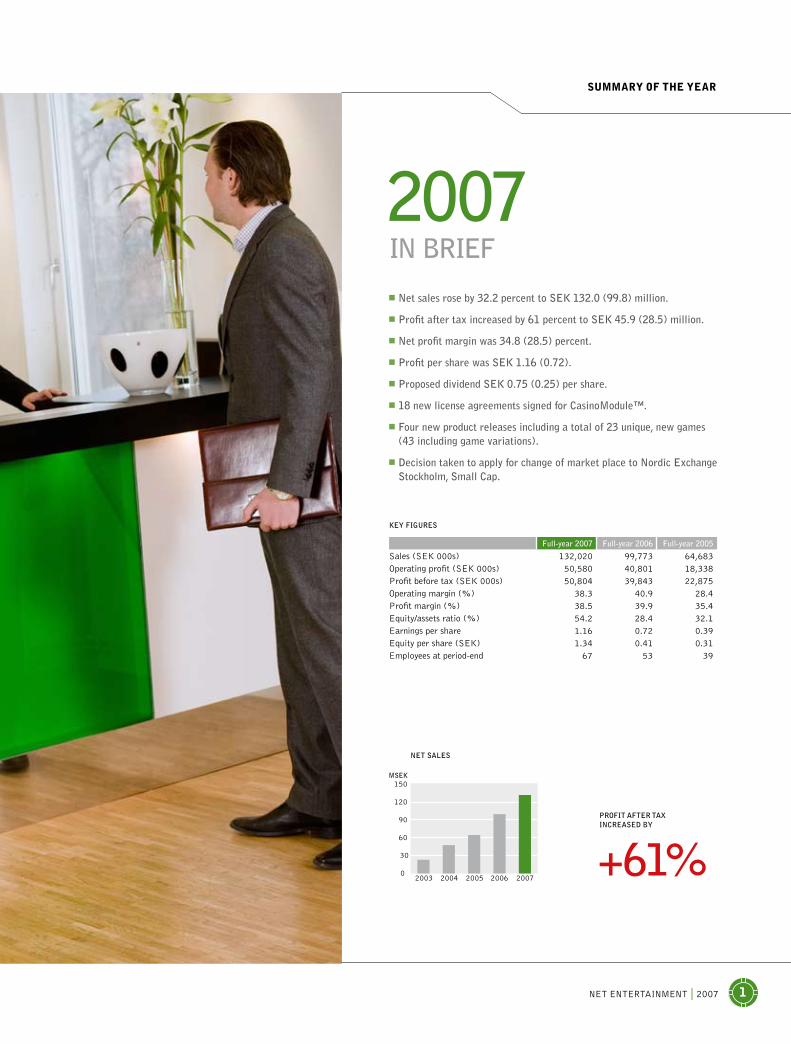
in bRief2007n net sales rose by 32.2 percent to SeK 132.0 (99.8) million.
n profit after tax increased by 61 percent to SeK 45.9 (28.5) million.
n net profit margin was 34.8 (28.5) percent.
n profit per share was SeK 1.16 (0.72).
n proposed dividend SeK 0.75 (0.25) per share.
n 18 new license agreements signed for CasinoModule™.
n four new product releases including a total of 23 unique, new games (43 including game variations).
n Decision taken to apply for change of market place to nordic exchange Stockholm, Small Cap.
Summary of the year
KeY FIGUReS
Full-year 2007 Full-year 2006 Full-year 2005
Sales (SEK 000s) 132,020 99,773 64,683Operating profit (SEK 000s) 50,580 40,801 18,338Profit before tax (SEK 000s) 50,804 39,843 22,875Operating margin (%) 38.3 40.9 28.4Profit margin (%) 38.5 39.9 35.4Equity/assets ratio (%) 54.2 28.4 32.1Earnings per share 1.16 0.72 0.39Equity per share (SEK) 1.34 0.41 0.31Employees at period-end 67 53 39
net SaleS
PRoFIt aFteR tax InCReaSed bY
0
30
60
90
120
150MSEK
2003 2004 2005 2006 2007+61%

2 NET ENTERTAINMENT | 2007
net enteRtAinMent is a leading supplier of digitally distributed gaming software. The Compa-ny focuses on innovative products that provide high entertainment value as well as exceptional reliability and security for all gaming transactions. Today, casino games are the Company’s primary product. The Company was established in 1996 and has a significant presence in the gaming mar-ket, with about fifty reputable operators as its customers, including Unibet, Bet-at-Home, Bet24, Betsson and NordicBet. The Company is headquartered out of Stockholm where all development historically has been undertaken. Sales, marketing and product management is handled out of the Malta office to ensure closeness to the Company’s customers. At present, the Company employs approximately 80 people. Its shares have been traded on the NGM Equity Stock Exchange since April 2007.
thiS iSNet eNtertaiNmeNt
offeRing
“betteR gAMeS”
Net eNtertaiNmeNt iN brief
Net Entertainment’s core product, CasinoModule™, is a complete gaming platform consisting of a large number of casino games and a powerful administration tool. CasinoModule™ is licensed to a wide and expanding circle of customers who have access to new releases and a range of services including hosting, system surveillance, technical support and account management. The Company’s motto is "Better Games" and this embraces every single aspect - from the graphics, features and sound to service offerings and product reliability.

NET ENTERTAINMENT | 2007 3
thiS iSNet eNtertaiNmeNt
CoMpetitive ADvAntAgeS
CReAtivity AnD ReliAbilityNet Entertainment focuses on delivering games that provide top entertainment value where as superior graphic design, sound and game logic are a few factors that set the Company apart. Through its domain expertise and close collaboration with its licensees, the Company ensures its ongoing development of games and features demanded by the market. Net Entertainment owes much of its success to the fact that it offers a high level of innovation, pace of development and reliability - factors that are becoming increasingly important as the gaming operators find that rivalry for the end users is growing fiercer.
On a global scale, the online gaming market is expected to produce a turnover of SEK 102 billion in 2008. Casino gaming accounts for approximately 20 percent of this figure1). Despite strong growth in the past, online gaming still only accounts for just under five percent of the total global gaming turnover. This underscores the potential in the market that the Company is targeting. Growth in Europe, which is Net Entertainment’s main market, is expected to reach 20 percent in 2008.
1) Global Betting and Gaming Consultants, 2008
MARKet
MAjoR MARKet with StRong gRowth
buSineSS MoDel
when ouR CuStoMeRS eARn Money, So Do weNet Entertainment licenses its product based on a start-up and delivery fee, and a recurring royalty (a monthly license fee) whose amount is determined by the profit generated by the prod-uct. By regularly releasing new and innovative games, better administration capabilities and a reliable operating environment, the Company can help increase gaming activity in the licensees’ casinos and thereby increase revenue and earnings.
Net eNtertaiNmeNt iN brief
the total onlIne maRKet valUe 2005–2009e
0
20
40
60
80
100
120MDSEK
2005 2006 2007 2008 2009Source: GBGC

4 NET ENTERTAINMENT | 2007
why we’ll Soon be leADing the MARKet
CoMpetitionWith mounting competition, it becomes in-creasingly important for the operators to retain and attract new players. This will in-crease the pressure on the systems providers and those not capable of keeping up with the market demand will find themselves losing business. Our Company has successfully ad-vanced into a leading position in the product development market and this has consolidated the competitive strength of our own Company and our customers.
More recently, we have seen a number of mergers among both operators and providers and more are likely to follow. Our Company intends to take an active role in the market restructuring in order to ensure the continua-tion of our strong and strategic position.
A ChAnging MARKet2007 saw an expansion of our customer base to include new operator segments plus a grad-ual repositioning of our existing licensees to service a wider clientele. This has resulted in changing gaming behaviour, with a particular increase in popularity among innovative games offering high entertainment value. Thanks to a flexible and customer-driven development
process, we have swiftly adapted our product development in response to the changed mar-ket conditions. This has contributed to our strong financial performance.
new CuStoMeRSIn 2007, 18 operators chose Net Entertainment as their casino provider, including GamingVC, one of the largest gaming operators in the Ger-man market. We also signed agreements with a number of major bingo sites, which is one of the fastest growing market segments. For some time, we have been focusing on Tier 1 opera-tors. The agreements we signed with Gam-ingVC and bet-at-home.com in early 2008 are direct results of this strategy and the market is showing great interest in our product.
pRoDuCt DevelopMentDuring 2007, Net Entertainment’s technology department made the transition to Scrum (an agile process for developing software, based on delegation, short development cycles and teamwork). The outcome of this transition has been very positive and has led to greater em-ployee satisfaction, productivity and product quality. We have also introduced a number of
Our Company has successfully advanced into a leading position in the product development market and this has consoli-dated the competitive strength of our own Company and our customers.
net entertainment continued to reap successes throughout 2007 with an impressive list of new license agreements, healthy growth and high profitability. this proves the strength of our business model and our product offerings. our many successes are due to a focused strategy and cutting-edge expertise, which have enabled net entertainment to cement its place as a leading company in the online gaming market.
meSSage from the Ceo

NET ENTERTAINMENT | 2007 5
measures aimed at promoting employee well-being in order to create a satisfying workplace. One such measure is a bonus scheme for all employees.
In the gaming operators’ struggle to win the players, a regular stream of new games is becoming an increasingly central and key competitive edge. In 2007, we delivered 23 unique, new games, which is almost two new games a month! Games development is an art that demands a combination of skills that work together to ensure a successful end result.
new pRoDuCtSCasinoCafé™ will soon be put into opera-tion as part of a pilot project. This product has generated much interest from the mar-ket and we feel it offers very interesting po-tential through the combination of the cost
benefits of an online casino and the market potential in physical distribution. We are also on the point of launching our first ever multi-player casino game, which represents a new gaming segment for our Company.
futuRe pRoSpeCtSThanks to the hard work of our employees, Net Entertainment is better equipped for suc-cess than ever and I am convinced that over the coming year our Company will continue to experience strong growth and high profit-ability.
Stockholm, March 11, 2008
Johan Öhman
President and CEO
In 2007, we delivered 23 unique, new games, which is almost two new games a month!
meSSage from the Ceo

6 NET ENTERTAINMENT | 2007
buSiNeSS CoNCept, objeCtiveS & Strategy
gRowth
objectives: To grow more than the market
achievement: 32% on a market that has grown by 23%
+32%
buSineSS ConCept
net entertainment shall provide robust systems for Internet gaming with exciting games, created using cutting-edge technology and expertise, for gaming operators who can thereby expand their product portfolios and increase their profits.
StRAtegy
n Continued close collaboration with our customers to better serve their needs and requirements.
n ongoing analysis of developing trends and news in the gaming market.
pRofitAbility
objectives: Operating margin above 35%
achievement: Operating margin of 38.3% for the year
+38.3%
new CuStoMeRS
objectives: To sign 10-15 new license agreements
achievement: 18 new license agreements
+18
n Retain and develop industry-related expertise to be able to provide market-leading games and features.
n increased product offering to increase sales and attract new customers.
ouR objeCtiveS 2007
NET ENTERTAINMENT | 2007 7
oveRRiDing objeCtiveS
opeRAtionAl goAlSprofitable growthNet Entertainment strive for profitable growth. Growth may be achieved organically and in new service segments, such as Soft Games, and in new geographic markets. Net Entertainment also intends to play an active role in the ongo-ing process of consolidation of the industry and the Company is continuously evaluating potential acquisition opportunities.
Cost effectivenessSince Net Entertainment operates in a competi-tive market, cost-effectiveness is crucial to the Company’s competitiveness. This approach will permeate all the Company’s activities. Admin-istrative costs will be kept to a minimum and efficient planning will ensure that personnel expenses and other operating costs represent a smaller share in relation to the Company sales over time.
pleasant workplaceNet Entertainment will work to create and maintain a pleasant and secure work envi-ronment in order to attract and retain skilled personnel. The work environment is character-ized by trust, openness and participation. Net Entertainment will ensure a favourable work environment and the Company will promote health care, while counteracting illness in other ways. finAnCiAl objeCtiveSThe following overriding financial objectives shall guide the Group’s activities and should be viewed over a longer period (such as a busi-ness cycle):
n Sales growth shall be higher than the market average (as compared to similar companies)
n Operating margin at the EBIT level will remain high
buSiNeSS aND reveNue moDeL
the pRoDuCtS geneRAte gRowth
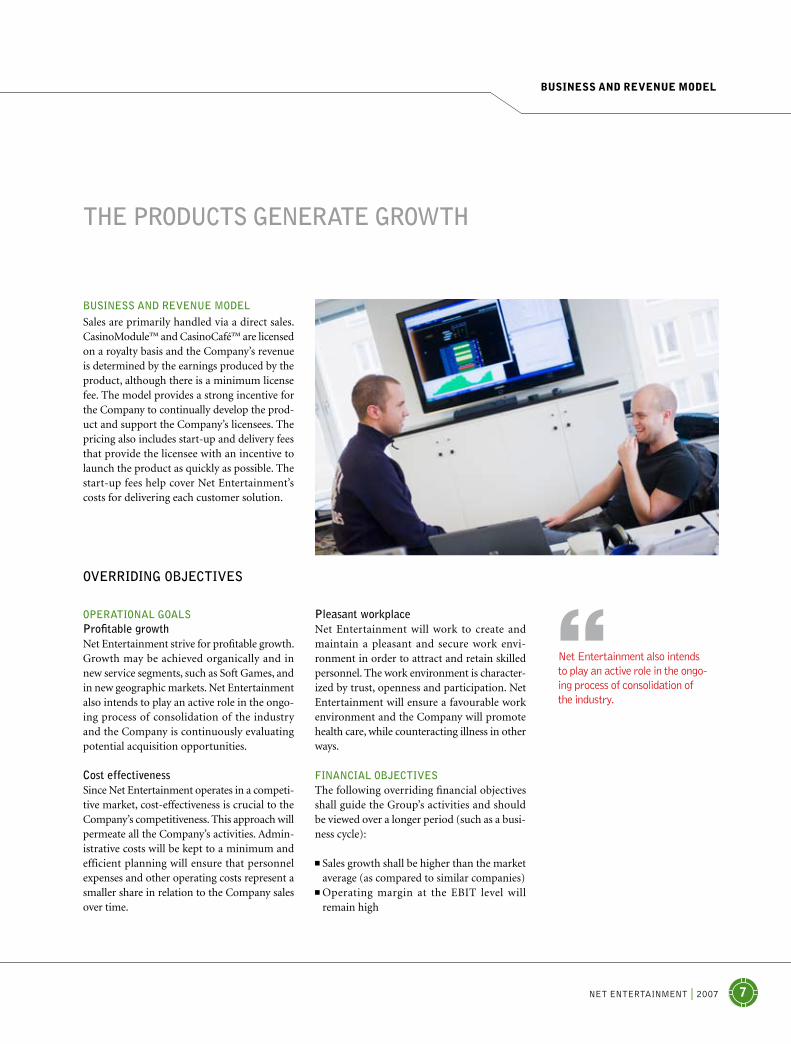
buSineSS AnD Revenue MoDel
Sales are primarily handled via a direct sales. CasinoModule™ and Casino Café™ are licensed on a royalty basis and the Company’s revenue is determined by the earnings produced by the product, although there is a minimum license fee. The model provides a strong incentive for the Company to continually develop the prod-uct and support the Company’s licensees. The pricing also includes start-up and delivery fees that provide the licensee with an incentive to launch the product as quickly as possible. The start-up fees help cover Net Entertainment’s costs for delivering each customer solution.
Net Entertainment also intends to play an active role in the ongo-ing process of consolidation of the industry.

8 NET ENTERTAINMENT | 2007
MARKet-leADing SupplieR of gAMing SoftwARe
operatioNS
Net Entertainment is a leading supplier of digitally-distributed gaming software. The Company was established in 1996 in response to a rapidly expanding Internet market. The Company is a pure development company and operates on an international market. Its head office is located in Stockholm where the majority of the 70 employees are based. All commercial operations, including sales, ac-count management, marketing and product management, are handled by the Company’s subsidiary in Malta where the majority of the Company’s customers are located.
oFFeRInGNet Entertainment is a premium supplier whose brand is associated with quality, reliability and innovation. The Company has followed a niche strategy, which has contributed to the market success of CasinoModule™. This is confirmed by the fact that many successful gaming opera-tors are now using CasinoModule™.
It is estimated that the online casino gaming market currently produces a gaming surplus of about SEK 20 billion per annum, making it one of the largest gaming segments together with wagering and poker1). Even if Net Enter-tainment is a niche supplier today, the size of the underlying market shows the potential for the Company.
The Company intends to expand its product range and thereby also cover related product areas as part of its growth strategy. Net Enter-tainment’s goal is to provide the best Inter-
net based gaming solutions using innovative technology and cutting-edge expertise. Games with high entertainment value, a powerful and user-friendly administration tool, exten-sive language support and frequent product releases are just a few of the features that set Net Entertainment apart. The Company is re-sponsible for the gaming concepts and prod-uct development, while the gaming operators are responsible for offering the products to the end customers - the players. The Com-pany is aware that the services provided are equally as important as the actual software. The combination of products and services is fundamental for creating a successful online gaming business. Our motto "Better Games" sums this up.
ReSponSible gAMingNet Entertainment plays an active role in the prevention of gaming-related problems, such as gaming addiction. CasinoModule™ fully supports the guidelines that the organisation G4 has established for responsible gaming. The Company also fulfills the requirements of the Maltese Lotteries and Gaming Authority (LGA) with regard to responsible gaming.
CasinoModule™ has been accredited as meeting the criteria for randomness by the Swedish National Laboratory of Forensic Sciense (SKL) and Technical Systems Testing (TST), which is an independent, Canadian testing institute. Furthermore, every new game that is introduced is approved by the Maltese Lotteries and Gaming Authority.
DiD you kNow that…
Net entertainment has accumulated more than 40 years of casino experience.
net entertainment ne ab(Sweden)
Net Entertainment Malta Holding Ltd.
(Malta)
Net Entertainment Malta Ltd. (Malta)
Mobile Entertainment ME
AB(Sweden)
B2B
B2CGame ConCePt oPeRatoR
end CUStomeR(Player)
PlatFoRm &develoPment oF GamInG
1) Global Betting and Gaming Consultants, January 15, 2008

NET ENTERTAINMENT | 2007 9
PRodUCtS and SeRvICeS
CASinoMoDule™Net Entertainment’s CasinoModule™ is a ca-sino platform consisting of a complete set of casino games and a powerful administration tool.
CasinoModule™ has been designed for simple integration with existing websites. Us-ing existing infrastructures such as payment and CRM systems, the IT architecture can be kept simple and the operating costs to a mini-mum. Net Entertainment manages hosting and system surveillance which means that the gaming operators are able to concentrate on their core business.
CasinoModule™ offers the very latest in gaming online, giving gaming operators a competitive advantage in this fiercely com-petitive market. Four times a year, the licen-sees receive a new product release that includes
several new games and system functions. As the industry continues to expand and mature, greater priority is being placed on reliability and availability. Net Entertainment is therefore continuously investing in R&D. The Company follows a strict development process to ensure superior product quality. A casino generates a vast number of transactions and CasinoMod-ule™ handles far more than a medium-sized stock exchange. This underscores the impor-tance of reliability and being able to follow up and manage all aspects of the operations. Casino Module™ makes this possible thanks to its powerful administration tool. The system offers powerful reporting capability, tourna-ment and bonus management and real time data. CasinoModule™ currently supports 21 languages, which is vital for todays gaming operators with international operations.
DiD you kNow that…
Net entertainment’s software, Casinomodule, has been voted as one of the top 20 gaming software in the world.
operatioNS

10 NET ENTERTAINMENT | 2007
CASinoCAfé™Despite strong growth in the online gam-ing sector, 95 percent of all casino gaming still takes place in bricks and mortar casinos. CasinoCafé™ is a cost-effective alternative for gaming operators that wish to address the physical casino market.
CasinoCafé™ combines the cost-efficiency of an online casino with the potential of dis-tribution through physical outlets. Casino-Café™ is similar to an Internet Café where players can deposit money and have one-time accounts that allow them to play casino games. Since the system is based on the use of standard PC terminals, the up-front invest-ment for the operator is minimal. The system has the same games and administration tool as CasinoModule™, and a cashier system for handling deposits and withdrawals, as well as administering player accounts.
CasinoCafé™ comes with a customised web interface so that the players can log in and gain access to the games. Since CasinoCafé™ is based on CasinoModule™ the margin costs for Casino-Café™ are minimal.
operatioNS
MultiplAyeR gAMeSturkish pokerIn 2007, Net Entertainment introduced a Turkish Poker game (Türk Pokeri) which is a P2P solution based on local rules. With 73 mil-lion inhabitants, Turkey is a rapidly expanding market for online gaming. The increasing in-terest is very much due to the fact that gaming plays a natural role in Turkish culture. Like CasinoModule™, this product is based on modern web technologies and has been well accepted by the market.
Turkish Poker is rather similar to the well-known game Five-Card Draw and each table seats 2 to 5 players. Turkish Poker is played with a reduced deck of cards, with the number of cards depending on the number of players. The solu-tion offers both ring games and tournaments.
SeRviCeSNet Entertainment provides a wide range of services to its licensees. The graphics of the games are adapted for each customer to ensure uniqueness and compatibility with the gaming operator’s website. Moreover, the Company
hIStoRYNet Entertainment was established in 1996 by one of Scandinavia’s leading off-line casino operator and the Company became one of the pioneers in online gam-ing. The Company was set up in response to the growing Internet market and the objective was to establish the Company as an online casino operator. Since no suit-able commercially competitive casino soft-ware was available, the Company decided to develop the requisite software itself. The first casino was launched in 2000 with four more following. 2002 marked the launch of CasinoModule™ and shortly after the Company signed a contract with the first sportsbook licensee. In January 2005, the casino operations were sold and Net Entertainment became a dedicated software developer.
CasinoCafé™ combines the cost-efficiency of an online casino with the potential of distribution through physical outlets.
NET ENTERTAINMENT | 2007 11
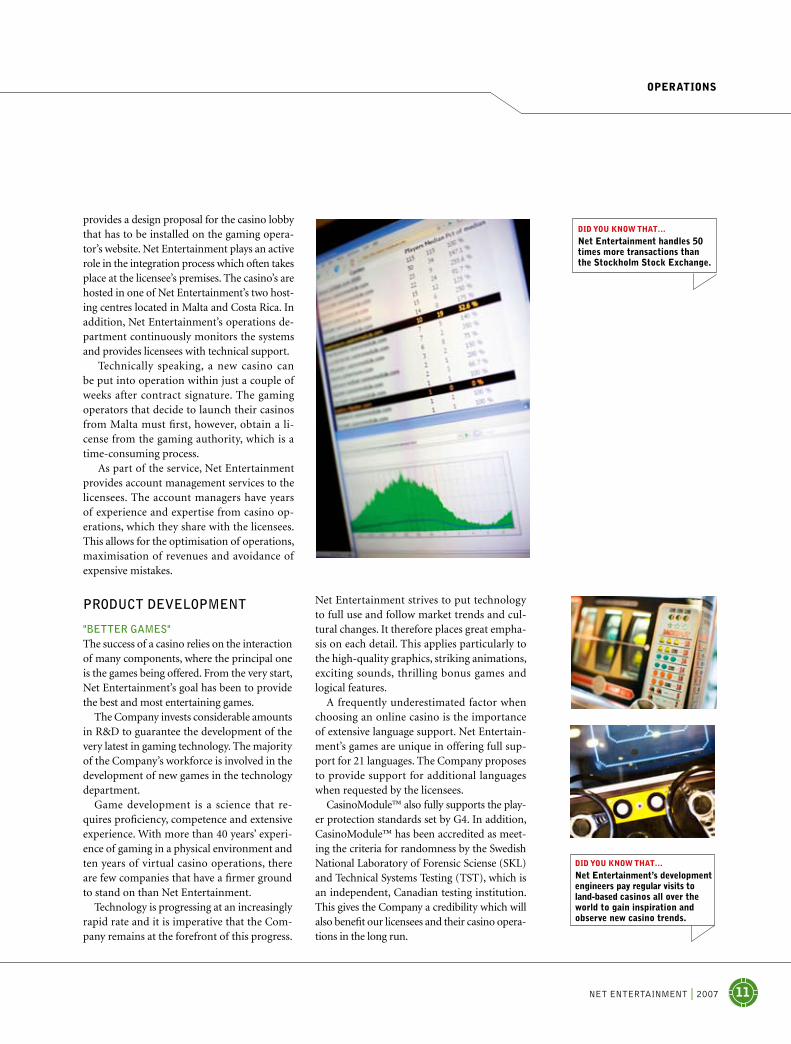
provides a design proposal for the casino lobby that has to be installed on the gaming opera-tor’s website. Net Entertainment plays an active role in the integration process which often takes place at the licensee’s premises. The casino’s are hosted in one of Net Entertainment’s two host-ing centres located in Malta and Costa Rica. In addition, Net Entertainment’s operations de-partment continuously monitors the systems and provides licensees with technical support.
Technically speaking, a new casino can be put into operation within just a couple of weeks after contract signature. The gaming operators that decide to launch their casinos from Malta must first, however, obtain a li-cense from the gaming authority, which is a time-consuming process.
As part of the service, Net Entertainment provides account management services to the licensees. The account managers have years of experience and expertise from casino op-erations, which they share with the licensees. This allows for the optimisation of operations, maximisation of revenues and avoidance of expensive mistakes.
operatioNS
DiD you kNow that…
Net entertainment handles 50 times more transactions than the Stockholm Stock exchange.
PRodUCt develoPment
"betteR gAMeS"The success of a casino relies on the interaction of many components, where the principal one is the games being offered. From the very start, Net Entertainment’s goal has been to provide the best and most entertaining games.
The Company invests considerable amounts in R&D to guarantee the development of the very latest in gaming technology. The majority of the Company’s workforce is involved in the development of new games in the technology department.
Game development is a science that re-quires proficiency, competence and extensive experience. With more than 40 years’ experi-ence of gaming in a physical environment and ten years of virtual casino operations, there are few companies that have a firmer ground to stand on than Net Entertainment.
Technology is progressing at an increasingly rapid rate and it is imperative that the Com-pany remains at the forefront of this progress.
DiD you kNow that…
Net entertainment’s development engineers pay regular visits to land-based casinos all over the world to gain inspiration and observe new casino trends.
Net Entertainment strives to put technology to full use and follow market trends and cul-tural changes. It therefore places great empha-sis on each detail. This applies particularly to the high-quality graphics, striking animations, exciting sounds, thrilling bonus games and logical features.
A frequently underestimated factor when choosing an online casino is the importance of extensive language support. Net Entertain-ment’s games are unique in offering full sup-port for 21 languages. The Company proposes to provide support for additional languages when requested by the licensees.
CasinoModule™ also fully supports the play-er protection standards set by G4. In addition, CasinoModule™ has been accredited as meet-ing the criteria for randomness by the Swedish National Laboratory of Forensic Sciense (SKL) and Technical Systems Testing (TST), which is an independent, Canadian testing institution. This gives the Company a credibility which will also benefit our licensees and their casino opera-tions in the long run.

12 NET ENTERTAINMENT | 2007
operatioNS
PRodUCt develoPment PRoCeSS
iDea aND CoNCeptr&D DeveLopmeNt teStiNg Support aND maiNteNaNCe
1 2 3 4 5
DevelopMent pRoCeSSNet Entertainment follows a development cycle of twelve weeks and the licensees receive a new version of CasinoModule™ once every quar-ter. A constant stream of new system features and games is absolutely vital for our licensees in their bid to win new market share.
Net Entertainment’s development process is based on a software development method called Scrum. Scrum is based on cross-func-tional development teams and the work is conducted in an iterative manner in so-called sprints that are two weeks long. The develop-ment process is flexible and changes can be made as work progresses. The Scrum method produces an efficient, positive and dynamic working environment where decision-making is delegated to the team.
Unit testing is an integral part of the devel-opment process and exhaustive testing is car-
ried out at the end of each product cycle. This ensures that the product meets the highest re-quirements for quality and reliability. This is vital considering that our systems handle far more financial transactions than an average-sized stock exchange.
Product planning is carried out in close collaboration with our licensees and follow-ing analyses of end customer behaviour. This guarantees that we are developing games and features that meet the needs and requirements of the market. A team of product owners is responsible for planning the production and producing product specifications, which form the framework for the development process.
CasinoModule™ was voted one of the top 20 Internet gaming products in 2006 and this proves that our ongoing investment in R&D has been a success.
DiD you kNow that…
Net entertainment conducts in excess of 10,000 test cases prior to each product release.

NET ENTERTAINMENT | 2007 13
gAMeS DevelopMent iS An ARt
operatioNS
In 2007, Net Entertainment delivered 23 unique games, which is almost two new games a month. Games development is an art that involves a series of different phases and areas of expertise. The idea for a new game is realised in a well-defined process flow in which the product owners are responsible for the game at an overarching level. As the demands for games have gradually increased, so have the requirements for more highly sophisticated user interfaces in terms of graphics and sound and for more complex bonus games and features.
The graphic design work begins with hand drawn sketches that gradually evolve into digital form. Graphic design is becoming increasingly important and constitutes a key competitive advantage for the gaming operators in the battle for the players. The sound and features are equally essential for creating a first-rate gaming experience.

14 NET ENTERTAINMENT | 2007
market
globAl MARKet with StRong pRofit potentiAl
reason for this uncertainty is that not all op-erators are listed companies.
The forms of gaming that dominate the online market are wagering, casino games and poker.
According to GBGC, bingo is the form of gaming set to grow the most in percentage terms in the coming years because of the in-creasing number of female players. In terms of absolute figures, however, wagering is expected to remain the largest gaming form.
From a geographical point of view, Europe is the single, largest market for Internet based gaming as well as the fastest-growing region.
Over the past year, European players have accounted for 44 percent of total online sales. The corresponding figure for 2008 is expect-ed to reach 50 percent. Apart from Europe, North America is the largest market, followed by Asia/the Middle East.
However, we expect to see North America’s relative market share to decline in 2008. Con-sequently we expect higher growth in Europe and Asia/the Middle East. This is due to a change in US legislation.
Advances in technology are leading to the introduction of Internet based gaming in new geographic markets.
In turn, this expansion leads to new and different demands on operators and game developers. Innovative and interesting games have to be developed to capture these new end users. Other critical factors for success
the market for online gaming continued to grow 2007, with europe as the largest and strong-est growth region. the european market grew by 24 percent during the year and this trend is expected to continue.
the MARKet foR gAMing enteRtAinMentThe entire market for all forms of gaming en-tertainment is expected to reach around SEK 2,037 billion, according to Online Gambling Report Q4 produced by Global Betting and Gaming Consultants (GBGC).
The gaming market is divided into two sec-tions – landbased (offline) and digitally-dis-tributed (online). Although landbased gaming is the dominant section, digitally-distributed gaming is steadily gaining market share. Inter-net gaming accounted for about 4.6 percent of all gaming activities in 2007, with a turnover of about SEK 93 billion. By 2012 online gam-ing is expected to represent 6.3 percent with a turnover of about SEK 149 billion.
the online MARKetThe global online market grew by 3.5 percent and the European market by 24 percent. The global trend is due to a change in US legislation.
It is difficult to assess the exact size of the global Internet gaming market. It is also dif-ficult to determine the size of the market for vendors of digitally-distributed gaming. One
onlIne maRKet net SaleS PeR PRodUCt 2002–2012e
SeK million 2002 2003 2004 2005 2006 2007 2008e 2009e 2010e 2011e 2012e
Wagering 16.49 18.54 22.20 26.04 30.57 29.63 31.31 32.30 37.01 37.63 41.42
Poker 0.50 1.98 8.68 15.93 19.78 18.17 18.72 20.83 22.94 24.86 26.85
Casino 7.32 10.00 12.40 16.68 20.46 19.53 20.71 23.37 25.92 28.21 29.82
Bingo 0.62 0.93 1.86 3.10 4.40 4.84 5.83 7.01 8.06 9.05 9.98
Skills games 0.19 1.18 0.93 1.74 2.91 4.34 5.27 5.95 6.70 7.69 8.62
Lotteries 1.67 2.73 5.15 7.32 12.10 16.74 21.14 24.43 28.09 31.06 33.85
total 26.76 34.79 51.29 70.78 90.12 93.25 102.92 113.96 128.71 138.57 150.60
net SaleS and GRowth FoR oFF-lIne and onlIne 2003–2012e
0
500
1,000
1,500
2,000
2,500MDSEK
03 04 05 06 07 08 09 10 11 12Source: GBGC
the onlIne maRKet 2003–2012e
0
50
100
150
200MDSEK
03 04 05 06 07 08 09 10 11 12Source: GBGC
ShaRe oF the total onlIne maRKet oF vaRIoUS FoRmS oF GamInG In 2007
Poker19%
Lotteries18%
Bingo5%
Wagering32%
Skills games 5%
Casino21%
Source: GBGC Source: GBGC

NET ENTERTAINMENT | 2007 15
exPeCted GRowth PeR ReGIon, % oF total onlIne maRKet 2008
North AmeriCA
ShareGrowth
–22% 35.3%
europe
ShareGrowth
+24% 44.4%
AfriCA
ShareGrowth
+53% 1.5%
oCeANiA
ShareGrowth
+22% 5.9%
AsiA & the middle eAst
ShareGrowth
+41% 10.5%
CeNtrAl & south AmeriCA, iNCludiNg the CAriBBeAN
ShareGrowth
+17% 2.4%
market
entire online casino market will be approxi-mately SEK 29.8 billion in 2012. The Internet based casino services comprise two different types of solutions: a downloadable casino soft-ware solution for end-user installation, and a browser-based solution that can be used di-rectly on a specific website.
Browser-based casino services, which are those historically provided by Net Entertain-ment, offer numerous advantages, end users do not need to download any software and the games can be accessed easily from any location. Furthermore, the operators can use the existing platform for cross-marketing of other prod-ucts. Moreover, the market is generally mov-ing toward browser-based systems solutions.
are the ability to adapt swiftly and make sure that products maintain the highest level of quality.
As the gaming operators expand into new geographic markets, it is essential to continue to develop the multi-language capability. the CASino MARKetNet Entertainment’s prime market, the Inter-net based, interactive market for casino gam-ing, is showing strong growth.
In 2007, net sales for this segment were SEK 19.5 billion and international sales are ex-pected to increase at an annual rate of about 9 percent in the next five years.
According to GBGC, projected sales for the
the total CaSIno maRKet net SaleS 2003–2012e
0
5
10
15
20
25
30MDSEK
03 04 05 06 07 08 09 10 11 12Source: GBGC
the CaSIno maRKet In eURoPe net SaleS 2003–2012e
0
2
4
6
8
10MDSEK
03 04 05 06 07 08 09 10 11 12
Source: GBGC
onlIne maRKet net SaleS PeR ReGIon 2002–2012e
SeK million 2002 2003 2004 2005 2006 2007 2008e 2009e 2010e 2011e 2012e
Africa 335 577 716 926 1,200 1,429 2,190 2,368 2,710 2,905 3,219
Asia & the Middle East 2,240 5,328 5,739 6,838 8,318 9,756 14,030 14,950 16,700 18,430 20,620
Central and South America, including the Caribbean 494 576 891 1,120 1,741 2,283 2,670 2,921 3,348 3,905 4,367
Europe 6,163 7,525 13,660 22,490 33,380 41,350 51,530 58,810 66,850 70,000 74,890
North America 15,763 18,260 27,310 35,870 41,070 32,890 25,770 27,880 31,340 35,260 39,110
Oceania 1,731 2,521 2,971 3,533 4,422 5,519 6,719 7,020 7,774 8,046 8,391
Source: GBGC

16 NET ENTERTAINMENT | 2007
market
which will work to Net Entertainment’s advan-tage since the Company has a strong offering and a premium profile.
n Continued robust growth in Europe. The mar-ket looks to be the dominant geographic market in the next few years.
n The market is expanding into new geographic regions. This will help maintain the current fa-vourable conditions for all those in the casino market, but will also give rise to new demands. It will become increasingly important to be able to upgrade and develop the offering in direct response to the changing needs of the customers.
n The gaming operators are becoming more like portals. The market is still in its infancy and the online operators are becoming more like gaming portals, with broader product offer-ings. This attracts new end users and also increases revenues from existing customers through cross-sales.
n The gaming operators are getting larger. Increased competition and mergers between the online gaming operators are conse-quences of the maturation of the market. It is likely that fewer players will dominate the market in the future. Market consolidation will make it all the more important to offer market-leading products.
n Marketing is becoming more important and more expensive. Attracting new players is proving increasingly expensive. This makes it all the more important for operators to deepen the loyalty of existing players.
n Gaming operators demand the very latest. As the rate of development is speeded up, demands for flexible, customer-oriented production increase.
n The market for gaming developers is relatively fragmented. The market consists of lots of small-scale players but some consolidation has begun.
new plAyeRS, new DeMAnDS There are many different reasons for playing casino games on the Internet. While some peo-ple hope to win money, for others it is simply an enjoyable pastime. Whatever the type of players, it is crucial to be responsive to their various preferences.
The market continues to expand as online gaming attracts new categories of players. Market surveys show an increasing percentage of women, partly due to the growth of the bin-go segment. The traditional image of a typical player, a man aged between 25 and 35, is much less predominant than before.
Female players are mainly attracted to on-line bingo as well as to other kinds of online gaming. Another group that has grown signi-ficantly is the younger generation with its easy familiarity with modern technology and expe-rience of playing PL games. Games and fea-tures need to be more sophisticated to satisfy this so-called "Nintendo generation". We are also seeing a steady rise in the upper age of on-line players as Internet penetration increases. This group is sometimes referred to as "Silver Surfers". The fact that there is no longer a ho-mogeneous player base has its consequences. Operators and games developer must respond to the needs of different customer groups and be able to adapt their operations accordingly. tRenDS on the CASino MARKetThese developments in the market will lead to increased demands on the system suppliers,
n Continued robust growth in europe
n new geographic regions
n the operators are becoming more of gaming portals
n Consolidation
n the gaming operators are getting larger
n Customer loyalty is becoming increasingly important
n the rate of development is increasing
tRendS
Operators and games devel-opers must respond to the needs of different customer groups and be able to adapt their operations accordingly.

NET ENTERTAINMENT | 2007 17
market
whAt DRiveS the unDeRlying MARKet foR online gAMing?
internet penetrationA key factor driving this development is that the Internet is becoming accessible in more places and to new groups. In turn, this leads to a greater number of potential end users.
broadband capacityThe increasing capacity of the Internet has consequences. As broadband continues to grow, the demands for online products be-come greater all along the line. Consequently, the online gaming market is challenged with the demand for ever more complex and so-phisticated games.
Credit cardsTrust is a crucial factor in the online gam-ing market. The end users want to feel secure and confident about card transactions online. More and more customers are tending to use credit cards to purchase services online. End-user confidence is further underpinned by a greater presence of state-owned gaming com-panies and listed players.
n Good RePUtatIon well-known reference customers are a key factor for success, often generating new customers.
n attRaCtIve PRodUCt oFFeRInGS wIth hIGh enteRtaInment valUe. this, combined with a high degree of reliability and stability, is of great importance.
n the GamInG oPeRatoRS aRe exPandInG theIR RanGeS and addReSSInG a bRoadeR aUdIenCethis leads to more potential players, but also demands a more differentiated selection of games.
SuCCeSS fACtoRS in the gAMing DevelopMent inDuStRy
n FReqUent ReleaSeS oF new GameS trend toward increasingly faster development cycles. games are being released and updated faster and faster to meet the demands of the market.
n SIze
gaming development is characterised by economies of scale in respect of production. Size will therefore become increasingly important over the coming years.
n IndePendenCeit is becoming increasingly important among gaming opera-tors that the gaming developer does not operate a compet-ing gaming business.

18 NET ENTERTAINMENT | 2007
market
CoMpetitoRSEven if the market for online gaming is large and growing, the supplier side is dominated by a small number of players. The majority of these have a wider product portfolio than Net Enter-tainment and many have also decided to focus more on the poker market in recent years.
Unlike its competitors, Net Entertainment has elected to focus on casino games as a de-fined market niche and can therefore offer casino solutions of the absolute highest class.
Net Entertainment’s primary competitors are Boss Media, Chartwell, Microgaming and Playtech. Microgaming and Playtech are the two companies that most obviously compete with Net Entertainment in the casino seg-ment. Net Entertainment’s main competitors are listed below.
Net Entertainment estimates that the Com-pany has a 10 percent market share. This is ba-sed on the fact that Net Entertainment delivers casino software to about 10 of the 100 largest sport betting sites.
legiSlAtion AnD RegulAtionSThe gaming industry has a responsibility to comply with national legislation and regula-tions that define how gaming operations are run. The industry is also affected by suprana-tional legislation, especially the re-regulation that is currently taking place at the European level.
As a system supplier without any operator activities of its own, Net Entertainment is not directly affected by the laws and rules that apply
table oF ComPetItoRS
ComPanY oRIGIn owneRShIP StRUCtURe maRKet SeGment maRKet valUe1)
Casino poker bingo Soft games
boss media Sweden Private 4 4 4 4 N/A
Chartwell Canada Public 4 4 4 4 SEK 230 million
Cryptologic Canada Public 4 4 SEK 1,100 million
microgaming South Africa Private 4 4 4 N/A
Playtech Israel Public 4 4 4 SEK 10,800 million
Real time Gaming USA Private 4 4 4 N/A
net entertainment Sweden Public 4 (4) 4 SEK 840 million
1) Refers to March 2008
Unlike its competitors, Net En-tertainment has elected to focus on casino games as a defined market niche and can therefore offer casino solutions of the absolute highest class.

NET ENTERTAINMENT | 2007 19
market
n The European Commission has expressed critical views about Sweden, Germany and France. The Commission demands that the Member States amend gaming legislation since it considers existing legislation is dis-criminatory toward private players.
The Commission considers that the state-owned gaming companies operate commercial activities since they have annual revenue targets and act like other commercial companies.
On a number of occasions, the European Court of Justice has ruled that if gaming activi-ties are permitted in one market, private gam-ing companies must be allowed to compete on equal terms in all gaming segments. These terms may include the issuance of licenses, in-spections and other restrictions.
Discussions in the legal field are currently in a dynamic phase, which makes it difficult to provide an accurate picture of the current legal situation or of short-term developments. However, a license-based, regulated solution within the European Union is the most likely scenario in the long term.
SuMMARyThe competition in the online gaming market continues to intensify. In the gaming operators’ struggle to attract new players, a regular stream of new games is becoming essential for them to be able to maintain their competitive edge. Industry analysts forecast a bright future for digitally-distributed entertainment and online gaming. The Global Betting and Gambling Consultants (GBGC) predict that digitally-dis-tributed games will expand globally at an an-nual rate of approximately 10 percent between 2008 and 2012. Global net sales for online gam-ing are expected to exceed SEK 103 billion in 2008. The European market, which is already by far the largest gaming market, is expected to account for over 50 percent of all gaming rev-enues in the coming years with a growth rate of 15 to 20 percent each year. Net Entertainment is also of the opinion that the online gaming market is continuing to show good growth.
for the rest of the gaming industry. Net Enter-tainment is however indirectly affected by de-velopments that affect our customers, and their conditions for growth, profitability and how the services are put together.
The legal situation within the EU, where most of the Company’s customers operate, is particularly interesting.
A number of legal decisions taken during the 2007 financial year have had an impact on the gaming entertainment industry.
Some of the decisions open the door for a more liberal view in the market, fewer restric-tions and a diminution in monopolistic tenden-cies. Others move in the opposite direction. The European Court of Justice has, however, main-tained a consistent stance against gaming mo-nopolies in a series of much-publicised cases.Some of most important legal developments to have taken place recently are listed below.
n In October 2006, a new law came into effect in the US prohibiting banks and other financial institutions from processing online gaming payments.
n On the other hand, it is understood that the companies in the World Lottery Association (WLA) in the US will open for online gam-ing within the next few years.
n On March 1, 2007, Turkey introduced a ban similar to that in the US.
n In the so-called Placania case in March 2007, the European Court of Justice ruled that gaming monopolies are in contravention of EU law. This is one in a series of precedential rulings from the European Court of Justice that assert that state restrictions in the area of gaming are considered to infringe the free-dom of movement of goods and services.
n On the other hand, a ruling on Norway’s gaming monopoly, by the EFTA Court in Luxembourg, can be seen as defending the gaming monopoly.
Industry analysts forecast a bright future for digitally- distributed entertainment and online gaming.
1) Global Betting and Gaming Consultants, 2008

20 NET ENTERTAINMENT | 2007
ouR eMployeeS ARe the ReAl Key to ouR SuCCeSS
empLoyeeS
the eMployeeS’ RoleNet Entertainment’s survival and progress are dependent on its employees and their skills. Net Entertainment looks for employees with the right skills and this places tough demands on the Company’s recruitment process. In or-der to attract the right expertise, Net Enter-tainment offer opportunities to work on the most exciting development projects.
CoRpoRAte CultuReNet Entertainment’s corporate culture is de-fined by trust, openness and participation. While every individual has opportunities for personal development, the Company pro-motes group dynamics. Personal responsi-
bility, proactivity and performance are key catchwords for Net Entertainment employees. At the same time, it is essential to be able to work as part of a group since all production at Net Entertainment is conducted in large and small groups. Net Entertainment has a flat organisation structure with high employee involvement.
net enteRtAinMent AS A woRKplACeNet Entertainment has introduced a series of activities to create an attractive workplace. One such is its bonus programme which is based on the performance of the Company and in-cludes all employees. This guarantees that Net Entertainment and its employees share the same interest. The low rate of staff turnover emphasises the fact that the Company has succeeded in creating a very pleasant and at-tractive workplace. There are numerous career opportunities at Net Entertainment aimed at encouraging individuals to develop personally and professionally.
eMployee figuReSNet Entertainment is a rapidly-expanding com-pany that employs about 80 people, the majority of whom work on technology development and operations. Net Entertainment’s employees have varied cultural and educational backgrounds. The Company sees this as positive. The level of education among employees is high – 94.3 per-cent are university educated and 73.6 percent have 120 credit points or more. The average age is 33 and 28 percent are women.
fuRtheR DevelopMentThe Company always encourages the further training of its employees. Net Entertainment regularly offers its employees training op-portunities to develop their professional roles within the Company. Naturally this creates the conditions for producing better games.
94.3%oF the emPloYeeS have a UnIveRSItY edUCatIon
net entertainment’s employees are the core of company operations. Many companies can boast that their employees are the key to their success, but net entertainment is totally dependent on the performance and work of its employees.

NET ENTERTAINMENT | 2007 21
empLoyeeS
whAt iS it liKe woRKing At net enteRtAinMent?
level oF emPloYee edUCatIon
Upper secondaryeducation 6%
<120 university credit points 21%
aGe dIStRIbUtIon emPloYeeS
9
8
7
6
5
4
3
2
1
020 22 23 26 27 28 29 30 31 32 33 34 35 36 37 38 39 40 41 43 45 50
Age
Number
SebaStIan JohannISSon, account manager
I work as an Account Manager with several of Net Entertainment’s largest customers. My work mainly involves optimising the cus-
tomer’s use of Net Entertainment’s products by arranging training for and working directly and closely with the customer. Together with the customer/operator, I focus on maximising profits and providing the end customer with a gaming experience like no other.
Here at Net Entertainment, I work in an incredibly dynamic, fast paced and international environment. Net Entertainment has possibly the best casino product in the world and that places tremendous demands on its personnel and product development. At the same time, the social side of work is equally important and a beer or two after work on Fridays is the rule rather than the exception.
JennIe lIdén, test manager
I started off as a consultant at Net Entertainment but decided to stay because of the wonderfully friendly feeling in the Company.
I am currently responsible for the testing process in one of the three teams that develop games and administration systems at Net Entertainment.
The pace is always fast here and the teamwork between the different professions is very rewarding. My work offers great scope for involvement in product design. Net Entertainment is a company that is constantly growing and developing, a company where new and interesting challenges are always emerging and presenting the personnel with opportunities to develop professionally.
malIn SandStRöm, Finance
I work in the Finance Department with responsibility for accounts receivable and accounts payable, salaries and accounts
for Net Entertainment Malta Ltd. Net Entertainment is a good employer that puts its employees in the
centre. The atmosphere is positive and there’s always plenty happening. I appreciate the fact that the Company encourages employees to put forward their own ideas and initiatives. I began working at Net Entertainment because I think it’s an interesting business that is developing rapidly. I was also attracted by the fact that Net Entertainment has a strong product and is an expanding company with lots of development potential.
120 universitycredit points 19%
>120 university credit points 54%

22 NET ENTERTAINMENT | 2007
five-year Summary of reSuLtS
five-yeAR SuMMARy of ReSultS
ConSolIdated InCome Statement
2007 2006 2005 2004* 2003*
Operating revenues 132,020 99,773 64,683 47,661 22,972Operating profit before depreciation/amortization
58,419 45,208 21,811 8,509 3,122
Depreciation/amortization –7,839 –4,407 –3,473 –2,645 –1,538
Profit after depreciation/amortization 50,580 40,801 18,338 5,864 1,585
Net financial income/expense 224 –958 4,537 6,979 –746
Profit before tax 50,804 39,843 22,875 12,843 838
Profit after tax 45,911 28,482 15,329 9,335 584
*Comparable figures for 2003–2004 relate to the Parent Company only
ConSolIdated balanCe Sheet
2007 2006 2005 2004* 2003*
aSSetS
Fixed assets 30,124 24,298 9,740 14,718 5,980
Current receivables 42,055 19,210 22,482 15,674 7,764
Cash and cash equivalents 25,915 13,053 5,535 2,246 3,011
total current assets 67,970 32,263 28,017 17,920 10,774
total aSSetS 98,094 56,561 37,757 32,638 16,754
eqUItY and lIabIlItIeS
Shareholders’ equity 53,145 16,090 12,129 8,834 7,271
Long-term liabilities 2,195 835 358 – –
Current liabilities 42,754 39,636 25,270 22,625 8,789
total liabilities 44,949 40,471 25,628 22,625 8,789
total eqUItY and lIabIlItIeS 98,094 56,561 37,757 32,638 16,754
*Comparable figures for 2003-2004 relate to the Parent Company only
NET ENTERTAINMENT | 2007 23
key figureS aND DefiNitioNS
oPeRatInG maRGIn
Operating profit in relation to revenue for the period.
PRoFIt maRGIn
Profit after financial items in relation to revenue for the period.
InteReSt CoveRaGe RatIo (mUltIPle)
Profit after financial items, plus interest expense, in relation to interest expense.
eqUItY/aSSetS RatIo
Equity at the end of period as a percentage of total assets at the end of period.
qUICK RatIo
Current assets in relation to current liabilities, including proposed but not yet adopted dividend.
InteReSt-beaRInG net debt
Net of interest-bearing provisions and liabilities less financial assets including cash and cash equivalents.
net debt/eqUItY RatIo (mUltIPle)
Net of interest-bearing provisions and liabilities less financial assets including cash and cash equivalents divided by shareholders’ equity.
aveRaGe nUmbeR oF emPloYeeS
The number of employees converted into full-time equivalents (annual employees).
nUmbeR oF emPloYeeS at YeaR-end
The number of employees on the last monthly wage-payment day.
eaRnInGS PeR ShaRe
Profit after tax in relation to the average number of shares outstanding during the period.
DefinitionS
Key figuReS
ShaReholdeRS’ eqUItY PeR ShaRe
Shareholders’ equity in relation to the number of shares outstanding at the end of the period.
dIvIdend PeR ShaRe
Implemented/proposed dividend.
aveRaGe nUmbeR oF ShaReS oUtStandInG
Weighted average number of shares outstanding during the period, adjusted for bonus issue andshare split.
nUmbeR oF ShaReS oUtStandInG
The number of shares outstanding at the close of each period, adjusted for bonus issue and share split.
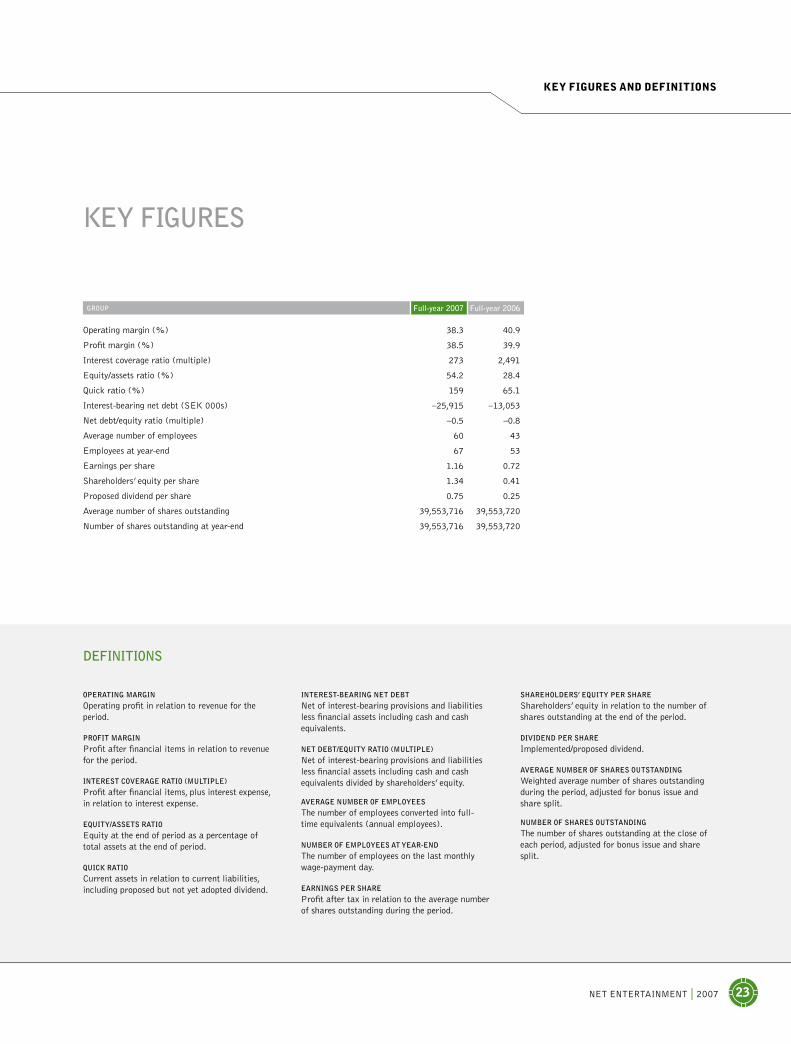
GRoUP Full-year 2007 Full-year 2006
Operating margin (%) 38.3 40.9
Profit margin (%) 38.5 39.9
Interest coverage ratio (multiple) 273 2,491
Equity/assets ratio (%) 54.2 28.4
Quick ratio (%) 159 65.1
Interest-bearing net debt (SEK 000s) –25,915 –13,053
Net debt/equity ratio (multiple) –0.5 –0.8
Average number of employees 60 43
Employees at year-end 67 53
Earnings per share 1.16 0.72
Shareholders’ equity per share 1.34 0.41
Proposed dividend per share 0.75 0.25
Average number of shares outstanding 39,553,716 39,553,720
Number of shares outstanding at year-end 39,553,716 39,553,720

24 NET ENTERTAINMENT | 2007
develoPment oF ShaRe CaPItal
ChanGe In nUmbeR oF ShaReS total nUmbeR oF ShaReS
transaction Year Series a Series b Series a Series b totalChange in share
capitaltotal
share capitalPar value/
share
Establishment of company 1996 1,000 – 1,000 – 1,000 100,000.00 100,000.00 100.00
New share issue, reduction in par value 2000 20,408,123 – 20,409,123 – 20,409,123 920,456.15 1,020,456.15 0.05
Share split 5:3 2006 13,606,082 – 34,015,205 – 34,015,205 – 1,020,456.15 0.03Bonus issue 2006 5,538,515 – 39,553,720 – 39,553,720 166,155.45 1,186,611.60 0.03
Introduction of two shares classes 2006 71,485 33,943,720 5,610,000 33,943,720 39,553,720 – 1,186,611.60 0.03
Redemption, 4 shares 2007 – –4 5,610,000 33,943,716 39,553,716 –0.12 1,186,611.48 0.03Bonus issue 2007 – – 5,610,000 33,943,716 39,553,716 3,955.37 1,190,566.85 0,0301
ShARe CApitAl AnD owneRShip StRuCtuRe
KeY data FoR net enteRtaInment ShaReS
2007 2006
Earnings per share 1.16 0.72
Dividend1) 0.75 0.25
Dividend of after-tax profits (%)2) 65% 35%
Shares outstanding at year-end (millions) 39.55 39.55
Average number of shares outstanding (millions) 39.55 39.55
Quoted share price at the closing date3) 16 N/A
Dividend yield4) 4.7% N/A
Total return, Net Entertainment shares as %5) 18.6% N/A
P/E ratio 13.8 N/A
Number of shares turned over per year, millions 18 N/A
Turnover rate 46.34% N/A
Market value at year-end, millions 633 N/A
No. of shareholders 3,006 N/A
StoCK pRiCe MoveMentS AnD totAl RetuRnThe record date for the distribution of Net Entertainment shares to Betsson’s shareholders was April 2, 2007. Thereafter, Net Enter-tainment’s Series B shares began trading on the NGM Equity Stock Exchange (Nordic Growth Market) on April 5, 2007. The closing price was SEK 13.70 on the first day of trading and SEK 16 at the end of 2007, which was an increase of 16.8 percent. During the same period, the Stockholm Stock Exchange’s Nordic Index fell by 13.1 percent (OMXSPI). Net Entertainment’s market capitalisation, i.e. the value of all the Company’s outstanding shares, was SEK 633 million on December 31, 2007. The total yield reached 18.6 percent during the time Net Entertainment was listed in 2007.
SAleS18,328,981 shares were sold during the financial year, which is an av-erage of 100,158 shares a day. The highest price paid during the year, SEK 22.50, was recorded on July 19 and 20, and the lowest price, SEK 11.90, on April 16. Since the first day of trading, shares have risen by 16.8 percent calculated from the closing price on the first day.
ShARe CApitAlThe share capital in Net Entertainment on December 31, 2007, amounted to SEK 53.1 million, split between 39.55 million shares, of which 33.94 million were Series B shares. The face value is SEK 0.03 per share.
ShAReholDeRS’ equity Shareholders’ equity per share amounted to SEK 1.34 on December 31, 2007.
1)Board’s proposal2)Calculated on proposed dividend3)Closing price December 28, 20074)Divided by the quoted share price at year-end5)Closing price at December 28, 2007, plus dividends paid in 2007 divided by the closing price on the first day of trading
the Share
B-shares
2007APR MAY JUN JUL AUG SEP OCT NOV DEC
OMX AB
Number of shares turned over per year, thousands (incl. after hour trading)
OMX Stockholm_PI
24
22
20
18
16
14
12
10
6,000
5,000
4,000
3,000
2,000
1,000
net enteRtaInment

NET ENTERTAINMENT | 2007 25
dIStRIbUtIon oF ShaReS In SIze ClaSSeS
no. of shares
no. of shareholders
%
no. of shares
%
voting rights %
>500,001 17 0.6% 25,997,313 65.7% 78.0%100,001–500,000 29 1.0% 7,070,370 17.9% 14.9%20,001–100,000 56 1.9% 2,563,342 6.5% 2.9%15,001–20,000 22 0.7% 403,915 1.0% 0.5%10,001–15,000 41 1.4% 532,501 1.3% 0.6%5,001–10,000 113 3.8% 868,755 2.2% 1.0%1,001–5,000 538 17.9% 1,362,579 3.4% 1.5%501–1,000 474 15.8% 419,024 1.1% 0.5%1–500 1,716 57.1% 335,917 0.8% 0.4%total 3,006 100.0% 39,553,716 100.0% 100.0%
ShAReholDeR StRuCtuReAt the close of the year, Net Entertainment had 3,006 shareholders. The largest shareholder according to the Swedish Securities Reg-ister Centre (VPC) is Per Hamberg with 18.6 percent of the votes and 11.7 percent of the capital. However, according to reports,
the Share
ten laRGeSt ShaReholdeRS aCCoRdInG to the SwedISh SeCURItIeS ReGISteR CentRe (vPC)
name/address no. of Series a shares no. of Series b shares holding (%) votes (%)
Hamberg, Per 1,497,000 1,737,078 8.18 % 18.55 %Straumur-Burdaras Investment Bank 1,402,500 0 3.55 % 15.58 %Credit Suisse Sec. Europe Ltd 0 10,121,249 25.59 % 11.24 %Kling, Lars 797,000 790,712 4.01 % 9.73 %Lundström, Rolf 652,500 306,387 2.42 % 7.59 %Lindwall estate, Bill Johan Bertil 561,000 0 1.42 % 6.23 %Kling, Maria 350,000 50,098 1.01 % 3.94 %Kling, Ingela 350,000 50,000 1.01 % 3.94 %Falvir AB 0 1,807,400 4.57 % 2.01 %Lindwall, Pontus 0 877,350 2.22 % 0.97 %total, ten largest shareholders 5,610,000 15,740,274 53.98 % 79.78 %
Other shareholders 0 18,203,442 46.02 % 20.22 %
total oUtStandInG ShaReS 5,610,000 33,943,716 100.00 % 100.00 %
Footnote: The Credit Suisse Sec Europe Ltd holding is controlled by the Straumur-Burdaras Investment Bank
net enteRtaInment ne ab on deCembeR 28, 2007
no. of shareholders Shareholders (%) holding holding (%) votes (%) votes (%)
Individuals 2,749 91.45% 16,112,647 40.74% 53,980,147 59.95%
of whom live in Sweden 2,724 90.62% 13,051,199 33.00% 37,445,699 41.59%
Legal entities 257 8.55% 23,441,069 59.26% 36,063,569 40.05%
of which are based in Sweden 160 5.32% 6,672,901 16.87% 6,672,901 7.41%
total december 28, 2007 3,006 100.00% 39,553,716 100.00% 90,043,716 100.00%of which are based in Sweden 2,884 95.94% 19,724,100 49.87% 44,118,600 49.00%
the Straumur-Burdaras Investment Bank holds shares equivalent to 27.6 percent of the capital and 26.1 percent of the votes. Net Entertainment does not know which institutions the Straumur-Burdaras Investment Bank’s holdings are allocated through.
On December 31, 2007, overseas ownership was 51.0 percent of the votes and 50.1 percent of the capital.
tiCKeR SyMbolS AnD RounD lotS The ticker symbol for the Company’s shares is NET-B and the ISIN code is SE0001089252. A round lot consists of 200 shares. pRopoSeD DiviDenD 2007 AnD DiviDenD poliCyThe Board of Directors will propose to the Annual General Meet-ing a dividend of SEK 0.75 (0.25) per share for the 2007 fiscal year. In accordance with Net Entertainment’s dividend policy, ordi-nary dividend will grow in line with the Company’s earnings per share, with due consideration for the Company’s long-term capital requirements.
26 NET ENTERTAINMENT | 2007
the board of Directors and Chief executive officer of net enter-tainment ne Ab (publ), corporate registration no. 556532-6443, hereby present the Annual Report and the Consolidated financial Statements for the 2007 financial year.
For a full breakdown of 2007 earnings and the financial position of the Parent Company and Group, please refer to the Directors’ Report and the income statements, balance sheets, cash flow state-ments, summaries of shareholders’ equity and notes and com-ments which follow. The Annual Report, including the Auditors’ Report, covers pages 6–55.
opeRAtionSNet Entertainment was established in 1996 as a joint venture project between Cherryföretagen and the Kinnevik Group. The basis for the initiative was the strong growth of the Internet market and the objective was to establish the Company as a leading casino operator on the Internet.
Net Entertainment is a market-leading Business to Business (B2B) supplier of holistic solutions for digitally-distributed gaming enter-tainment. The Company’s products are developed to be compatible with different operating environments. On the platform side, the Java programming language is used, with the Flash programming language deployed as a user interface. The Company develops gam-ing software that is licensed to an international circle of customers, currently consisting of some 50 gaming companies, including Bet-at-Home.com, Unibet, Bet24 and Betsson. The licensees are offered customised gaming solutions, plus services and support.
Net Entertainment uses computer-operating centres in Malta and Costa Rica. On behalf of its customers, the Company manages all technical operations, which in addition to data system opera-tions includes system monitoring, technical support and regular system upgrades. This permits the Company to supply high avai-lability and competitive operating environments for customers, irrespective of the customer’s target market.
An Internet casino can only be successful if it has software that provides a powerful operating support system and high-quality ga-mes with superior entertainment value. Net Entertainment conti-nually invests considerable resources in research and development in a bid to stay at the cutting edge of gaming technology. The de-velopment of games requires know-how, skills and experience. Net Entertainment has benefited from its origins in Cherryföretagen, whose 40-year experience of land-based casino games has been
boarD of DireCtorS’ report
boARD of DiReCtoRS’ RepoRt
invaluable in the development of CasinoModule™. In addition, Net Entertainment has 12 years of experience in the development of systems for Internet based games, which few of the Company’s competitors can outperform.
Net Entertainment has mainly focused on the European mar-ket to date but is steadily turning its attention to new geographic markets. As well as a wider geographic focus, Net Entertainment will also address several new types of gaming markets. This will be facilitated by its new multiplayer platform and Casino Café™.
As part of efforts to develop games that attract the end users, Net Entertainment constantly works closely with its customers and utilises end user surveys plus data from its customer casinos.
Net Entertainment’s marketing, sales and product development departments moved to Malta in 2006. The Swedish Parent Com-pany consists of its executive management and functions for the development of the Company’s games and gaming systems. The average number of employees in the Group rose to 60 in 2007 compared with 43 in 2006. CasinoModule™CasinoModule™ is a games solution comprising a broad range of games that are controlled by an extensive monitoring and con-trol system. The range includes traditional casino games, number games and lotteries, either combined or standing alone. Net Enter-tainment offers Web-based casino solutions, which are optimised for integration with existing game sites that have the necessary infrastructure, such as payment and CRM systems.
Net Entertainment’s primary target group is sports gaming operators with an existing customer base who wish to supplement their existing gaming range with casino games. The games are cus-tomised for each customer, thereby offering the licensee a unique casino, which is an important part of the customer’s brand building. Although CasinoModule™ is technically a standalone system, the players see it as a natural and integral part of the licensee’s website.
CasinoModule™ is integrated with the licensee’s website and uti-lises existing IT systems, which results in a simplified IT architecture without duplication of functionality. In turn, this leads to a distinct division of responsibilities and low production, operating and distri-bution costs. Net Entertainment manages system operations, allow-ing the licensees to focus on their core activities. Net Entertainment’s operating department monitors and manages casino applications for the customer, while customer service personnel act as natural discussion partners in day-to-day operations. This creates strong

NET ENTERTAINMENT | 2007 27
boarD of DireCtorS’ report
customer relations and optimum conditions for a “win-win situ-ation” for both parties.
CasinoModule™ is currently supported in 21 languages, offering many operators a key competitive advantage.
business conceptNet Entertainment shall provide robust systems for Internet gam-ing with exciting games, created using top-of-the-range technol-ogy and expertise, for gaming operators who can thereby expand their product portfolios and increase their profit margins.
MARKet DeSCRiptionMarket sizeOnline gaming is globally expected to produce a turnover of ap-proximately SEK 100 billion in 2008. Casino gaming accounts for approximately 20 percent of this figure1). Despite particularly strong growth, online gaming still only accounts for just under five percent of the total global gaming turnover, which underscores the potential in the market that the Company is targeting. Growth in Europe, which is the Company’s main market, is expected to reach 20 per-cent in 2008 and it is the goal of the Company to grow even more.
Net Entertainment views the conditions for continued market expansion as good. The online gaming market is maturing and saw a number of consolidations among both operators and providers in 2007. This confirms our earlier forecast that the market will eventually be dominated by a few major players. This will prob-ably be advantageous to specialised providers, such as Net Enter-tainment, as the gaming operators need leading-edge products in order to be able to stand their ground in this increasingly competi-tive business. Net Entertainment intends to play an active role in the ongoing process of market restructuring.
We have noted that our products are being used by an increa-singly wider audience since we began targeting new market seg-ments and existing customers have been restructuring their ope-rations. Net Entertainment is therefore actively working to develop games that appeal to different player segments.
legal aspects The online industry is still faced with legal challenges. In the EU, the European Court has consistently expressed its view that online gaming should fall within the regulatory framework for the free movement of
goods and services. However, despite a number of much-publicised cases, there have been no real changes in the local markets. The Com-pany believes in the eventual stabilisation of the legal situation, with private operators being given the same opportunities for conducting business as the state monopolies.
CompetitorsAlthough the market for online gaming is large and expanding, just a few names dominate supplier operations. Net Entertain-ment’s primary competitors are Playtech, Microgaming, Boss Media, Chartwell, Cryptologic and Real Time Gaming. The ma-jority of these have a substantially broader product portfolio than Net Entertainment.
Unlike its competitors, Net Entertainment has elected to focus on casino games as a defined market segment and thus to develop and offer an absolute top-class product. This has proved to be a highly effective strategy and a strong contributory factor to Net Entertainment’s sales success. Executive management estimates that the Company has a market share of about 10 percent (based on the fact that Net Entertainment supplies casino games to about 10 percent of the 100 largest sports gaming sites).
price trendIn recent years, license fees for casino solutions have risen in abso-lute terms. This trend is driven by the operators’ increasing sales. No direct price changes were observed in 2007.
RiSK fACtoRSThe operational and industry-related risks that are expected to have a significant impact on Net Entertainment’s future develop-ment are presented below. For financial risk factors that affect the Company’s operations, see Note 3.
operational and industry-related risksPolitical decisionsIn most national markets, gaming is strictly regulated by law and all gaming operations are essentially subject to official approval. Despite criticism of monopolies, for example, with respect to free-dom of movement in the EU, member states have largely been able to maintain the monopoly situation to date. Accordingly, political decisions in both Sweden and Malta and other countries, as well as court decisions, could have a rapid and adverse impact on Net Entertainment’s operations and those of its customers.1) Global Betting and Gaming Consultants, January 15, 2008

28 NET ENTERTAINMENT | 2007
Net Entertainment produces casino games for the online gaming market. This means that its operations are greatly affected by the legal situation of the gaming industry. The legal situation within the EU, where most of the Company’s customers are active, is of particular interest to the Company.
The Company has a Class IV license in Malta that covers the delivery and technical operation of casino games for online opera-tors licensed in Malta. Malta is a member of the EU and it might seem obvious that the gaming operators in Malta should be able to offer gaming in the EU based on the treaty’s basic principles. These include the principles that there should not be any restrictions on the free movement of goods, the right to establish a corporate pres-ence and the right to freely provide and market services. However, a number of member states have introduced legislation that limit these principles.
There are a number of high-profile precedential court rulings in the European Court relating to the gaming industry, including the Schindler, Läärä, Gambelli, Lindman and Placanica decisions. All these have ruled that state restrictions in the gaming area should essentially be viewed as a curtailment of the right to establish a corporate presence and the freedom to provide services in the EU. However, the Court has ruled that, if aimed at protecting consum-ers, certain curtailment may be permitted if it is proportional. In other words, that it is strictly necessary in relation to the stated purpose of protection. Despite these EU Court rulings, a number of member states continue to enforce restrictions in an effort to hinder or obstruct the activities of private online operators. It is therefore not unlikely that a large number of European gaming monopolies will face legal challenges in the form of national court proceedings.
It is currently difficult to ascertain how the legal situation will affect the commercial conditions for the online operators.
In respect of legal situations outside of the EU, it should be em-phasized that Net Entertainment does not offer its services to on-line operators that offer gaming activities to customers domiciled in the US. This is pursuant to an enactment in October 2006 of the Internet Gambling Prohibition Act to prevent payment processing for online gaming in the US.
Operations subject to official approval and legal aspectsAs a result of a ruling by the Maltese Lottery Inspection, Net Enter-tainment Malta Ltd. has obtained a Class IV license, permitting
the Company to pursue hosting operations for its customers. The maintenance and extension of this permit is crucial to Net Enter-tainment’s operations.
Certain EU member states, including Sweden, prohibit the promotion of a lottery from outside the country. “Promotion” is a broad concept and can thus cover highly diverse activities. Although it seems far-fetched that Net Entertainment’s opera-tions as a software supplier and host for online operators could be viewed as "promotion", it is uncertain just how far this con-cept of "promotion" extends.
Gambling addictionAlthough Net Entertainment does not itself pursue any gaming operations, people suffering from gambling addiction could sue the companies in the Net Entertainment Group as the gaming originator and facilitator. While such claims are likely to be dis-missed, they could give rise to substantial costs, reducing confi-dence in the Net Entertainment Group and eventually leading to a decline in revenue. In 2005, Net Entertainment affiliated itself with G4, an organization that works to prevent gaming addiction. Net Entertainment has adapted the Casino module™ so that it offers full support for the guidelines established by G4.
PersonnelNet Entertainment’s operations depend on the technical progress of the Group and its ability to retain the skills lead that the Com-pany feels it has. The technical skills of the personnel are thus largely decisive for the Company’s future progress.
Major customersTen of Net Entertainment’s 50 or more customers account for a considerable share of the Group’s revenue. The loss of any of these major customers could impact negatively on Net Entertainment’s earnings and financial position. As Net Entertainment acquires new customers, its dependence on these major customers will decline.
Intangible rights and agreementsNet Entertainment’s principal intangible rights consist primarily of the copyrights to software, notably CasinoModule™, and the accompanying material that has been, and is still being, developed within the Group.
boarD of DireCtorS’ report

NET ENTERTAINMENT | 2007 29
Economic conditionsWhile Net Entertainment is not insensitive to changes in economic conditions, they do not impact significantly on operations.
CompetitionThe Company competes with a number of major players who have substantially larger financial and operational resources than those at the disposal of Net Entertainment. This is an extremely attrac-tive market and additional players are constantly trying to establish a market presence. However, the threshold for establishing a pres-ence in this market is very high. Any failure to compete success-fully with these players would have negative consequences for Net Entertainment’s earnings and financial position.
buSineSS AnD Revenue MoDelSales to customers occur primarily via a direct sales model. Casino-Module™ is licensed on a royalty basis and the amount is deter-mined by the earnings generated by the product, although there is a minimum royalty level. The model provides a strong incentive for the Company to develop the product continually and support the Company’s licensees. The pricing also includes start-up and delivery fees.
oveRRiDing objeCtiveSqualitative operational goalsn 4 new product releases each yearn 4–6 new games per release.
qualitative operational goalsProfitable growthNet Entertainment will seek growth accompanied by profitability. Expansion may take the form of organic growth or be attained through acquisitions. Growth may also be achieved in new service segments, such as Soft Games, and in new geographic markets.
Cost effectivenessSince Net Entertainment is active in a competitive market, cost-effective operations are crucial to the Company’s competitiveness. This approach will permeate all the Company’s activities. Admin-istrative and staff costs will be kept to a minimum. As a result of more efficient planning, personnel expenses and other operating costs will represent a small share of Company sales over time.
Pleasant workplaceNet Entertainment will work to create and maintain a pleasant and secure work environment in order to attract and retain skilled personnel. The work environment will be marked by trust, open-ness and participation. Net Entertainment will seek to ensure a fa-vourable work environment and the Company will promote health care, while counteracting illness in other ways.
financial objectivesThe following overriding financial objectives shall guide the Com-pany’s activities and should be viewed over an extended period (such as a business cycle):n Sales growth shall be higher than the market average (in respect
of comparative companies)n Operating margin at the EBIT level will remain high.
DevelopMentS DuRing the yeARgroup 2007Group sales increased in 2007 by 32.2 percent to SEK 132.0 (99.8) million compared with the previous year. Operating profit in-creased by 24.0 percent to SEK 50.6 (40.8) million. Profit after tax amounted to SEK 45.9 (28.5) million, corresponding to SEK 1.16 (0.72) per share.
The Group’s cash flow from operating activities during 2007 amounted to SEK 35.9 (36.4) million. Cash flow from investment activities was negative in an amount of SEK 13.4 (negative 18.6) million. Cash flow from financing activities amounted to SEK –9.9 (–9.9) million and relates to dividends in all material respects. On December 31, 2007, the Group’s cash and cash equivalents stood at SEK 25.9 (13.1) million, including SEK 5.4 million of funds held on behalf of licensees.
During Q4 2007, Net Entertainment repaid the remaining SEK 4.7 million of a loan from its previous parent company, Betsson AB. Net Entertainment is now completely debt-free.
Sales trend for 2006 & 2007:Licensing revenues for the year increased due to good market growth that benefited most of our licensees. Our focus on games with high entertainment value has been a successful strategy that is reflected in the license revenues. 18 new license agreements for CasinoModule™ were signed in 2007.
When it launched CasinoModule™ version 3.8 in Q3, Net
boarD of DireCtorS’ report
30 NET ENTERTAINMENT | 2007
boarD of DireCtorS’ report
Entertainment implemented a change to its model for calculat-ing license fees in response to the casino operation’s increasing volumes and the subsequent growth in jackpot volumes. This means that, in future, Net Entertainment’s customers will be able to manage jackpots themselves. Jackpots have not previously been of any significant amount to affect the estimated amount of net sales. This change does not alter the principle for how revenue is reported and it has therefore not been necessary to make retroac-tive adjustment to the reports.
The model for calculating capitalised time was revised during the final quarter of the year to better reflect the organisation’s ac-tual working methods. As a result, more development time was capitalised compared to previous periods. Group management also evaluated the financial life of the gaming platforms. Based on information about existing and expected market and competi-tive situations, Group management decided that the depreciation period should be shortened to 3 years with effect from January 1, 2008. The new assessment does not cause a write-down requi-rement for existing platforms in addition to the regular planned depreciation
The Group’s intangible assets primarily consist of development expenses brought forward for games and gaming platforms inclu-ded in CasinoModule™. Investments in the Company’s own games and gaming platforms in 2007 totalled SEK 10.5 (14.6) million, of which SEK 4.6 (6.8) million was invested in Sweden and SEK 5.9 (7.8) million was invested in Malta. Items of property, plant and equipment mainly consist of hardware (servers etc.) for operating games and gaming platforms.
parent Company 2007The Parent Company’s earnings totalled SEK 78.9 million, com-pared with SEK 110.3 million in 2006. Operating profit amounted to SEK 4.9 (41.5) million and the profit after tax reached SEK 33.4 (27.9) million. On December 31, 2007, cash and cash equivalents totalled SEK 12.4 million. Profit for the year includes an anticipat-ed dividend of 3,122,000 from Net Entertainment Malta Holding Ltd., which was entered as financial earnings.
Decreased revenues in the Parent Company compared with pre-
vious periods and years result from Net Entertainment currently having a higher share of revenues in Malta where the company’s customers are located. Since projects are ordered and owned by the Maltese subsidiary, development costs are no longer capital-ised in the Parent Company either. However, the original software platform remains in the Parent Company and generates royalties. Invoicing is almost entirely intra-group, which has had a positive effect on the capital tied-up in accounts receivable.
Nor were the running costs for management and administration and costs for operating as a public and listed company attributed to the Parent Company (or the Group) in the comparative figures for the year, since these were borne by Betsson AB, the former par-ent company.
ReMuneRAtion to SenioR exeCutiveSNet Entertainment’s Annual General Meeting, held on May 21, 2007, resolved to adopt principles for remuneration and other terms and conditions of employment for the CEO and other mem-bers of the management group. The remuneration packages shall consist of basic salary, variable compensation, pension and other benefits. These components shall comprise the total remuneration of the individual. The basic salary shall be related to the areas of re-sponsibility and experience of the individual and shall be reviewed annually. Variable compensation shall be based on the attainment by the individual of quantitative and qualitative goals.
Variable compensation for the CEO may amount to a maxi-mum of 10 monthly salaries. Pension benefits may amount to a maximum of 33 percent of the basic salary plus a single payment. Employment may be terminated upon six (6) months’ notice, in-cluding pension benefits, and the CEO shall be entitled to one (1) year’s remuneration, excluding pension, equivalent to the salary received during the period of notice.
Variable compensation for other senior executives varies de-pending on the individual’s position and contract. The maximum compensation may be 85 to 100 percent of the basic salary. The Board of Directors proposes that guidelines conforming to those described above shall apply until the next Annual General Meeting to be held on April 10, 2008.
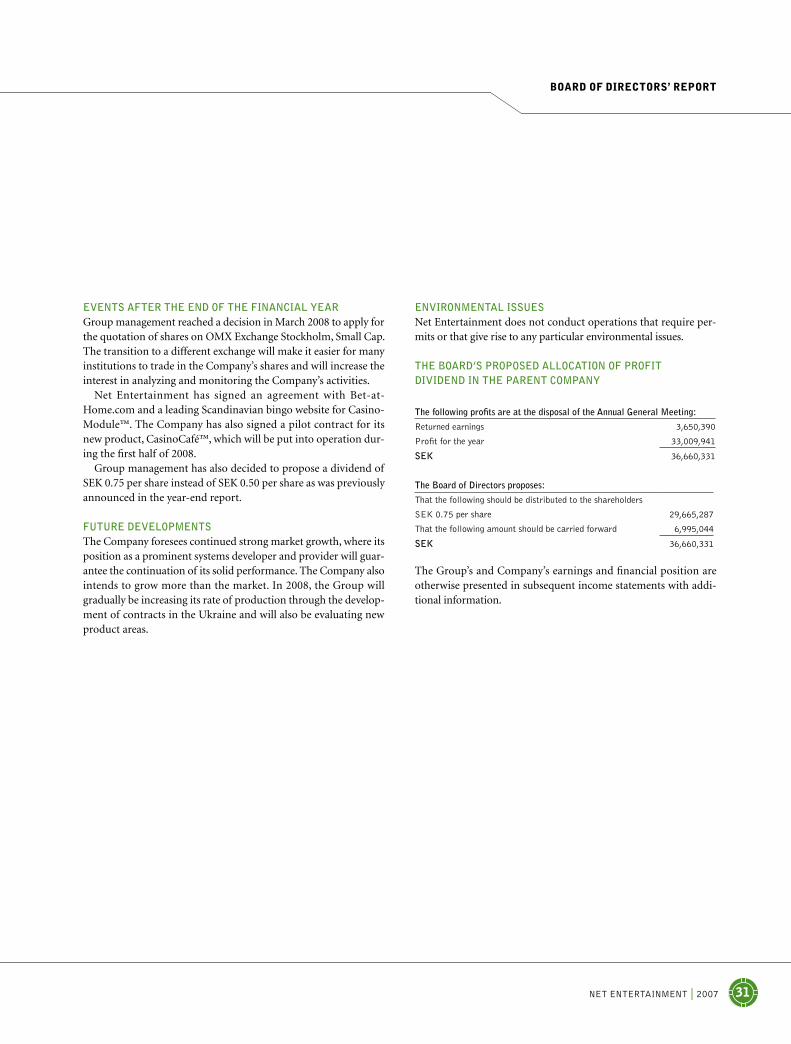
NET ENTERTAINMENT | 2007 31
eventS AfteR the enD of the finAnCiAl yeARGroup management reached a decision in March 2008 to apply for the quotation of shares on OMX Exchange Stockholm, Small Cap. The transition to a different exchange will make it easier for many institutions to trade in the Company’s shares and will increase the interest in analyzing and monitoring the Company’s activities.
Net Entertainment has signed an agreement with Bet-at-Home.com and a leading Scandinavian bingo website for Casino-Module™. The Company has also signed a pilot contract for its new product, CasinoCafé™, which will be put into operation dur-ing the first half of 2008.
Group management has also decided to propose a dividend of SEK 0.75 per share instead of SEK 0.50 per share as was previously announced in the year-end report.
futuRe DevelopMentSThe Company foresees continued strong market growth, where its position as a prominent systems developer and provider will guar-antee the continuation of its solid performance. The Company also intends to grow more than the market. In 2008, the Group will gradually be increasing its rate of production through the develop-ment of contracts in the Ukraine and will also be evaluating new product areas.
boarD of DireCtorS’ report
enviRonMentAl iSSueSNet Entertainment does not conduct operations that require per-mits or that give rise to any particular environmental issues.
the boARD’S pRopoSeD AlloCAtion of pRofit DiviDenD in the pARent CoMpAny
the following profits are at the disposal of the annual General meeting:
Returned earnings 3,650,390
Profit for the year 33,009,941
SeK 36,660,331
the board of directors proposes:
That the following should be distributed to the shareholders
SEK 0.75 per share 29,665,287
That the following amount should be carried forward 6,995,044
SeK 36,660,331
The Group’s and Company’s earnings and financial position are other wise presented in subsequent income statements with addi-tional information.

32 Net eNtertaiNmeNt | 2007
textFinancial reports
Table of conTenTs
financial reports
income statement – Group Page 33
Balance sheet – Group Page 34
Changes in equity – Group Page 35
Cash flow statement – Group Page 36
income statement – Parent Company Page 37
Balance sheet – Parent Company Page 38
Changes in equity – Parent Company Page 40
Cash flow statement – Parent Company Page 41
notes to the financial statements
Note 1 General information Page 42
Note 2 accounting and valuation principles Page 42
Note 3 Financial risks Page 47
Note 4 Leasing Page 47
Note 5 revenue and transactions Page 48
Note 6 Financial items Page 48
Note 7 auditors´ fees Page 49
Note 8 employee benefits Page 49
Note 9 income tax Page 50
Note 10 Profit per share Page 50
Note 11 intangible assets Page 51
Note 12 tangible fixed assets Page 52
Note 13 Shares in Group companies Page 52
Note 14 accounts receivable Page 53
Note 15 Prepaid expenses Page 53
Note 16 Long-term receivables Page 53
Note 17 Cash and cash equivalents Page 53
Note 18 equity Page 53
Note 19 Untaxed reserves Page 53
Note 20 Other liabilities Page 54
Note 21 accrued expenses Page 54
Note 22 Other information Page 54
audit report Page 55
Board of Directors Page 56

Net eNtertaiNmeNt | 2007 33
Financial reports
note 2007 2006
revenue 5 131,145 99,475
Other revenue 5 875 298
Total operating revenue 132,020 99,773
operaTing expenses
Capitalized work for own use 9,967 6,600
Other external expenses 4, 7 –39,263 –33,915
Personnel expenses 8 –44,250 –26,007
Depreciation/amortization 11, 12 –7,839 –4,407
Other operating expenses –55 –1,243
Total operating expenses –81,440 –58,972
operating profit 50,580 40,801
financial iTems 6
Financial income 411 237
Financial expense –187 –1,195
Total financial items 224 –958
profit before tax 50,804 39,843
income tax 9 –4,893 –11,361
profit for the year 45,911 28,482
of which aTTribuTed To:
Parent Company shareholders 45,911 28,482
Basic earnings per share (SeK) 10 1.16 0.72
Diluted earnings per share (SeK) 10 1.16 0.72
Proposed/implemented dividend per share 0.75 0.25
Income statement – Group

34 Net eNtertaiNmeNt | 2007
Financial reports
Balance sheet – Group
note Dec 31, 2007 Dec 31, 2006
ASSETS
fixed asseTs
intangible fixed assets 11 24,246 19,534
tangible fixed assets 12 5,860 4,722
Other long-term receivables 16 18 42
Total fixed assets 30,124 24,298
currenT asseTs
accounts receivable 14 11,143 5,386
Prepaid expenses and accrued income 15 15,874 7,889
Current tax assets 9 12,953 –
Other receivables 16 2,085 5,935
Cash and cash equivalents 17 25,915 13,053
Total current assets 67,970 32,263
ToTal asseTs 98,094 56,561
note Dec 31, 2007 Dec 31, 2006
EQUITY AND LIABILITIES
shareholders’ equiTy 18
Share capital 1,191 1,187
Other capital contributed 34,200 34,204
reserves 801 –232
retained earnings incl. profit for the year 16,953 –19,069
Total equity 53,145 16,090
long-Term liabiliTies
Deferred tax liabilities 9 2,195 835
Total long-term liabilities 2,195 835
currenT liabiliTies
accounts payable 4,739 3,159
Current tax liabilities 9 21,875 5,172
Other liabilities 20 7,399 21,047
accrued expenses and deferred income 21 8,741 10,258
Total current liabilities 42,754 39,636
ToTal equiTy and liabiliTies 98,094 56,561
pledged assets none none
contingent liabilities none none

Net eNtertaiNmeNt | 2007 35
Financial reports
chanGes In equIty – Group
note 18share
capitalother capital
contributed reserves
retained earnings incl. profit for year Total equity
opening equity Jan 1, 2006 1,021 34,204 – –23,096 12,129
translation differences for the year –232 –232
Total changes in value recognised directly inequity, excl. transactions with company’s owners –232 –232
Profit for the year 28,482 28,482
Total changes in value, excl. transactionswith company’s owners –232 28,482 28,250
Dividend to former Parent Company (Betsson aB) –9,889 –9,889
Group contributions to former Parent Company (Betsson aB) –20,000 –20,000
effect of taxation on Group contribution 5,600 5,600
Bonus issue and split 166 –166 –
closing equity dec 31, 2006 1,187 34,204 –232 –19,069 16,090
translation differences for the year 1,033 1,033
Total changes in value recognised directly inequity, excl. transactions with company’s owners 1,033 1,033
Profit for the year 45,911 45,911
Total changes in value, excl. transactionswith company’s owners 1,033 45,911 46,944
Dividend paid –9,889 –9,889
Bonus issue 4 –4 –
closing equity dec 31, 2007 1,191 34,200 801 16,953 53,145
there is no minority interest in the Group. all equity is therefore attributable to Parent Company shareholders.

36 Net eNtertaiNmeNt | 2007
note 2007 2006
operaTing acTiviTies
Profit after financial items 50,804 39,843
adjustments for non-cash items
– Depreciation/amortization 11, 12 7,839 4,407
– Capital gain/loss on sales – –130
– Other 529 398
income taxes paid 184 –795
Cash flow from operating activities before changes in working capital 59,356 43,723
Change in receivables –9,892 3,036
Change in accounts payable 1,580 1,751
Change in current liabilities –15,165 –12,128
cash flow from operating activities 35,879 36,382
invesTing acTiviTies
acquisition of intangible fixed assets 11 –10,460 – 14,560
acquisition of tangible fixed assets 12 –3,003 –4,461
Sale of tangible fixed assets – 190
Disposal of shares and participating interests, subsidiaries – –
Disposal of other financial fixed assets 24 –8
Change in long-term receivables – 278
cash flow from investing activities –13,439 –18,561
financing acTiviTies
Dividend paid –9,889 –9,889
Cash flow from financing activities –9,889 –9,889
change in cash and cash equivalents 12,551 7,932
Cash and cash equivalents at beginning of year 13,053 5,535
exchange rate differences in cash and cash equivalents 311 –414
cash and cash equivalents at year-end 17 25,915 13,053
additional disclosures
Unutilized credit facilities amounted to – –
interest paid during the period amounted to 187 16
interest received during the period amounted to 411 237
cash flow statement – Group
Financial reports

Net eNtertaiNmeNt | 2007 37
textFinancial reports
Income statement – parent company
note 2007 2006
revenue 5 78,050 110,022
Other revenue 5 874 293
Total operating revenue 78,924 110,315
operaTing expenses
Capitalized work for own use 4,620 6,600
Other external expenses 4.7 –32,827 –43,976
Personnel expenses 8 –40,509 –25,963
Depreciation/amortization 11, 12 –5,208 –4,275
Other operating expenses –56 –1,127
Total operating expenses –73,980 –68,741
operating profit 4,944 41,574
financial iTems 6
Profit/loss from interests in Group companies 29,515 –61
interest and similar income 195 193
interest and similar expense –186 –1,192
Total financial items 29,524 –1,060
profit after financial items 34,468 40,514
appropriations 19 – –1,702
profit before tax 34,468 38,812
tax 9 – 1,458 –10,885
profiT for The year 33,010 27,927

38 Net eNtertaiNmeNt | 2007
Balance sheet – parent company
note Dec 31, 2007 Dec 31, 2006
ASSETS
fixed asseTs
intangible fixed assets 11
Games and gaming systems 12,612 11,603
Concessions, patents and similar rights 224
trademarks 44 94
Total intangible fixed assets 12,656 11,921
Tangible fixed assets 12
equipment and fittings 3,635 4,722
Total tangible fixed assets 3,635 4,722
financial fixed assets
Participating interests in Group companies 13 216 142
Other long-term receivables 16 5 42
Total financial fixed assets 221 184
ToTal fixed asseTs 16,512 16,827
currenT asseTs
current receivables
accounts receivable 14 4 2,965
receivables from Group companies 5 29,545 15,528
Other receivables 16 2,083 5,935
Prepaid expenses and accrued income 15 2,024 4,528
Total current receivables 33,656 28,956
cash and bank balances 17 12,462 6,127
ToTal currenT asseTs 46,118 35,083
ToTAL ASSETS 62,630 51,910
Financial reports

Net eNtertaiNmeNt | 2007 39
Financial reports
note Dec 31, 2007 Dec 31, 2006
EQUITY AND LIABILITIES
shareholders’ equiTy 18
restricted equity
Share capital 1,191 1,187
Statutory reserve 38 38
Total restricted equity 1,229 1,225
unrestricted equity
retained earnings 3,650 –14,385
Profit for the year 33,010 27,927
Total unrestricted equity 36,660 13,542
Total equity 37,889 14,767
untaxed reserves 19 2,982 2,982
currenT liabiliTies
accounts payable 4,504 3,159
Liabilities to Group companies 1,806 377
tax liabilities 9 6,763 5,172
Other liabilities 20 924 21,048
accrued expenses and deferred income 21 7,762 4,405
Total current liabilities 21,759 34,161
ToTAL EQUITY AND LIABILITIES 62,630 51,910
pledged assets none 13
contingent liabilities none 193
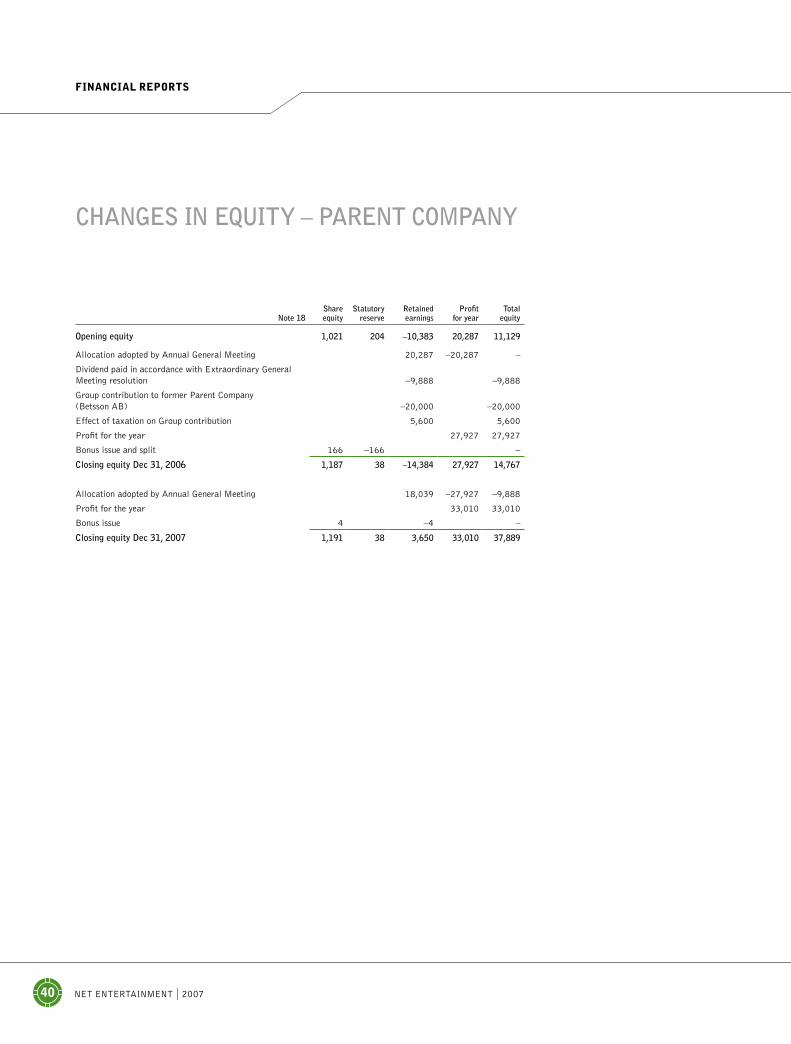
40 Net eNtertaiNmeNt | 2007
note 18share
equitystatutory
reserveretained earnings
profit for year
Total equity
opening equity 1,021 204 –10,383 20,287 11,129
allocation adopted by annual General meeting 20,287 –20,287 –
Dividend paid in accordance with extraordinary General meeting resolution –9,888 –9,888
Group contribution to former Parent Company (Betsson aB) –20,000 –20,000
effect of taxation on Group contribution 5,600 5,600
Profit for the year 27,927 27,927
Bonus issue and split 166 –166 –
closing equity dec 31, 2006 1,187 38 –14,384 27,927 14,767
allocation adopted by annual General meeting 18,039 –27,927 –9,888
Profit for the year 33,010 33,010
Bonus issue 4 –4 –
closing equity dec 31, 2007 1,191 38 3,650 33,010 37,889
chanGes In equIty – parent company
Financial reports

Net eNtertaiNmeNt | 2007 41
Financial reports
note 2007 2006
operaTing acTiviTies
Profit after financial items 34,468 40,514
adjustments for non-cash items
– Depreciation/amortization 11, 12 5,208 4,275
– Capital gain/loss on sales of fixed assets –131
– Other –297 205
income taxes paid –218 –751
cash flow from operating activities before changes in working capital 39,161 44,112
Change in receivables –3,930 –6,350
Change in accounts payable 1,345 1,751
Change in current liabilities –15,756 –17,528
cash flow from operating activities 20,820 21,985
invesTing acTiviTies
acquisition of intangible fixed assets 11 –4,620 –6,819
acquisition of tangible fixed assets 12 –2,759 –4,461
Disposal of tangible fixed assets 2,820 190
acquisition of shares and participating interests 13 –53
Disposal of shares and participating interests 13 34 –
increase in share capital 13 –108 30
Change in long-term receivables 37 –
cash flow from investing activities –4,596 –11,113
financing acTiviTies
Dividend –9,889 –9,889
cash flow from financing activities –9,889 –9,889
change in cash and cash equivalents 6,335 983
Cash and cash equivalents at beginning of year 6,127 5,349
exchange rate differences in cash and cash equivalents –205
cash and cash equivalents at year-end 17 12,462 6,127
additional disclosures
Unutilized credit facilities amounted to – –
interest paid during the period amounted to 135 13
interest received during the period amounted to 187 193
cash flow statement – parent company

42 Net eNtertaiNmeNt | 2007
notes to the fInancIal statements
NoTE 1 general informaTion
Net entertainment Ne aB (Parent Company, corporate registration number 556532-6443) and its subsidiaries (together, the Group) is a Swedish it consultancy group, which develops and licenses software for internet-based gaming. the Group has offices in Stockholm, malta and Costa rica and the majority of its customers are sports gaming sites of varying sizes.
the Parent Company is a public limited liability company with its reg-istered office in Sweden. the address of the head office is Birger Jarls-gatan 57B, Stockholm, Sweden. the Parent Company has been trading on the Nordic Growth market (NGm) equity since april 5, 2007.
this annual report was approved for publication by the Board of Directors on march 27, 2008. the Statements of income and Balance Sheets shall be adopted at the annual General meeting on april 10, 2008.
NoTE 2 accounTing and valuaTion principles
preparation of the reportthe consolidated financial statements have been prepared in accord-ance with the Swedish annual accounts act, international Financial reporting Standards (iFrS) issued by the international accounting Standards Board (iaSB) and the statements of the international Finan-cial reporting interpretations Committee (iFriC) as adopted by the eU Commission for application within the eU. the Group has also applied the Swedish Financial accounting Standards Council’s recommendation rr 30:06 ”Supplementary accounting regulations for groups”.
this annual report has been prepared by the Parent Company with subsidiaries distributed by Betsson aB (publ) as per march 30, 2007. the Group has been historically created via transactions under common control of the former Betsson Group. iFrS 3 provides no guidelines for such transactions and iaS 8 guidelines specify that related standard regulations in such a situation can be used as a principle basis for re-porting the specific event. the US GaaP accounting principles provide such a regulatory framework and the principle that has thus been chosen is the preparation of the consolidated financial statements according to the historical value method (”predecessor basis”).
this means that the subsidiaries that were subsidiaries of Net enter-tainment Ne aB on march 30, 2007 and whose operations (under the application of the historical value method of accounting) are historically considered to belong to the Group, have been included in the consolida-ted financial statements for comparison with 2006 figures. the subsi-diaries in malta (see note 13) were brought over from other companies in the Betsson Group on January 1, 2006. the transaction took place under common control and at book value and no revaluation of assets or liabilities has taken place on account of this. Likewise, the conso-
lidated financial statements do not include subsidiaries which at the start of 2006 but no later than march 30, 2007 belonged to the Group.Prerequisites for preparing the Group’s financial reportsthe Parent Company’s functional currency is the Swedish krona (SeK), which is also the reporting currency for the Parent Company and the Group. this means that the financial reports are presented in SeK. Unless otherwise specified, all amounts are rounded to the nearest thousand. assets and liabilities are recognised at acquisition value, apart from some financial assets and liabilities that are measured at fair value.
the most important accounting principles in the preparation of these consolidated financial statements are stated below. these principles have been applied consistently for all the years presented, unless otherwise stated.
the Parent Company applies the same principles as the Group, with the exception that the Parent Company also applies rr 32 ”reporting for Legal entities”. this results in certain differences caused by the requirements of the annual accounts act or by tax considerations. the accounting principles for the Parent Company are stated below in the section ’Parent Company accounting principles’.
standards, changes and interpretations that came into force in 2007iFrS 7, Financial instruments: information, and the supplementary change of iaS 1, Presentation of Financial Statements – Capital Dis-closures. this standard concerns extended disclosure requirements relat-ing to financial instruments but has no effect on the presentation and valuation of the Group’s financial instruments.
iFriC 10, interim Financial reporting and impairment states that an entity shall not reverse an impairment loss recognised in a previous interim period in respect of goodwill or an investment in either an equity instrument or a financial asset carried at cost. this interpretation has no effect on the Group’s financial reports.
standards, changes and interpretations that came into force in 2007 but that are not relevant for the groupiFriC 7, applying the restatement approach under iaS 29, Financial reporting in Hyperinflationary economies.
iFriC 8, Scope of iFrS 2 assessment of whether equity instruments fall within the framework of iFrS 2.
iFriC 9, reassessment of embedded Derivatives is not relevant as no Group company has changed the conditions in existing contracts.
iFriC 11, iFrS 2 – Group and treasury Share transactions.
standards and changes of existing standards which still have not come into force and which have not been applied in advance by the groupiaS 1 (amendment), Presentation of Financial Statements (effective from January 1, 2009). the amendment is still subject to endorsement by the eU. the amendments primarily involve changes in format and
notes
Net eNtertaiNmeNt | 2007 43
notes
designations of the financial reports. thus, the Group’s future format of its financial reports will be affected by the introduction of this standard.
iaS 23 (amendment), Borrowing costs (effective from January 1, 2009). the amendment is still subject to endorsement by the eU. the amendment requires an entity to capitalize borrowing costs directly attributable to the acquisition, construction or production of a qualify-ing asset (one that takes a substantial period of time to get ready for use or sale) as part of the cost of that asset. the option of immediately expensing those borrowing costs will be removed.
iaS 27 (amendment), Consolidated and Separate Financial State-ments (effective from July 1, 2009). the amendment is still subject to endorsement by the eU. the amendment requires that income attribut-able to non-controlling interests must always be recognised even if this means that the share of the non-controlling interests is negative, that all transactions with non-controlling interests must be recognised in equity and that, in cases where a parent company loses the controlling interest, any remaining share must be reassessed at fair value. this amendment to the standard will affect the accounting for future transactions.
iFrS 3 (amendment), Business Combinations (effective from July 1, 2009). this amendment is still subject to endorsement by the eU. the amendment applies proactively to combinations after the date it comes into force. the application will mean a change in accounting for future business combinations, e.g. accounting of transaction costs, possible con-ditional purchase prices and successive acquisitions. the amendment will not have any impact on previous business combinations but will affect the accounting for future business combinations.
iFrS 8, Operating segments (effective from January 1, 2009). iFrS 8 replaces iaS 14 and aligns segment reporting with the requirements of the USa standard SFaS 131, Disclosures about segments of an en-terprise and related information. the new standard requires an entity to adopt the ”management approach” for presenting the segment informa-tion, which means that it is presented in the way that is used in the inter-nal reporting. the Group will implement iFrS 8 from January 1, 2009. management is still analyzing what impact the standard will have but does not believe that it will lead to any significant impairment losses.
interpretations of existing standards which still have not come into force and which are not relevant for the groupiFrS 2, Share-based Payment (amendment) – Vesting Conditions and Cancellations (effective from January 1, 2009). the amendment is still subject to endorsement by the eU. the amendment clarifies the defini-tion of vesting conditions and introduces the concept of ”non-vesting conditions” (conditions not defined as vesting conditions). the Group currently has no share-based remuneration.
iFriC 12, Service Concession arrangements (effective from January 1, 2008). this interpretation is still subject to endorsement by the eU. iFriC 12 applies to contractual arrangements whereby a private sec-tor operator participates in the development, financing, operation and maintenance of infrastructure for public sector services. the Group does not supply services to the public sector.
iFriC 13, Customer Loyalty Programmes (effective from July 1, 2008). this interpretation is still subject to endorsement by the eU. iFriC 13 clarifies that when goods or services are sold together with some form of customer loyalty incentive (e.g. loyalty points or free pro-
ducts), the arrangement is a multiple-element agreement. at present, the Group does not have any loyalty programmes which fall within iFriC 13.
iFriC 14, ”iaS 19 – the limit on a defined benefit asset, minimum funding requirements and their interaction” (effective from January 1, 2008). this is still subject to endorsement by the eU. iFriC 14 provides guidance on assessing the limit in iaS 19 on the amount of the surplus that can be recognised as an asset. the Group will apply iFriC 14 from January 1, 2008, but this is not expected to have any impact on the Group’s accounts.
classificaTionsassets are classified as current assets if they are expected to be sold or are intended to be sold or used in the Company’s normal operating cycle, if they are held primarily for trading purposes, if they are expected to be sold within twelve months after the balance sheet date or if they are cash or cash equivalents. all other assets are classified as fixed assets. Liabilities are classified as current liabilities if they are expected to be settled in the Company’s normal operating cycle, if they are owned primarily for trading purposes, if they are expected to be settled within twelve months after the balance sheet date or if the Company does not have an unconditional right to defer settlement of the liability for at least twelve months after the balance sheet date. all other liabilities are classified as long-term liabilities.
consolidaTed financial sTaTemenTsthe consolidated financial statements include the Parent Company and entities in which the Parent Company, directly or indirectly, has an inter-est of more than one half of the voting rights or otherwise has power to govern the financial and operating policies so as to obtain economic benefits.
principles of consolidationthe consolidated financial statements have been prepared in accordance with the purchase method of accounting. this means that the Parent Company indirectly acquires the subsidiary’s assets and takes over its liabilities. the cost of an acquisition is measured as the fair value of the assets given, plus costs directly attributable to the acquisition. identifi-able assets acquired and liabilities and contingent liabilities assumed in a business combination are measured initially at their fair values at the acquisition date, irrespective of the extent of any minority interest. the difference between the cost of acquisition of the shares and the fair value at the time of acquisition of the Group’s share of the identifiable net assets acquired is recognised as consolidated goodwill. if the cost of acquisition is less than the fair value, the difference is recognised directly in the income statement.
the subsidiaries’ income, expenses, assets and liabilities are included in the consolidated financial statements from the date on which control arises (acquisition date) until the date on which control ceases. intra-Group receivables, liabilities and transactions and any associated gains, are eliminated in their entirety.
Translation of foreign operations
Operations that do not have the SeK as their functional currency are translated to SeK using the current method. this means that all assets,

44 Net eNtertaiNmeNt | 2007
provisions and other liabilities are translated at the closing rate, and in-come statement items are translated at the average rate. exchange dif-ferences arising during this conversion (translation differences) are rec-ognised directly in equity. independent foreign operations are sold at their accumulated translation differences, less any hedging in the consolidated financial statements.
revenueNet entertainment’s revenue is largely dependent on the licensing of on-line gaming products/services. revenue consists of the fair value of what is received or will be received for services sold in the Group’s operating activities excluding Vat and discounts, and after elimination of internal Group sales. all invoicing takes place monthly in arrears.
Casinomoduletm and CasinoCafétm generate license revenues in ac-cordance with a royalty model and the size is determined by the earnings the product generates for the customer and is recognised in the period the customer uses the product. Other revenues from related consulting and service activities (start-up and delivery fees) are recognised as rev-enue when delivery has been made to the customer.
the Group reports a revenue when its amount can be reliably meas-ured. it is likely that the Company will reap financial benefits in the future. if it is considered that the revenue figure cannot be measured in a reliable manner before all obligations with regard to the sale have been fulfilled or have lapsed, the Group bases its assessments and estimates on historical outcomes and takes into account the type of customer, type of transaction and special circumstances in each individual case. if there are any circumstances that might change the original assessment of the size of the revenue, the estimates shall be reviewed. these reviews can result in increases or decreases of the estimated revenue or expenses and affect the revenue during the period that the circumstances that caused the change came to the knowledge of the company management.
other operating revenuerevenues from non-core activities are reported as other operating reve-nue. this item mainly includes recovered amortized receivables, exchange gains from operations and profit from the sale of fixed assets.
other operating expensesCosts of secondary activities in ordinary operations relating to operat-ing receivables and operating liabilities are reported as other operating expenses. this item mainly includes exchange losses from operations and losses on the sale of fixed assets and businesses.
segment reportingthe Company’s only product (primary segment) is Casinomoduletm. Geographically, Net entertainment’s partners (gaming sites, betting companies) offer gaming to their customers in many different coun-tries. Net entertainment does not have access to information about the end customer (the player) and therefore cannot determine where gaming revenues originate geographically. the domicile of Net enter-tainment’s direct customers’ (gaming sites) is determined by reasons completely different to proximity to the local market, for instance ap-propriate gaming legislation, tax-related reasons or other reasons. the advantage of the internet is that it is a global, cross-border form of distribution, where gaming site owners can be domiciled anywhere in
the world and still serve many local markets around the world. Dividing operations into geographical segments according to these companies’ legal domicile would not provide relevant information. Similarly, the Net entertainment Group’s operations are spread geographically for legal and tax-related reasons.
cash flow statementthe cash flow statement is prepared using the indirect method. the rec-ognised cash flow only covers transactions that result in incoming or outgoing payments. this means that discrepancies may occur compared with changes in individual items in the balance sheet.
intangible fixed assetsDevelopment expenditure is capitalized to the extent that it is expected to result in future economic benefits. Only expenditure associated with the development phase of online gaming products, systems and platforms is capitalized and recognised as an asset from the date on which the decision is made to complete the project and when conditions allow this. the carrying amount includes expenditure on materials, purchased serv-ices, direct payroll expenses and indirect expenses that can be reasonably and consistently attributed to the asset.
Development expenses are recognised in the balance sheet at cost, net of accumulated amortization and impairment losses. regular as-sessments are made of the projects’ income-generating capacity in order to identify any impairment requirements. intangible fixed assets also include acquired gaming agreements, concessions and trademarks. these intangible assets are reported in the balance sheet at acquisition value, less accumulated amortization and impairment losses.
all intangible assets have limited useful life.
Tangible fixed assetstangible fixed assets are recognised at historical cost, less accumulated depreciation and any impairment losses. repairs and maintenance are expensed as they arise.
depreciation/amortization and impairmentDepreciation/amortization is based on the original acquisition value less the calculated residual value and any impairment losses. Depreciation/amortization is applied on a straight-line basis over the asset’s estimated useful life. Useful lives of assets (years):
n trademarks, domain names max 5 years.n Gaming agreements and concessions 3-5 years.n Capitalized development expenses for games, gaming systems and
gaming platforms are based on class of asset and amount to max 5 years.
n Servers 5 years.n Office equipment and other computers 5 years.n Vehicles 3–5 years.n Computers (workstations for developers, etc.) expensed.
the residual value and useful life of an asset is reviewed annually. if the carrying amount of tangible, intangible or financial fixed assets in the Group appears excessive, impairment is identified and quantified by reference to the recoverable value of individual or naturally related types
notes
Net eNtertaiNmeNt | 2007 45
notes
of assets, measured as the higher of net selling price and value in use. the value in use is measured as expected future discounted cash flow. an impairment loss is the difference between the carrying amount and the recoverable value. When a previously recognised impairment loss is no longer warranted, it is reversed. a reversal may not be higher than a value that does not exceed the carrying amount that would have been recognised (net of amortization or depreciation) had no impairment loss been recognised.
borrowing costsBorrowing costs are expensed in the income statement for the period to which they relate.
financial instrumentsFinancial assets can be classified in the following categories:
(a) financial assets measured at fair value in the income statement, (b) loan receivables and accounts receivable and (c) available-for-sale financial assets. the classification is dependent upon the purpose for which the financial asset was acquired. Group management establishes the clas-sification of the financial assets at the first accounting opportunity.
the Group does not have any assets which come under the categories (a) or (c).
loan receivables and accounts receivable
Loan receivables and accounts receivable are financial assets that are not derivatives with fixed payments or payments that can be defined, and are not listed in an active market. they are included in current assets with the exception of items with an expiry date of more than 12 months from the closing date, which are classified as fixed assets. in this category, accounts receivable are categorised by accounts receivable and other receivables as well as Cash or cash equivalents in the balance sheet (see notes 14 and 17).
accounts receivable
accounts receivable are initially measured at accumulated acquisition value and then at accumulated acquisition value with application of the effective interest method, less any provision for impairment. Provision for impairment on accounts receivable is made when there is direct proof that the Group will not be able to collect all the amounts due under the original terms of the receivable. the amount of a provision is the differ-ence between the asset’s carrying value and the current value of assessed future cash flows, discounted using the original effective interest rate, and the adjustment is recognised in the income statement in sales costs. When an accounts receivable cannot be collected, it is completely written off accounts receivable.
cash and cash equivalentsCash and cash equivalents include cash, bank balances and other short-term investments with an expiry date within three months of the acquisi-tion date.
share capitalOrdinary shares are classified as equity. transactions that can be directly attributed to issues of new shares or options are recognised, net after tax, in equity as a deduction from the issue amount.
accounts payableaccounts payable are initially recognised at fair value and then at the accumulated acquisition value using the effective interest method.
other financial liabilitiesFinancial liabilities not held for trading are measured at accumulated acquisition value. accumulated acquisition value is measured on the basis of the effective interest calculated when the liability was recog-nised. this means that surplus and deficit values and direct issue costs are accrued over the liability’s maturity.
financial investmentsFinancial investments are either financial fixed assets or short-term invest-ments, depending on the purpose of the holding. if their maturity or ex-pected period of ownership exceeds one year they are financial fixed assets, and if it is less than one year they are short-term investments. Financial investments comprising shares are either financial assets measured at fair value in the income statement or available-for-sale financial assets.
interest-bearing securities acquired with the purpose of holding un-til maturity are classified as held-to-maturity financial assets and are measured at accrued acquisition value. interest-bearing securities not acquired to be held until maturity are classified as available-for-sale financial assets. When financial assets are measured at fair value in the income statement, any changes in value are recognised in net financial income/expense.
Taxestax in the income statement consists of current tax and deferred tax. Current tax is tax (paid or received) that relates to the current year. this also includes adjustment of current tax attributable to prior periods.
Valuation of tax liabilities and receivables takes place at nominal amounts and in accordance with tax regulations and tax rates that are adopted or advised and, in all certainty, will be fixed. For items that are recognised in the income statement, related tax effects are also thus recognised in the income statement. tax effects of items that are recognised directly in equity are recognised in equity.
Deferred tax is calculated using the balance sheet liability method based on temporary differences between reported and tax related va-lues on assets and liabilities, and applying the tax rates and regulations adopted or advised at the balance sheet date and which are expected to apply when the affected deferred tax receivable is realised or the deferred tax liability is settled. temporary differences are not taken into consideration in goodwill on consolidation or in differences attri-butable to shares in subsidiaries and associated companies which are not expected to be taxed in the near future. Untaxed reserves including deferred tax liabilities are reported in legal entities. Deferred tax assets relating to deductible temporary differences and loss carryforwards are only reported insofar as it will be possible to utilize them in the future and that they will result in lower future tax payments.
leasingLeasing is classified either as finance or operating leasing in the consoli-dated financial statements. Leasing of fixed assets where the Group is es-sentially exposed to the same risks and rewards as in direct ownership is classified as finance leasing. the leased asset is recognised in fixed assets
46 Net eNtertaiNmeNt | 2007
and the corresponding rental liability falls under interest-bearing liabili-ties. Leasing of assets where the lessor essentially remains the owner of the asset is classified as operating leasing and the leasing charges are expensed on a straight-line basis over the leasing period. Details of operating leasing and rental agreements are shown in note 4.
employee benefitspension expense and pension commitments
the Group has various pension plans in different countries. the pen-sion plans are normally financed by payments from the relevant Group companies and in some cases from employees. all pension plans are defined-contribution plans, which means that the Group does not have any legal or informal obligations when the contributions have been paid. the Group’s disbursements for defined-contribution pension plans are reported as an expense during the period in which the employee per-formed the services to which the contribution relates.
remuneration after termination of employment
the Group has no obligations to employees after they have retired or finished in their posts.
Termination benefits
Compensation is paid when an employee’s job is terminated by Net enter tainment before the normal retiring date or when an employee voluntarily accepts severance pay. the Group recognises severance pay when it is demonstrably committed to either terminating the employment of employees in accordance with a detailed formal plan without the pos-sibility of retraction, or providing termination benefits as a result of an offer which is made to encourage voluntary departure.
profit-sharing and bonus plans
the Group recognises a liability and an expense for bonus and profit shares, based on various qualitative and quantitative standards. the Group recognises a provision when there is a legal obligation or an informal obligation owing to previous practice.
provisionsa provision is recognised in the balance sheet when the Company has a present legal or constructive obligation as a result of a past event and it is likely that an outflow of financial resources will be required to settle the obligation and a reliable estimate of the amount can be made. in a situation where the effect of when the payment takes place is important, provisions are measured by discounting expected future cash flows at an interest rate before tax, so that it reflects the present market value of the expenditure required to settle the amount and, if applicable, the risks associated with the liability. a restructuring provision is recognised when the Group has defined a detailed, formal restructuring plan and the restructuring has either commenced or has been officially approved. No provision is made for future operating expenses.
contingent liabilitiesa contingent liability is recognised when there is a possible obligation arising from past events and its existence is confirmed only by the occur-rence or non-occurrence of one or more uncertain future events, or when there is an obligation which is not reported as a liability or a provision
due to the fact that it is not probable that an outflow of resources will be required to settle the obligation.
parenT company’s accounTing principlesthe Parent Company complies with the same accounting principles as the Group with the exception of that which is stated below.
interests in subsidiaries are reported at acquisition value with deduc-tions for possible depreciation.
Group and shareholder contributions are reported in accordance with the recommendations of the Swedish Financial accounting Standards Council’s emerging issues task Force. Shareholder contributions are recognised directly in the equity of the recipient company and capitali-sed in the contributor’s shares and participating interests. these assets are subsequently subject to impairment testing. Group contributions are reported on the basis of economic substance. this means that Group con-tributions made or received for the purpose of minimising the Group’s total tax are recognised directly in retained earnings after a deduction for their current tax effect.
all leasing agreements are recognised as operating leasing.received dividends are recognised when the right to receive dividends
is considered to be reliable.in the Parent Company, owing to the connection between reporting
and taxation, the deferred tax liabilities on untaxed reserves are recogni-sed as a part of the untaxed reserves.
Key esTimaTes and assumpTionsthe Group makes estimates and assumptions about the future. these estimates are used when preparing the financial reports. By definition, these predictions rarely match the actual results. the estimates and as-sumptions which involve a risk of significant adjustments in the carrying values of assets and liabilities in the next financial year are presented below. they are regularly evaluated and are based on historical experi-ence and other factors, including expectations of future events that are deemed reasonable in the circumstances.
income tax and vaTthe Group is liable to pay tax in many different countries. extensive as-sessments are required in order to establish the provisions for income tax. there are many transactions and calculations where the final tax is uncer-tain at the time when the transactions and calculations are carried out. at present, no extra provision has been made for any tax audit issues.
Foreign gaming companies in malta have until now been exempted from Vat. the maltese authorities are currently reviewing regulations, but at present it is difficult to have a clear idea of which, if any, regula-tory changes may be made. if some areas of the maltese company’s operations become subject to Vat, it will most likely have a negative im-pact on profits. at present, no extra provision has been made for this.
impairment testsevery year, the Group’s assets are tested to determine if any impair-ment has occurred in accordance with iaS 36. the Group has invested considerable amounts in the development of gaming platforms and their carrying amounts are compared with present value calculated future discounted cash flows. the testing is carried out in the fourth quarter. No impairment was identified following tests in 2007.
notes

Net eNtertaiNmeNt | 2007 47
notes
NoTE 3 financial risKs
the Group’s financial activities are pursued on the basis of a low-risk financial policy as established by the Board. Financial activities and the management of financial risks are coordinated via the Parent Company Net entertainment Ne aB (publ), which is also responsible for the investment of excess liquidity.
the wholly owned operating subsidiaries are themselves responsible for managing their financial risks within the framework set by the Board and following coordination with the Parent Company.
marKeT risKGroup earnings are exposed to changes in exchange rates since most sales are in euros, and expenses (transaction exposure) are in SeK. Net entertainment does not currently hedge this portion. earnings are also affected by exchange rate fluctuations when foreign subsidiaries’ earn-ings are translated to SeK (translation exposure). moreover, exchange rate movements affect Group equity when assets and liabilities in foreign subsidiaries are translated to SeK (translation exposure). at the present time there is no hedging of equity in foreign subsidiaries.
if the SeK had weakened/strengthened by 10 percent in relation to the euro with all other variables constant, earnings for the year as of December 31, 2007, would have been SeK 4,248 (55) thousand higher/lower.
licensing revenues per currency 2007
inTeresT raTe risKsNet entertainment is largely a debt-free company, which means that the interest rate risk to which Group revenue and cash flows are exposed, is low. Changes in the interest rate position affect the Group’s return on cash and cash equivalents. the risk in these changes is deemed im-material.
crediT risKthe Group does not have any significant concentration of credit risks. the Group has set guidelines for safeguarding the sale of services to cus-tomers with a suitable credit background. No credit limits were exceeded during the reporting period and management does not expect any losses resulting from failed payments from these other parties.
NoTE 4 leasing
Leasing expenses for vehicles, rent for premises and other rented equip-ment as well as that which falls under the heading operational leasing amounted to:
group parenT company
2007 2006 2007 2006
expensed lease payments and rental charges –3,046 –2,113 –2,715 –2,103
Total –3,046 –2,113 –2,715 –2,103
Future minimum charges for non-cancellable operating leases and rental agreements:
group parenT company
– during 2008 5,605 5,352
– during 2009–2012 8,020 8,020
– after 2012 – –
Total 13,625 13,382
liquidiTy risKLiquidity risk is managed by means of the Group holding sufficient cash and cash equivalents in order to finance the operation. management also monitors rolling forecasts for the Group’s liquidity reserve, which consist of cash and cash equivalents (note 17) on the basis of expected cash flows.
Group financial liabilities essentially consist of accounts payable, where the contractual expiry date falls within 12 months.
capiTal risK managemenTthe aim of Net entertainment with regard to the capital structure is to secure the Group’s ability to continue its operations, so that it can con-tinue to generate return for its shareholders and maintain an optimum capital structure in order to keep the capital costs down.
in order to maintain or adjust the capital structure, Net entertain-ment can change the allocation paid to the shareholders, repay capital to the shareholders, issue new shares or sell assets to reduce liabilities.
Net entertainment assesses the capital on the basis of net debt/equity ratio and quick ratio (see page 42).
the net debt/equity ratio (multiple) at the end of the reporting period amounted to –0.5 (–0.8) whilst the quick ratio amounted to 159 (65) percent.
Tax risKs Foreign gaming companies in malta have until now been exempted from Vat.
the maltese authorities are currently reviewing their regulations on foreign gaming companies, but it is not currently possible to gain a defi-nite understanding of possible pending regulatory changes. the opera-tions in malta have until now been exempted from Vat. if some areas of the maltese company’s operations become subject to Vat, it will most likely have a negative impact on profits.
USD 3%
euro 97%
Calculated on avarage exchanges rates for 2007

48 Net eNtertaiNmeNt | 2007
NoTE 6 financial iTems
group
2007 2006
interest income 492 237
Net exchange differences –81 –
finance income 411 237
interest expense –187 –16
exchange differences –1,179
finance expense –187 –1,195
Total financial items 224 –958
parenT company
2007 2006
anticipated dividend from subsidiaries 29,576 –
Capital loss on sale of shares in subsidiaries and liquidation –61 –61
Total profit/loss from other securitiesand investments and interests in group companies 29,515 –61
interest income, external 225 193
exchange differences –30
Total financial income andsimilar income 195 193
interest expense, external –186 –13
exchange differences –1,179
Total financial expenses and similar expenses –186 –1,192
Total financial items 29,524 –1,060
notes
NoTE 5 revenues and relaTed-parTy TransacTions
group parenT company
2007 2006 2007 2006
revenue
– License revenues, royalties 131,145 95,550 6,185 81,531
– Consulting revenues – 3,857 71,803 28,423
– invoiced expenses – 65 62 65
– rental revenues – 3 – 3
Total 131,145 99,475 78,050 110,022
oTher operaTing revenue
– Capital gain on the sale of fixed assets – 293 – 293
– exchange differences, operations 853 – 853 –
– Other 22 5 21 –
Total 875 298 874 293
the Parent Company is related to its subsidiaries, see Note 11. Sold services pertain mainly to consulting services, license fees, hosting and forward-invoiced expenses. related-party transactions are priced on the basis of normal market conditions.
For 2007, Net entertainment has license revenues from the Betsson Group, in which the Chairman of the Board and two Board members are partners and board members.
For remuneration to board members and senior executives, see Note 8.
relaTed-parTy TransacTions
parenT company
2007 2006
purchases of services from relaTed parTies
Purchases from subsidiaries 13,792
– share of total operating expenses 18.3%
sale of services To relaTed parTies
Sales to subsidiaries 77,857 24,584
– share of total revenues 98.65% 22.3%
liabiliTy To relaTed parTies
Liability to subsidiaries 1,806 377
receivable from relaTed parTies
receivable from subsidiaries 29,545 15,528
commenTs on financial iTems in The income sTaTemenTsparent companyin 2007, the Parent Company sold all interests in the Costa rican sub-sidiary Feliz europa. the capital loss amounted to SeK 61,000.
in 2006, the Parent Company divested all participating interests in the Costa rican subsidiary mil treinta y Dos and liquidated the subsidi-ary Let it flow aB. the total capital loss amounted to SeK 61,000.

Net eNtertaiNmeNt | 2007 49
NoTE 8 employee benefiTs
average number of employees2007 2006
average number
of employeesof which
men
average number of employees
of which men
parenT company
Sweden 55 72% 41 73%
Total in the parent company 55 72% 41 73%
subsidiaries
malta 5 65% 1 0%
Costa rica 0 0% 1 100%
Total in subsidiaries 5 65 % 2 50%
group total 60 72 % 43 72 %
NoTE 7 audiTors’ fees
Gunnar Liljedahl from ernst & Young aB was elected auditor by the 2004 annual General meeting for a period of four years. ernst & Young are auditors for Net entertainment Ne aB and the Swedish subsidiaries. Gunnar Liljedahl has been Net entertainment’s auditor since 2000. in addition to the auditing assignment, Net entertainment has also used ernst & Young for consultation on taxation, Vat and accounting mat-ters and analyses.
group parenT company
2007 2006 2007 2006
audiTing assignmenTs
ernst & Young 254 160 254 160
Other accounting firms 94 49 – –
oTher assignmenTs Than The audiTing assignmenT
ernst & Young 74 – 74 –
Total 422 209 328 160
notes
sicKness absence
parenT company
2007 2006
total sickness absence - employees’ total standard working hours 2.5% 2.0%
Share of sickness absence pertaining to absence exceeding 60 consecutive days; proportion of long-term absence 25.4% 0.0%
– Sickness absence, women 4.0% 2.6%
– Sickness absence, men 1.9% 1.8%
– Sickness absence, employees under 30* 2.2% 2.4%
– Sickness absence, employees 30–49* 2.6% 1.9%
– Sickness absence, employees over 49* 0.0% 0.0%
* as a percentage of the Group’s total normal working hours.
wages, salaries and remuneraTion
group parenT company
2007 2006 2007 2006
wages, salaries and remuneraTion
Pontus Lindwall, Chairman of the Board 225 0 225 0
John, Wattin, Board member 112 0 112 0
ann-Catrine appelquist, Board member 112 0 112 0
einar Gunnar Gudmundsson, Board member 112 0 112 0
rolf Blom, Board member 112 0 112 0
Johan Öhman, CeO 1,707 198 1,707 198
Other senior executives2,139
(4) 5881,608
(2) 439
Other employees 22,356 16,930 21,179 16,930
Total 27,055 17,761 25,167 17,567
– bonus to Johan Öhman 400 0 400 0
Social security contributions 11,984 7,260 11,399 7,260
pension expenses
Board members 0 0 0 0
Johan Öhman, CeO 600 60 600 60
Other senior executives 243 (3) 0 218 (2) 0
Other employees 1,932 1,469 1,180 1,409
Total 2,775 1,529 2,775 1,469
the current President of Net entertainment, Johan Öhman, took office on November 1, 2006. Only costs incurred from this date are reported above as salary, remuneration and pension costs for the President. the Board of Directors of Net entertainment previously comprised company officers who did not receive director fees. Board issues were addressed by the Board of Directors of the former Parent Company Betsson aB.
remuneraTion To senior execuTivesremuneration to the CeO comprises basic salary, variable compensa-tion, other benefits and pension. Variable compensation for the CeO may amount to a maximum of 10 monthly salaries. Pension benefits may amount to a maximum of 33 percent of the basic salary plus a single payment. in the event of termination of employment by Net en-tertainment, the CeO is entitled to a period of notice of six months and termination pay corresponding to 12 months’ salary. in the event of termination initiated by the CeO, the period of notice is 6 months.
Variable compensation for other senior executives varies depending on the individual’s position and contract. the maximum compensation may be 85 to 100 percent of the basic salary. the period of notice varies between 3 and 6 months.

50 Net eNtertaiNmeNt | 2007
NoTE 9 income Tax
group parenT company
2007 2006 2007 2006
currenT Tax
Sweden 1,458 10,885 1,458 10,885
Outside Sweden 2,108 – – –
Total current tax 3,566 10,885 1,458 10,885
deferred Tax
Sweden 476 – –
Outside Sweden 1,327 – – –
Total deferred tax 1,327 476 – –
Total tax expense 4,893 11,361 1,458 10,885
NoTE 10 earnings per share
the number of shares in the Parent Company was changed in 2006 in order to ensure that Net entertainment had the same number of shares as Betsson aB. this was necessary to facilitate the distribution of Net enter-tainment to the shareholders. No shareholders’ equity was contributed to the Company to achieve this. instead a combination of a bonus issue and split was implemented. accordingly, a more accurate way of calculating earnings per share would be to use the number of shares at the end of 2006 for all years, as follows:
group parenT company
2007 2006 2007 2006
Profit after tax attributable to Parent Company shareholders (SeK 000) 45,911 28,482 33,010 28,135
No. of shares at end of 2007 39,553 39,553 39,553 39,553
earnings per share (SeK) 1.16 0.72 0.83 0.72
there are no potential shares, which is why no dilution effect occurs. earnings per share is calculated on the average number of shares.
notes
group parenT company
2007 2006 2007 2006
difference beTween acTual Taxexpense and Tax expense based on presenT Tax raTe
recognised profit before tax 50,804 39,843 34,468 38,812
tax according to present tax rate (28%) 14,225 11,156 9,651 10,867
tax attributable to prior years – – – –
Difference in tax in foreign operations –1,139 187 – –
tax effect of non-deductible items 88 18 88 18
tax effect of non-taxable items –8,281 – –8,281 –
recognised tax expense 4,893 11,361 1,458 10,885
specificaTion of deferred Tax expense
tax on appropriations 0 476 – –
Taxes in The balance sheeT
provision for taxes
– Deferred tax on untaxed reserves 2,195 835 – –
current receivables
– tax receivables 12,953 – – –
current liabilities
– tax liabilities 21,875 5,172 6,763 5,172
there are temporary differences between the fiscal and carrying amounts. For appropriations, see note 19.
number and percenTage of women in execuTive posiTions
2007 2006
no. of men
no. of women
women, %
no. of men
no. of women
women, %
parenT company
Board of Directors 4 1 25% 1 0 0 %
Other senior executives 2 1 50% 3 2 33 %
Total parent company 6 2 33% 4 2 29 %
subsidiaries
Board of Directors 1 1 100% 2 0 0 %
Other senior executives 1 0 0% 1 2 33 %
Total group 8 3 38% 7 2 29 %
level of employee educaTion
120 credit points 19%
>120 university credit points 54%
Upper secondary education 6%
< 120 university credit points 21%

Net eNtertaiNmeNt | 2007 51
notes
NoTE 11 inTangible asseTs
groupgaming products, systems
and platformsgaming contracts
and licenses Trademarks Total
2006
Opening acquisition value 12,994 1,615 147 14,756
Capitalized development expenses for the year 14,560 – – 14,560
Closing accumulated acquisition value 27,554 1,615 147 29,316
Opening amortization 5,672 853 4 6,529
amortization during the year 2,670 538 49 3,257
Closing accumulated amortization 8,342 1,391 53 9,786
closing residual value according to plan dec 31, 2006 19,212 224 94 19,530
2007
Opening acquisition value 27,554 1,615 147 29,316
Capitalized development expenses for the year 10,098 – – 10,098
translation difference 363 – – 363
Closing accumulated acquisition value 38,015 1,615 147 39,777
Opening amortization 8,342 1,391 53 9,786
amortization during the year 5,424 224 49 5,697
translation difference 48 – – 48
Closing accumulated amortization 13,816 1,615 102 15,531
closing residual value according to plan dec 31, 2007 24,199 0 45 24,244
parenT companygaming products, systems
and platformsgaming contracts
and licenses Trademarks Total
2006
Opening acquisition value 12,994 1,615 147 14,756
Capitalized development expenses for the year 6,819 – – 6,819
Closing accumulated acquisition value 19,813 1,615 147 21,575
Opening amortization 5,672 853 4 6,529
amortization during the year 2,538 538 49 3,125
Closing accumulated amortization 8,210 1,391 53 9,654
closing residual value according to plan dec 31, 2006 11,603 224 94 11,921
2007
Opening acquisition value 19,813 1,615 147 21,575
Capitalized development expenses for the year 4,620 – – 4,620
Closing accumulated acquisition value 24,433 1,615 147 26,195
Opening amortization 8,210 1,391 53 9,564
amortization during the year 3,611 224 49 3,884
Closing accumulated amortization 11,821 1,615 102 13,538
closing residual value according to plan dec 31, 2007 12,612 0 45 12,657

52 Net eNtertaiNmeNt | 2007
group parenT company
2007 2006 2007 2006
equipmenT and fiTTings
Opening acquisition value 8,178 4,026 8,178 4,026
acquisitions for the year 3,003 4,461 2,759 4,461
Sales and disposals –309 –2,820 –309
closing accumulated acquisition value 11,181 8,178 8,117 8,178
Opening amortization 3,456 2,555 3,456 2,555
Sales and disposals –296 –249 – 297 –249
amortization during the year 2,141 1,150 1,323 1,150
translation differences 20 –
closing accumulated amortization 5,321 3,456 4,482 3,456
closing residual value according to plan 5,860 4,722 3,635 4,722
NoTE 12 Tangible fixed asseTs
NoTE 13 parTicipaTing inTeresTs in group companies
parenT company corp. reg. no. reg. hq share % no. of sharescarrying amount
2007carrying amount
2006
company
mobile entertainment me aB 556185-1758 Stockholm 100 % 1,000 89 89
– Net entertainment malta Holding Ltd malta 0.01 % 1 0 –
– Net entertainment malta Ltd malta 0.01 % 1 0 –
Feliz europa S.a. Costa rica 0.00 % 0 0 34
Net entertainment malta Holdings Ltd malta 99.99 % 9,999 127 19
– Net entertainment malta Ltd malta 99.99 % 9,999 – –
Total 216 142
parenT company
2007 2006
changes in participations in group companiesOpening acquisition value 142 119
external divestment of companies –34 –22
Voluntary liquidation of companies –8
external acquisition of companies 34
increase in share capital 108 –
Divestment of companies to subsidiaries – –
acquisition of companies from Betsson Group 19
closing carrying amount 216 142
notes

Net eNtertaiNmeNt | 2007 53
notes
NoTE 15 prepaid expenses and accrued income
group parenT company
2007 2006 2007 2006
accrued license/royalty income 13,429 7,117 0 3,756
Other prepaid expenses 2,445 772 2,024 772
Total 15,874 7,889 2,024 4,528
NoTE 16 long-Term receivables and oTher receivables
group parenT company
2007 2006 2007 2006
oTher long-Term receivables classified as fixed asseTs
Deferred tax receivables 13 – – –
Long-term portion of deposits 5 42 5 42
Total 18 42 5 42
oTher receivables classified as currenT asseTs
Vat 1,604 1,151 1,604 1,151
receivables, Betsson Group 0 4,779 0 4,779
Other 481 5 479 5
Total 2,085 5,935 2,083 5,935
groupother capital contributedthis pertains to shareholders’ equity contributed by the owners. in ad-dition to the share capital, the shareholders of Net entertainment have contributed shareholders’ contributions and Group contributions in order to cover the Company’s losses during the development phase.
reservesTranslation reservethe translation reserve comprises all exchange-rate differences that arise from the translation of financial statements from foreign opera-tions that have prepared their financial statements in a currency other than the currency in which the consolidated financial statements are presented. at year end, the accumulated translation differences were SeK 801 (–232) thousand.
specificaTion reserves Translation difference
Opening balance Jan 1, 2006 –
translation differences for the year –232
Closing balance Dec 31, 2006 –232
translation differences for the year 1,033
Closing balance Dec 31, 2007 801
reTained earnings incl. profiT for The yearretained earnings including profit for the year comprise earnings in the Parent Company and its subsidiaries, as well as the portion of un-taxed reserves attributable to shareholders’ equity. Previous provisions to statutory reserves are also included in this equity item.
NoTE 18 shareholders’ equiTy
2007 2006
share capital distribution (seK 000) no. of shares share capital no. of shares share capital
Shares, series a (10 votes) 5,610 000 168 5,610 000 168
Shares, series B (1 vote) 33,943 716 1,023 33,943 720 1019
Total number of shares 39,553 716 1,191 39,553 720 1,187
NoTE 14 accounTs receivable
group parenT company
2007 2006 2007 2006
accounts receivable
Customer losses in the income statement 572 1,151 196 1,033
age analysis accounts receivable
Not due 10,807 5,163 4 2,762
30-60 days 203 28 – 28
Older than 30 days 136 195 – 175
Total 11,143 5,386 4 2,965
the carrying amounts for accounts receivable comply with the fair values and corresponds to nominal amounts. No receivables have been placed as security for liabilities or contingent liabilities.
On December 31, 2007, accounts receivable due totaled 339 (223) with no indication of impairment identified. this applies to a number of independent customers that have not previously had payment difficul-ties. acknowledged bad debts during the period and an age analysis of consolidated accounts receivable are presented below.
NoTE 17 cash and cash equivalenTs
group parenT company
2007 2006 2007 2006
Cash and bank balances 25,915* 13,053 12,462 6,127
Total cash and cash equivalents 25,915 13,053 12,462 6,127
*Of which SeK 5,438,000 refers to funds held on behalf of licensees on December 31, 2007
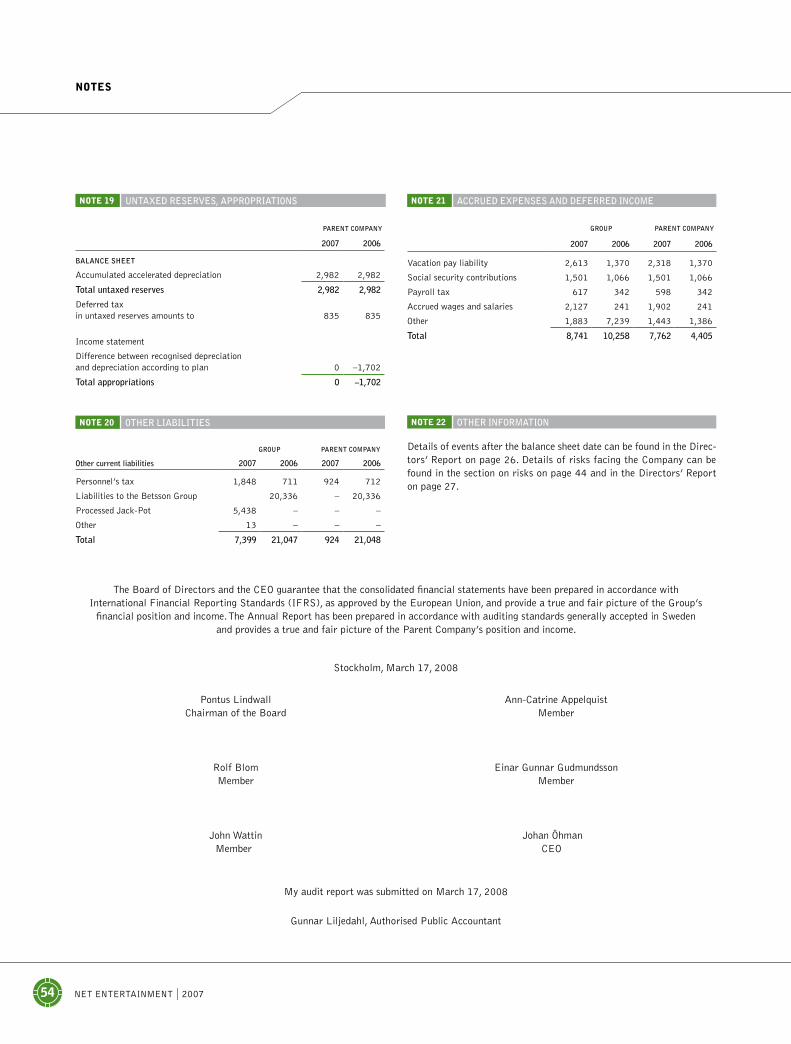
54 Net eNtertaiNmeNt | 2007
NoTE 19 unTaxed reserves, appropriaTions
parenT company
2007 2006
balance sheeT
accumulated accelerated depreciation 2,982 2,982
Total untaxed reserves 2,982 2,982
Deferred tax in untaxed reserves amounts to 835 835
income statement
Difference between recognised depreciation and depreciation according to plan 0 –1,702
Total appropriations 0 –1,702
NoTE 20 oTher liabiliTies
group parenT company
other current liabilities 2007 2006 2007 2006
Personnel’s tax 1,848 711 924 712
Liabilities to the Betsson Group 20,336 – 20,336
Processed Jack-Pot 5,438 – – –
Other 13 – – –
Total 7,399 21,047 924 21,048
Stockholm, march 17, 2008
Pontus Lindwall Chairman of the Board
ann-Catrine appelquistmember
rolf Blom member
einar Gunnar Gudmundssonmember
John Wattin Johan Öhman member CeO
my audit report was submitted on march 17, 2008
Gunnar Liljedahl, authorised Public accountant
NoTE 21 accrued expenses and deferred income
group parenT company
2007 2006 2007 2006
Vacation pay liability 2,613 1,370 2,318 1,370
Social security contributions 1,501 1,066 1,501 1,066
Payroll tax 617 342 598 342
accrued wages and salaries 2,127 241 1,902 241
Other 1,883 7,239 1,443 1,386
Total 8,741 10,258 7,762 4,405
NoTE 22 oTher informaTion
Details of events after the balance sheet date can be found in the Direc-tors’ report on page 26. Details of risks facing the Company can be found in the section on risks on page 44 and in the Directors’ report on page 27.
notes
the Board of Directors and the CeO guarantee that the consolidated financial statements have been prepared in accordance with international Financial reporting Standards (iFrS), as approved by the european Union, and provide a true and fair picture of the Group’s
financial position and income. the annual report has been prepared in accordance with auditing standards generally accepted in Sweden and provides a true and fair picture of the Parent Company’s position and income.

Net eNtertaiNmeNt | 2007 55
to the annual General meeting of net entertainment ne aBcorp. reg. no. 556532-6443
i have examined the annual report, the consolidated financial state-ments and the accounting records, and have reviewed the administra-tion of the Board of Directors and the CeO of Net entertainment Ne aB for 2007. the Company’s annual report and consolidated financial statements are included on pages 26-52 of the printed version of this document. responsibility for the accounting documents and the admin-istration of the Company rests with the Board of Directors and the CeO, as well as for ensuring that the Swedish annual accounts act is applied when preparing the annual report and that international Financial reporting Standards (iFrS), as approved by the european Union, are applied when preparing the consolidated financial statements. my responsibility is to express an opinion on the annual report, the con-solidated financial statements and the administration of the Company based on my audit.
i conducted my audit in accordance with generally accepted account-ing principles in Sweden which meant that i planned and performed the audit to obtain reasonable, but not absolute, assurance that the annual report and consolidated financial statements are free of mate-rial misstatement. an audit includes the examination of a selection of the documentation with respect to amounts and other information in the accounting records. an audit also involves assessing the accounting principles used and their application by the Board of Directors and the Chief executive Officer, and evaluating the most critical estimates made
by the Board and Chief executive Officer in preparing the annual report and the consolidated financial statements, and the overall presentation of information in the annual report and the consolidated financial state-ments. as a basis for my opinion concerning discharge from liability, i have examined significant decisions, actions taken and circumstances of the Company in order to be able to determine the liability, if any, to the Company of any Board member or the CeO. i have also examined whether any Board member or the Chief executive Officer has, in any other way, acted in contravention of the Swedish Companies act (aktie-bolagslagen), the Swedish annual accounts act (Årsredovisningslagen) or the articles of association. i believe that my audit provides a reason-able basis for my (our) opinion as set out below.
the annual report has been prepared in accordance with the Swedish annual accounts act and, consequently, provides a true picture of the Company’s income and position in accordance with generally accepted accounting principles in Sweden. the consolidated financial statements have been prepared in accordance with the international Financial re-porting Standards (iFrS), as approved by the european Union, and the Swedish annual accounts act, and provide a true picture of the Group’s income and position. the Directors’ report is consistent with the other sections of the annual report and the consolidated financial statements. i recommend that the annual General meeting adopt the income statements and balance sheets of the Parent Company and the Group, that the earnings in the Parent Company be disposed of as proposed in the Board of Directors’ report and that the members of the Board and the Chief executive Officer be discharged from liability for the financial year.
auDIt report
Stockholm, march 17, 2008
Gunnar Liljedahl
authorised Public accountant
audit report

56 Net eNtertaiNmeNt | 2007
Board oF directors
ponTus lindwall (born 1965) has been a Board member in Net entertainment since 1996. Pontus Lindwall holds no Series a shares and 934,594 Series B shares in Net entertainment Ne aB.
John waTTin (born 1947) has been a Board member in Net entertain-ment since 2007. John Wattin holds no Series a shares and 105,500 Series B shares in Net entertainment Ne aB.
rolf blom (born 1957) has been a Board member in Net entertain-ment since 2007. Via e-Capital, rolf Blom holds no Series a shares and 210,000 Series B shares in Net entertainment Ne aB.
ann-caTrine appelquisT (born 1947) has been a Board member in Net entertainment Ne aB since 2007. ann-Catrine appelquist holds no shares in Betsson aB (publ).
einar gunnar gudmundsson (born 1972) has been a Board mem-ber in Net entertainment since 2007. einar Gunnar Gudmundsson holds no shares in Net entertainment Ne aB (publ). Via ScandCap aB, einar Gunnar Gudmundson represents the major shareholder, Straumur- Burdaras investment Bank.
BoarD of DIrectors
Net entertainment’s Board consists currently of five members, includ-ing the Chairman. Board members are elected annually at the annual General meeting for the period up until the end of the next annual General meeting. the Board of Directors has its registered office in Stockholm. the current Board members are presented below. Board members may be reached at the Parent Company’s address (on the next page).
No Board members or senior executives named in this section have been convicted in fraud-related court cases, been the subject of accu-sations or sanction by empowering agencies, or prohibited by a court of law to be a member of a share issuing party’s administration, man-agement or control body or from having a leading position or overrid-ing function with a share-issuing party during the past five years.
in the event that the particular person in his/her capacity as a member of administration, management or control body, or in any other manner has been a key person in a senior executive position, or has been involved in a bankruptcy, liquidation or bankruptcy adminis-tration during the past five years, it is noted below.
there are no familial relationships between the persons noted in the section below nor any conflicts of interest between them. all persons may be reached via the head office. the Company is not obliged to comply with the Code of Corporate Governance and does not intend to comply in full with the Code of Corporate Governance.
from left: ann-catrine appelquist, einar gunnar gudmundsson, rolf blom, pontus lindwall and John wattin.

aDDresses
heaDquarters anD Development
net entertainment ne ab Birger Jarlsgatan 57BS-113 56 Stockholm, Sweden telephone: +46 8 55 69 67 00
sales anD marketInG
net entertainment malta ltd.Suite aDolphin Court aembassy Wayta’ Xbiex mSD 11 maltatelephone: +356 21 311 621

net entertainment ne ab (publ) | corp. reg. no. 556532-6443 | birger Jarlsgatan 57 b | 113 56 stockholm, swedenwww.netent.com | [email protected]
Narva. Ph
oto
Alexander R
uas. PRIN
t Elanders 20
08