Nestlé (Malaysia) Berhad us/analyst... · Name of chairman MS/ESJ FINANCIAL ANALYSTS’ BRIEFING...
26
Name of chairman MS/ESJ FINANCIAL ANALYSTS’ BRIEFING Nov 5, 2012 Nestlé (Malaysia) Berhad Financial Analysts’ Briefing, November 5, 2012
Transcript of Nestlé (Malaysia) Berhad us/analyst... · Name of chairman MS/ESJ FINANCIAL ANALYSTS’ BRIEFING...
Name of chairman MS/ESJ FINANCIAL ANALYSTS’ BRIEFING Nov 5, 2012
Nestlé (Malaysia) Berhad Financial Analysts’ Briefing, November 5, 2012

Name of chairman MS/ESJ FINANCIAL ANALYSTS’ BRIEFING Nov 1st, 2012
Agenda
Introduction & overview Financials Questions & answers
Name of chairman MS/ESJ FINANCIAL ANALYSTS’ BRIEFING Nov 1st, 2012
This presentation contains forward looking statements which reflect Management’s current views and estimates. The forward looking statements involve certain risks and uncertainties that could cause actual results to differ materially from those contained in the forward looking statements. Potential risks and uncertainties include such factors as general economic conditions, foreign exchange fluctuations, competitive product and pricing pressures and regulatory developments.
Disclaimer
Name of chairman MS/ESJ FINANCIAL ANALYSTS’ BRIEFING Nov 1st, 2012
FINANCIALS

Name of chairman MS/ESJ FINANCIAL ANALYSTS’ BRIEFING Nov 1st, 2012
Financial
Operational
Strategic
Focus on 7 value drivers
VALUE DRIVERS
1. SALES GROWTH
2. PROFIT MARGIN
3. WORKING CAPITAL INTENSITY
4. FIXED CAPITAL INTENSITY
5. INCOME TAX RATE
6. COST OF CAPITAL
7. VALUE GROWTH DURATION
Name of chairman MS/ESJ FINANCIAL ANALYSTS’ BRIEFING Nov 1st, 2012
SALES GROWTH

Name of chairman MS/ESJ FINANCIAL ANALYSTS’ BRIEFING Nov 1st, 2012
Sales Evolution 9M 2012
Domestic Sales +11.2% Export Sales +2.7%
+8.9%

Name of chairman MS/ESJ FINANCIAL ANALYSTS’ BRIEFING Nov 1st, 2012
RM Mio.
Channel Sales
3,174 3,457
27.2%
72.8%
25.7%
74.3%
Name of chairman MS/ESJ FINANCIAL ANALYSTS’ BRIEFING Nov 1st, 2012
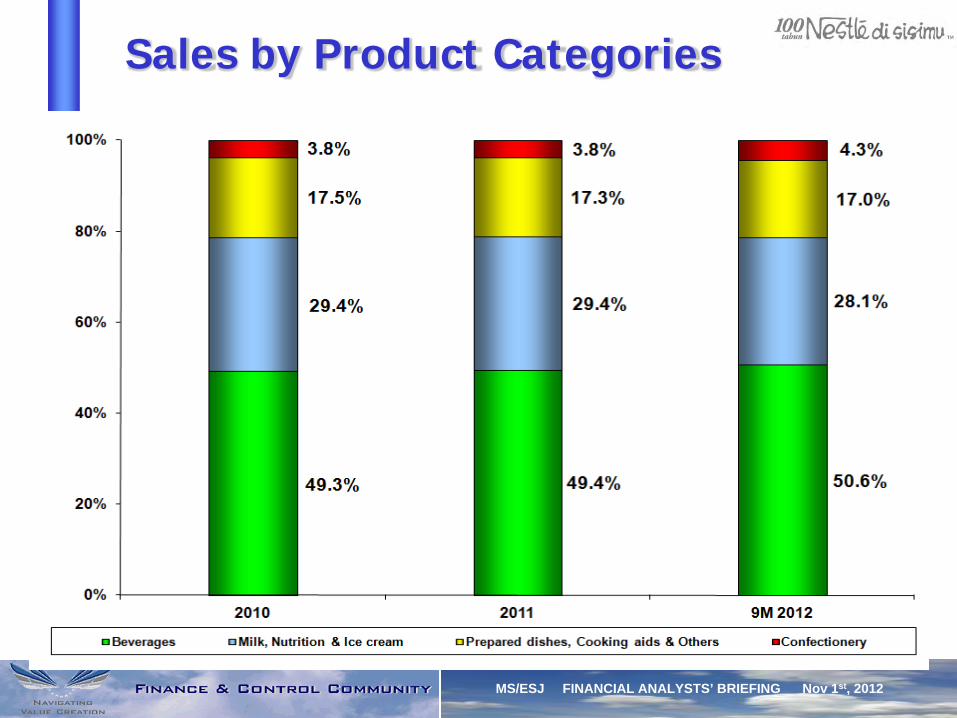
Sales by Product Categories

Name of chairman MS/ESJ FINANCIAL ANALYSTS’ BRIEFING Nov 1st, 2012
EBITDA MARGIN

Name of chairman MS/ESJ FINANCIAL ANALYSTS’ BRIEFING Nov 1st, 2012
Evolution of EBITDA
RM Mio.
Name of chairman MS/ESJ FINANCIAL ANALYSTS’ BRIEFING Nov 1st, 2012
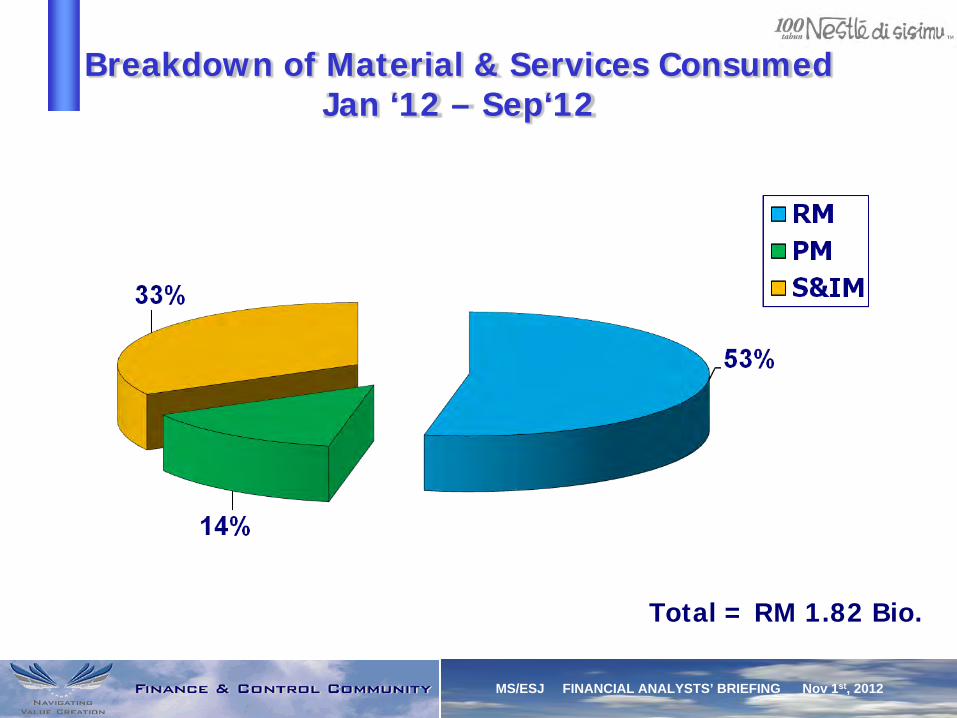
Breakdown of Material & Services Consumed Jan ‘12 – Sep‘12
Total = RM 1.82 Bio.

Name of chairman MS/ESJ FINANCIAL ANALYSTS’ BRIEFING Nov 1st, 2012
Cocoa Bean Price

Name of chairman MS/ESJ FINANCIAL ANALYSTS’ BRIEFING Nov 1st, 2012
Cocoa Powder Ratio

Name of chairman MS/ESJ FINANCIAL ANALYSTS’ BRIEFING Nov 1st, 2012
Coffee bean - Arabica

Name of chairman MS/ESJ FINANCIAL ANALYSTS’ BRIEFING Nov 1st, 2012
Coffee bean - Robusta

Name of chairman MS/ESJ FINANCIAL ANALYSTS’ BRIEFING Nov 1st, 2012
Milk Solids

Name of chairman MS/ESJ FINANCIAL ANALYSTS’ BRIEFING Nov 1st, 2012
Crude Palm Oil
Name of chairman MS/ESJ FINANCIAL ANALYSTS’ BRIEFING Nov 1st, 2012
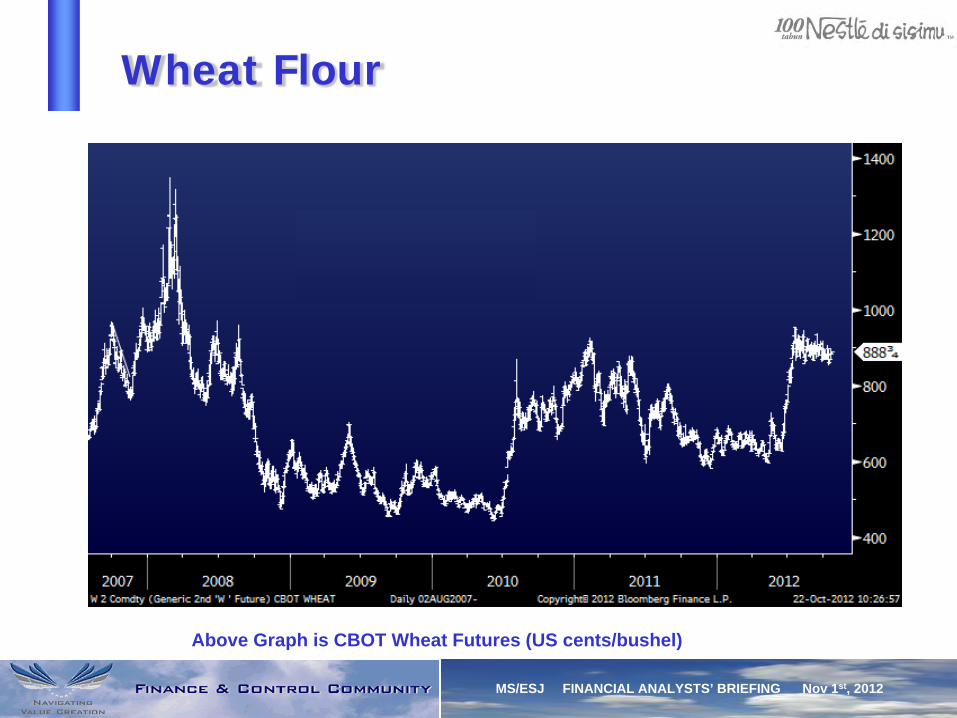
Above Graph is CBOT Wheat Futures (US cents/bushel)
Wheat Flour
Name of chairman MS/ESJ FINANCIAL ANALYSTS’ BRIEFING Nov 1st, 2012
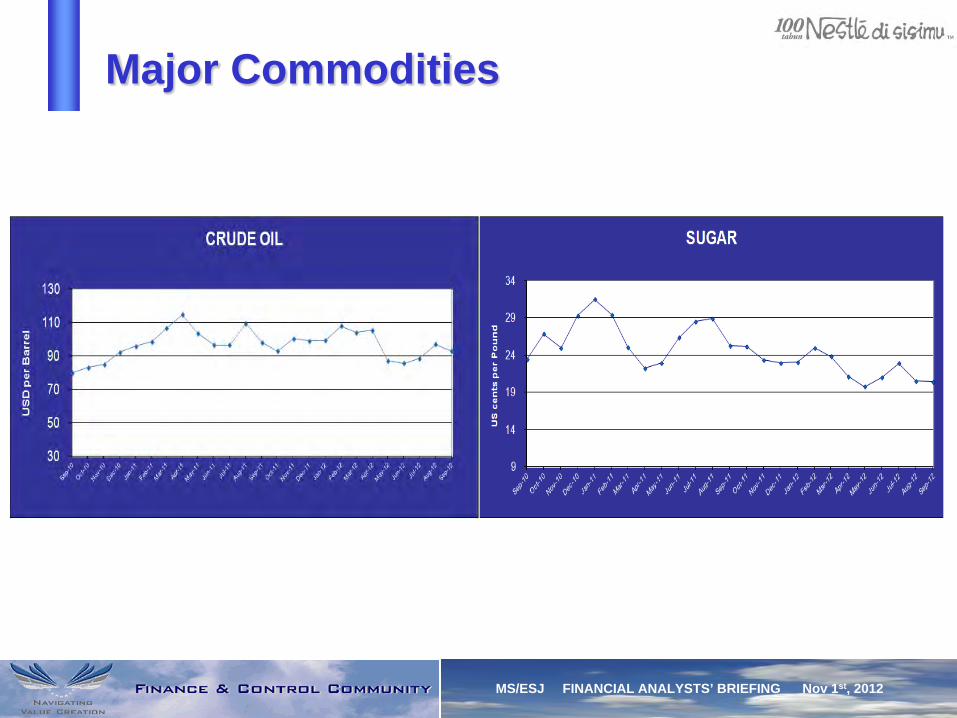
Major Commodities
Name of chairman MS/ESJ FINANCIAL ANALYSTS’ BRIEFING Nov 1st, 2012
NET PROFIT MARGIN

Name of chairman MS/ESJ FINANCIAL ANALYSTS’ BRIEFING Nov 1st, 2012
Evolution of Net Profit Margins
RM Mio.

Name of chairman MS/ESJ FINANCIAL ANALYSTS’ BRIEFING Nov 1st, 2012
Key Figures
Name of chairman MS/ESJ FINANCIAL ANALYSTS’ BRIEFING Nov 1st, 2012
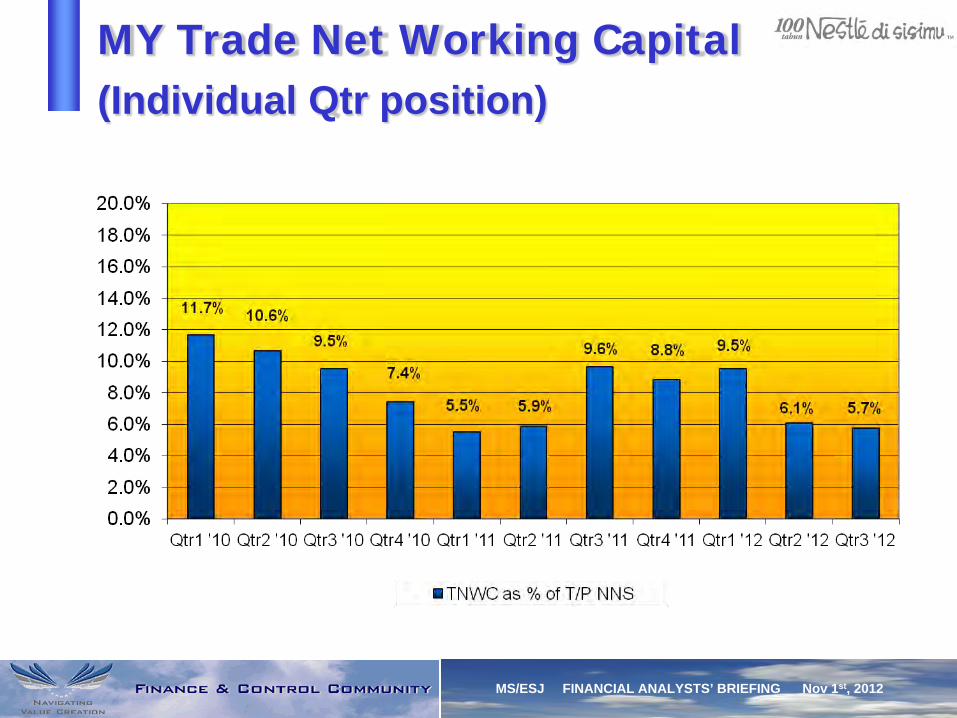
MY Trade Net Working Capital (Individual Qtr position)

Name of chairman MS/ESJ FINANCIAL ANALYSTS’ BRIEFING Nov 1st, 2012
MYR(Mio) Cash flow from operating activities 617 (Less)/Add
Decrease in working capital 22 Income tax & others (74) Capital investment (76) Total impact (128)
Free Cash Flow 9M 2012 489
Free Cash Flow 9M 2011 371
Free Cash Flow 9M 2012

Name of chairman MS/ESJ FINANCIAL ANALYSTS’ BRIEFING Nov 1st, 2012
QUESTIONS
Thank You