Nestle India (NEST IN) -...
12
August 13, 2019 1 Rating: HOLD | CMP: Rs11,951 | TP: Rs10,900 Valuations capture the positives Quick Pointers: 70% success rate in new launches, innovation pipeline remains strong Maggi reaches all time high volumes, market share at 59.6%, sub 60% Kitkat, Munch star performer, Beverges drag despite RTD traction Nestle’s growth story is based on 4 growth pillars of 1) harnessing its cluster based strategy to go deeper and increase sales in interiors 2) increasing innovation and renovation 3) leveraging e-commerce and 4) exploiting the OOH opportunity. Nestle has 70% success rate in new launches in past 3 years (3.7% of sales) and posted double digit volume growth in tough environment, however sustaining the same seems a daunting task as 1) Maggi, although reached all-time high sales, its market share at 59.6% is far lower than 75%+ in pre-crisis level and value added variants have limited success (hot heads withdrawn) 2) margin centric strategy in nutrition portfolio with no LUP’s 3) rising competition in instant coffee market in India and lack of scale in Milo and Nescafe RTD 4) peaked out margins at both gross ad EBIDTA level. Kitkat and Munch are leading the resurgence in chocolates, Nestle seems unlikely to enter MFD segment with MILO in a major way. Nestle currently has huge headwinds as the input cost index has increased by 500bps since 2Q18 with prices of milk increasing sharply and wheat as well as sugar being at high levels. Though benign Palm-oil does give little cushion, margins are likely to contract from current high levels. We estimate 9.6% PAT CAGR over CY19-20 mainly led by 11.6% sales growth and flattish EBITDA margins. We value the stock at 46xCY21 EPS and arrive at target price of Rs10900. We assign Hold rating on stock (Under Review earlier), expect back ended returns post sharp uptick in stock price. Nestle analyst meet takeaways: 1) Demand momentum has moderated from 15.2% growth in 3QCY18 to 10.5% in 2QCY19 with 1H growth led by volume and premiumisation. CSD channel disruption had a 220bps impact. 2) Have sustained leadership in 8 out of 9 categories. 3) Reduced innovations lead time to 6-9 months from 18-24 months resulting in 61 innovations since 2016. New launches have success rate of 70% and contributed 3.7% to 1H19 sales 4) Nestle shall explore out of home opportunity with next generation in urban and semi-urban as Target audience. 5) E-commerce grew by 56% contributing 1.5% of sales in 1H (0.6% in 2016). 6) Cluster-based strategy has enabled New thinking, better execution and higher efficiency 7) Nestle launched Organic cereals in 1Q under CEREGROW brand 8) Export declined due to no coffee sales to Turkey as the country entered a trade agreement 9) Maggi noodles surpasses pre-crises level in value as well volume terms 10) New innovations of Nescafe RTD and Nescafe Classic instant powder has done well 11) Distribution reach has increased to 4.6mn outlets. Nestle targets 5.5-6mn outlets 12) Nestle shall set-up another plant in Gujarat (growing market with better raw material sourcing and logistics) for Maggi noodles with 2 lines in the initial phase and then add another 2 lines going ahead. Capex would be Rs7bn over 2 years Nestle India (NEST IN) August 13, 2019 Analyst Meet Update ☑ Change in Estimates | ☑ Target | ☑ Reco Change in Estimates Current Previous CY19E CY20E CY19E CY20E Rating HOLD UNDER REVIEW Target Price 10,900 - Sales (Rs. m) 126,160 140,610 126,075 140,533 % Chng. 0.1 0.1 EBITDA (Rs. m) 29,842 33,864 30,678 34,132 % Chng. (2.7) (0.8) EPS (Rs.) 191.5 214.5 197.0 216.2 % Chng. (2.8) (0.8) Key Financials - Standalone Y/e Dec CY17 CY18 CY19E CY20E Sales (Rs. bn) 100 113 126 141 EBITDA (Rs. bn) 22 27 30 34 Margin (%) 22.2 24.2 23.7 24.1 PAT (Rs. bn) 14 17 18 21 EPS (Rs.) 140.0 178.6 191.5 214.5 Gr. (%) 13.2 27.5 7.3 12.0 DPS (Rs.) 86.0 113.0 274.0 177.0 Yield (%) 0.7 0.9 2.3 1.5 RoE (%) 40.3 48.5 63.3 99.9 RoCE (%) 55.5 66.9 89.3 143.8 EV/Sales (x) 11.2 9.9 9.0 8.1 EV/EBITDA (x) 50.6 40.9 37.9 33.4 PE (x) 85.4 66.9 62.4 55.7 P/BV (x) 33.7 31.4 53.4 58.1 Key Data NEST.BO | NEST IN 52-W High / Low Rs.12,268 / Rs.9,047 Sensex / Nifty 37,582 / 11,110 Market Cap Rs.1,152bn/ $ 16,285m Shares Outstanding 96m 3M Avg. Daily Value Rs.1406.29m Shareholding Pattern (%) Promoter’s 62.76 Foreign 12.95 Domestic Institution 7.49 Public & Others 16.80 Promoter Pledge (Rs bn) - Stock Performance (%) 1M 6M 12M Absolute 2.3 6.3 9.8 Relative 5.4 3.4 11.1 Amnish Aggarwal [email protected] | 91-22-66322233 Nishita Doshi [email protected] | 91-22-66322381
Transcript of Nestle India (NEST IN) -...

August 13, 2019 1
Rating: HOLD | CMP: Rs11,951 | TP: Rs10,900
Valuations capture the positives
Quick Pointers:
70% success rate in new launches, innovation pipeline remains strong
Maggi reaches all time high volumes, market share at 59.6%, sub 60%
Kitkat, Munch star performer, Beverges drag despite RTD traction
Nestle’s growth story is based on 4 growth pillars of 1) harnessing its cluster
based strategy to go deeper and increase sales in interiors 2) increasing
innovation and renovation 3) leveraging e-commerce and 4) exploiting the
OOH opportunity. Nestle has 70% success rate in new launches in past 3
years (3.7% of sales) and posted double digit volume growth in tough
environment, however sustaining the same seems a daunting task as 1)
Maggi, although reached all-time high sales, its market share at 59.6% is far
lower than 75%+ in pre-crisis level and value added variants have limited
success (hot heads withdrawn) 2) margin centric strategy in nutrition
portfolio with no LUP’s 3) rising competition in instant coffee market in India
and lack of scale in Milo and Nescafe RTD 4) peaked out margins at both
gross ad EBIDTA level. Kitkat and Munch are leading the resurgence in
chocolates, Nestle seems unlikely to enter MFD segment with MILO in a major
way.
Nestle currently has huge headwinds as the input cost index has increased
by 500bps since 2Q18 with prices of milk increasing sharply and wheat as
well as sugar being at high levels. Though benign Palm-oil does give little
cushion, margins are likely to contract from current high levels.
We estimate 9.6% PAT CAGR over CY19-20 mainly led by 11.6% sales growth
and flattish EBITDA margins. We value the stock at 46xCY21 EPS and arrive
at target price of Rs10900. We assign Hold rating on stock (Under Review
earlier), expect back ended returns post sharp uptick in stock price.
Nestle analyst meet takeaways: 1) Demand momentum has moderated from
15.2% growth in 3QCY18 to 10.5% in 2QCY19 with 1H growth led by volume and
premiumisation. CSD channel disruption had a 220bps impact. 2) Have sustained
leadership in 8 out of 9 categories. 3) Reduced innovations lead time to 6-9 months
from 18-24 months resulting in 61 innovations since 2016. New launches have
success rate of 70% and contributed 3.7% to 1H19 sales 4) Nestle shall explore out
of home opportunity with next generation in urban and semi-urban as Target
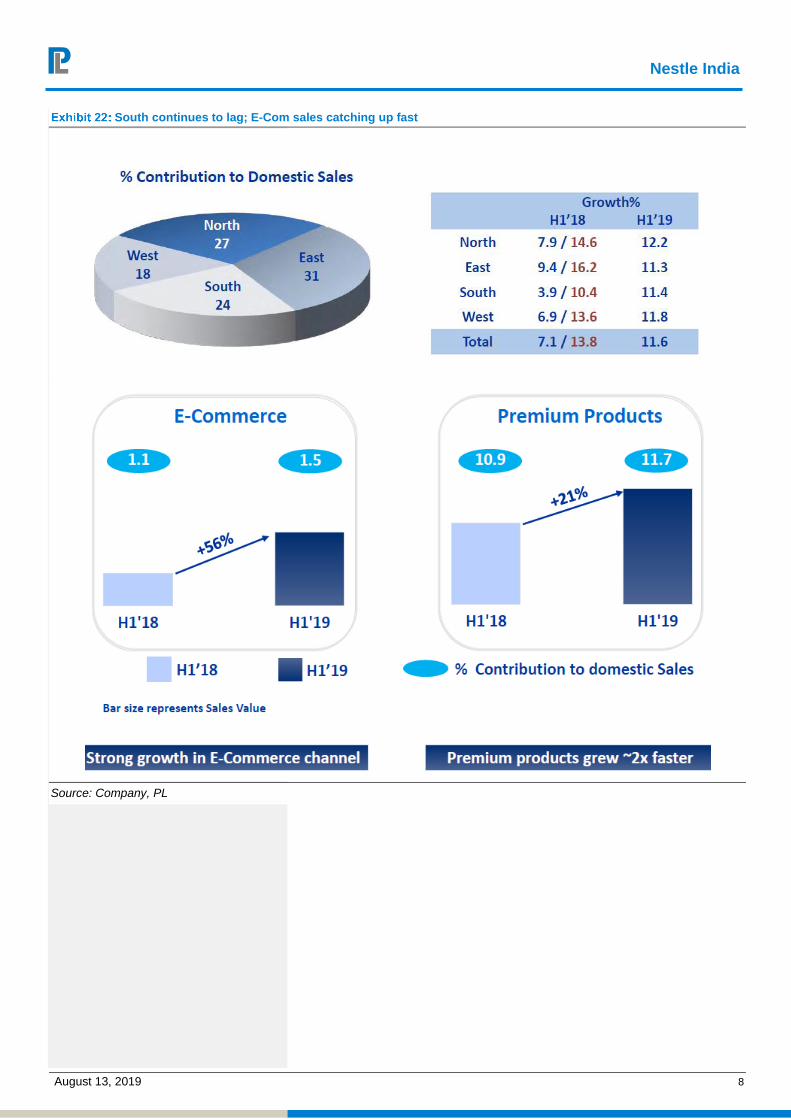
audience. 5) E-commerce grew by 56% contributing 1.5% of sales in 1H (0.6% in
2016). 6) Cluster-based strategy has enabled New thinking, better execution and
higher efficiency 7) Nestle launched Organic cereals in 1Q under CEREGROW
brand 8) Export declined due to no coffee sales to Turkey as the country entered a
trade agreement 9) Maggi noodles surpasses pre-crises level in value as well
volume terms 10) New innovations of Nescafe RTD and Nescafe Classic instant
powder has done well 11) Distribution reach has increased to 4.6mn outlets. Nestle
targets 5.5-6mn outlets 12) Nestle shall set-up another plant in Gujarat (growing
market with better raw material sourcing and logistics) for Maggi noodles with 2
lines in the initial phase and then add another 2 lines going ahead. Capex would be
Rs7bn over 2 years
Nestle India (NEST IN)
August 13, 2019
Analyst Meet Update
☑ Change in Estimates | ☑ Target | ☑ Reco
Change in Estimates
Current Previous
CY19E CY20E CY19E CY20E
Rating HOLD UNDER REVIEW
Target Price 10,900 -
Sales (Rs. m) 126,160 140,610 126,075 140,533
% Chng. 0.1 0.1
EBITDA (Rs. m) 29,842 33,864 30,678 34,132
% Chng. (2.7) (0.8)
EPS (Rs.) 191.5 214.5 197.0 216.2
% Chng. (2.8) (0.8)
Key Financials - Standalone
Y/e Dec CY17 CY18 CY19E CY20E
Sales (Rs. bn) 100 113 126 141
EBITDA (Rs. bn) 22 27 30 34
Margin (%) 22.2 24.2 23.7 24.1
PAT (Rs. bn) 14 17 18 21
EPS (Rs.) 140.0 178.6 191.5 214.5
Gr. (%) 13.2 27.5 7.3 12.0
DPS (Rs.) 86.0 113.0 274.0 177.0
Yield (%) 0.7 0.9 2.3 1.5
RoE (%) 40.3 48.5 63.3 99.9
RoCE (%) 55.5 66.9 89.3 143.8
EV/Sales (x) 11.2 9.9 9.0 8.1
EV/EBITDA (x) 50.6 40.9 37.9 33.4
PE (x) 85.4 66.9 62.4 55.7
P/BV (x) 33.7 31.4 53.4 58.1
Key Data NEST.BO | NEST IN
52-W High / Low Rs.12,268 / Rs.9,047
Sensex / Nifty 37,582 / 11,110
Market Cap Rs.1,152bn/ $ 16,285m
Shares Outstanding 96m
3M Avg. Daily Value Rs.1406.29m
Shareholding Pattern (%)
Promoter’s 62.76
Foreign 12.95
Domestic Institution 7.49
Public & Others 16.80
Promoter Pledge (Rs bn) -
Stock Performance (%)
1M 6M 12M
Absolute 2.3 6.3 9.8
Relative 5.4 3.4 11.1
Amnish Aggarwal
[email protected] | 91-22-66322233
Nishita Doshi
[email protected] | 91-22-66322381
Nestle India
August 13, 2019 2
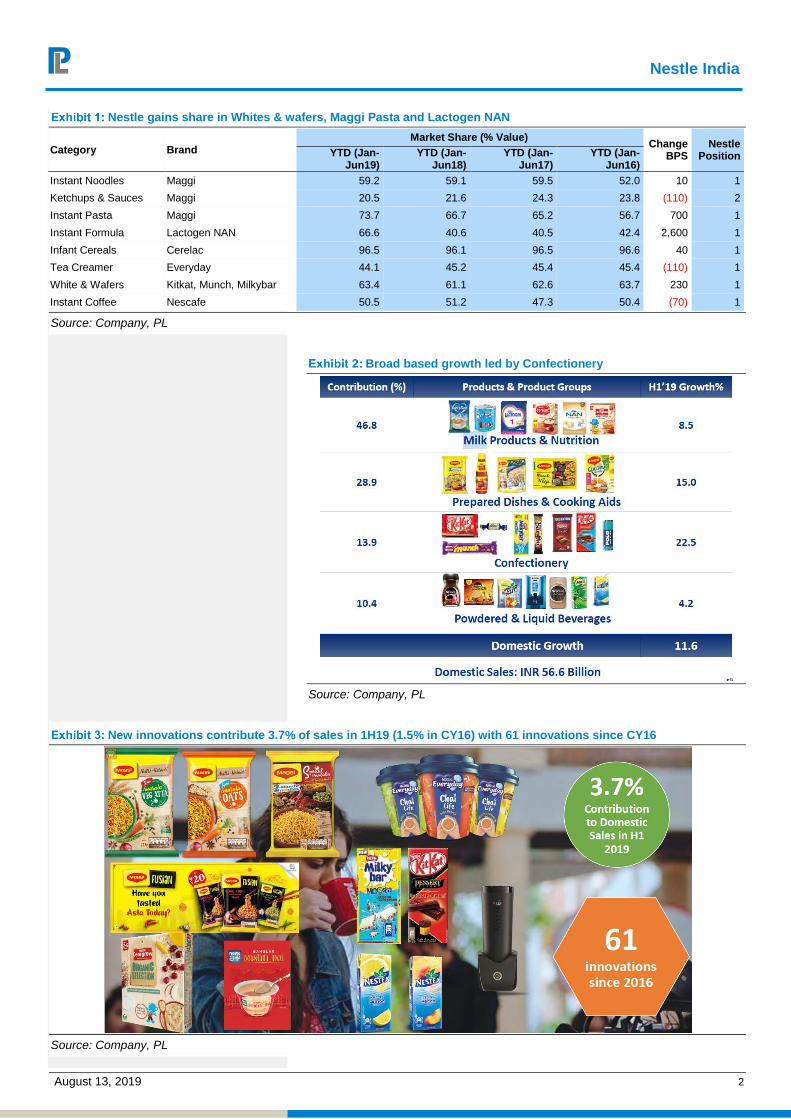
Nestle gains share in Whites & wafers, Maggi Pasta and Lactogen NAN
Category Brand
Market Share (% Value) Change
BPS Nestle
Position YTD (Jan-Jun19)
YTD (Jan-Jun18)
YTD (Jan-Jun17)
YTD (Jan-Jun16)
Instant Noodles Maggi 59.2 59.1 59.5 52.0 10 1
Ketchups & Sauces Maggi 20.5 21.6 24.3 23.8 (110) 2
Instant Pasta Maggi 73.7 66.7 65.2 56.7 700 1
Instant Formula Lactogen NAN 66.6 40.6 40.5 42.4 2,600 1
Infant Cereals Cerelac 96.5 96.1 96.5 96.6 40 1
Tea Creamer Everyday 44.1 45.2 45.4 45.4 (110) 1
White & Wafers Kitkat, Munch, Milkybar 63.4 61.1 62.6 63.7 230 1
Instant Coffee Nescafe 50.5 51.2 47.3 50.4 (70) 1
Source: Company, PL
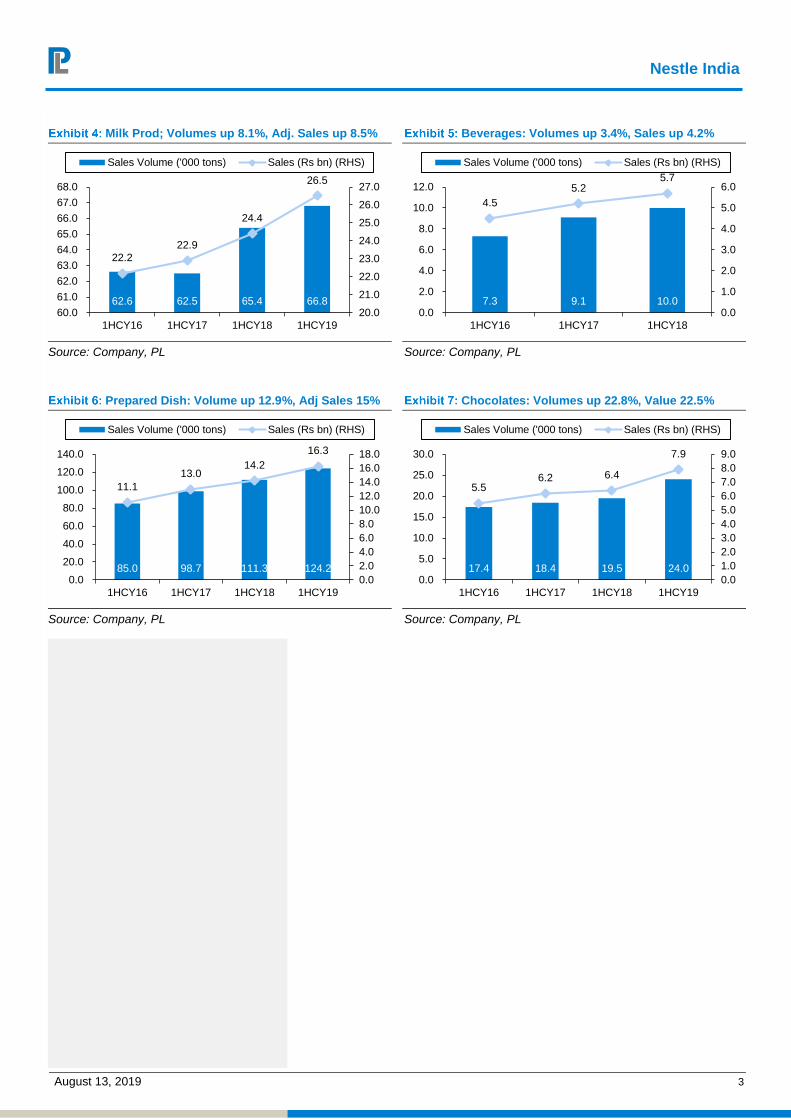
Broad based growth led by Confectionery
Source: Company, PL
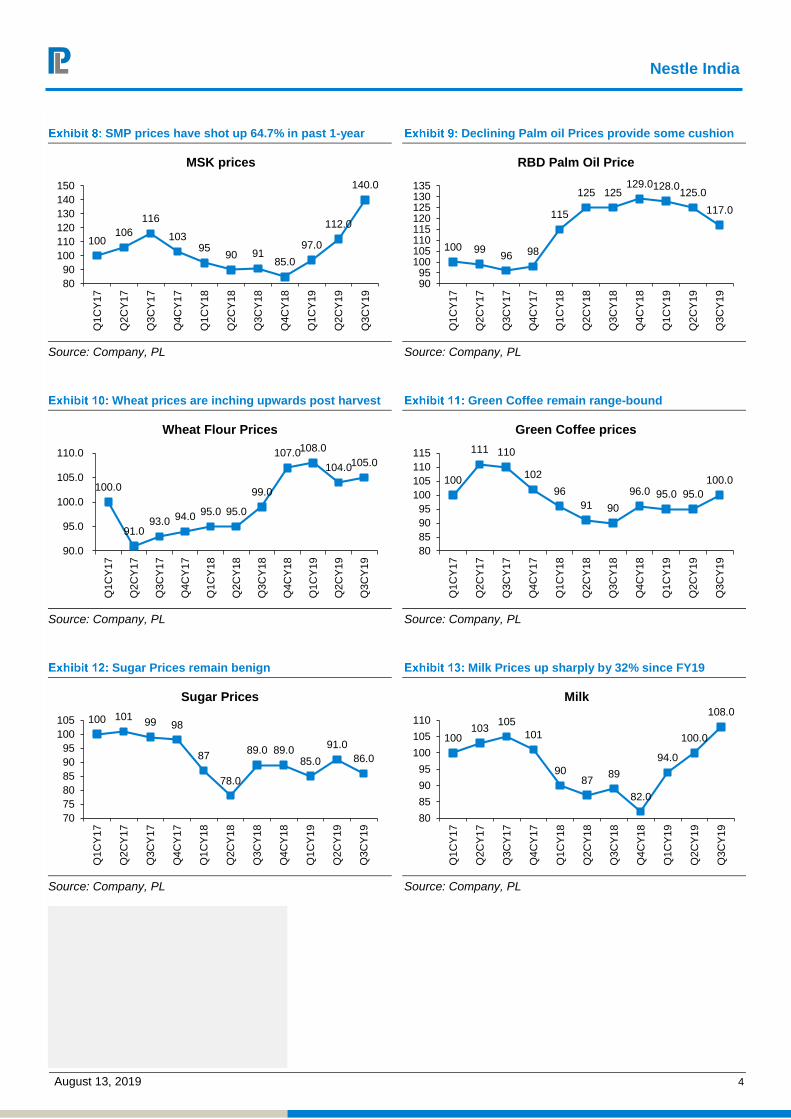
New innovations contribute 3.7% of sales in 1H19 (1.5% in CY16) with 61 innovations since CY16
Source: Company, PL
Nestle India
August 13, 2019 3
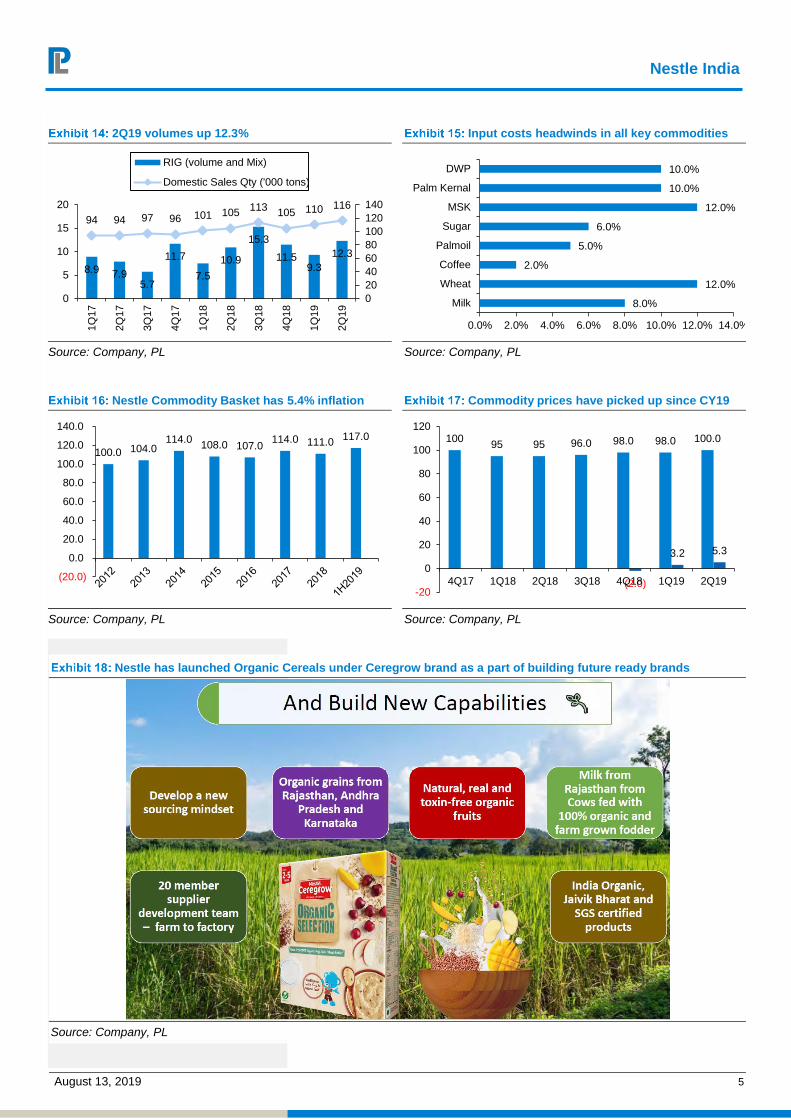
Milk Prod; Volumes up 8.1%, Adj. Sales up 8.5%
Source: Company, PL
Beverages: Volumes up 3.4%, Sales up 4.2%
Source: Company, PL
Prepared Dish: Volume up 12.9%, Adj Sales 15%
Source: Company, PL
Chocolates: Volumes up 22.8%, Value 22.5%
Source: Company, PL
62.6 62.5 65.4 66.8
22.2
22.9
24.4
26.5
20.0
21.0
22.0
23.0
24.0
25.0
26.0
27.0
60.0
61.0
62.0
63.0
64.0
65.0
66.0
67.0
68.0
1HCY16 1HCY17 1HCY18 1HCY19
Sales Volume ('000 tons) Sales (Rs bn) (RHS)
7.3 9.1 10.0
4.5
5.2 5.7
0.0
1.0
2.0
3.0
4.0
5.0
6.0
0.0
2.0
4.0
6.0
8.0
10.0
12.0
1HCY16 1HCY17 1HCY18
Sales Volume ('000 tons) Sales (Rs bn) (RHS)
85.0 98.7 111.3 124.2
11.1
13.0 14.2
16.3
0.0
2.0
4.0
6.0
8.0
10.0
12.0
14.0
16.0
18.0
0.0
20.0
40.0
60.0
80.0
100.0
120.0
140.0
1HCY16 1HCY17 1HCY18 1HCY19
Sales Volume ('000 tons) Sales (Rs bn) (RHS)
17.4 18.4 19.5 24.0
5.5 6.2 6.4
7.9
0.0
1.0
2.0
3.0
4.0
5.0
6.0
7.0
8.0
9.0
0.0
5.0
10.0
15.0
20.0
25.0
30.0
1HCY16 1HCY17 1HCY18 1HCY19
Sales Volume ('000 tons) Sales (Rs bn) (RHS)
Nestle India
August 13, 2019 4
SMP prices have shot up 64.7% in past 1-year
Source: Company, PL
Declining Palm oil Prices provide some cushion
Source: Company, PL
Wheat prices are inching upwards post harvest
Source: Company, PL
Green Coffee remain range-bound
Source: Company, PL
Sugar Prices remain benign
Source: Company, PL
Milk Prices up sharply by 32% since FY19
Source: Company, PL
100106
116
10395
90 9185.0
97.0
112.0
140.0
80
90
100
110
120
130
140
150
Q1C
Y17
Q2C
Y17
Q3C
Y17
Q4C
Y17
Q1C
Y18
Q2C
Y18
Q3C
Y18
Q4C
Y18
Q1C
Y19
Q2C
Y19
Q3C
Y19
MSK prices
100 9996 98
115
125 125129.0 128.0
125.0
117.0
9095
100105110115120125130135
Q1C
Y17
Q2C
Y17
Q3C
Y17
Q4C
Y17
Q1C
Y18
Q2C
Y18
Q3C
Y18
Q4C
Y18
Q1C
Y19
Q2C
Y19
Q3C
Y19
RBD Palm Oil Price
100.0
91.0 93.0 94.0 95.0 95.0
99.0
107.0 108.0
104.0 105.0
90.0
95.0
100.0
105.0
110.0
Q1C
Y17
Q2C
Y17
Q3C
Y17
Q4C
Y17
Q1C
Y18
Q2C
Y18
Q3C
Y18
Q4C
Y18
Q1C
Y19
Q2C
Y19
Q3C
Y19
Wheat Flour Prices
100
111 110
102
96
91 90
96.0 95.0 95.0
100.0
80
85
90
95
100
105
110
115Q
1C
Y17
Q2C
Y17
Q3C
Y17
Q4C
Y17
Q1C
Y18
Q2C
Y18
Q3C
Y18
Q4C
Y18
Q1C
Y19
Q2C
Y19
Q3C
Y19
Green Coffee prices
100 10199 98
87
78.0
89.0 89.0 85.0
91.0
86.0
70
75
80
85
90
95
100
105
Q1C
Y17
Q2C
Y17
Q3C
Y17
Q4C
Y17
Q1C
Y18
Q2C
Y18
Q3C
Y18
Q4C
Y18
Q1C
Y19
Q2C
Y19
Q3C
Y19
Sugar Prices
100103
105
101
9087
89
82.0
94.0
100.0
108.0
80
85
90
95
100
105
110
Q1C
Y17
Q2C
Y17
Q3C
Y17
Q4C
Y17
Q1C
Y18
Q2C
Y18
Q3C
Y18
Q4C
Y18
Q1C
Y19
Q2C
Y19
Q3C
Y19
Milk
Nestle India
August 13, 2019 5
2Q19 volumes up 12.3%
Source: Company, PL
Input costs headwinds in all key commodities
Source: Company, PL
Nestle Commodity Basket has 5.4% inflation
Source: Company, PL
Commodity prices have picked up since CY19
Source: Company, PL
Nestle has launched Organic Cereals under Ceregrow brand as a part of building future ready brands
Source: Company, PL
8.9 7.95.7
11.7
7.5
10.9
15.3
11.59.3
12.3
94 94 97 96 101 105113
105 110 116
0
20
40
60
80
100
120
140
0
5
10
15
20
1Q
17
2Q
17
3Q
17
4Q
17
1Q
18
2Q
18
3Q
18
4Q
18
1Q
19
2Q
19
RIG (volume and Mix)
Domestic Sales Qty ('000 tons)
8.0%
12.0%
2.0%
5.0%
6.0%
12.0%
10.0%
10.0%
0.0% 2.0% 4.0% 6.0% 8.0% 10.0% 12.0% 14.0%
Milk
Wheat
Coffee
Palmoil
Sugar
MSK
Palm Kernal
DWP
100.0 104.0 114.0
108.0 107.0 114.0 111.0
117.0
(20.0)
0.0
20.0
40.0
60.0
80.0
100.0
120.0
140.0100
95 95 96.0 98.0 98.0 100.0
(2.0)
3.2 5.3
-20
0
20
40
60
80
100
120
4Q17 1Q18 2Q18 3Q18 4Q18 1Q19 2Q19
Nestle India
August 13, 2019 6
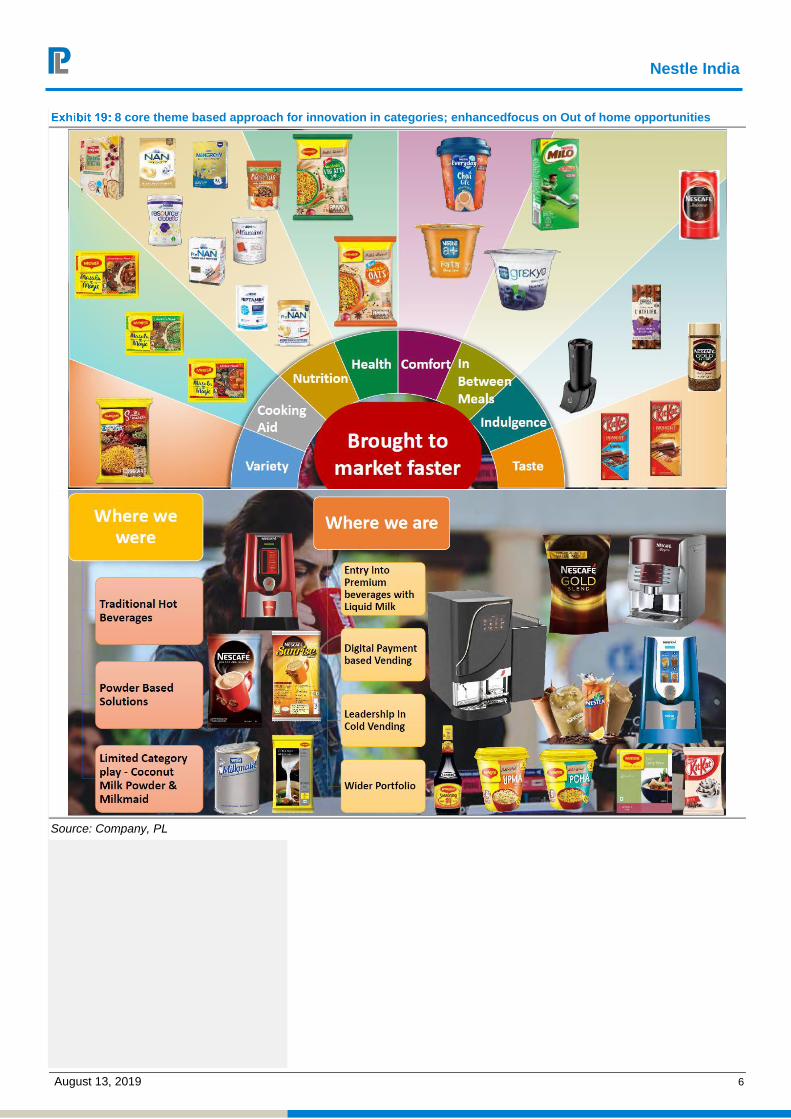
8 core theme based approach for innovation in categories; enhancedfocus on Out of home opportunities
Source: Company, PL
Nestle India
August 13, 2019 7
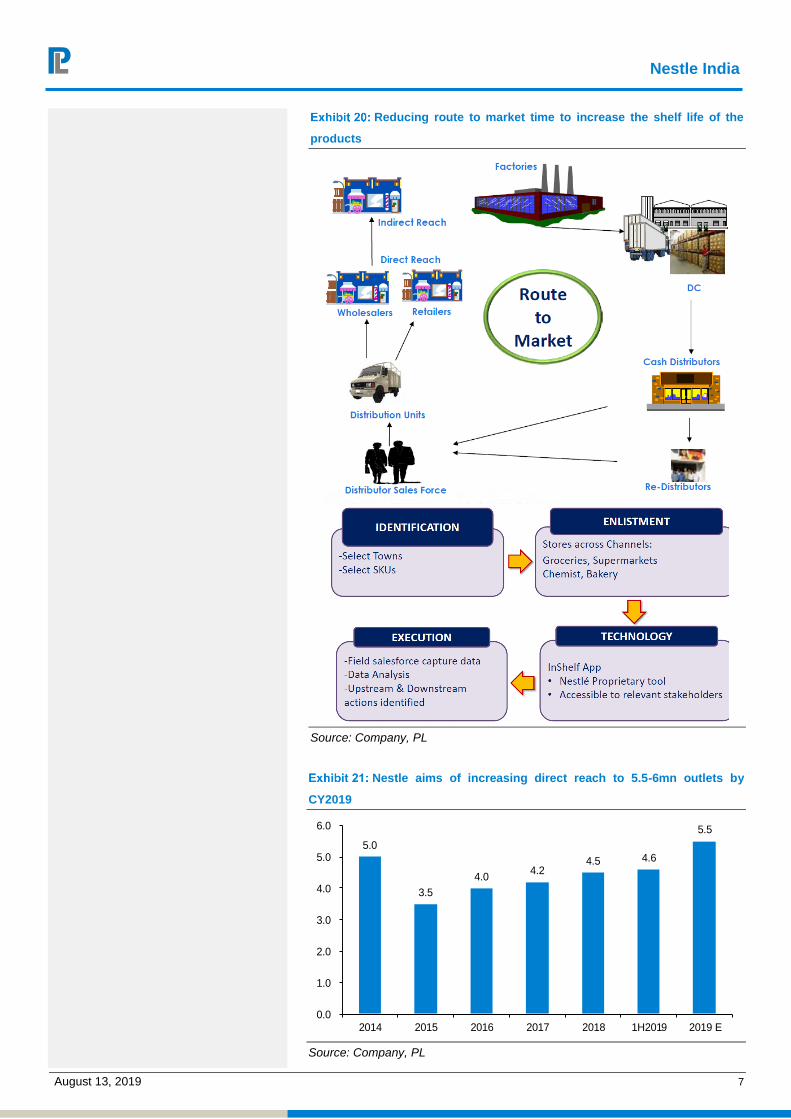
Reducing route to market time to increase the shelf life of the
products
Source: Company, PL
Nestle aims of increasing direct reach to 5.5-6mn outlets by
CY2019
5.0
3.5
4.0 4.2
4.5 4.6
5.5
0.0
1.0
2.0
3.0
4.0
5.0
6.0
2014 2015 2016 2017 2018 1H2019 2019 E
Source: Company, PL
Nestle India
August 13, 2019 8
South continues to lag; E-Com sales catching up fast
Source: Company, PL
Nestle India
August 13, 2019 9
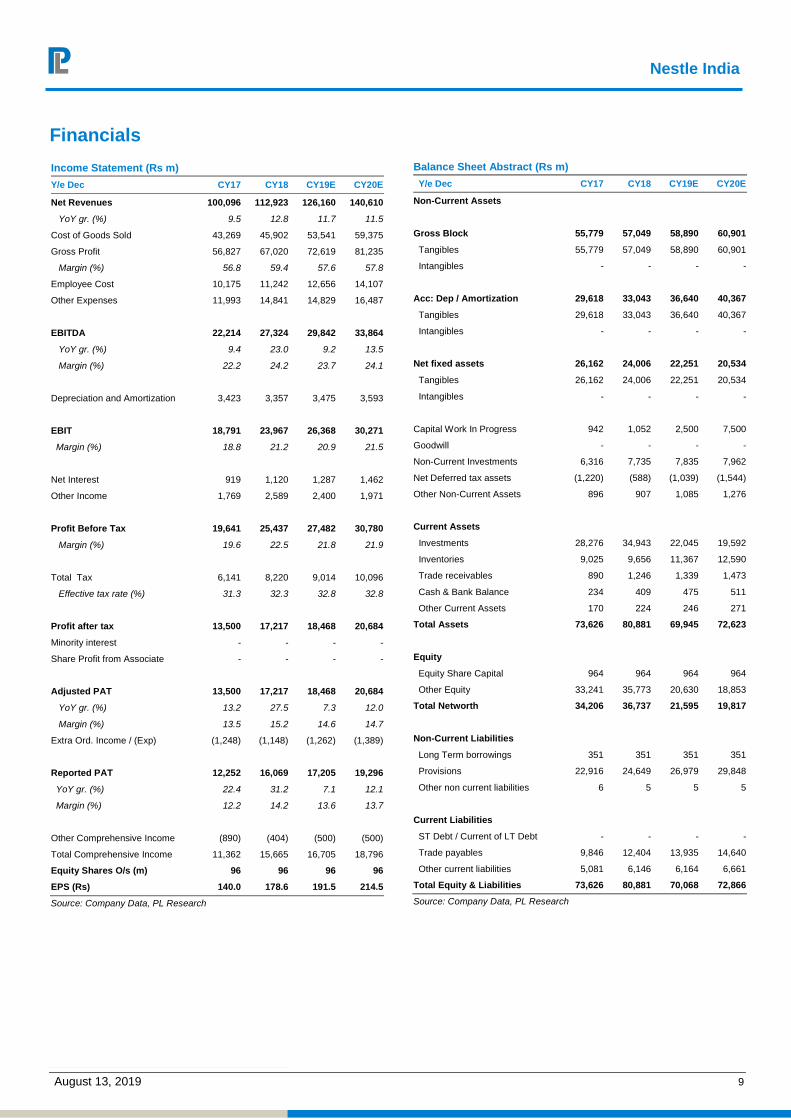
Financials
Income Statement (Rs m)
Y/e Dec CY17 CY18 CY19E CY20E
Net Revenues 100,096 112,923 126,160 140,610
YoY gr. (%) 9.5 12.8 11.7 11.5
Cost of Goods Sold 43,269 45,902 53,541 59,375
Gross Profit 56,827 67,020 72,619 81,235
Margin (%) 56.8 59.4 57.6 57.8
Employee Cost 10,175 11,242 12,656 14,107
Other Expenses 11,993 14,841 14,829 16,487
EBITDA 22,214 27,324 29,842 33,864
YoY gr. (%) 9.4 23.0 9.2 13.5
Margin (%) 22.2 24.2 23.7 24.1
Depreciation and Amortization 3,423 3,357 3,475 3,593
EBIT 18,791 23,967 26,368 30,271
Margin (%) 18.8 21.2 20.9 21.5
Net Interest 919 1,120 1,287 1,462
Other Income 1,769 2,589 2,400 1,971
Profit Before Tax 19,641 25,437 27,482 30,780
Margin (%) 19.6 22.5 21.8 21.9
Total Tax 6,141 8,220 9,014 10,096
Effective tax rate (%) 31.3 32.3 32.8 32.8
Profit after tax 13,500 17,217 18,468 20,684
Minority interest - - - -
Share Profit from Associate - - - -
Adjusted PAT 13,500 17,217 18,468 20,684
YoY gr. (%) 13.2 27.5 7.3 12.0
Margin (%) 13.5 15.2 14.6 14.7
Extra Ord. Income / (Exp) (1,248) (1,148) (1,262) (1,389)
Reported PAT 12,252 16,069 17,205 19,296
YoY gr. (%) 22.4 31.2 7.1 12.1
Margin (%) 12.2 14.2 13.6 13.7
Other Comprehensive Income (890) (404) (500) (500)
Total Comprehensive Income 11,362 15,665 16,705 18,796
Equity Shares O/s (m) 96 96 96 96
EPS (Rs) 140.0 178.6 191.5 214.5
Source: Company Data, PL Research
Balance Sheet Abstract (Rs m)
Y/e Dec CY17 CY18 CY19E CY20E
Non-Current Assets
Gross Block 55,779 57,049 58,890 60,901
Tangibles 55,779 57,049 58,890 60,901
Intangibles - - - -
Acc: Dep / Amortization 29,618 33,043 36,640 40,367
Tangibles 29,618 33,043 36,640 40,367
Intangibles - - - -
Net fixed assets 26,162 24,006 22,251 20,534
Tangibles 26,162 24,006 22,251 20,534
Intangibles - - - -
Capital Work In Progress 942 1,052 2,500 7,500
Goodwill - - - -
Non-Current Investments 6,316 7,735 7,835 7,962
Net Deferred tax assets (1,220) (588) (1,039) (1,544)
Other Non-Current Assets 896 907 1,085 1,276
Current Assets
Investments 28,276 34,943 22,045 19,592
Inventories 9,025 9,656 11,367 12,590
Trade receivables 890 1,246 1,339 1,473
Cash & Bank Balance 234 409 475 511
Other Current Assets 170 224 246 271
Total Assets 73,626 80,881 69,945 72,623
Equity
Equity Share Capital 964 964 964 964
Other Equity 33,241 35,773 20,630 18,853
Total Networth 34,206 36,737 21,595 19,817
Non-Current Liabilities
Long Term borrowings 351 351 351 351
Provisions 22,916 24,649 26,979 29,848
Other non current liabilities 6 5 5 5
Current Liabilities
ST Debt / Current of LT Debt - - - -
Trade payables 9,846 12,404 13,935 14,640
Other current liabilities 5,081 6,146 6,164 6,661
Total Equity & Liabilities 73,626 80,881 70,068 72,866
Source: Company Data, PL Research
Nestle India
August 13, 2019 10
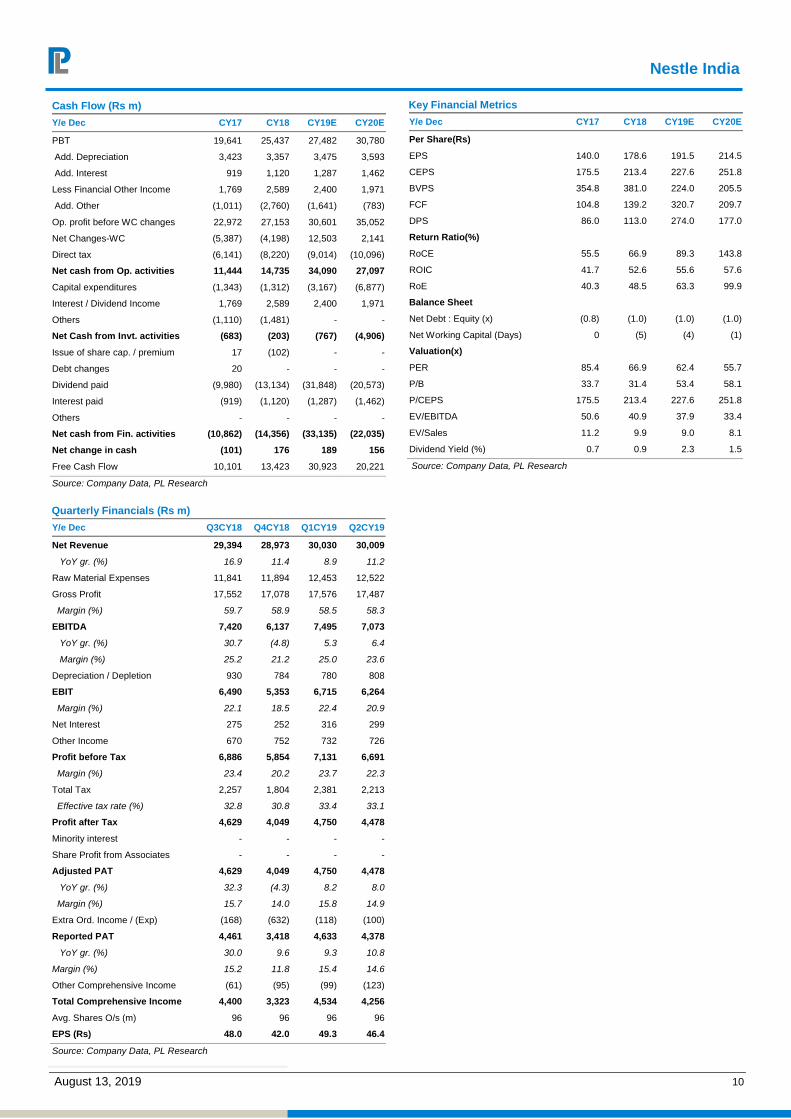
Cash Flow (Rs m)
Y/e Dec CY17 CY18 CY19E CY20E Year
PBT 19,641 25,437 27,482 30,780
Add. Depreciation 3,423 3,357 3,475 3,593
Add. Interest 919 1,120 1,287 1,462
Less Financial Other Income 1,769 2,589 2,400 1,971
Add. Other (1,011) (2,760) (1,641) (783)
Op. profit before WC changes 22,972 27,153 30,601 35,052
Net Changes-WC (5,387) (4,198) 12,503 2,141
Direct tax (6,141) (8,220) (9,014) (10,096)
Net cash from Op. activities 11,444 14,735 34,090 27,097
Capital expenditures (1,343) (1,312) (3,167) (6,877)
Interest / Dividend Income 1,769 2,589 2,400 1,971
Others (1,110) (1,481) - -
Net Cash from Invt. activities (683) (203) (767) (4,906)
Issue of share cap. / premium 17 (102) - -
Debt changes 20 - - -
Dividend paid (9,980) (13,134) (31,848) (20,573)
Interest paid (919) (1,120) (1,287) (1,462)
Others - - - -
Net cash from Fin. activities (10,862) (14,356) (33,135) (22,035)
Net change in cash (101) 176 189 156
Free Cash Flow 10,101 13,423 30,923 20,221
Source: Company Data, PL Research
Quarterly Financials (Rs m)
Y/e Dec Q3CY18 Q4CY18 Q1CY19 Q2CY19
Net Revenue 29,394 28,973 30,030 30,009
YoY gr. (%) 16.9 11.4 8.9 11.2
Raw Material Expenses 11,841 11,894 12,453 12,522
Gross Profit 17,552 17,078 17,576 17,487
Margin (%) 59.7 58.9 58.5 58.3
EBITDA 7,420 6,137 7,495 7,073
YoY gr. (%) 30.7 (4.8) 5.3 6.4
Margin (%) 25.2 21.2 25.0 23.6
Depreciation / Depletion 930 784 780 808
EBIT 6,490 5,353 6,715 6,264
Margin (%) 22.1 18.5 22.4 20.9
Net Interest 275 252 316 299
Other Income 670 752 732 726
Profit before Tax 6,886 5,854 7,131 6,691
Margin (%) 23.4 20.2 23.7 22.3
Total Tax 2,257 1,804 2,381 2,213
Effective tax rate (%) 32.8 30.8 33.4 33.1
Profit after Tax 4,629 4,049 4,750 4,478
Minority interest - - - -
Share Profit from Associates - - - -
Adjusted PAT 4,629 4,049 4,750 4,478
YoY gr. (%) 32.3 (4.3) 8.2 8.0
Margin (%) 15.7 14.0 15.8 14.9
Extra Ord. Income / (Exp) (168) (632) (118) (100)
Reported PAT 4,461 3,418 4,633 4,378
YoY gr. (%) 30.0 9.6 9.3 10.8
Margin (%) 15.2 11.8 15.4 14.6
Other Comprehensive Income (61) (95) (99) (123)
Total Comprehensive Income 4,400 3,323 4,534 4,256
Avg. Shares O/s (m) 96 96 96 96
EPS (Rs) 48.0 42.0 49.3 46.4
Source: Company Data, PL Research
Key Financial Metrics
Y/e Dec CY17 CY18 CY19E CY20E
Per Share(Rs)
EPS 140.0 178.6 191.5 214.5
CEPS 175.5 213.4 227.6 251.8
BVPS 354.8 381.0 224.0 205.5
FCF 104.8 139.2 320.7 209.7
DPS 86.0 113.0 274.0 177.0
Return Ratio(%)
RoCE 55.5 66.9 89.3 143.8
ROIC 41.7 52.6 55.6 57.6
RoE 40.3 48.5 63.3 99.9
Balance Sheet
Net Debt : Equity (x) (0.8) (1.0) (1.0) (1.0)
Net Working Capital (Days) 0 (5) (4) (1)
Valuation(x)
PER 85.4 66.9 62.4 55.7
P/B 33.7 31.4 53.4 58.1
P/CEPS 175.5 213.4 227.6 251.8
EV/EBITDA 50.6 40.9 37.9 33.4
EV/Sales 11.2 9.9 9.0 8.1
Dividend Yield (%) 0.7 0.9 2.3 1.5
Source: Company Data, PL Research
Nestle India
August 13, 2019 11
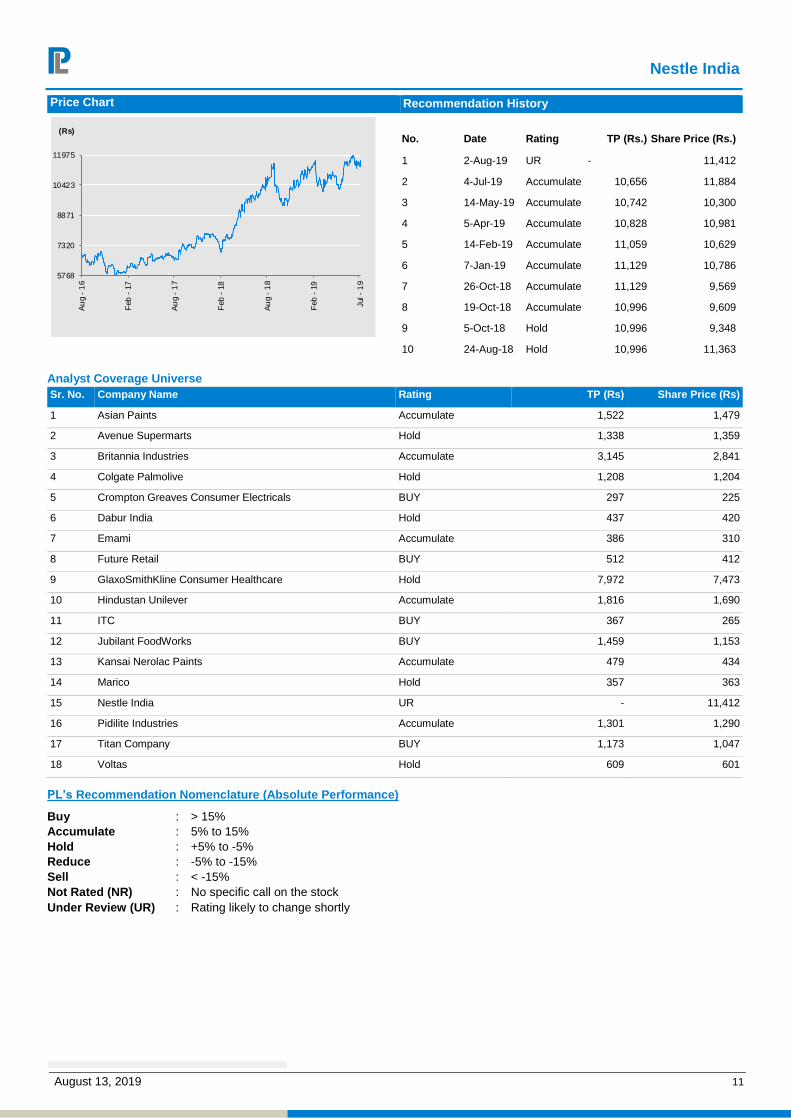
Price Chart Recommendation History
No. Date Rating TP (Rs.) Share Price (Rs.)
1 2-Aug-19 UR - 11,412
2 4-Jul-19 Accumulate 10,656 11,884
3 14-May-19 Accumulate 10,742 10,300
4 5-Apr-19 Accumulate 10,828 10,981
5 14-Feb-19 Accumulate 11,059 10,629
6 7-Jan-19 Accumulate 11,129 10,786
7 26-Oct-18 Accumulate 11,129 9,569
8 19-Oct-18 Accumulate 10,996 9,609
9 5-Oct-18 Hold 10,996 9,348
10 24-Aug-18 Hold 10,996 11,363
Analyst Coverage Universe
Sr. No. Company Name Rating TP (Rs) Share Price (Rs)
1 Asian Paints Accumulate 1,522 1,479
2 Avenue Supermarts Hold 1,338 1,359
3 Britannia Industries Accumulate 3,145 2,841
4 Colgate Palmolive Hold 1,208 1,204
5 Crompton Greaves Consumer Electricals BUY 297 225
6 Dabur India Hold 437 420
7 Emami Accumulate 386 310
8 Future Retail BUY 512 412
9 GlaxoSmithKline Consumer Healthcare Hold 7,972 7,473
10 Hindustan Unilever Accumulate 1,816 1,690
11 ITC BUY 367 265
12 Jubilant FoodWorks BUY 1,459 1,153
13 Kansai Nerolac Paints Accumulate 479 434
14 Marico Hold 357 363
15 Nestle India UR - 11,412
16 Pidilite Industries Accumulate 1,301 1,290
17 Titan Company BUY 1,173 1,047
18 Voltas Hold 609 601
PL’s Recommendation Nomenclature (Absolute Performance)
Buy : > 15%
Accumulate : 5% to 15%
Hold : +5% to -5%
Reduce : -5% to -15%
Sell : < -15%
Not Rated (NR) : No specific call on the stock
Under Review (UR) : Rating likely to change shortly
5768
7320
8871
10423
11975
Au
g -
16
Feb
- 1
7
Au
g -
17
Feb
- 1
8
Au
g -
18
Feb
- 1
9
Jul -
19
(Rs)
Nestle India
August 13, 2019 12
ANALYST CERTIFICATION
(Indian Clients)
We/I, Mr. Amnish Aggarwal- MBA, CFA, Ms. Nishita Doshi- CA, B.Com Research Analysts, authors and the names subscribed to this report, hereby certify that all of the views expressed in this research report accurately reflect our views about the subject issuer(s) or securities. We also certify that no part of our compensation was, is, or will be directly or indirectly related to the specific recommendation(s) or view(s) in this report.
(US Clients)
The research analysts, with respect to each issuer and its securities covered by them in this research report, certify that: All of the views expressed in this research report accurately reflect his or her or their personal views about all of the issuers and their securities; and No part of his or her or their compensation was, is or will be directly related to the specific recommendation or views expressed in this research report.
DISCLAIMER
Indian Clients
Prabhudas Lilladher Pvt. Ltd, Mumbai, India (hereinafter referred to as “PL”) is engaged in the business of Stock Broking, Portfolio Manager, Depository Participant and distribution for third party financial products. PL is a subsidiary of Prabhudas Lilladher Advisory Services Pvt Ltd. which has its various subsidiaries engaged in business of commodity broking, investment banking, financial services (margin funding) and distribution of third party financial/other products, details in respect of which are available at www.plindia.com.
This document has been prepared by the Research Division of PL and is meant for use by the recipient only as information and is not for circulation. This document is not to be reported or copied or made available to others without prior permission of PL. It should not be considered or taken as an offer to sell or a solicitation to buy or sell any security.
The information contained in this report has been obtained from sources that are considered to be reliable. However, PL has not independently verified the accuracy or completeness of the same. Neither PL nor any of its affiliates, its directors or its employees accepts any responsibility of whatsoever nature for the information, statements and opinion given, made available or expressed herein or for any omission therein.
Recipients of this report should be aware that past performance is not necessarily a guide to future performance and value of investments can go down as well. The suitability or otherwise of any investments will depend upon the recipient's particular circumstances and, in case of doubt, advice should be sought from an independent expert/advisor.
Either PL or its affiliates or its directors or its employees or its representatives or its clients or their relatives may have position(s), make market, act as principal or engage in transactions of securities of companies referred to in this report and they may have used the research material prior to publication.
PL may from time to time solicit or perform investment banking or other services for any company mentioned in this document.
PL is in the process of applying for certificate of registration as Research Analyst under Securities and Exchange Board of India (Research Analysts) Regulations, 2014
PL submits that no material disciplinary action has been taken on us by any Regulatory Authority impacting Equity Research Analysis activities.
PL or its research analysts or its associates or his relatives do not have any financial interest in the subject company.
PL or its research analysts or its associates or his relatives do not have actual/beneficial ownership of one per cent or more securities of the subject company at the end of the month immediately preceding the date of publication of the research report.
PL or its research analysts or its associates or his relatives do not have any material conflict of interest at the time of publication of the research report.
PL or its associates might have received compensation from the subject company in the past twelve months.
PL or its associates might have managed or co-managed public offering of securities for the subject company in the past twelve months or mandated by the subject company for any other assignment in the past twelve months.
PL or its associates might have received any compensation for investment banking or merchant banking or brokerage services from the subject company in the past twelve months.
PL or its associates might have received any compensation for products or services other than investment banking or merchant banking or brokerage services from the subject company in the past twelve months
PL or its associates might have received any compensation or other benefits from the subject company or third party in connection with the research report.
PL encourages independence in research report preparation and strives to minimize conflict in preparation of research report. PL or its analysts did not receive any compensation or other benefits from the subject Company or third party in connection with the preparation of the research report. PL or its Research Analysts do not have any material conflict of interest at the time of publication of this report.
It is confirmed that Mr. Amnish Aggarwal- MBA, CFA, Ms. Nishita Doshi- CA, B.Com Research Analysts of this report have not received any compensation from the companies mentioned in the report in the preceding twelve months
Compensation of our Research Analysts is not based on any specific merchant banking, investment banking or brokerage service transactions.
The Research analysts for this report certifies that all of the views expressed in this report accurately reflect his or her personal views about the subject company or companies and its or their securities, and no part of his or her compensation was, is or will be, directly or indirectly related to specific recommendations or views expressed in this report.
The research analysts for this report has not served as an officer, director or employee of the subject company PL or its research analysts have not engaged in market making activity for the subject company
Our sales people, traders, and other professionals or affiliates may provide oral or written market commentary or trading strategies to our clients that reflect opinions that are contrary to the opinions expressed herein, and our proprietary trading and investing businesses may make investment decisions that are inconsistent with the recommendations expressed herein. In reviewing these materials, you should be aware that any or all o the foregoing, among other things, may give rise to real or potential conflicts of interest.
PL and its associates, their directors and employees may (a) from time to time, have a long or short position in, and buy or sell the securities of the subject company or (b) be engaged in any other transaction involving such securities and earn brokerage or other compensation or act as a market maker in the financial instruments of the subject company or act as an advisor or lender/borrower to the subject company or may have any other potential conflict of interests with respect to any recommendation and other related information and opinions.
US Clients
This research report is a product of Prabhudas Lilladher Pvt. Ltd., which is the employer of the research analyst(s) who has prepared the research report. The research analyst(s) preparing the research report is/are resident outside the United States (U.S.) and are not associated persons of any U.S. regulated broker-dealer and therefore the analyst(s) is/are not subject to supervision by a U.S. broker-dealer, and is/are not required to satisfy the regulatory licensing requirements of FINRA or required to otherwise comply with U.S. rules or regulations regarding, among other things, communications with a subject company, public appearances and trading securities held by a research analyst account.
This report is intended for distribution by Prabhudas Lilladher Pvt. Ltd. only to "Major Institutional Investors" as defined by Rule 15a-6(b)(4) of the U.S. Securities and Exchange Act, 1934 (the Exchange Act) and interpretations thereof by U.S. Securities and Exchange Commission (SEC) in reliance on Rule 15a 6(a)(2). If the recipient of this report is not a Major Institutional Investor as specified above, then it should not act upon this report and return the same to the sender. Further, this report may not be copied, duplicated and/or transmitted onward to any U.S. person, which is not the Major Institutional Investor.
In reliance on the exemption from registration provided by Rule 15a-6 of the Exchange Act and interpretations thereof by the SEC in order to conduct certain business with Major Institutional Investors, Prabhudas Lilladher Pvt. Ltd. has entered into an agreement with a U.S. registered broker-dealer, Marco Polo Securities Inc. ("Marco Polo").
Transactions in securities discussed in this research report should be effected through Marco Polo or another U.S. registered broker dealer.
Prabhudas Lilladher Pvt. Ltd. 3rd Floor, Sadhana House, 570, P. B. Marg, Worli, Mumbai-400 018, India | Tel: (91 22) 6632 2222 Fax: (91 22) 6632 2209
www.plindia.com | Bloomberg Research Page: PRLD <GO>